Market Minds Advisory
United Kingdom Payments and Settlements Market

United Kingdom Payments and Settlements Market: Paying For Instant, Fifteen Years On

Britain built instant account transfers in 2008 and spent the next fifteen years finding out what irrevocability costs. Mandatory scam reimbursement from October 2024 finally put a number on it.

Lead Analyst

Published

September 2026

Make Smarter Decisions with Customized Research Insights

Request a free sample report and evaluate market opportunities, growth trends, and competitive dynamics relevant to your business needs.

2025 MARKET VALUE$19.4BMarket Size 2025
2036 FORECAST VALUE$42.5BBase Case , 2026 to 2036
CAGR 2026 TO 20367.4 %Bull 8.6% / Bear 6.2%
INCREMENTAL OPPORTUNITY$21.7BNet 10- year value creation
EXPANSION MULTIPLE2.04x2036 value over 2026 base
Strategic Levers
M&A Pipeline
Regional Outlook
Country Rankings
Competitive Intelligence
Segmental Deep-dive
Call-Us : 91 93563 13602

Executive Snapshot and Market Trajectory

Speed created the liability. An account transfer that clears in seconds cannot be recalled, and mandatory scam reimbursement since October 2024 moved that consequence onto the firms moving the money rather than the people sending it. Nobody costed that trade when the rails were built.
Domestic and European counterparty flows carry 45% of value, above the usual regional band, because this is a single-country market and its settlement activity sits overwhelmingly within its own borders. Account-to-account and Faster Payments services grow at 11.1%, half again the market rate of 7.4%, as commercial variable recurring payments finally give bank rails a route into checkout. Revenue per transaction on that rail is a fraction of what a card transaction generates.
Concentration reaches 44% across acquirers, banks and processors, held up by scheme relationships and settlement access rather than by technology anybody owns. Card economics remain squeezed by interchange caps at 0.2% on domestic debit, while cross-border rates to European issuers were uncapped after departure from the single market and promptly raised. Merchants here now pay materially more to accept a card issued just forty miles across the Channel instead.
Market Definition
The market covers revenue earned by providers of payment and settlement services to United Kingdom merchants, corporates and financial institutions, spanning card acquiring and merchant services, account-to-account and Faster Payments services, high-value and wholesale settlement services, cross-border and foreign exchange payment services, fraud prevention and payment risk services, and payment infrastructure and processing services. Interchange paid to card issuers, consumer banking revenue, lending, securities clearing and custody, and cryptoasset trading are excluded.
Base Year Value
$19.4B in 2025 (MMA Primary Research Dataset, August 2026)
Forecast Period
2026 to 2036, eleven discrete annual values
CAGR
7.4% base case. Bull 8.6%. Bear 6.2%.
Fastest Growth Segment
Account-to-Account and Faster Payments Services: 11.1% CAGR
Fastest Growth Country
India: 9.4% CAGR
Fastest Growth Region
South Asia and Pacific: 9.6% CAGR
Largest Region
Western Europe: 45% of 2025 global value
Market Leaders
Worldpay, Barclays, Lloyds Banking Group, NatWest Group, Adyen. Source: MMA Analysis based on disclosed United Kingdom payments and merchant services revenue, company annual reports 2025.
Primary Survey
n=3,800 procurement and R&D decision-makers, Q4 2025, six countries
Methodology
Demand-side build-up, cross-validated against public data, 47 expert interviews

United Kingdom Payments and Settlements Market Forecast Scenarios

united-kingdom-payments-and-settlements-market-size-forecast-scenario-1787913467938
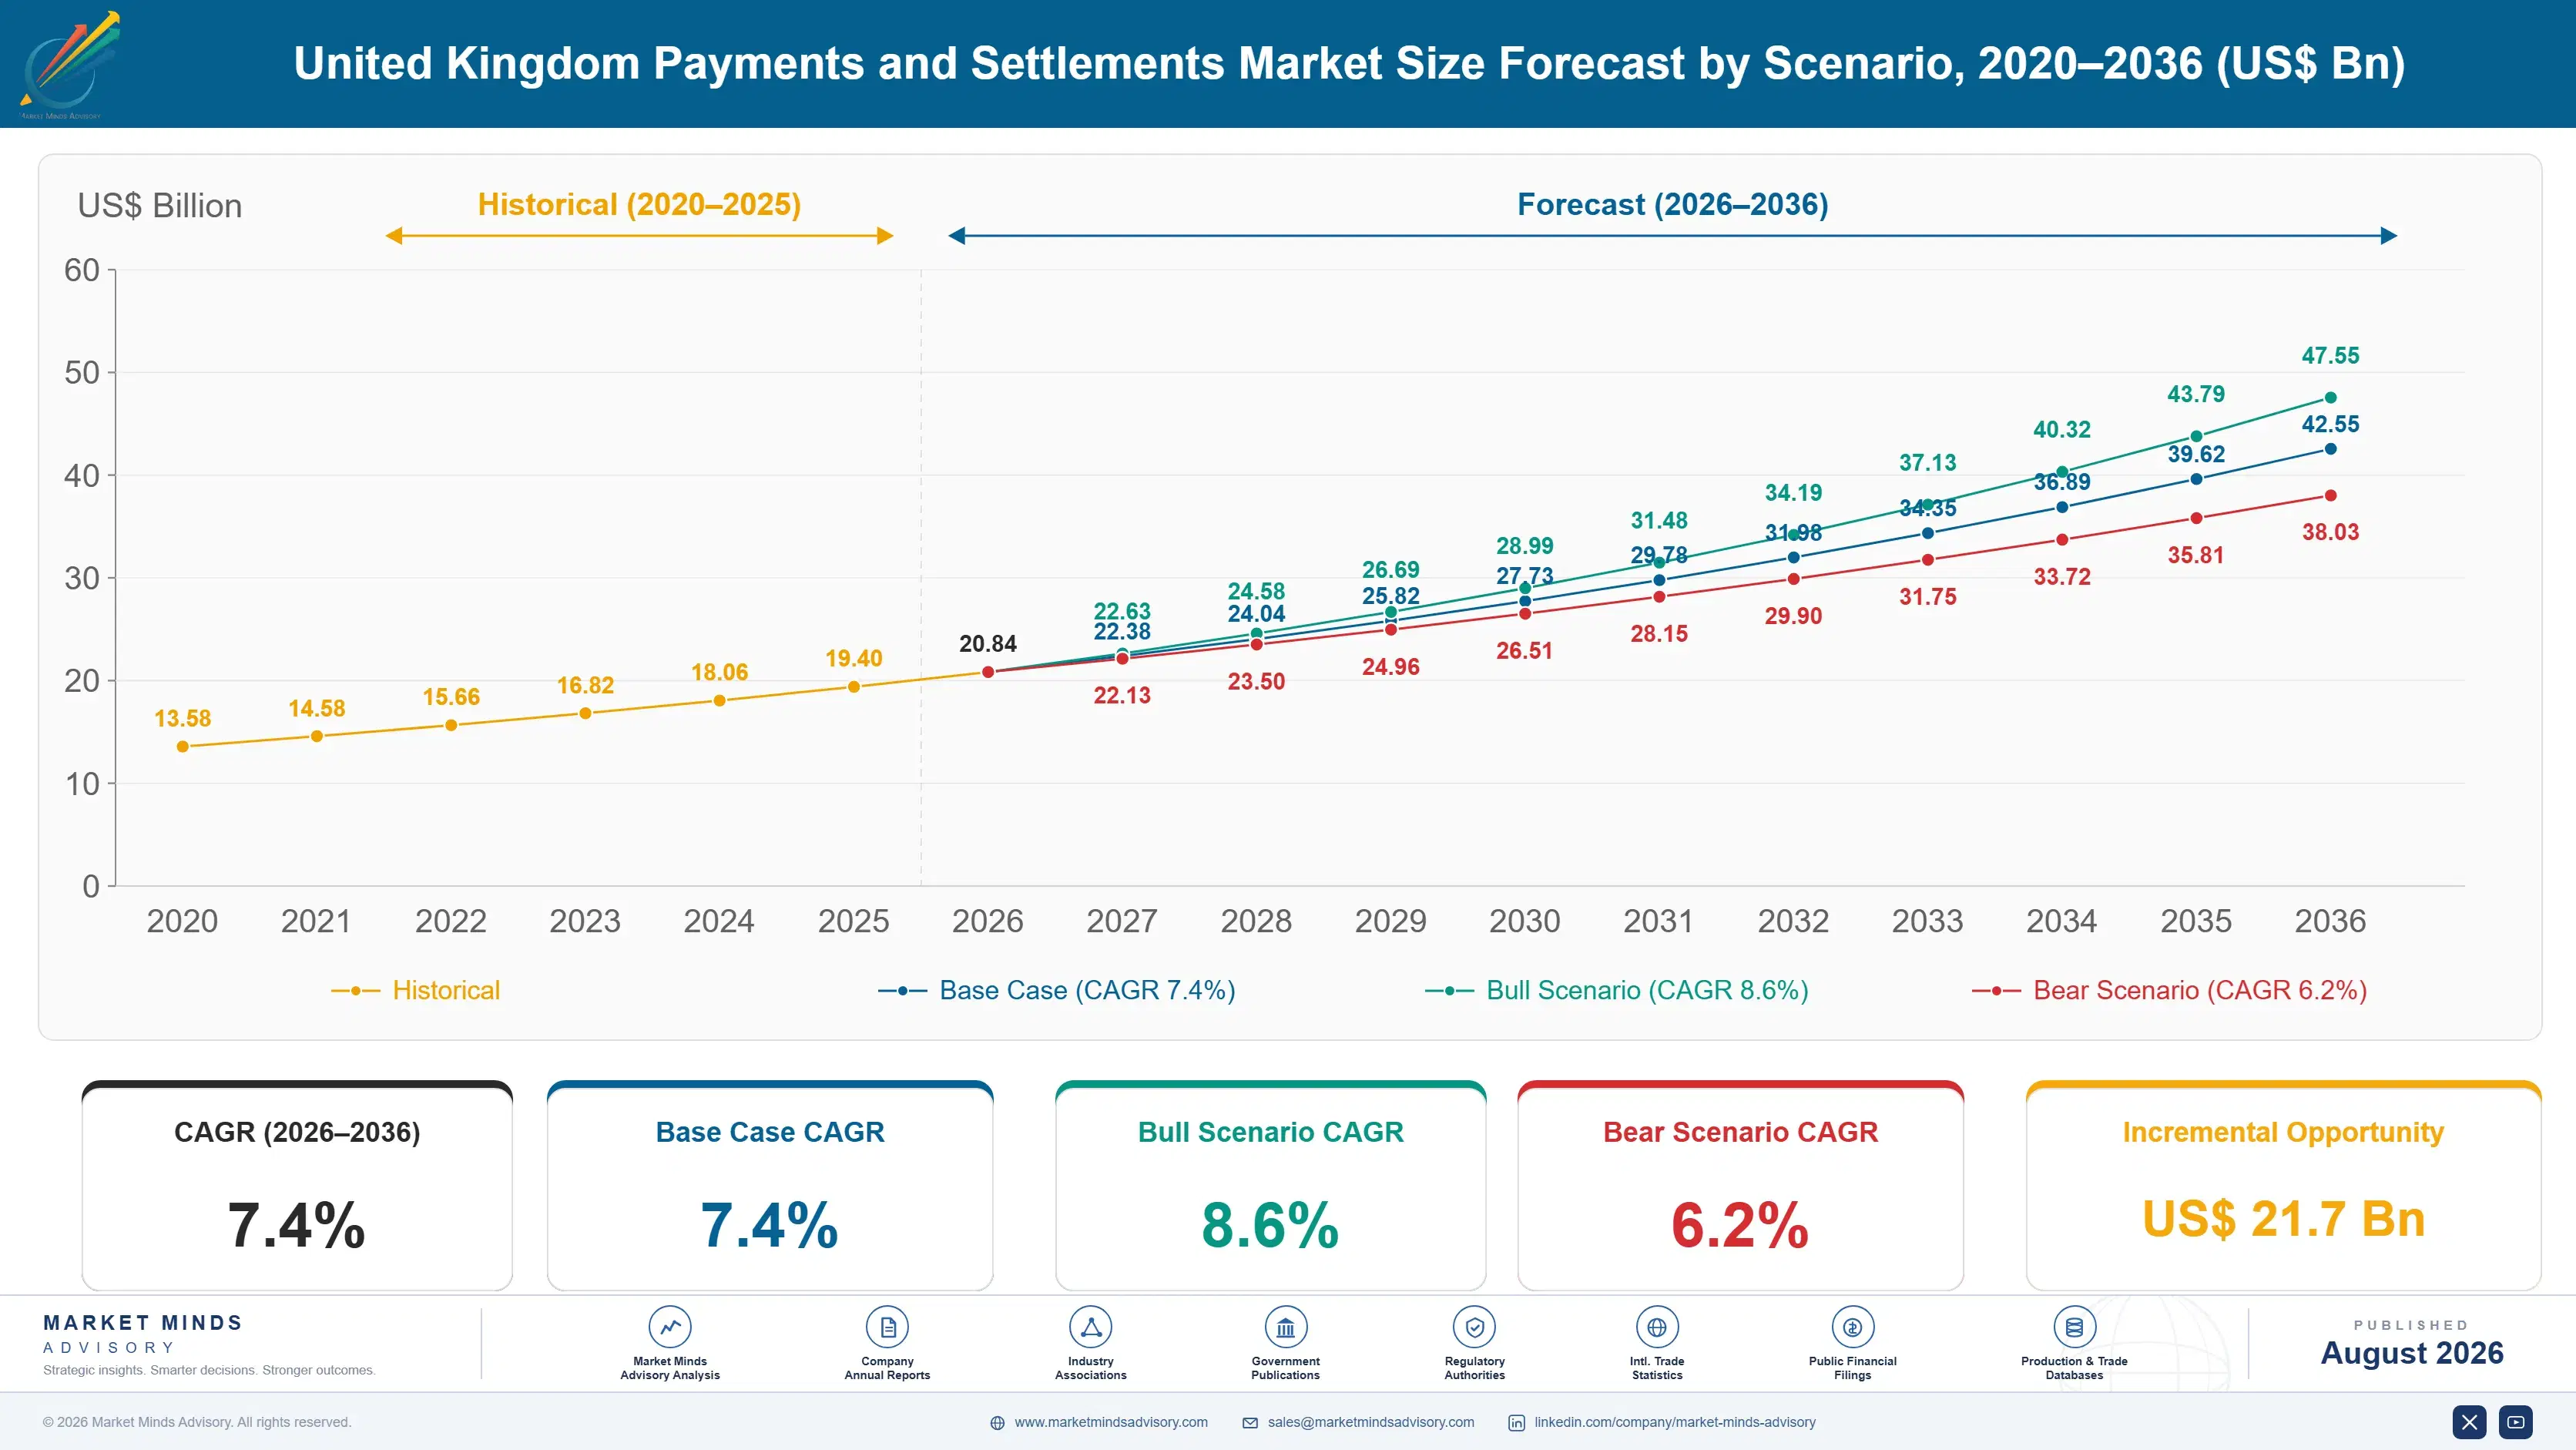
Growth from 2020 to 2025 ran at 6.2% and regulation shaped almost all of it. Card volumes recovered strongly after 2021 while interchange caps held issuer economics down. Cross-border rates on European-issued cards were raised sharply once the caps ceased to apply. Open banking payment volumes grew from very little to something meaningful. Then reimbursement rules moved fraud losses onto firms that had never carried them.
The 7.4% base case rests on three mechanisms. Commercial variable recurring payments give account-to-account rails a genuine route into e-commerce checkout for the first time. Fraud prevention services grow because reimbursement liability made detection a cost centre firms must fund rather than an optional investment. And cross-border corridor volumes keep rising on trade and remittance flows into South Asia and beyond. None of the three depends on card volumes rising.
The bull case at 8.6% assumes variable recurring payments reach retail checkout at scale and take meaningful share from card rails, which would move revenue rather than reduce it. The bear case at 6.2% is reimbursement losses running well above expectation, forcing firms to restrict payment limits and add friction that suppresses exactly the instant transfer volume the rules were written to protect.

Irrevocable, And Now Reimbursable

Faster Payments went live in 2008 and put Britain roughly fifteen years ahead of most of the world on instant account transfers. The consequence took nearly as long to arrive. A payment that settles in about 15 seconds and cannot be recalled suits legitimate commerce and suits a fraudster who has persuaded somebody to send money voluntarily. Speed and irrevocability are the same property viewed from two sides.
FIVE-FIRM CONCENTRATION44%Share of category revenue held by the largest payment providers
DEBIT INTERCHANGE CAP0.2%Regulated ceiling on issuer fees for domestic debit transactions
APP REIMBURSEMENT CAP85,000Maximum in pounds a firm must repay a scam victim
FASTER PAYMENTS SETTLEMENT15 sTypical clearing interval for an account to account transfer
DAILY CHAPS VALUE350Billions in pounds moving through high value settlement daily
ACCOUNT-TO-ACCOUNT SHARE14%Retail transactions bypassing card rails entirely at the checkout
Since October 2024 firms must reimburse victims of authorised push payment scams up to 85,000 pounds, split evenly between the sending and receiving institution. That is a genuine change in where loss sits. A payment firm that previously carried none of this now funds detection, intervention and reimbursement out of revenue earned on transactions worth pennies. Fraud prevention stopped being an optional investment on that date.
Card economics tell a different story about regulation. Domestic interchange is capped at 0.2% on debit and 0.3% on credit, which held issuer revenue down and pushed scheme fees up as compensation. Cross-border rates on European-issued cards ceased to be capped after departure from the single market, and the schemes raised them substantially. British merchants now pay more to accept a card issued across the Channel.
"Britain solved instant payments before anybody else and then spent a decade pretending the fraud problem was somebody else's. The reimbursement rules did not create that cost. They just decided who pays it, and the answer surprised a lot of boards."
Principal Analyst, Payments Infrastructure Practice · MMA Payments and Financial Infrastructure Practice · August 2026

Market Trends

Variable Recurring Payments Give Bank Rails A Checkout

Commercial variable recurring payments let a customer authorise a merchant to pull varying amounts from their account under agreed limits, which is the mechanism account-to-account payments always lacked for e-commerce. Card rails handled recurring billing and bank transfer did not. That segment grows at 11.1%. Rollout has been slower than advocates promised because the commercial model between banks and initiators took considerable time to settle into anything workable. Merchants have every financial reason to push customers toward it, and customers have almost none at all to move on their own account.
Market Impact: Shifts 14% of retail transactions

Fraud Detection Becomes A Funded Operating Requirement

Reimbursement liability up to 85,000 pounds per claim, split between sending and receiving firms, converted fraud prevention from a reputational matter into a line in the accounts that somebody has to own. Detection, intervention messaging and receiving-side monitoring all now carry direct financial consequence. Firms that had outsourced the question to their customers discovered they could not. That segment grows at 8.4% and the spend is not discretionary. A firm that had treated scam losses as its customers' misfortune now has to fund the systems it never bothered building before.
Market Impact: Grows cross-border services at 8.8%

Market Opportunities and Growth Drivers

Merchants Push Volume Off Increasingly Expensive Card Rails

Domestic interchange caps at 0.2% held issuer fees down while scheme fees rose in compensation, and cross-border rates to European issuers were raised substantially once the caps stopped applying. Merchants facing rising total acceptance cost have genuine reason to route customers toward account-to-account alternatives. Account-to-account already carries around 14% of retail transactions, and every point of share moved is revenue transferred rather than revenue destroyed. Nothing about that arithmetic favours the card networks, and merchants have been waiting a long time for a credible alternative to appear at the checkout.
Market Impact: Risks 85,000 pounds per claim

Corridor Volumes Rise On Trade And Remittance Flows

Cross-border payment services grow at 8.8%, driven by remittance and trade corridors into South Asia, and by corporate flows that increasingly settle through non-bank providers offering better rates and considerably better transparency than correspondent banking arrangements ever did. India corridors grow at 9.4%. Foreign exchange margin rather than transaction fee carries most of the revenue here, which is why pricing transparency has become such a competitive issue. Corporate treasurers have become considerably better at reading a total cost figure than they were five years ago, and that has changed who wins these accounts.
Market Impact: Runs 5 years beyond schedule

Market Restraints and Challenges

Reimbursement Liability Sits On Very Thin Margins

A firm reimbursing up to 85,000 pounds per claim earns fractions of a penny on the transactions involved, which is an asymmetry no pricing adjustment comfortably resolves. Root cause is that liability was assigned by transaction rail rather than by revenue earned. Commercial impact falls hardest on smaller institutions and payment firms. Mitigation runs through detection investment, transaction limits and receiving-side monitoring, though each adds friction to exactly the payments the rules were protecting. Nobody has yet found a way to price a transaction to cover a claim of that size.
Market Impact: Grows account-to-account at 11.1%

Infrastructure Renewal Has Taken Considerably Longer Than Planned

The programme to replace the Faster Payments infrastructure has run for years beyond original timelines and through repeated scope revision, which leaves participants funding both a legacy system and its intended successor simultaneously. Root cause is governance across many institutions with divergent commercial interests. Commercial impact is deferred capability and duplicated cost. Mitigation has involved narrowing scope substantially, which delivers something sooner while abandoning several capabilities the original design promised participants. Participants there continue paying for a system they were promised would already have been fully replaced by now anyway.
Market Impact: Covers claims up to 85,000 pounds
4 additional market trends, 2 additional growth drivers, and 3 additional restraints and challenges are covered in the full report. Contact sales@marketmindsadvisory.com to access the complete intelligence.

Segment CAGR and Growth Architecture

Segmentation follows service type, since revenue model, regulatory treatment and competitive structure all differ by service rather than by customer sector. Six categories cover the market without overlap. Customer size, industry vertical and distribution route are treated as separate commercial dimensions throughout this report rather than as segmentation logic in their own right here.
united-kingdom-payments-and-settlements-market-market-share-analysis-1787913468473

Account-to-Account and Faster Payments Services

Bank rail payment services grow at 11.1%, half again the market rate of 7.4%, as commercial variable recurring payments finally give account-to-account transfer the recurring and variable billing capability that card rails have always had and bank transfer never did. Around 14% of retail transactions already bypass cards entirely. Revenue per transaction is far lower than card acquiring, so share gains translate into revenue growth only where volume rises enough to compensate for the very different economics involved. Providers celebrating adoption without modelling that arithmetic properly are describing a migration that leaves them with more transactions and considerably less revenue than they had started out with in the first place.
CAGR 11.1%

Cross-Border and Foreign Exchange Payment Services

Cross-border services grow at 8.8% on remittance corridors into South Asia and on corporate flows moving away from correspondent banking toward providers offering better rates and clearer pricing. Foreign exchange margin rather than explicit transaction fee carries most of the revenue, which is precisely why disclosure requirements have become such a competitive battleground. Providers who compete on headline fees while holding wide spreads are increasingly exposed as corporate treasurers get better at reading total cost properly. Non-bank providers have taken substantial share from correspondent banking arrangements on exactly this basis, and the corridors where they have done so are the ones carrying serious institutional volume rather than retail remittance alone.
CAGR 8.8%
Full segment breakdown across 6 segments available in the complete report.

Regional Architecture and Country Demand Map

This is a single-country market, so regional distribution reflects where the counterparties to United Kingdom payment and settlement flows actually sit rather than where any provider happens to be headquartered. Domestic activity dominates here in a way that no genuine multi-country market ever really does.

North America

Share sits at 18%, below the standard regional band, because this is a single-country market and American counterparty exposure, while substantial, cannot approach domestic flow. That justification reflects the market definition rather than any view on relative importance. Transatlantic corporate payment and settlement flows are large and dollar-denominated, with correspondent relationships concentrated among a small number of institutions. American card issuers generate acceptance revenue at British merchants at rates well above domestic capped levels. Dollar clearing arrangements and time zone overlap make transatlantic settlement operationally straightforward compared with most corridors, which keeps costs low and margins correspondingly thin, so providers compete here on capability and reliability rather than on any pricing advantage anybody can hold.
Share: 18% | CAGR: 6.6% (2026 to 2036)

Western Europe

Share sits at 45%, far above the standard regional band, because domestic United Kingdom flow sits within this region and a single-country market concentrates its activity at home. That justification is definitional rather than analytical. European counterparty flows are also substantial, and cross-border interchange on European-issued cards ceased to be capped after departure from the single market, which raised merchant acceptance cost on those transactions considerably. Settlement arrangements with European infrastructure have grown more complex since. Account-to-account payment adoption across neighbouring markets has moved faster than domestic figures suggest in several countries, which gives merchants operating across borders a useful comparison and has sharpened the argument for moving checkout volume away from card rails here too.
Share: 45% | CAGR: 5.8% (2026 to 2036)
Regional intelligence for 5 additional markets available in the complete report: East Asia, South Asia and Pacific, Latin America, Middle East and Africa, Eastern Europe. Contact sales@marketmindsadvisory.com.
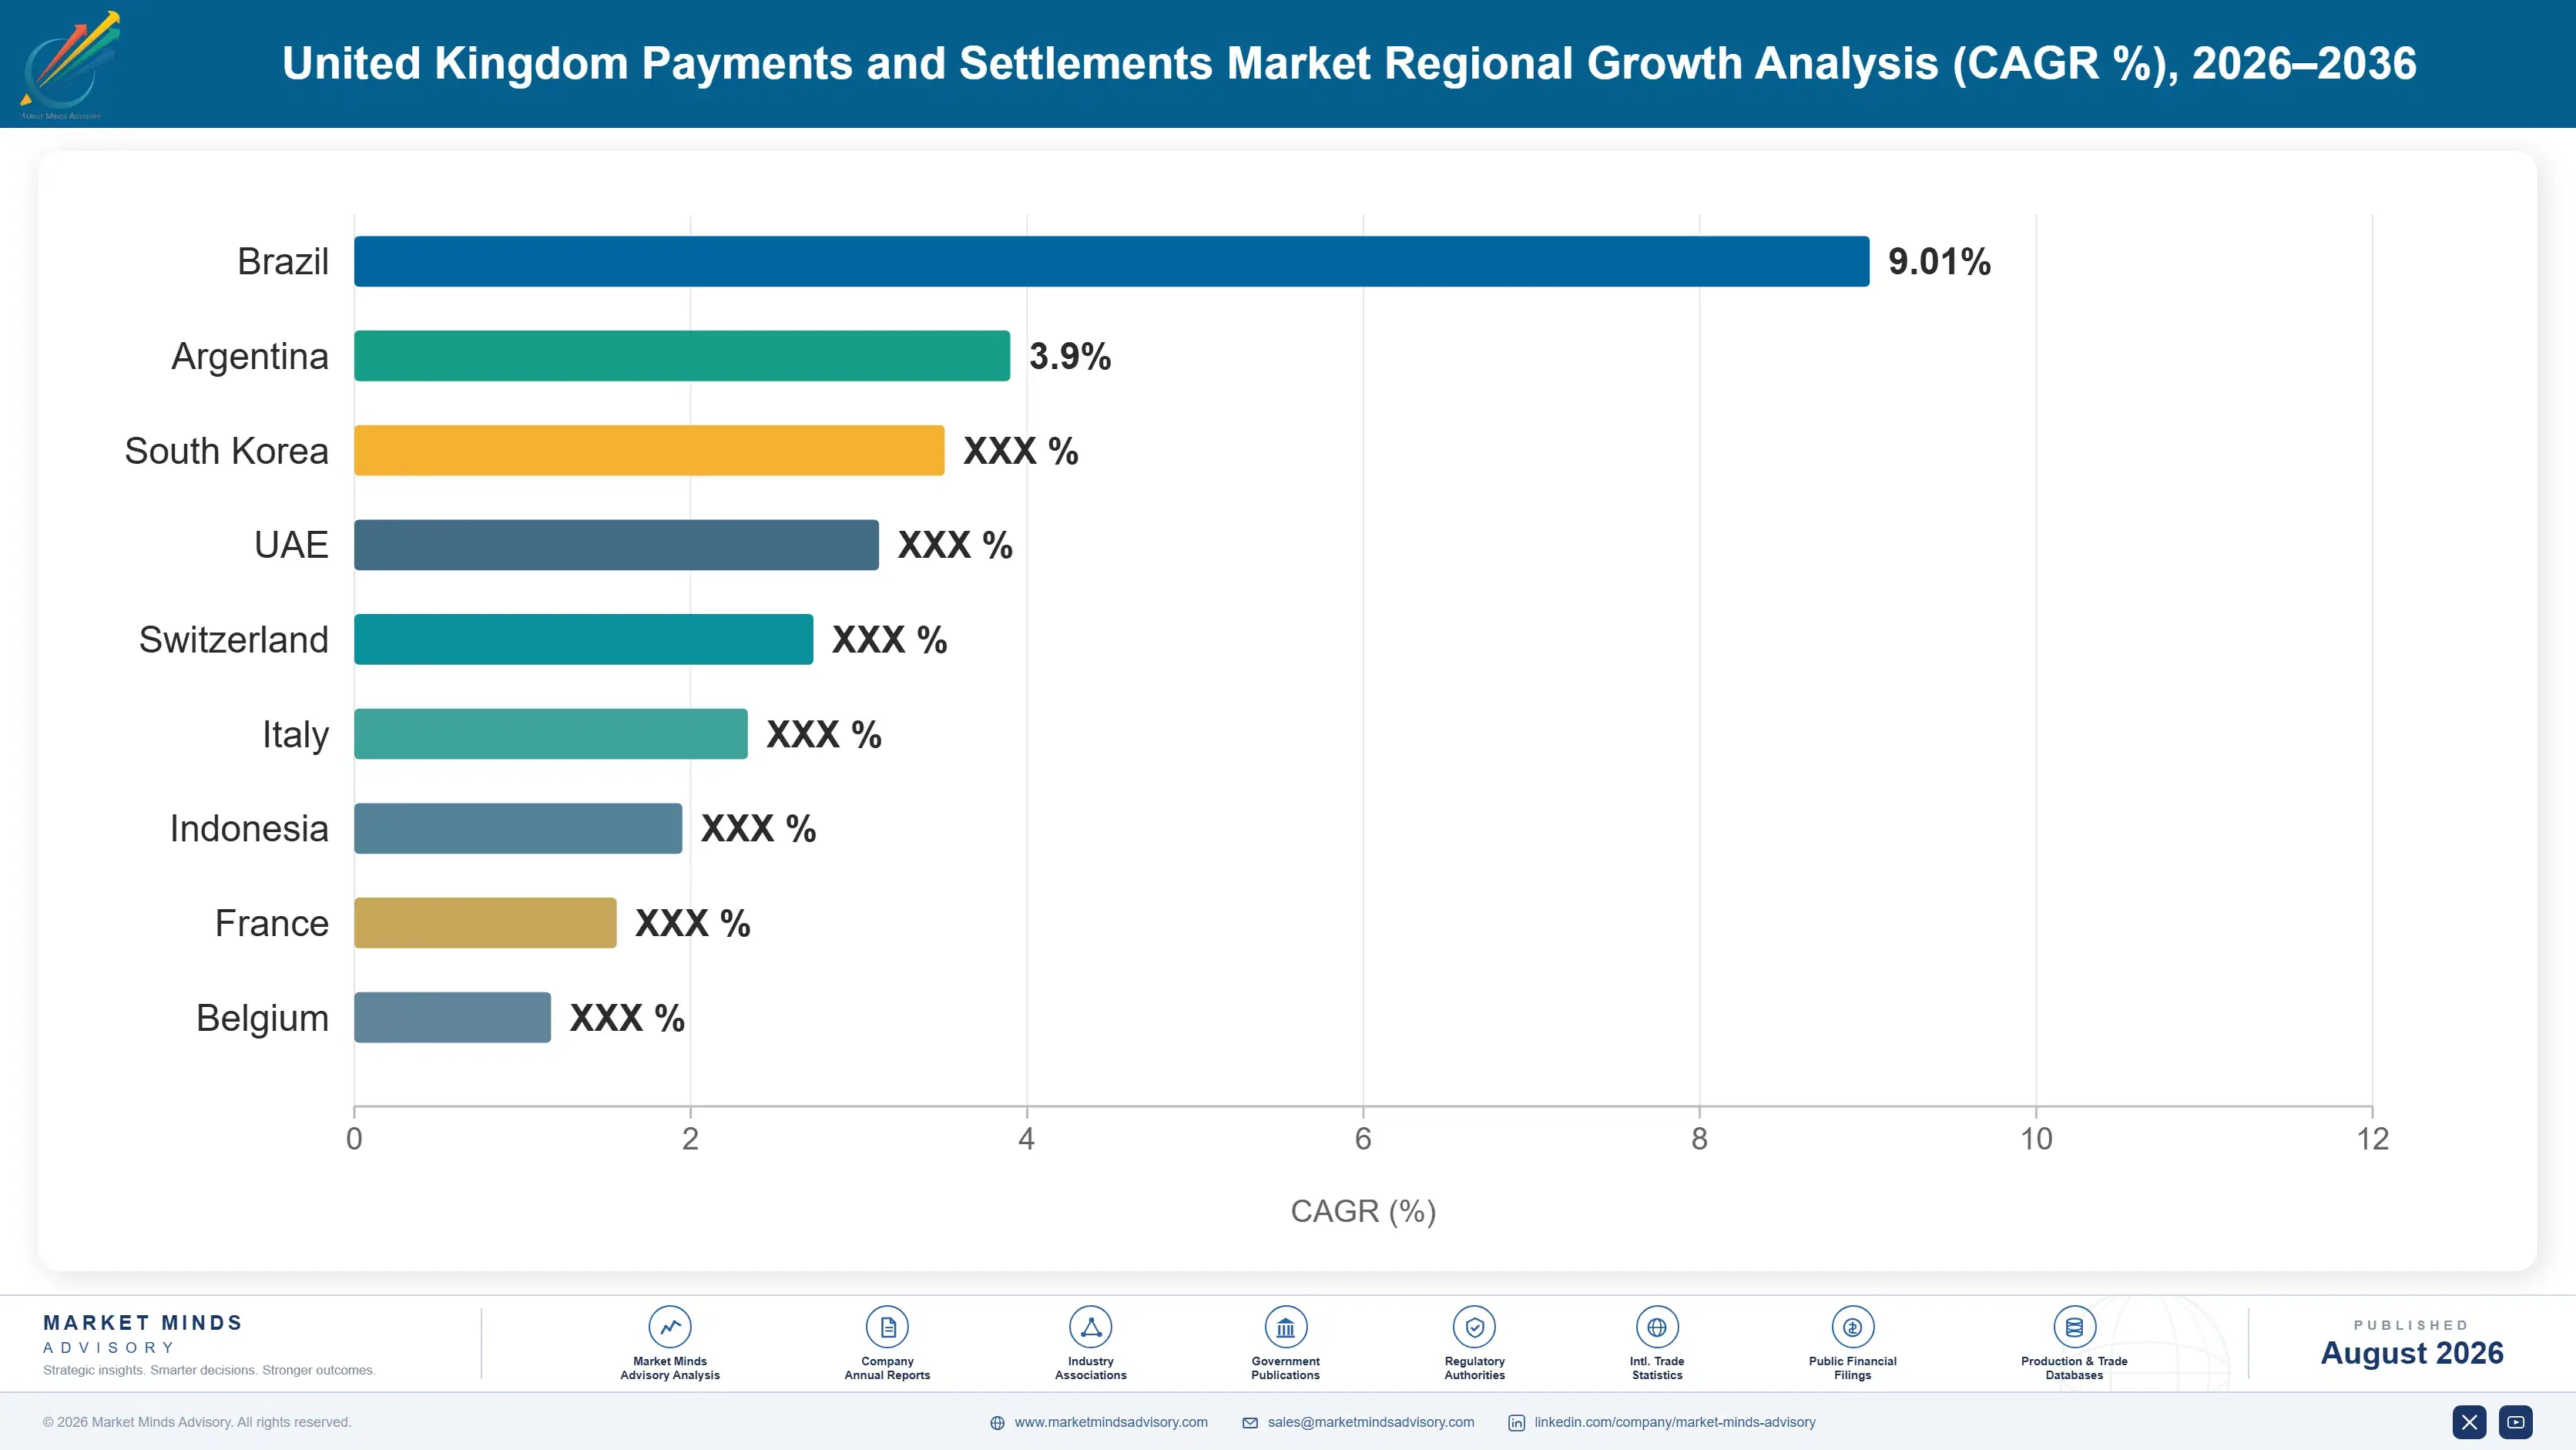
united-kingdom-payments-and-settlements-market-country-cagr-analysis-1787913469047

Own The Risk, Price The Rail

Reimbursement reaches 85,000 pounds per claim, domestic debit interchange is capped at 0.2%, account-to-account holds 14% of retail transactions and cross-border grows at 8.8%. Four levers work on fraud economics, rail migration, corridor transparency and settlement access rather than on transaction pricing, which regulation in this country has already largely decided on behalf of everybody.

Sell Detection As Liability Reduction, Not Compliance

Reimbursement of up to 85,000 pounds per claim, split between sending and receiving firms, gave every institution a direct financial stake in detection quality for the first time. Providers pricing fraud tools as compliance software are selling into a budget line that resists growth. Pricing them against avoided reimbursement changes the conversation entirely, because the buyer can calculate the return themselves and the calculation is unusually favourable in this case. Nobody has ever had a fraud business case this easy to write and this hard for anybody to refuse here.
Market Impact: Avoids reimbursement claims worth up to 85,000 pounds each

Build The Variable Recurring Payment Proposition Early

Commercial variable recurring payments give bank rails the recurring and variable billing capability they always lacked, and around 14% of retail transactions already bypass cards. Merchants facing acceptance costs that keep rising have every reason to listen. Providers building merchant-side propositions now will hold those relationships when volume arrives; those waiting for proven demand will be buying into a market where the merchant integrations are already finished and paid for. Integration work done today is integration work a competitor does not get paid to do all over again tomorrow instead.
Market Impact: Targets the 14% of retail transaction volume today

Compete On Corridor Transparency Rather Than Headline Fees

Cross-border revenue comes mostly from foreign exchange margin rather than stated fees, and corporate treasurers have become considerably better at calculating total cost than they were five years ago. That segment grows at 8.8%. Providers holding wide spreads behind low headline pricing are increasingly exposed when a client finally runs the comparison. Transparent margin pricing wins the accounts that actually check, and those accounts carry the volume. The accounts worth having are precisely the ones with a treasury function competent enough to check, which is an uncomfortable thought for anybody hiding margin.
Market Impact: Grows the corridor revenue base at 8.8% annually

Turn Settlement Access Into A Wholesale Proposition

Direct access to high-value and Faster Payments settlement is held by a limited number of institutions, and around 350 billion pounds moves through high-value settlement daily. Firms holding that access can supply indirect participants who cannot justify the operational and capital requirements themselves. It converts an infrastructure obligation into a revenue line, and the client relationships involved are unusually durable because switching sponsor is genuinely disruptive. Very few institutions hold this access and a great many firms need it without being able to justify the capital and operational burden themselves.
Market Impact: Serves the 350 billion pounds in daily settlement

Who Controls the Margin Pool

Measured on disclosed United Kingdom payments and merchant services revenue, the five largest providers hold a CR5 of 44%, sustained by scheme relationships, settlement access and merchant estates rather than by any proprietary technology. Worldpay carries the deepest merchant acquiring position, Barclays holds combined acquiring and settlement capability, Lloyds Banking Group and NatWest Group hold substantial banking and merchant franchises, and Adyen has taken meaningful enterprise merchant share. Nobody outside that group holds both settlement participation and a substantial merchant estate together.
Three contests run at once. Merchant acquiring competes on pricing and integration breadth. Account-to-account initiation competes on bank coverage and conversion rates. Fraud services compete on detection performance against a liability that is now measurable. Each of those three rewards a completely different capability, and very few firms hold more than one of them convincingly.

Pressure builds from reimbursement liability falling disproportionately on smaller institutions with thinner detection capability. Rankings shift toward whoever holds merchant relationships when account-to-account volume arrives at checkout. Detection quality has become measurable in pounds, which is a genuinely new thing in this market and it will separate the firms that invested from the ones that talked about investing.
united-kingdom-payments-and-settlements-market-company-positioning-matrix-1787913469565

Competitive Moat and Risk Dimensions

WORLDPAY

Moat: Merchant Estate Scale And Integration

A very large installed merchant base with deep integration into point of sale and e-commerce platforms produces switching friction that pricing alone rarely overcomes, since changing acquirer means reworking systems that currently function perfectly well. Scale also supports scheme fee negotiation that smaller acquirers cannot match. Rebuilding an equivalent estate takes years of acquisition spending.
WORLDPAY

Risk: Card Rail Dependence Through Migration

Revenue concentrated in card acquiring faces a migration toward account-to-account rails that carry far lower revenue per transaction, and merchants have clear financial reason to encourage that shift. An acquirer without a credible bank rail proposition watches volume move to economics it does not participate in at all.
BARCLAYS

Moat: Settlement Access With Acquiring Combined

Holding direct settlement participation alongside a substantial merchant acquiring business allows the group to serve both sides of a payment and to sponsor indirect participants who cannot justify direct access themselves. That combination is held by very few institutions. It also positions the group across card and bank rails simultaneously, which matters as volume migrates between them.
BARCLAYS

Risk: Reimbursement Exposure On Both Sides

Carrying both sending and receiving institution roles means reimbursement liability arises from both directions under the split arrangement, and scale multiplies claim volume accordingly. Detection investment has to cover outbound intervention and inbound account monitoring, which are quite different disciplines requiring separate capability and separate spending.

Players Tracked

Prominent Players

Worldpay
Barclays
Lloyds Banking Group
NatWest Group
Adyen

Other Key Players

HSBC UK
Santander UK
Nationwide Building Society
Nexi
Global Payments
Elavon
Stripe
PayPal
Checkout.com
Wise
Revolut
GoCardless
Form3
Vocalink
Bottomline Technologies

Recent Developments

JANUARY 2025

Reimbursement claim volumes exceed early industry expectations

Claim volumes under the authorised push payment reimbursement requirement ran above the levels most firms had modelled during the first full quarter of operation. This was an operational outcome rather than any rule change, and it prompted several institutions to tighten transaction limits and add verification friction.
Signal: Liability transferred considerably faster than detection capability improved at most of the firms now carrying it.
MAY 2025

Retailer launches variable recurring payment checkout alongside cards

A large retailer added commercial variable recurring payments as a checkout option alongside existing card acceptance, with incentives encouraging customer adoption. This was a commercial rollout rather than any partnership announcement, and conversion rates promptly became the one metric everybody in the sector watched afterwards.
Signal: Merchant incentives rather than any customer preference will decide how quickly these payment rails actually migrate.
SEPTEMBER 2025

Infrastructure renewal programme scope narrowed again by governing body

The programme replacing core retail payment infrastructure had its scope reduced further, deferring several capabilities from the original design. This was a governance decision rather than any procurement change, and participants continue funding both the legacy operation and its intended replacement programme at the same time.
Signal: Shared infrastructure governance delivers very slowly when participants hold genuinely divergent commercial interests in the outcome.

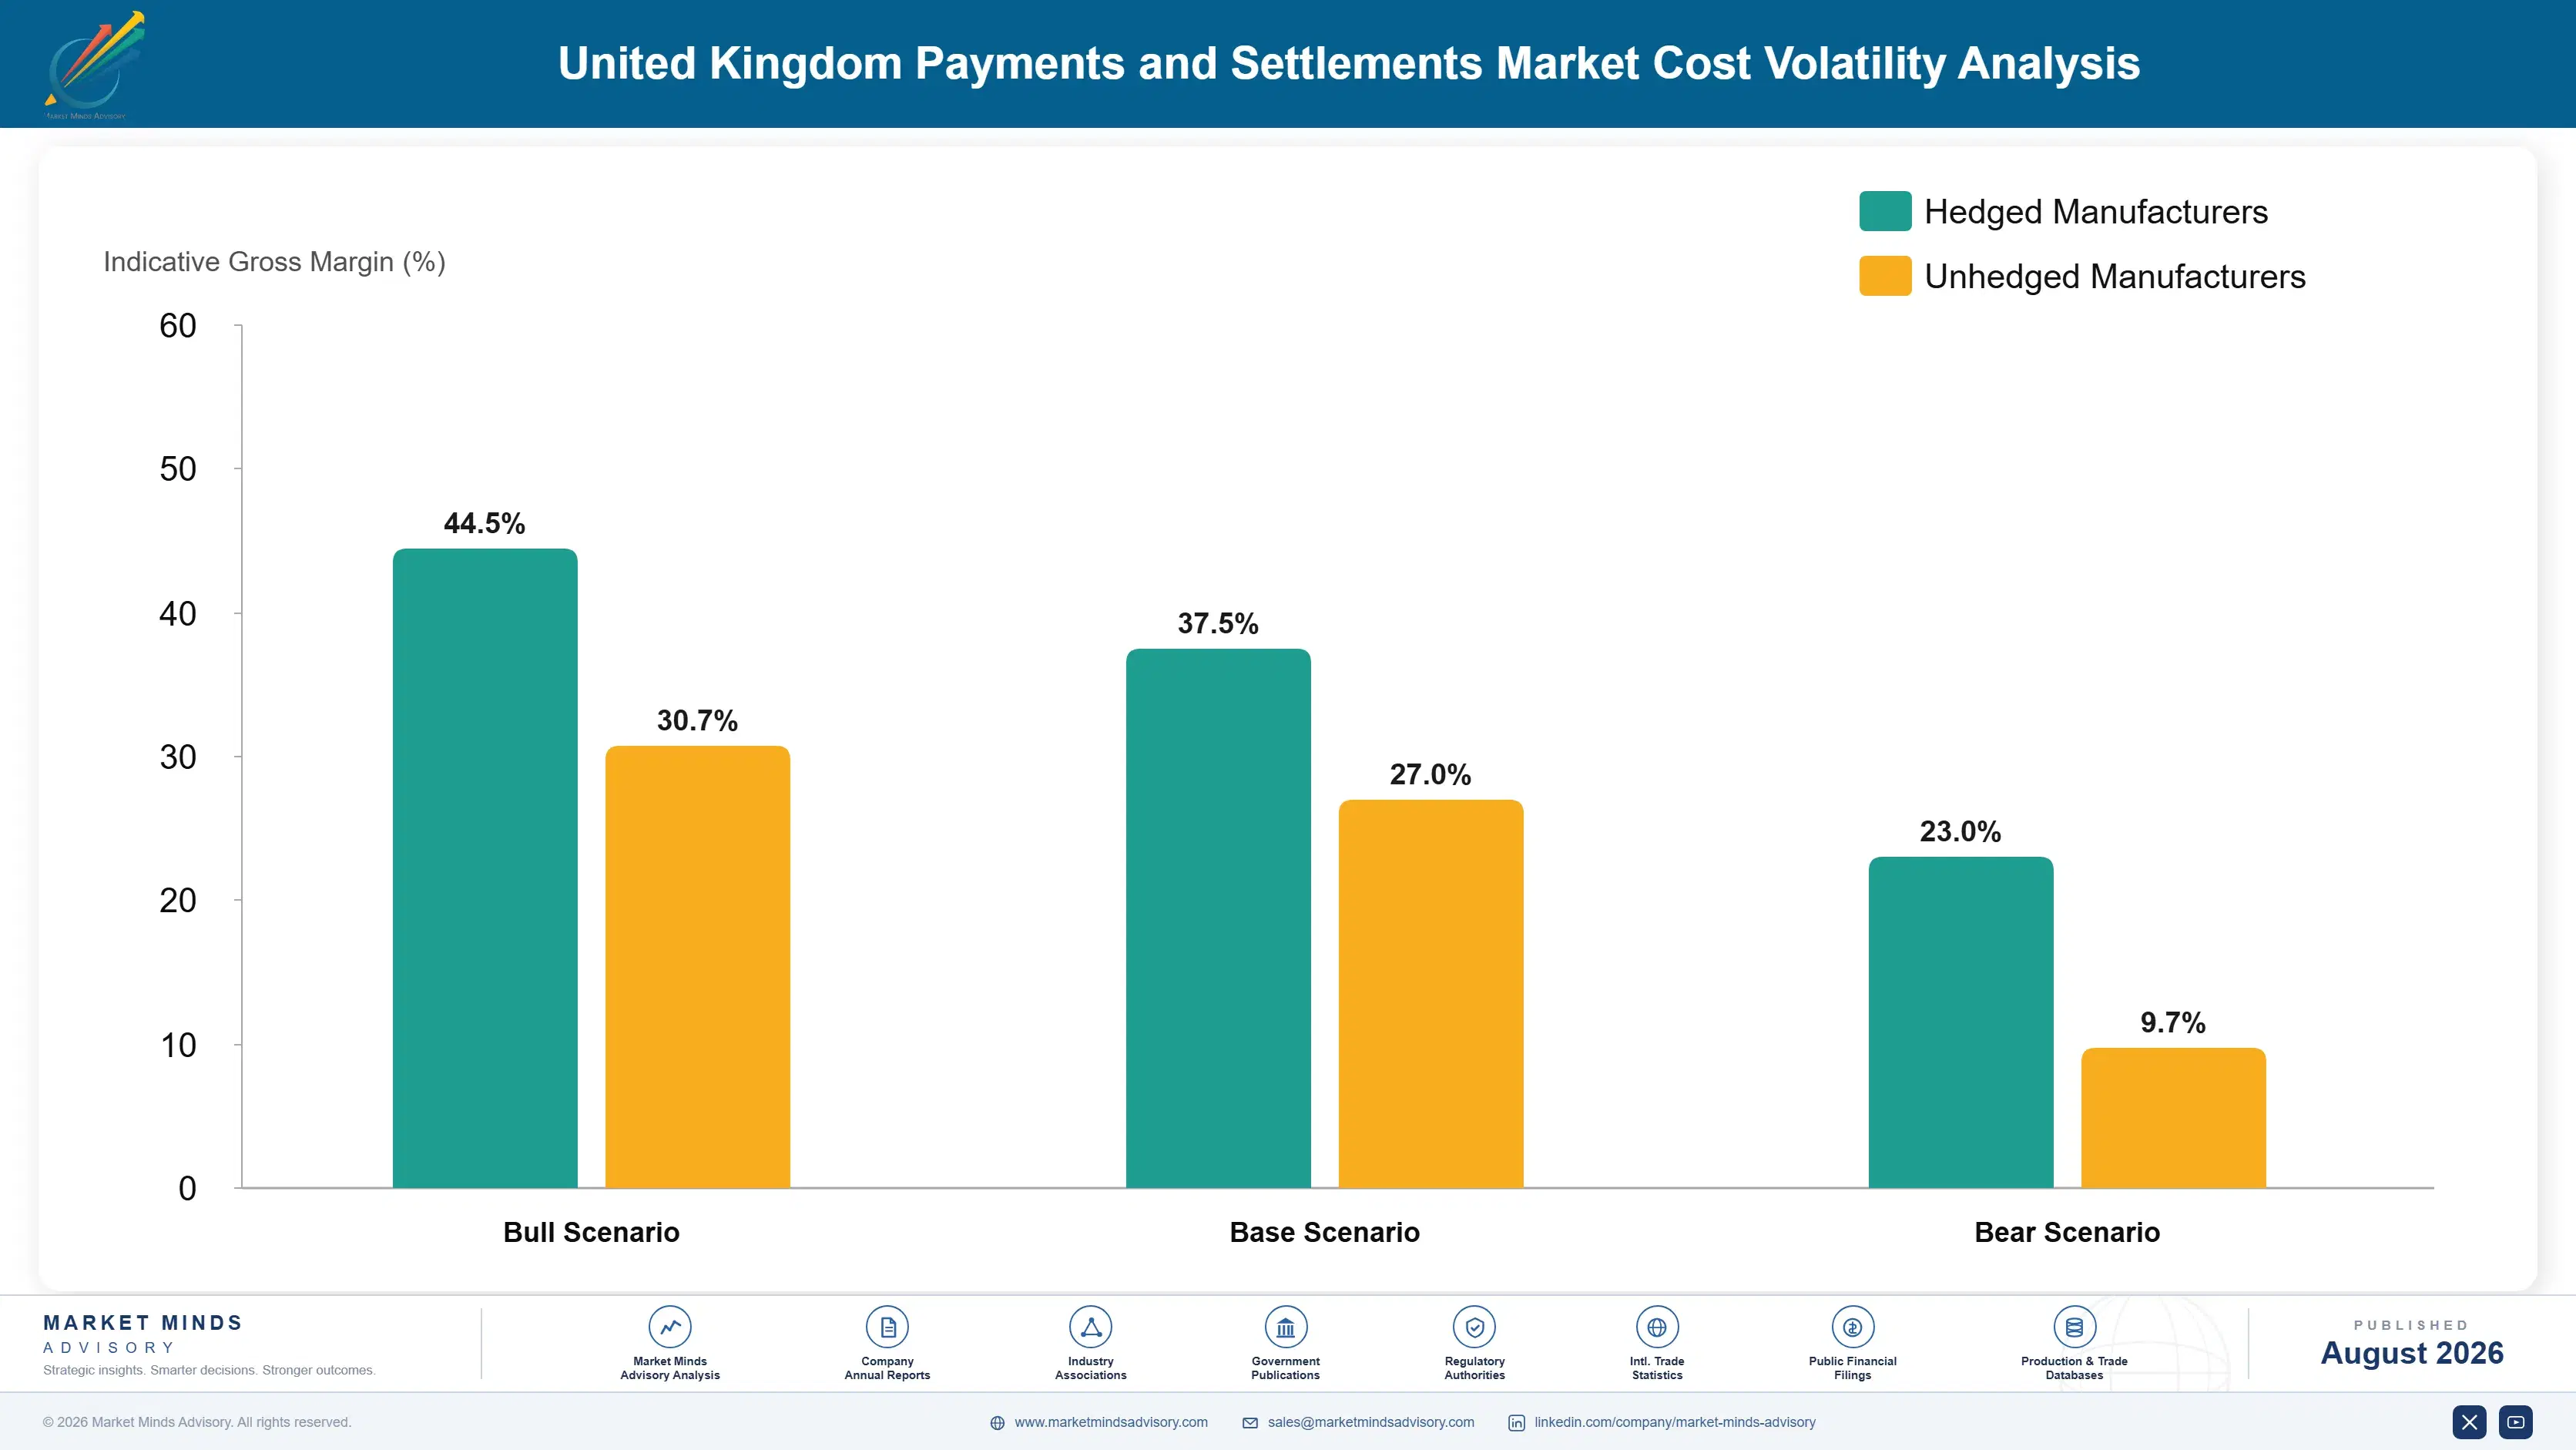
Scheme Fees, Fraud, Compliance

Three costs dominate. Interchange and scheme fees paid away on card transactions, fraud losses and reimbursement obligations, and technology and regulatory compliance operations together account for 64 to 78% of gross revenue at a typical provider. Interchange is regulated at 0.2% on domestic debit and 0.3% on domestic credit, while scheme fees are set commercially by the networks and have risen steadily as those same caps compressed issuer economics.
Two changes reset the cost base. Cross-border interchange on European-issued cards ceased to be capped after departure from the single market, and the schemes raised rates substantially, which European Commission material on the retained framework makes clear in comparison. Then reimbursement obligations from October 2024 added a loss line that Payment Systems Regulator policy statements had signalled but that few firms had funded adequately. Barclays Annual Report 2024 disclosures describe comparable exposure.

Exposure divides by institution size rather than by business model. Large institutions absorb reimbursement across substantial revenue and fund detection capability at scale. Smaller banks, building societies and payment firms carry the same per-claim liability of up to 85,000 pounds against far thinner revenue and weaker detection systems. That asymmetry is the clearest competitive consequence of the rules.
united-kingdom-payments-and-settlements-market-cost-volatility-analysis-1787913469762

Invest in receiving-side monitoring, not only outbound checks

Reimbursement splits evenly between sending and receiving firms, yet most detection investment historically addressed outbound payments alone. Monitoring inbound flows for mule account behaviour requires quite different analytics and different operational response. It addresses half the liability that most institutions have been treating as somebody else's problem entirely. Half of the exposure sits entirely unwatched.

Negotiate scheme fee terms against total processed volume

Scheme fees rose steadily as interchange caps compressed issuer economics, and they are commercially set rather than regulated. Acquirers with substantial processed volume hold real negotiating leverage that smaller participants simply do not. Consolidating volume across entities before negotiation costs internal reorganisation and delivers terms that can materially change the whole acquiring margin outcome.

Price cross-border card acceptance to reflect uncapped rates

European-issued card transactions no longer carry capped interchange and cost materially more to accept than domestic equivalents. Merchants on blended pricing cannot see this and acquirers absorbing the difference are funding it themselves. Interchange-plus pricing exposes the true cost, which is uncomfortable commercially and considerably better than simply carrying that gap quietly forever afterwards.

Portfolio Architecture for Margin Defence

Margin follows scarcity of access and difficulty of capability rather than transaction volume. Card acquiring earns modestly after scheme fees and interchange are paid away. Account-to-account initiation earns thinly per transaction at present. Payment infrastructure and processing earns reasonably on contracted scale. High-value settlement services earn well on restricted access. Cross-border services earn better on foreign exchange margin. Fraud prevention earns best, on a liability that is now measurable in pounds.
The tension is that the fastest growing rail carries the weakest economics per transaction. Account-to-account payments grow at 11.1% while generating a fraction of card acquiring revenue on equivalent value, which means share migration reduces the revenue pool unless volume growth compensates. Providers celebrating account-to-account adoption without modelling that arithmetic are describing a market they will find considerably smaller than the one they left.

High-value pools sit in three places. Fraud prevention, where liability of up to 85,000 pounds per claim makes the return calculable and the spend non-discretionary. Settlement access, held by few institutions and sponsorable to many. And cross-border foreign exchange margin, provided the provider can survive the transparency pressure now reshaping that pricing.

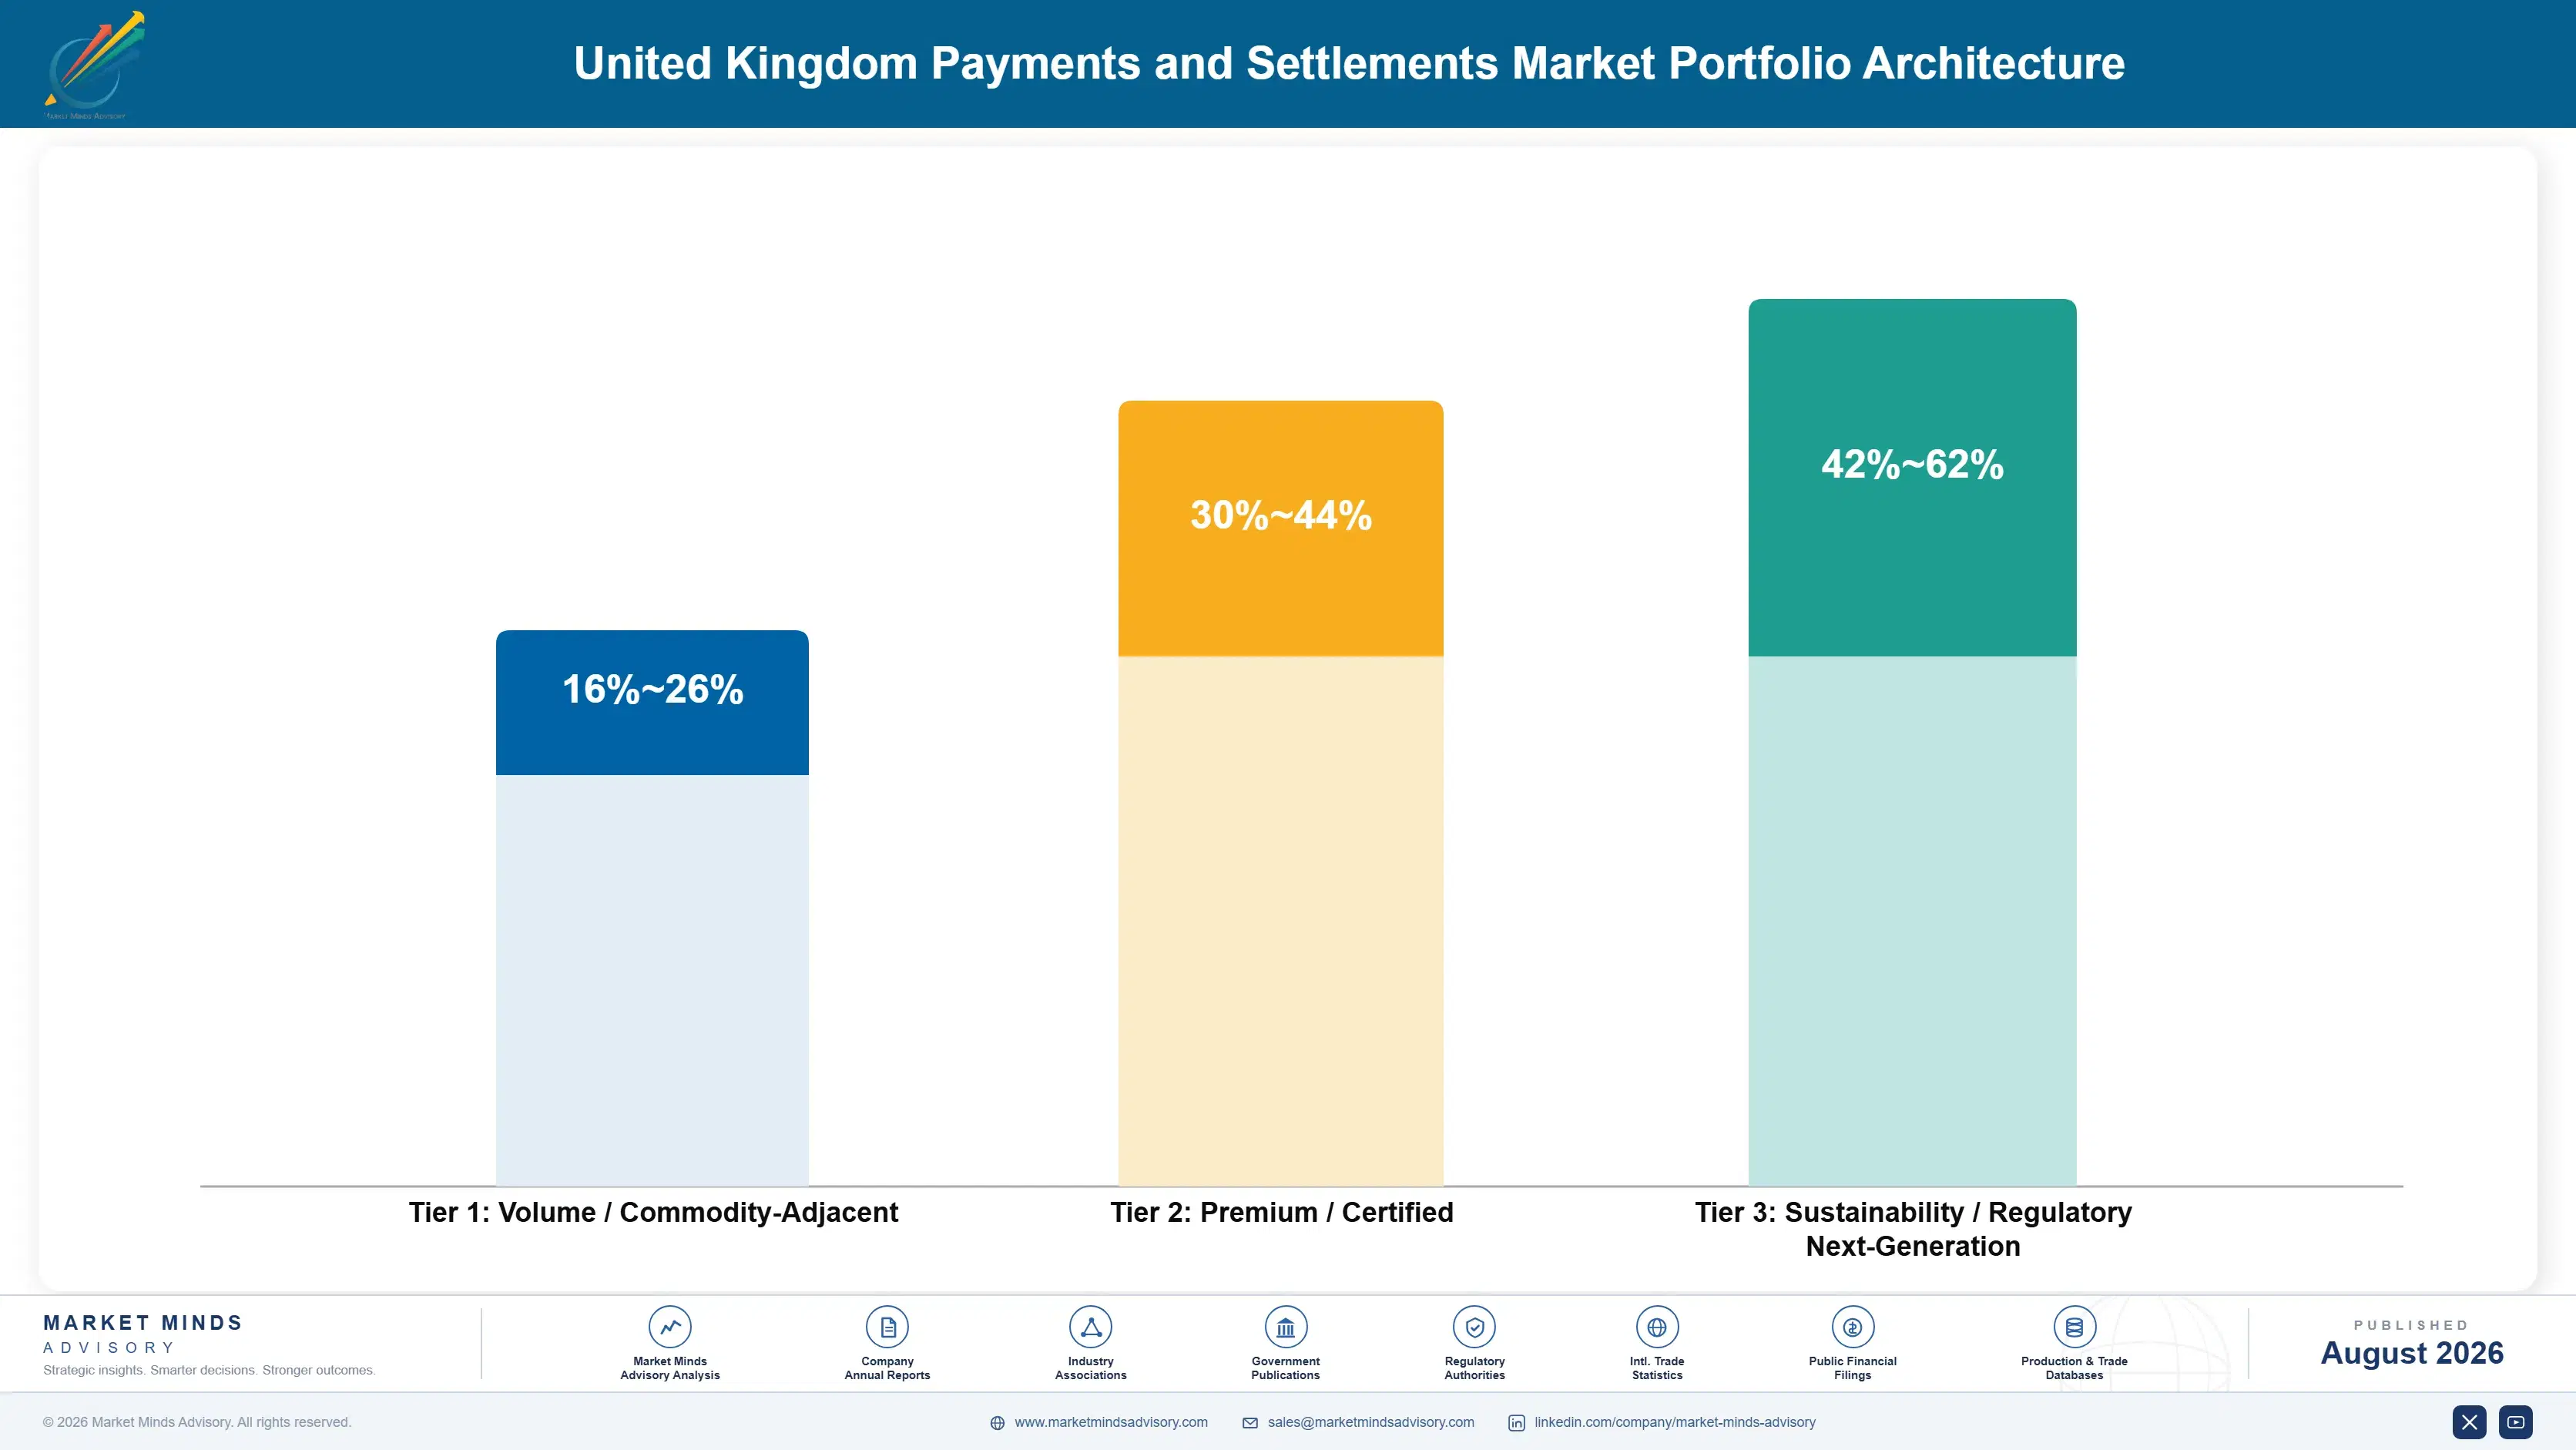
Volume / Commodity-Adjacent

Card acquiring and account-to-account initiation supplied at high volume with scheme fees and interchange paid away. The 10-point range separates providers with negotiated scheme terms and merchant scale from smaller acquirers on standard pricing.
Gross Margin: 16-26%

Premium / Certified

Payment infrastructure, processing and cross-border services carrying integration depth and foreign exchange margin. The 14-point spread reflects how differently contracted processing arrangements and margin-based corridor revenue behave under competitive pressure.
Gross Margin: 30-44%

Sustainability / Regulatory / Next-Generation

Fraud prevention services and high-value settlement access, both driven by regulation and restricted participation rather than by any competitive choice. The 20-point range is wide because detection software and settlement sponsorship earn on quite different structures.
Gross Margin: 42-62%
united-kingdom-payments-and-settlements-market-portfolio-architecture-1787913470261

High-value Sub-segments and Strategic Watch-out

Fraud Prevention Services

Highest margin, growing at 8.4%, and protected by a liability of up to 85,000 pounds per claim that makes the buyer's return calculation unusually straightforward. The risk is that detection performance is measurable, so underperforming products get identified quickly. And the evidence arrives quickly here.
Gross Margin: 48-62%

Settlement Access Sponsorship

Strong economics from access held by very few institutions and needed by many that cannot justify direct participation themselves. The risk is regulatory pressure to widen direct access, which would erode the scarcity the whole proposition depends upon. Scarcity is really the entire proposition here.
Gross Margin: 40-52%

Card Acquiring Volume

The volume core, funding merchant relationships and technology platforms that everything else is sold through. Providers hold it because it carries the customer relationship, not because the residual margin after scheme fees is remotely attractive. The relationship is the actual asset here, not the margin.
Gross Margin: 18-28%

Account-To-Account Revenue Dilution

The strategic watch-out. The fastest growing rail generates a fraction of card revenue on equivalent transaction value. The risk is celebrating volume migration that shrinks the revenue pool while everybody reports rising transaction counts. Transaction counts rise steadily while the actual revenue quietly falls away.
Gross Margin: 12-20%

Volume Recurs, Economics Do Not

Annuity characteristics here are unusually strong on volume and unusually weak on price. A merchant acquiring relationship generates revenue on every transaction that merchant takes, continuously, with no repurchase decision and considerable integration friction protecting it. What does not persist is the rate. Acquiring pricing is reviewed constantly, scheme fees rise independently, and a relationship that looks like an annuity on volume can lose margin steadily without the customer ever moving anywhere.
Stickiness varies sharply by service and most providers overestimate the sticky part. Merchant acquiring holds through integration friction, though tender processes reopen pricing regularly. Settlement sponsorship is extremely sticky, since changing sponsor is operationally disruptive and regulatorily involved. Fraud services stick through data history and tuning. Account-to-account initiation has very little stickiness at all, because the integration is comparatively light and switching costs are correspondingly low.

Decision authority has moved from finance toward risk and technology over the past five years. Merchant payment decisions once sat with finance directors weighing acceptance cost. Reimbursement liability pulled risk and compliance functions into decisions they previously ignored entirely. Meanwhile checkout conversion moved technology and product teams into the discussion, and those three groups optimise for genuinely different things.
united-kingdom-payments-and-settlements-market-end-use-penetration-index-1787913470750

Regulation Moved The Money

These are among the four positions where our research anticipates prominent divergence between winners and laggards over the coming forecast period. Each is grounded in the demand model, the regulatory perimeter, and the announced capacity pipeline.
01 / FRAUD LIABILITY PRICING

Detection is now a calculable return, not compliance

Mandatory reimbursement of up to 85,000 pounds on every single claim, split evenly between sending and receiving firms, gave every institution a direct and quantifiable financial stake in the quality of its own detection for the very first time. Providers who are still pricing their fraud tools as compliance software are selling into a budget line that has always resisted growth. Pricing it against avoided reimbursement lets the buyer calculate the return for themselves, and that calculation is unusually favourable.
02 / RAIL MIGRATION ECONOMICS

The growing rail pays a fraction of the old one

Account-to-account services grow at 11.1% a year while generating far less revenue per transaction than card acquiring does on the equivalent value, which means that any share migration shrinks the total revenue pool unless volume growth more than compensates for the whole difference. Around 14% of all retail transactions in the country already bypass the card rails entirely. Providers celebrating adoption without modelling that arithmetic properly are walking quite cheerfully into a market considerably smaller than the one they currently occupy today.
03 / SETTLEMENT ACCESS MONETISATION

Few hold it and many genuinely need it

Direct participation in high-value and retail settlement is held by only a limited number of institutions, while around 350 billion pounds moves through high-value settlement every single business day, and a great many firms need access that they simply cannot justify holding directly themselves. Sponsoring all of those indirect participants converts an infrastructure obligation into genuinely durable revenue instead. Switching sponsor is operationally disruptive and regulatorily involved, all of which makes those relationships unusually difficult for anybody at all to displace.
04 / CROSS-BORDER MARGIN TRANSPARENCY

Treasurers finally learned to read the spread

Cross-border revenue comes mostly from the foreign exchange margin rather than from any stated transaction fees, and corporate treasurers have become a great deal better at calculating total cost than they were five years ago. That segment grows at 8.8%, and the corridors that carry any real institutional volume are exactly the ones now being examined most closely of all. Providers holding wide spreads behind attractive headline pricing lose those accounts the very moment that somebody there finally runs a proper comparison.

Engagement Snapshot From the Field

A live engagement with an industry participant carrying material or product regulatory and market exposure ahead of a defining policy shift, showing how our research translates into a defensible multi-year portfolio strategy.
MARKET MINDS ADVISORY · CLIENT ENGAGEMENT SUMMARY
United Kingdom Payments and Settlements Producer Strategic Portfolio Review and Transition Roadmap 2026·Investment Scenario on United Kingdom Payments and Settlements Exposure Evaluation 2025-26
CLIENT PROFILE
A mid-sized United Kingdom payment institution serving small business merchants and consumer transfers, with reported payments revenue of 118 million dollars (client-reported, unverified by MMA). Roughly 64% came from card acquiring on blended merchant pricing. Reimbursement claims had run materially above budget since the obligation took effect and detection capability addressed outbound payments only throughout.
STRATEGIC CHALLENGE
Reimbursement losses were consuming margin faster than budgeted while blended acquiring pricing concealed rising cross-border interchange costs the firm was absorbing itself. Management proposed raising merchant pricing across the board. That risked the merchants generating the cheapest domestic volume while leaving the two actual problems, inbound fraud exposure and mispriced cross-border acceptance, entirely untouched.
MMA APPROACH
MMA decomposed reimbursement claims by sending and receiving role, then rebuilt acquiring margin by transaction type separating domestic capped interchange from uncapped European-issued card acceptance. Twenty-eight expert interviews with merchants, fraud specialists, scheme representatives and sponsor banks established where cost and liability actually accumulate. The analysis treated inbound monitoring and interchange-plus pricing as the available routes forward.
KEY FINDINGS
  1. Slightly over half of reimbursement liability arose from the firm's receiving-side role, where it had deployed no monitoring capability at all and had assumed the exposure belonged elsewhere.
  2. European-issued card acceptance was being absorbed at a loss under blended pricing, and the affected merchants had no idea their transaction mix was unusual.
  3. Domestic debit acceptance at capped interchange was comfortably profitable, and a blanket price rise would have driven away exactly that volume first.
  4. Detection tuning had not been revised since deployment, and the firm was reimbursing claims that a current model would very likely have intercepted.
CLIENT PROFILE
A mid-sized United Kingdom payment institution serving small business merchants and consumer transfers, with reported payments revenue of 118 million dollars (client-reported, unverified by MMA). Roughly 64% came from card acquiring on blended merchant pricing. Reimbursement claims had run materially above budget since the obligation took effect and detection capability addressed outbound payments only throughout.
STRATEGIC CHALLENGE
Reimbursement losses were consuming margin faster than budgeted while blended acquiring pricing concealed rising cross-border interchange costs the firm was absorbing itself. Management proposed raising merchant pricing across the board. That risked the merchants generating the cheapest domestic volume while leaving the two actual problems, inbound fraud exposure and mispriced cross-border acceptance, entirely untouched.
MMA APPROACH
MMA decomposed reimbursement claims by sending and receiving role, then rebuilt acquiring margin by transaction type separating domestic capped interchange from uncapped European-issued card acceptance. Twenty-eight expert interviews with merchants, fraud specialists, scheme representatives and sponsor banks established where cost and liability actually accumulate. The analysis treated inbound monitoring and interchange-plus pricing as the available routes forward.
KEY FINDINGS
  1. Slightly over half of reimbursement liability arose from the firm's receiving-side role, where it had deployed no monitoring capability at all and had assumed the exposure belonged elsewhere.
  2. European-issued card acceptance was being absorbed at a loss under blended pricing, and the affected merchants had no idea their transaction mix was unusual.
  3. Domestic debit acceptance at capped interchange was comfortably profitable, and a blanket price rise would have driven away exactly that volume first.
  4. Detection tuning had not been revised since deployment, and the firm was reimbursing claims that a current model would very likely have intercepted.
RECOMMENDED STRATEGY
Phase 1: Phase one: deploy inbound account monitoring for mule behaviour, since half the liability sits on a side nobody was watching. Phase 2: Phase two: move merchants with substantial European-issued card volume onto interchange-plus pricing that exposes the real underlying acceptance cost involved. Phase 3: Phase three: retune detection models against actual claim data rather than against the assumptions used at the original deployment date.
OUTCOME
Inbound monitoring reduced receiving-side claims within two quarters of deployment (client-reported, unverified by MMA). Interchange-plus repricing was completed for the affected merchant cohort with limited attrition. Detection retuning is under way against claim history. The blanket price rise was abandoned, having threatened the profitable domestic volume while leaving both underlying problems in place.

Frequently Asked Questions

Foundational context covering the market sizes, CAGR, scope, country, region and competition that inform every finding below. This section is provided to cover basics and most often pre-purchase conversations, answered from the MMA Primary Research Dataset.

What is the current size of the United Kingdom Payments and Settlements Market?

The market was worth 19.4 billion dollars in provider revenue in 2025, covering acquiring, bank rails, settlement, cross-border and fraud services. It reaches 20.84 billion dollars in 2026.

How large will the United Kingdom Payments and Settlements Market be by 2036?

MMA forecasts 42.55 billion dollars by 2036, an increase of 21.71 billion dollars over the 2026 base. That represents an expansion multiple of 2.04 times across the forecast period.

What is the CAGR for the United Kingdom Payments and Settlements Market 2026 to 2036?

The base case compounds at 7.4% annually. The bull case reaches 8.6% if variable recurring payments reach checkout at scale, while the bear case sits at 6.2% on higher reimbursement losses.

Which segment is growing fastest?

Account-to-account and Faster Payments services, at 11.1%, half again the market rate of 7.4%. Commercial variable recurring payments finally give bank rails a route into checkout.

Who are the major companies in the United Kingdom Payments and Settlements Market?

Worldpay, Barclays, Lloyds Banking Group, NatWest Group and Adyen lead on disclosed United Kingdom payments revenue. Stripe, Checkout.com and Wise all hold substantial specialist positions.

Which country is growing fastest?

India corridors at 9.4%, carrying remittance volume alongside rising corporate trade settlement. Non-bank providers have taken share from correspondent banking largely on foreign exchange transparency.

Report Segmentation Architecture

The full report scope spans multiple orthogonal segmentation dimensions, with cross-tabulated demand data provided for each dimension pair. Coverage extends further to regional breakdowns, trend trajectories, and the competitive detail needed to support segment-level decision-making.

By Service Type

  • Card Acquiring and Merchant Services
  • Account-to-Account and Faster Payments Services
  • High-Value and Wholesale Settlement Services
  • Cross-Border and Foreign Exchange Payment Services
  • Fraud Prevention and Payment Risk Services
  • Payment Infrastructure and Processing Services

By End-Use Industry

  • Retail and E-Commerce
  • Financial Institutions and Banking
  • Travel Hospitality and Transport
  • Public Sector and Utilities
  • Professional and Business Services
  • Gaming and Digital Content

By Commercial Dimension

  • Direct Enterprise Merchant Contracts
  • Small Business Self-Serve Onboarding
  • Independent Sales Organisation Distribution
  • Platform and Marketplace Embedded Payments
  • Sponsored Indirect Settlement Access
  • Bank Referral and Partnership Channels

By Region

  • North America
  • Western Europe
  • East Asia
  • South Asia and Pacific
  • Latin America
  • Middle East and Africa
  • Eastern Europe

Scope, Methodology, and Coverage

Every figure in this report is reproducible from documented input assumptions. The scope below maps the historical period, the forecast horizon, the segmentation dimensions, and the countries covered, alongside the underlying primary and qualitative methodology.
Historical Period
2020 to 2025
Forecast Period
2026 to 2036
Base Year
2025 (USD billions; MMA Primary Research Dataset, August 2026)
Market Definition
Scope covers revenue earned by providers of payment and settlement services to United Kingdom merchants, corporates, public bodies and financial institutions, spanning card acquiring and merchant services, account-to-account and Faster Payments initiation and processing, high-value and wholesale settlement services including sponsored indirect access, cross-border and foreign exchange payment services measured on fee and margin revenue, fraud prevention and payment risk services, and payment infrastructure and processing services supplied to institutions. Interchange revenue accruing to card issuers, consumer and business banking net interest income, lending of any form, securities clearing settlement and custody, insurance distribution, and cryptoasset trading or custody are excluded from the market size and all derived figures.
Quantitative Units
USD billions of provider revenue (current prices); transaction volumes in billions; interchange and scheme fee rates as percentage of transaction value; settlement values in GBP billions; reimbursement claim values in GBP
Segmentation Dimensions
By Service Type; By End-Use Industry; By Commercial Dimension; By Region
Regions Covered
North America, Western Europe, East Asia, South Asia and Pacific, Latin America, Middle East and Africa, Eastern Europe
Countries Covered
United Kingdom, with counterparty flows analysed across USA, Ireland, Germany, France, Netherlands, India, China, Australia, Poland, Nigeria, Spain, Italy, Japan, Brazil, United Arab Emirates
Key Companies Profiled
Worldpay, Barclays, Lloyds Banking Group, NatWest Group, Adyen, HSBC UK, Santander UK, Nationwide Building Society, Nexi, Global Payments, Elavon, Stripe, PayPal, Checkout.com, Wise, Revolut, GoCardless, Form3, Vocalink, Bottomline Technologies
Quantitative Methodology
Primary survey, n=3,800 respondents, Q4 2025, six countries; demand-side model with trade association cross-validation
Qualitative Methodology
47 expert interviews, Q4 2025; applied to validate demand model assumptions, identify emerging dynamics, and assess competitive positioning
Report Format
PDF and XLSX data workbook (Word format preview document)
Publisher
Market Minds Advisory
Report Code
MMA-2026-TEC-151
Published
August 2026
Contact
sales@marketmindsadvisory.com | www.marketmindsadvisory.com

Purchase the full United Kingdom Payments and Settlements Market Report (2026 to 2036).

The full report runs to 195 pages and covers all six service type segments, seven counterparty regions and 20 profiled providers in detail. It includes the complete segment CAGR set, reimbursement liability modelled by institution size, and rail migration economics comparing card acquiring against account-to-account revenue per transaction. Company profiles carry evaluation on disclosed United Kingdom payments and merchant services revenue, with moat and risk assessment for the top five providers. The competitive section extends to 15 tracked regulatory, infrastructure and commercial developments across 2024 and 2025. Primary research inputs include a quantitative survey of 3,800 respondents and 47 expert interviews conducted in Q4 2025.
Six service type segments with individual CAGR forecasts
Seven counterparty regions with corridor flow and growth comparison
Twenty provider profiles on consistent revenue evaluation basis
Fifteen tracked regulatory and infrastructure developments with commercial interpretation
Reimbursement liability modelled by institution size and role
Rail migration economics compared across card and bank transactions

Built For The People Who Decide

From boardroom strategy to bench-side execution, this report is read cover-to-cover by leaders shaping the next decade of their industry, turning demand scenarios, market dynamics and valuation benchmarks into decisions.
CXOs/ Presidents/ VPs/ Managers
M&A and Corporate Development
Strategy Teams and R&D Heads
Procurement and Product Directors
Regulatory and Compliance Leaders
Investor Relations and Equity Analysts