Market Minds Advisory
Demand for Interactive Projector in the UK

Demand for Interactive Projector in the UK: Demand for Interactive Projector in the UK. Hybrid Classroom and Meeting Room Refresh Cycles Sustain a Mature Category

Schools and enterprises across the UK replacing ageing displays are weighing interactive projectors against flat panel alternatives, forcing vendors to justify continued relevance through cost and space flexibility advantages nationally each year.

Lead Analyst

Published

September 2026

Make Smarter Decisions with Customized Research Insights

Request a free sample report and evaluate market opportunities, growth trends, and competitive dynamics relevant to your business needs.

2025 MARKET VALUE$0.3BMarket Size 2025
2036 FORECAST VALUE$0.6BBase Case , 2026 to 2036
CAGR 2026 TO 20366.5 %Bull 7.7% / Bear 5.2%
INCREMENTAL OPPORTUNITY$0.3BNet 10- year value creation
EXPANSION MULTIPLE1.88x2036 value over 2026 base
Strategic Levers
M&A Pipeline
Regional Outlook
Country Rankings
Competitive Intelligence
Segmental Deep-dive
Call-Us : 91 93563 13602

Executive Snapshot and Market Trajectory.

Schools and enterprises across the United Kingdom replacing ageing classroom and meeting room displays are increasingly weighing interactive projectors against flat panel alternatives, and that competitive comparison is now the dominant factor shaping vendor positioning and refresh cycle timing across the category this year.
Demand concentrates among state schools and universities managing large classroom refresh programmes alongside corporate offices upgrading hybrid meeting room technology, while interactive whiteboard integration systems are growing fastest as institutions bundle projector hardware with software collaboration tools rather than purchasing standalone display equipment. Education sector procurement drives the largest share of national demand, reflecting sustained government classroom technology funding cycles across primary and secondary schools specifically. This shift is visible in vendor tender win patterns.
Competitive structure remains fairly concentrated among a handful of established projector manufacturers defending long-standing education and enterprise procurement relationships built over multiple product generations. Buyers increasingly expect vendors to demonstrate genuine touch overlay accuracy and software integration depth rather than projection brightness alone, reshaping vendor evaluation criteria faster than several smaller vendors anticipated when the category still competed primarily on lumens and resolution specifications. Vendor rankings have shifted as criteria evolve.
Market Definition
This market covers interactive projector hardware, touch overlay systems, and associated integration software sold for classroom, meeting room, and training environment use within the United Kingdom, including ultra-short-throw, short-throw, and standard-throw configurations. It excludes non-interactive standard projectors without touch or annotation capability, and flat panel interactive display products that do not use projection technology.
Base Year Value
$0.3B in 2025 (MMA Primary Research Dataset, September 2026)
Forecast Period
2026 to 2036, eleven discrete annual values
CAGR
6.5% base case. Bull 7.7%. Bear 5.2%.
Fastest Growth Segment
Interactive Whiteboard Integration Systems: 11.0% CAGR
Fastest Growth Country
United Kingdom: 6.5% CAGR
Fastest Growth Region
South Asia and Pacific: 8.3% CAGR
Largest Region
Western Europe: 82% of 2025 global value
Market Leaders
Seiko Epson Corporation, BenQ Corporation, Optoma Technology Inc., ViewSonic Corporation, Panasonic Corporation. Source: MMA Analysis based on company annual reports and primary research.
Primary Survey
n=3,800 procurement and R&D decision-makers, Q4 2025, six countries
Methodology
Demand-side build-up, cross-validated against public data, 47 expert interviews

Demand for Interactive Projector in the UK Market Forecast Scenarios

united-kingdom-interactive-projector-market-size-forecast-scenario-1788425088812
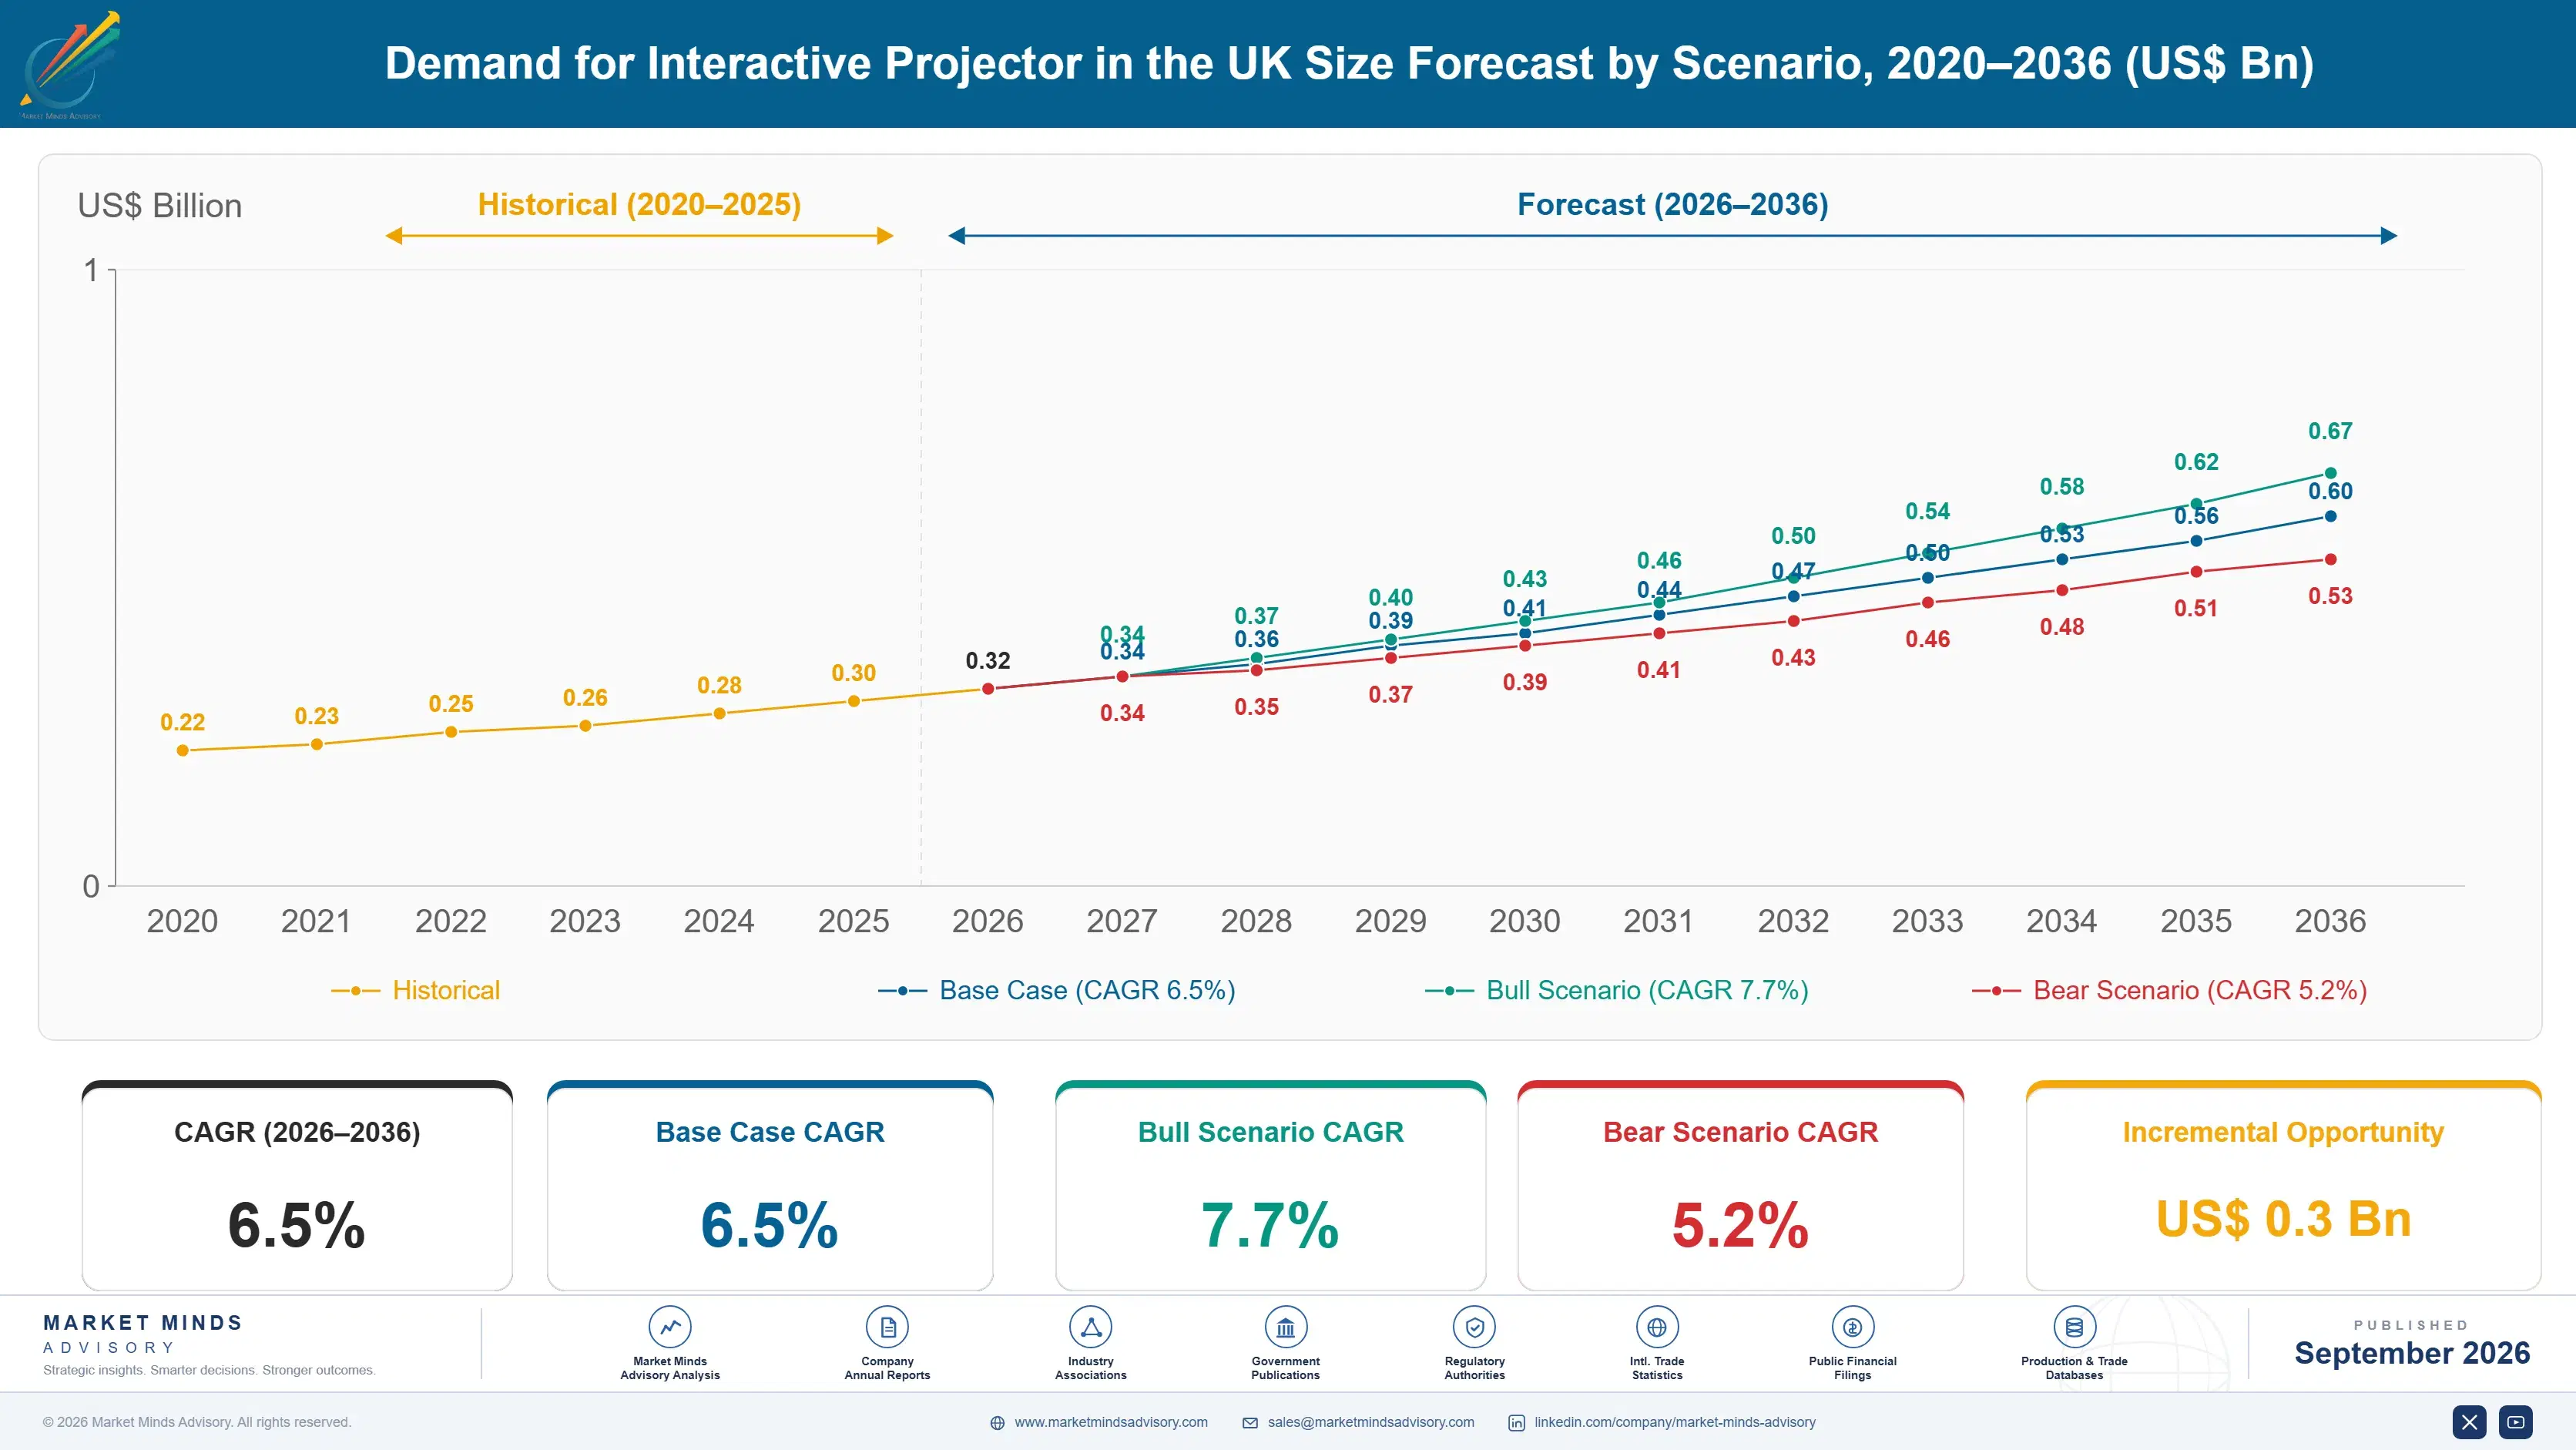
Between 2020 and 2025 the category grew modestly as schools and enterprises resumed technology refresh programmes delayed during pandemic-era budget constraints, with growth remaining steady rather than accelerating sharply as flat panel displays captured a growing share of new installations across both education and corporate buyers. This pattern held broadly consistent across the period. Momentum built gradually rather than in a single sharp inflection point.
The base case assumes continued modest growth driven by three mechanisms: sustained government classroom technology funding cycles supporting periodic school projector replacement across the state education sector, growing enterprise demand for ultra-short-throw configurations in space-constrained meeting rooms where flat panel installation proves impractical, and rising bundled software integration that increases average transaction value even as unit volume growth remains limited. These three mechanisms compound fastest among institutions managing large multi-room refresh programmes across several campus locations simultaneously.
A bull scenario turns on government classroom technology funding increasing faster than currently budgeted, pulling forward school procurement cycles nationally. The bear risk is flat panel interactive displays continuing to capture greater share of new installations across both education and corporate buyers, compressing projector unit volume growth below currently forecast levels regardless of any near-term funding increase.

A Mature Category Defends Its Space and Cost Advantage

Two forces are shaping this category at once: sustained but modest replacement demand tied to institutional refresh cycles rather than expanding unit volume, and rising competition from flat panel interactive displays that increasingly win new installations where budget and space allow for either technology. Together these are pulling vendor engineering investment toward ultra-short-throw configurations and bundled software differentiation rather than simple brightness and resolution improvements that historically defined competitive positioning.
MARKET CONCENTRATIONCR5 54%Reflects a fairly concentrated national projector vendor category
AVERAGE UNIT PRICEGBP 620 per installed unitBlended across ultra-short-throw and standard-throw configurations broadly nationally
EDUCATION SECTOR SHARE58% of national unit volumeReflects concentrated procurement across primary and secondary schools
ULTRA-SHORT-THROW PENETRATION41% of new installationsShare of new units specifying ultra-short-throw designs nationally
AVERAGE REPLACEMENT CYCLE7 years per installed unitTypical time between institutional projector replacement decisions nationally
BUNDLED SOFTWARE ATTACH RATE46% of new unit salesShare of new units sold with integrated collaboration software
Commercially, the market behaves like a mature, replacement-driven category defending its remaining addressable installations against a genuine substitute technology rather than expanding into meaningfully new use cases. Buyers evaluate vendors heavily on total installation cost and space flexibility relative to flat panel alternatives, creating real switching consideration at nearly every institutional refresh decision point across the country.
Over the next decade, expect interactive projectors to retain a durable but shrinking share of total classroom and meeting room display installations nationally, concentrated increasingly in space-constrained rooms where flat panel installation proves genuinely impractical rather than simply less preferred. Vendors that build genuine ultra-short-throw engineering depth alongside strong software integration will retain a disproportionate share of the category's remaining value as flat panel substitution continues across less space-constrained installations.
"Nobody buys a projector because they love projectors anymore. They buy one because the room genuinely will not fit a flat panel of the size they actually need."
Director, Education and Enterprise Display Technology Practice · MMA Technology Practice · September 2026

Market Trends

Ultra-Short-Throw Designs Defend the Smallest Rooms

Vendors are concentrating engineering investment on ultra-short-throw configurations specifically because these designs retain a genuine installation advantage in space-constrained classrooms and meeting rooms where flat panel displays of comparable size cannot physically fit or would block circulation space. MMA's Q4 2025 primary research found forty one percent of new United Kingdom interactive projector installations now specifying ultra-short-throw configurations, up meaningfully from a smaller share three years earlier, as institutions increasingly recognised the category's remaining genuine advantage over flat panel alternatives. This shift is concentrating vendor competition specifically around the installations where projectors retain real differentiation.
Market Impact: Drives 63% of new education purchases
Bundled Software Integration Increases Average Transaction Value

Vendors are increasingly bundling collaboration and annotation software directly with projector hardware sales, increasing average transaction value even as unit volume growth remains limited by flat panel substitution and mature institutional refresh cycles. MMA's expert interview programme found procurement officers citing integrated software capability, not hardware specification alone, as an increasingly important purchase criterion distinguishing competing projector vendor proposals during institutional tender processes. This shift favours vendors that invested early in proprietary collaboration software rather than relying on third-party integration partners. Procurement bodies increasingly request bundled software demonstrations as a standard part of the tender evaluation process.
Market Impact: Sustains demand across 34% of enterprises

Market Opportunities and Growth Drivers

Government Classroom Technology Funding Sustains Replacement Cycles

Continued government classroom technology funding allocated to state schools is sustaining periodic projector replacement across the primary and secondary education sector, providing a predictable, government-backed demand base that private sector installations lack given typically more discretionary corporate technology budgets. Surveyed education procurement officers linked sixty three percent of new interactive projector purchases directly to allocated government classroom technology funding cycles rather than discretionary institutional budget decisions, according to MMA's Q4 2025 primary research programme covering United Kingdom education buyers. This funding-driven demand is sustaining unit volume even as flat panel substitution accelerates in less funding-constrained corporate settings.
Market Impact: Cuts addressable installations by 8 percent

Space-Constrained Meeting Rooms Sustain Enterprise Demand

Continued prevalence of space-constrained meeting rooms across older commercial office buildings is sustaining enterprise demand for ultra-short-throw interactive projectors specifically, since flat panel displays of comparable visible screen size genuinely cannot be installed in many older building layouts without extensive renovation. Announced office refurbishment plans tracked in MMA's primary research programme remained limited through 2025, sustaining reliance on projector-based solutions across older building stock unable to accommodate larger flat panel installations. Enterprises in these buildings increasingly treat ultra-short-throw projectors as the only practical display upgrade path available to them. Facilities managers increasingly treat this as a default upgrade path.
Market Impact: Limits volume growth 4 points

Market Restraints and Challenges

Flat Panel Interactive Displays Continue Capturing New Installations

Flat panel interactive displays continue capturing a growing share of new classroom and meeting room installations where budget and physical space allow for either technology, directly constraining interactive projector unit volume growth across the category nationally. The root cause is that flat panels offer brighter, more consistent image quality without bulb replacement or calibration maintenance projectors require. The commercial impact concentrates projector demand increasingly into space-constrained installations where flat panels cannot fit, shrinking the category's addressable market steadily over time. Several vendors are responding by emphasising total cost of ownership and space flexibility in proposals.
Market Impact: Lifts ultra-short-throw share 41 points

Extended Replacement Cycles Limit Annual Unit Volume

Extended seven year average replacement cycles for institutional interactive projector installations are limiting annual unit volume growth, since most schools and enterprises replace equipment only when it fails or becomes clearly obsolete rather than on a predictable shorter refresh schedule that would generate more consistent annual demand. The root cause is that budget-constrained buyers generally maximise equipment lifespan rather than pursue early replacement. The commercial impact limits vendor revenue predictability and concentrates sales activity around periodic large-scale institutional tender cycles. Vendors are responding with extended service contracts that generate more predictable recurring revenue.
Market Impact: Adds 11.0% segment CAGR versus category
4 additional market trends, 3 additional growth drivers, and 3 additional restraints and challenges are covered in the full report. Contact sales@marketmindsadvisory.com to access the complete intelligence.

Segment CAGR and Growth Architecture

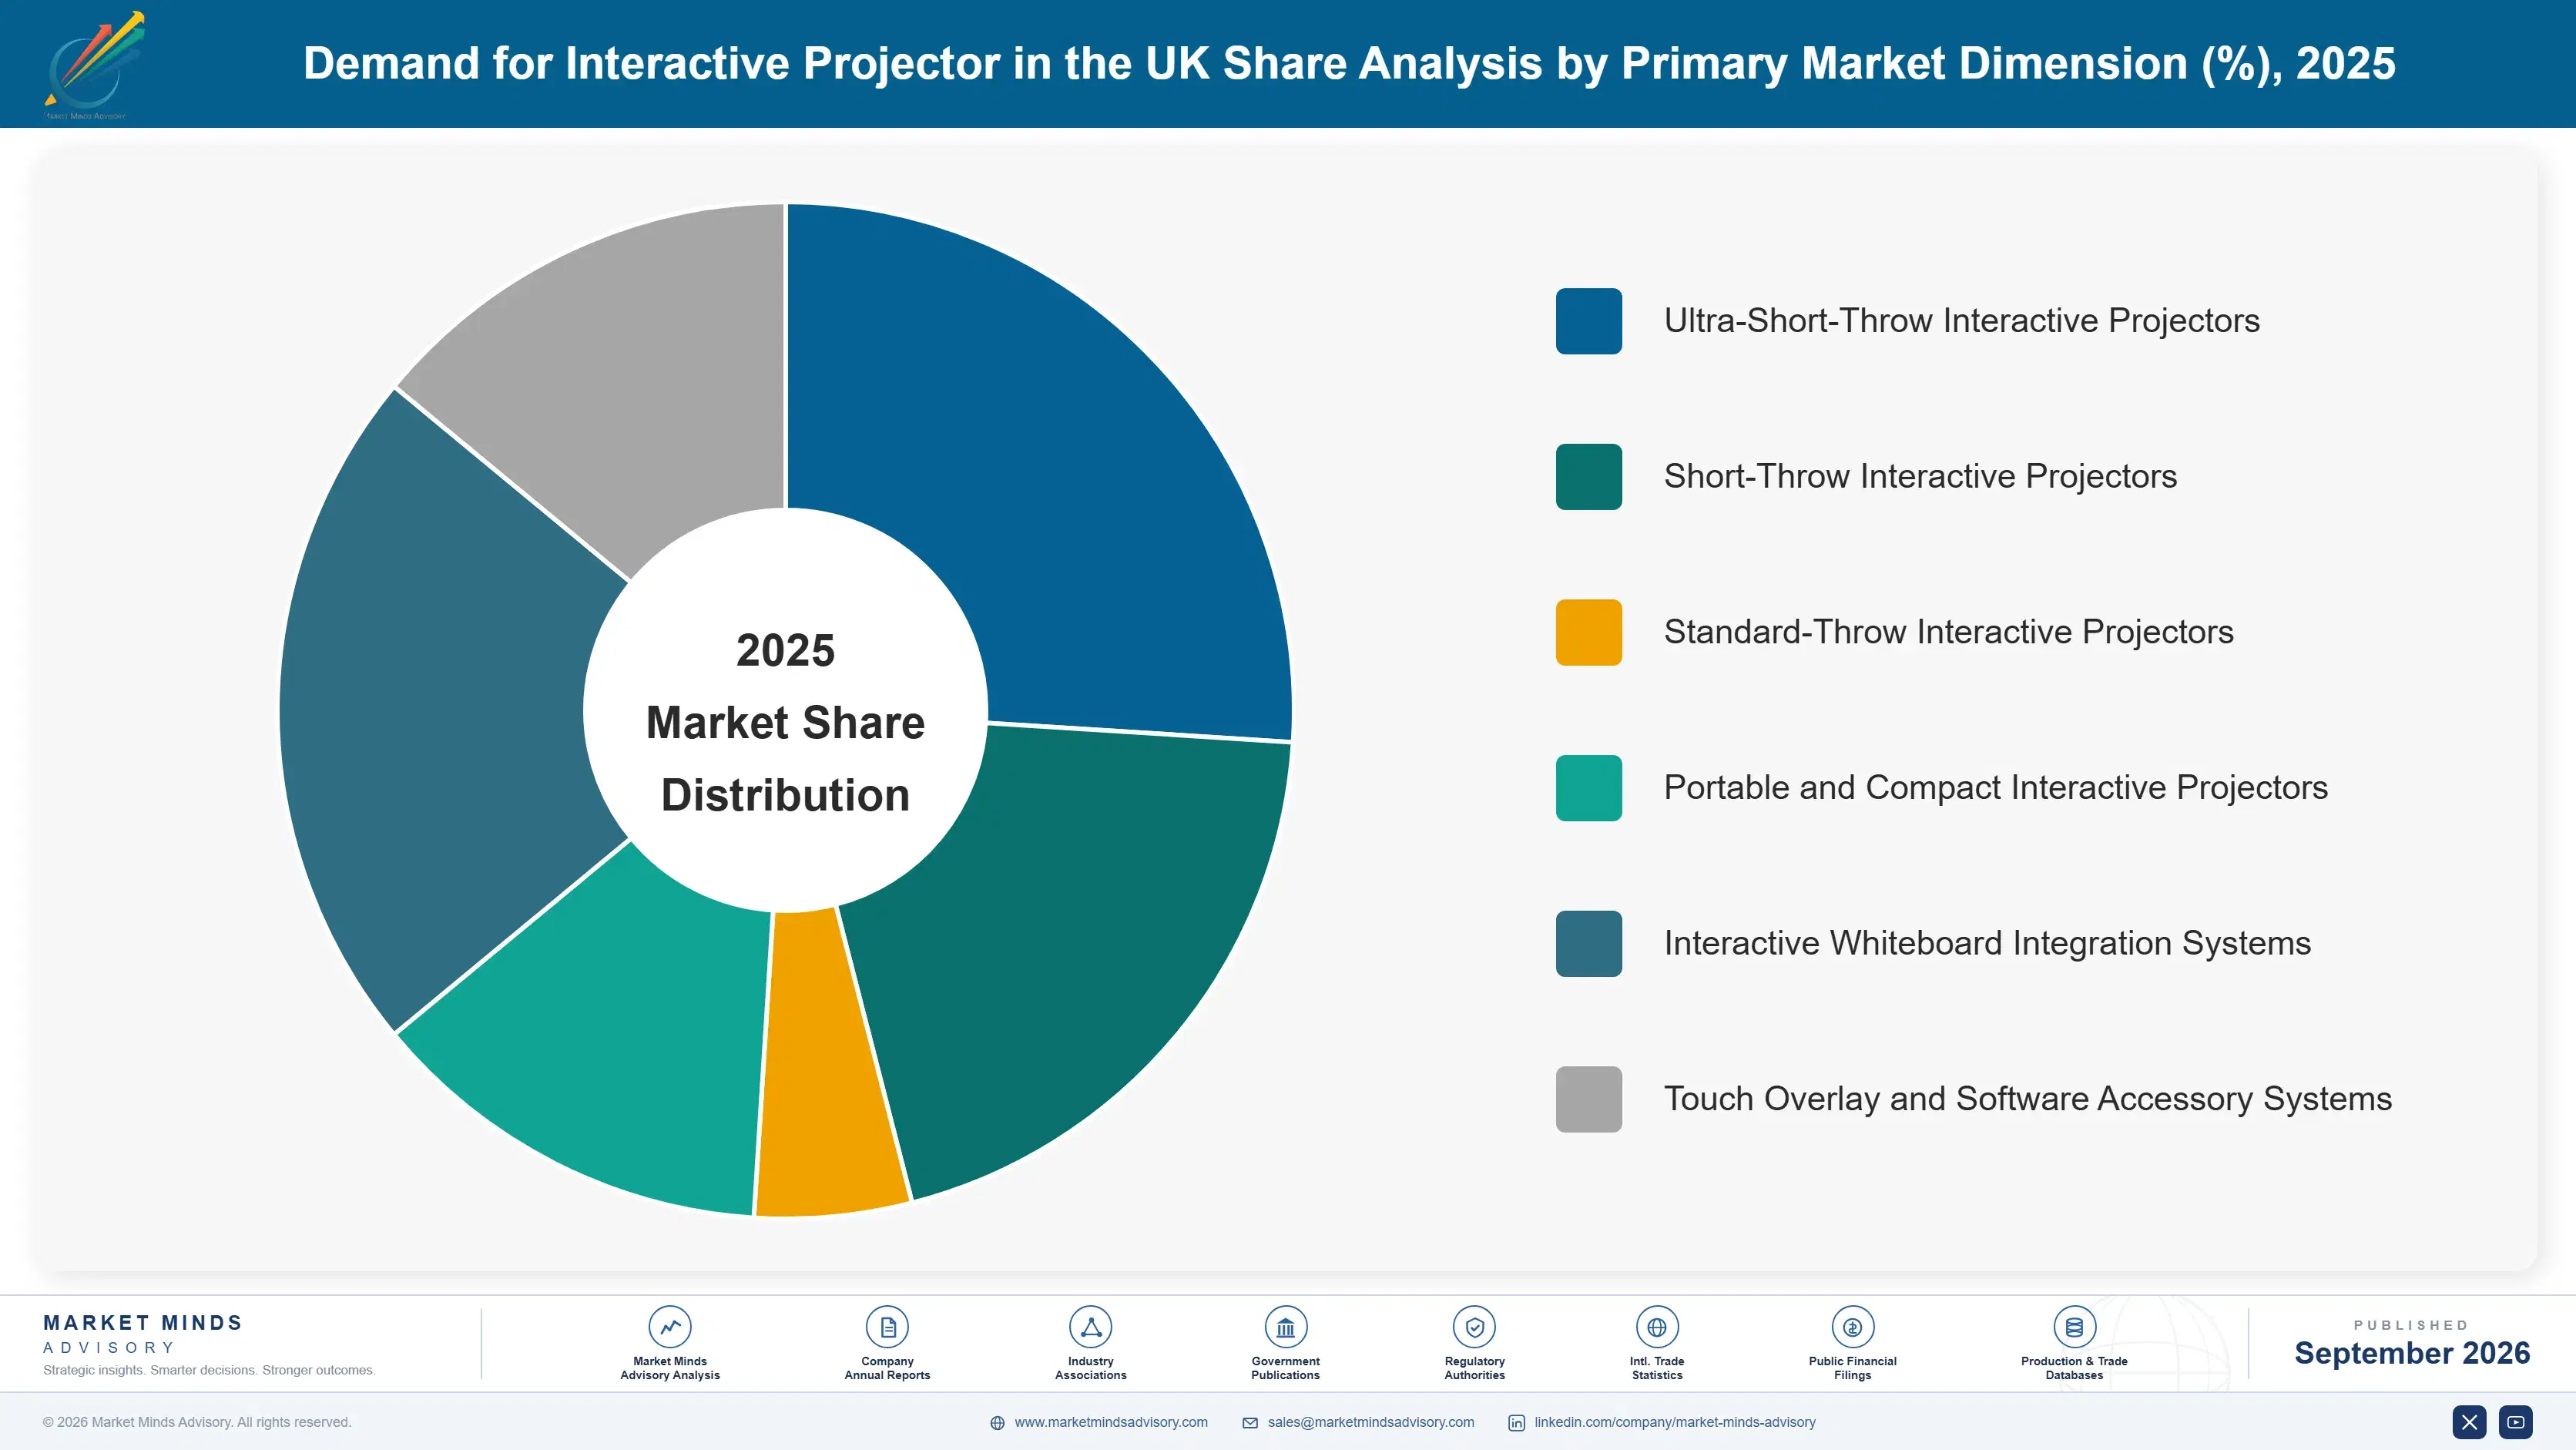
Segmentation follows product and technology dimension, since that best explains both vendor engineering investment and institutional procurement behaviour, spanning standard-throw configurations through to newer ultra-short-throw and software integration categories, reflecting how institutions organise procurement decisions and vendor evaluation criteria across every configuration and software tier nationally. reflecting a single classification logic applied consistently throughout this analysis.
united-kingdom-interactive-projector-market-market-share-analysis-1788425089353

Interactive Whiteboard Integration Systems

This segment covers bundled hardware and software packages combining interactive projector units with dedicated collaboration and annotation software platforms, distinct from standalone projector hardware sold without integrated software capability that institutions must separately procure and configure. Adoption is concentrated among schools and enterprises seeking a unified procurement solution rather than separately sourcing projector hardware and third-party collaboration software from different vendors. Growth is outpacing every other segment in this report because institutions are increasingly consolidating technology procurement into fewer, more integrated vendor relationships, creating demand for bundled solutions that grew from a smaller base than standalone hardware sales this year specifically. Multi-academy trusts in particular are standardising on bundled packages to simplify procurement across their entire school estate.
CAGR 11.0%

Ultra-Short-Throw Interactive Projectors

This segment covers projector units designed to mount extremely close to the projection surface, minimising shadow interference and enabling installation in rooms too small for standard-throw or flat panel alternatives, distinct from standard-throw and short-throw configurations that require greater distance between the unit and projection surface. Demand is rising as institutions increasingly recognise this configuration as the category's clearest remaining differentiation against flat panel substitution in space-constrained rooms. Growth trails the software integration segment only because ultra-short-throw adoption, while accelerating steadily, builds on an already larger existing installed base relative to the newer, faster-scaling bundled software category specifically. Corporate facilities teams increasingly specify these units too, extending demand beyond the segment's original education-only focus this year.
CAGR 9.5%
Full segment breakdown across 6 segments available in the complete report.

Regional Architecture and Country Demand Map

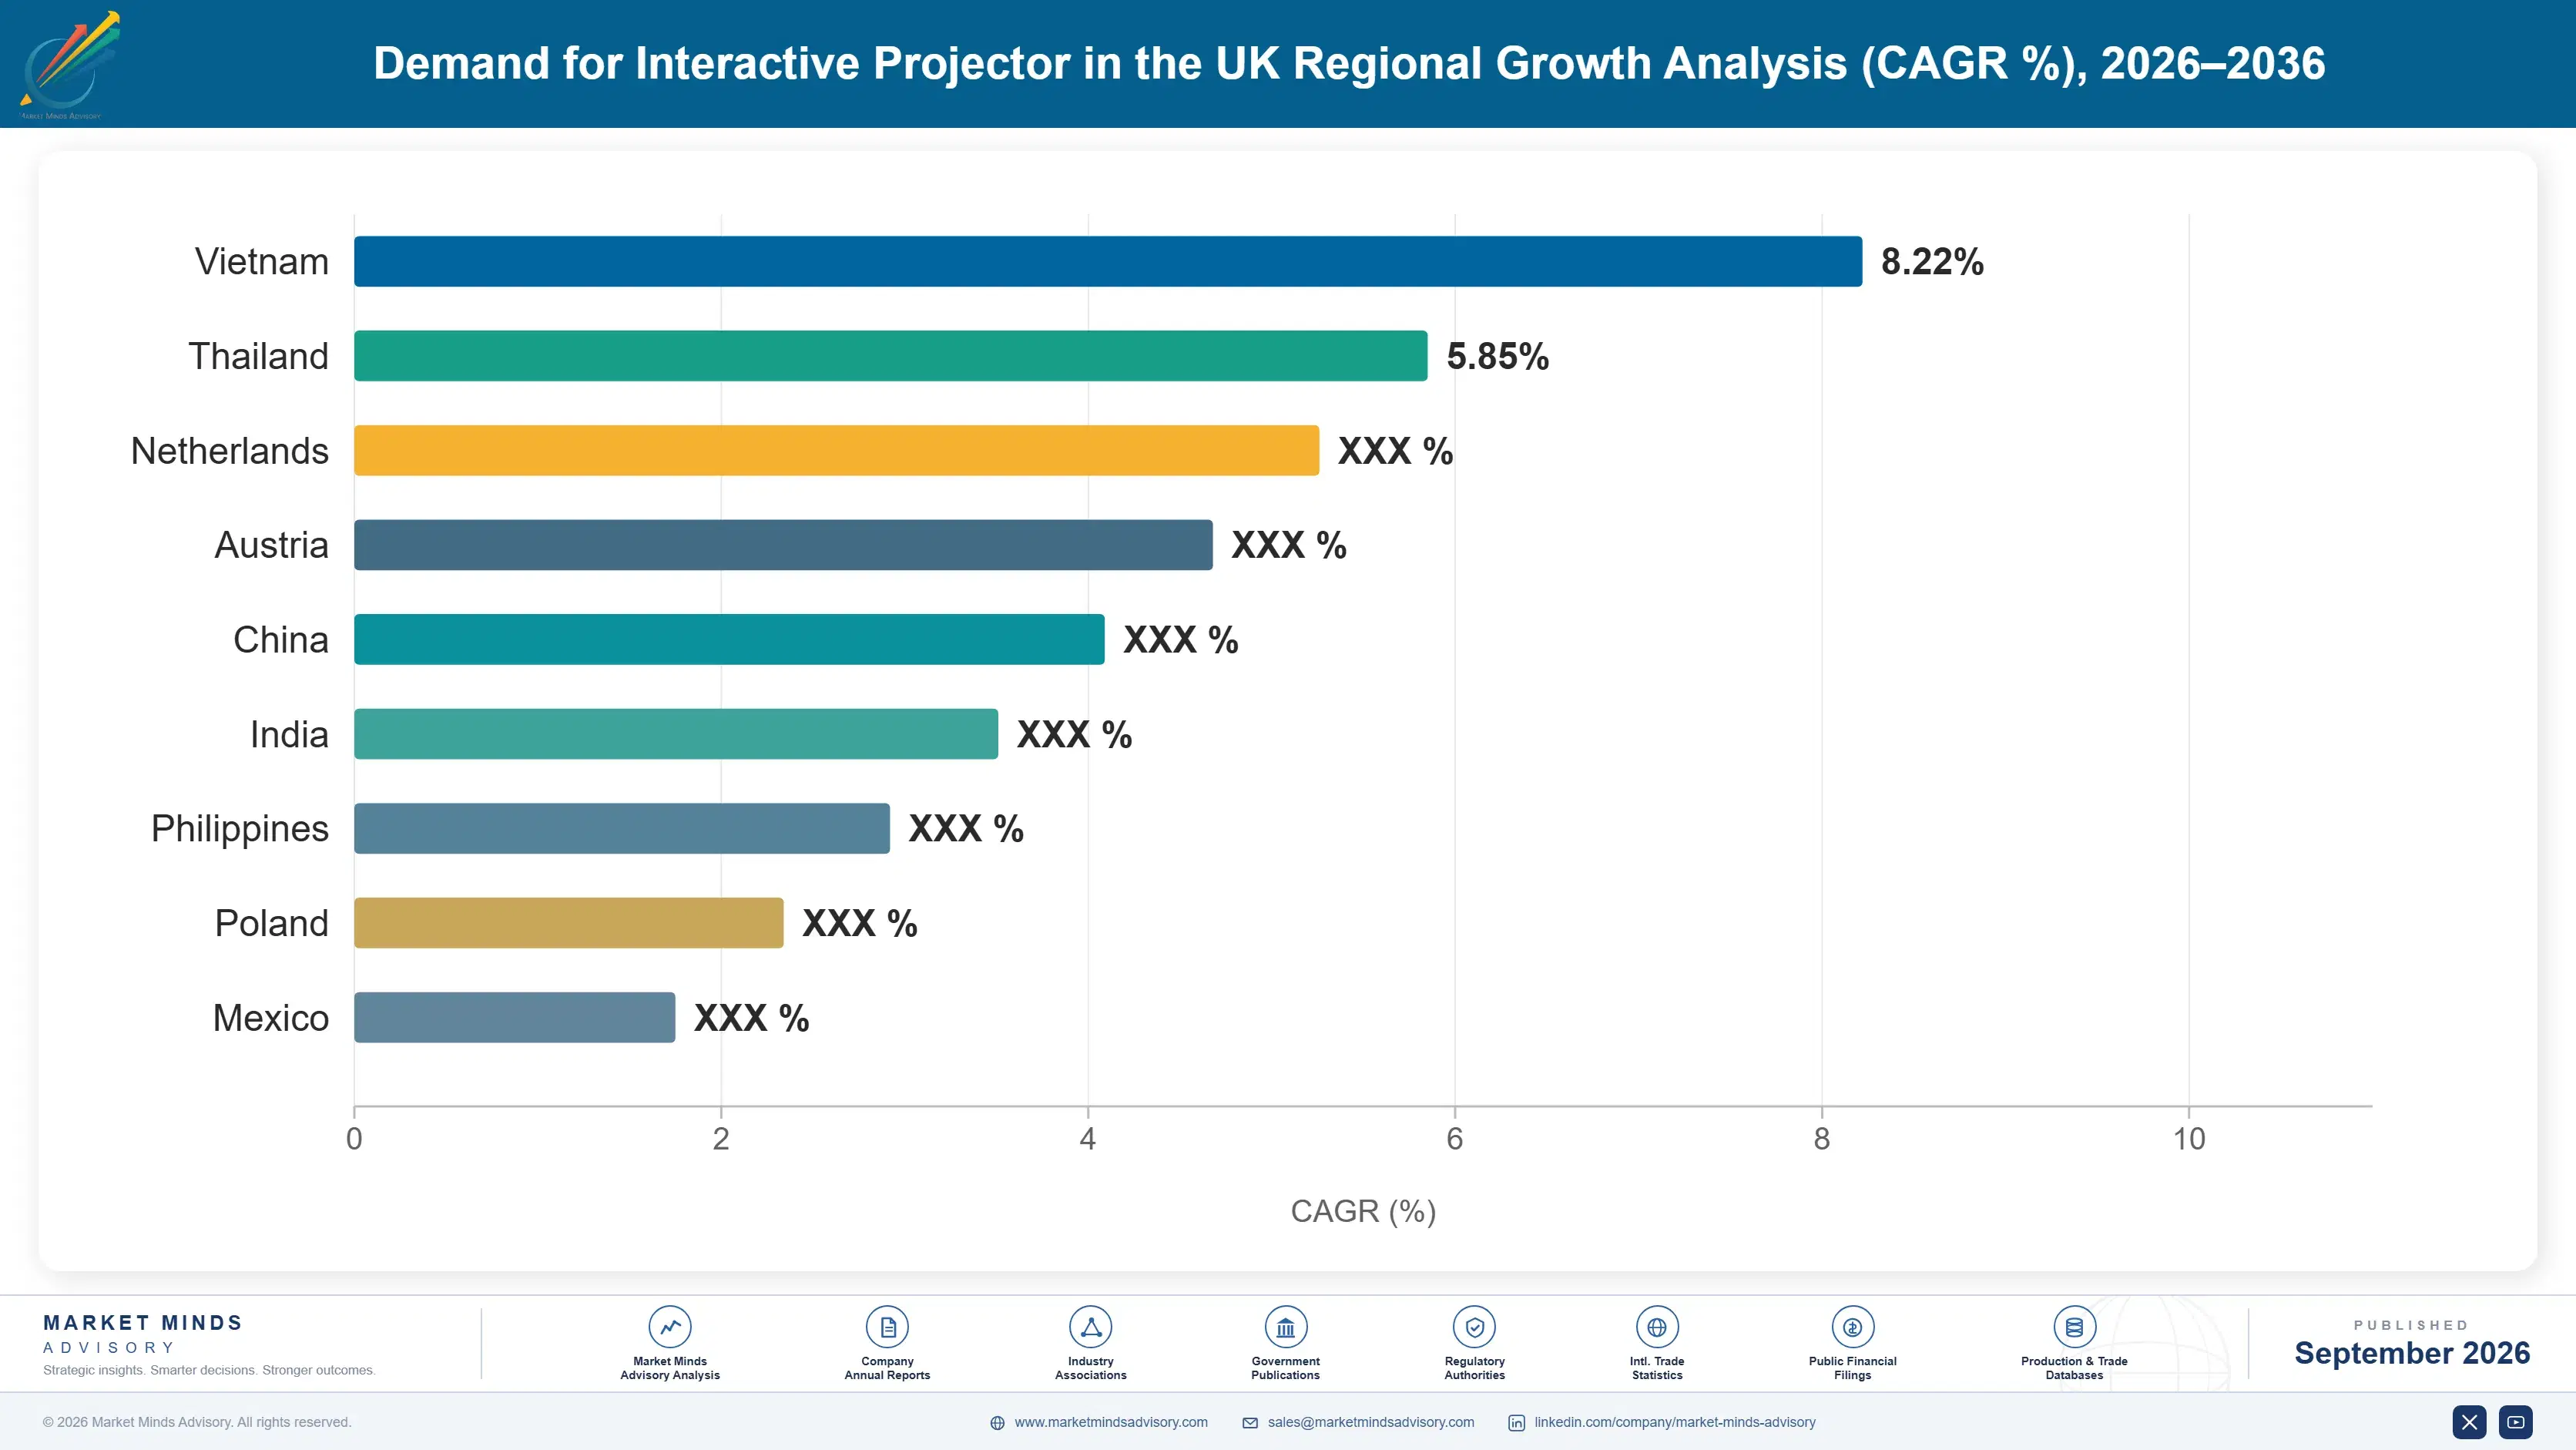
This report's scope is the United Kingdom's domestic interactive projector market specifically, so Western Europe carries an overwhelmingly dominant share reflecting that scope, while the other six regions capture only incidental United Kingdom-linked activity across nearly every institutional and vendor relationship type tracked here. specifically.

Western Europe

The United Kingdom represents the entire defined scope of this report, and Western Europe's share reflects that scope definition directly rather than a standard regional demand comparison against other European countries. England's state school system, the largest single institutional buyer segment nationally, drives the majority of total national unit volume through periodic government-funded classroom technology refresh programmes across primary and secondary schools. Scotland and Wales contribute smaller but steady shares tied to comparable devolved education technology funding structures. This region's share sits far above the report's typical band by design, since the report's entire quantified scope is the United Kingdom specifically rather than the wider Western European market this regional label would normally represent in other MMA reports.
Share: 82% | CAGR: 5.2% (2026 to 2036)

North America

United States and Canadian corporate offices operated by United Kingdom-headquartered vendor sales and support teams generate a small residual volume of interactive projector activity tracked incidentally alongside the report's core United Kingdom scope. These figures should not be read as reflecting genuine independent North American interactive projector demand, which falls entirely outside this report's United Kingdom-specific scope and would require separate regional coverage to assess properly. These operations are staffed by small teams supporting United Kingdom vendor sales channels rather than generating independent domestic demand of their own. Any apparent growth here reflects United Kingdom vendor channel expansion rather than genuine North American institutional demand, which this report does not size independently.
Share: 5% | CAGR: 5.5% (2026 to 2036)
Regional intelligence for 5 additional markets available in the complete report: East Asia, South Asia and Pacific, Latin America, Middle East and Africa, Eastern Europe. Contact sales@marketmindsadvisory.com.
united-kingdom-interactive-projector-market-country-cagr-analysis-1788425089893

Where Projector Vendors Can Still Defend Margin

Four commercial levers separate vendors defending durable premium pricing from those competing purely on unit hardware cost, spanning ultra-short-throw engineering depth, proprietary software integration, extended service contract attachment, and total cost of ownership positioning, since vendors mastering more than one dimension typically outperform single-lever competitors by a wide margin over multi-year contracts. for most vendors in this category.

Building Proven Ultra-Short-Throw Engineering Depth Further

Vendors that built proven ultra-short-throw engineering capability, validated across demanding space-constrained institutional installations, are winning a disproportionate share of remaining new installations from buyers with genuine space constraints that flat panel alternatives cannot accommodate. Vendors with demonstrated ultra-short-throw expertise reported win rates roughly 24 percent higher than vendors offering only standard-throw configurations. The approach requires sustained optical engineering investment that smaller vendors sometimes cannot justify given the category's overall shrinking unit volume trajectory. Smaller vendors attempting similar claims without comparable optical investment often lose credibility once buyers request supporting evidence directly.
Market Impact: Lifts win rate meaningfully by 24 points overall

Developing Proprietary Software Platforms and Tools

Vendors that developed proprietary collaboration and annotation software platforms are winning bundled sales at meaningfully higher average transaction value than vendors relying entirely on third-party software integration partners for comparable functionality. This lever requires sustained software development investment that hardware-focused vendors have often not prioritised historically. Vendors with proprietary software platforms reported average transaction values roughly 31 percent above comparable hardware-only sales of similar unit specification. This gap tends to widen further once buyers directly compare bundled proposals against hardware-only alternatives in tender evaluations. Vendors without comparable software often struggle to justify premium pricing during procurement negotiations.
Market Impact: Lifts transaction value meaningfully by 31 points overall

Attaching Extended Service and Maintenance Contracts

Vendors that built dedicated extended service and maintenance contract offerings are capturing meaningful recurring revenue between major institutional replacement cycles, offsetting some of the unit volume pressure flat panel substitution creates across the broader category. This lever requires service delivery infrastructure that smaller vendors focused purely on hardware sales sometimes have not built. Vendors with attached service contracts reported recurring revenue per installed unit roughly 2 to 3 times higher than vendors selling hardware alone without ongoing service attachment. Vendors without dedicated service infrastructure often struggle to compete for the same recurring revenue opportunity regardless of hardware quality.
Market Impact: Wins 2 to 3 times more recurring revenue

Positioning Total Cost of Ownership Against Flat Panels

Vendors that built credible total cost of ownership comparisons demonstrating genuine installation and lifecycle cost advantages against flat panel alternatives are winning procurement decisions that would otherwise default toward flat panel displays given their perceived image quality advantage. This lever requires procurement-facing sales expertise that vendors historically selling on brightness specifications alone have not always developed. Vendors with credible total cost of ownership positioning reported win rates roughly 19 percent higher in head-to-head flat panel comparison tenders specifically. Vendors lacking this procurement-facing expertise often lose tenders despite offering technically comparable hardware specifications.
Market Impact: Lifts tender win rate meaningfully by 19 points

Who Controls the Margin Pool

CR5 sits at fifty four percent, evaluated on disclosed United Kingdom interactive projector segment revenue across the top vendors, reflecting a fairly concentrated category dominated by a handful of established manufacturers defending long-standing education and enterprise procurement relationships built over multiple product generations. The gap between the largest vendors and smaller challengers is meaningful given the institutional tender relationship history incumbents have accumulated.
Current competitive activity centers on three fronts: building proven ultra-short-throw engineering depth to win the category's remaining genuinely differentiated installations, developing proprietary collaboration software platforms to increase average transaction value, and positioning credible total cost of ownership comparisons against flat panel alternatives in competitive tenders. Price competition remains most intense among standard-throw configurations while ultra-short-throw and software-bundled offerings increasingly compete on engineering depth and total cost positioning.

Emerging pressure is building from two directions. Flat panel interactive display manufacturers are entering education and enterprise tenders directly, threatening projector vendors first in standard-sized rooms where either technology fits comfortably. At the innovation end, specialised collaboration software vendors are attracting renewed interest from hardware manufacturers seeking bundling partnerships, a dynamic that could meaningfully reorder segment positioning as software differentiation becomes a larger share of competitive advantage.
united-kingdom-interactive-projector-market-company-positioning-matrix-1788425090422

Competitive Moat and Risk Dimensions

SEIKO EPSON CORPORATION

Moat: Established Education Sector Relationships

Epson's decades-long relationships with United Kingdom education procurement bodies and school technology resellers give it a tender credibility advantage that newer entrants cannot easily replicate without comparable institutional relationship history built over multiple procurement cycles. This history is difficult for newer entrants to replicate quickly regardless of available marketing budget.
SEIKO EPSON CORPORATION

Risk: Flat Panel Substitution Exposure

Epson faces meaningful revenue exposure to continued flat panel substitution in standard classroom and meeting room installations, since its core hardware portfolio depends on institutions continuing to choose projection technology over increasingly competitive flat panel alternatives. This exposure could compress volume meaningfully over the next several years industry-wide.
BENQ CORPORATION

Moat: Strong Ultra-Short-Throw Product Depth

BenQ's established ultra-short-throw product portfolio and optical engineering track record give it credibility with buyers specifically seeking the category's most space-efficient configurations, an advantage newer entrants cannot easily replicate without comparable engineering investment history. This credibility is difficult for generalist competitors to replicate quickly without comparable optical investment history.
BENQ CORPORATION

Risk: Limited Proprietary Software Portfolio

BenQ's comparatively limited proprietary collaboration software portfolio leaves it more dependent on third-party integration partnerships than competitors building owned platforms, potentially limiting its ability to capture bundled software transaction value directly. This gap could cost meaningful transaction value as bundled software becomes a larger share of category competition.

Players Tracked

Prominent Players

Seiko Epson Corporation
BenQ Corporation
Optoma Technology Inc.
ViewSonic Corporation
Panasonic Corporation

Other Key Players

Sony Corporation
Sharp NEC Display Solutions Ltd
Hitachi Ltd
Casio Computer Co Ltd
InFocus Corporation
Christie Digital Systems USA Inc
Barco NV
Vivitek Corporation
Promethean Limited
SMART Technologies ULC
Boxlight Corporation
Newline Interactive Inc
Ricoh Company Ltd
Acer Inc
LG Electronics Inc

Recent Developments

JANUARY 2026

Epson Launches Bundled Collaboration Software Platform for UK Schools

Epson launched a bundled collaboration software platform specifically for the United Kingdom education market, extending its ultra-short-throw projector portfolio with integrated annotation and lesson planning tools across the wider education sector, ahead of increasing school procurement demand for unified hardware and software solutions. across the wider category.
Signal: Confirms established vendors racing to build proprietary software as a core competitive differentiator across the industry.
OCTOBER 2025

BenQ Signs Multi-Year Framework Agreement With UK Education Procurement Body

BenQ signed a multi-year framework agreement with a United Kingdom education procurement body covering ultra-short-throw projector supply across participating state schools and additional procurement frameworks nationally, securing long-term volume commitment tied to the body's phased classroom technology refresh schedule through the decade. across the wider category.
Signal: Signals large education framework agreements remaining a key competitive lever across the broader vendor landscape this year.
JUNE 2025

ViewSonic Acquires UK Collaboration Software Startup ClassLink Interactive

ViewSonic completed the acquisition of United Kingdom collaboration software startup ClassLink Interactive, adding annotation and lesson management software capability intended to strengthen its bundled offering across its wider United Kingdom customer base ahead of increasing procurement demand for integrated hardware and software solutions. This deal broadens its software depth considerably.
Signal: Indicates software acquisition activity accelerating among established hardware manufacturers going forward across the category. specifically. broadly.

Optical Component and Display Panel Exposure

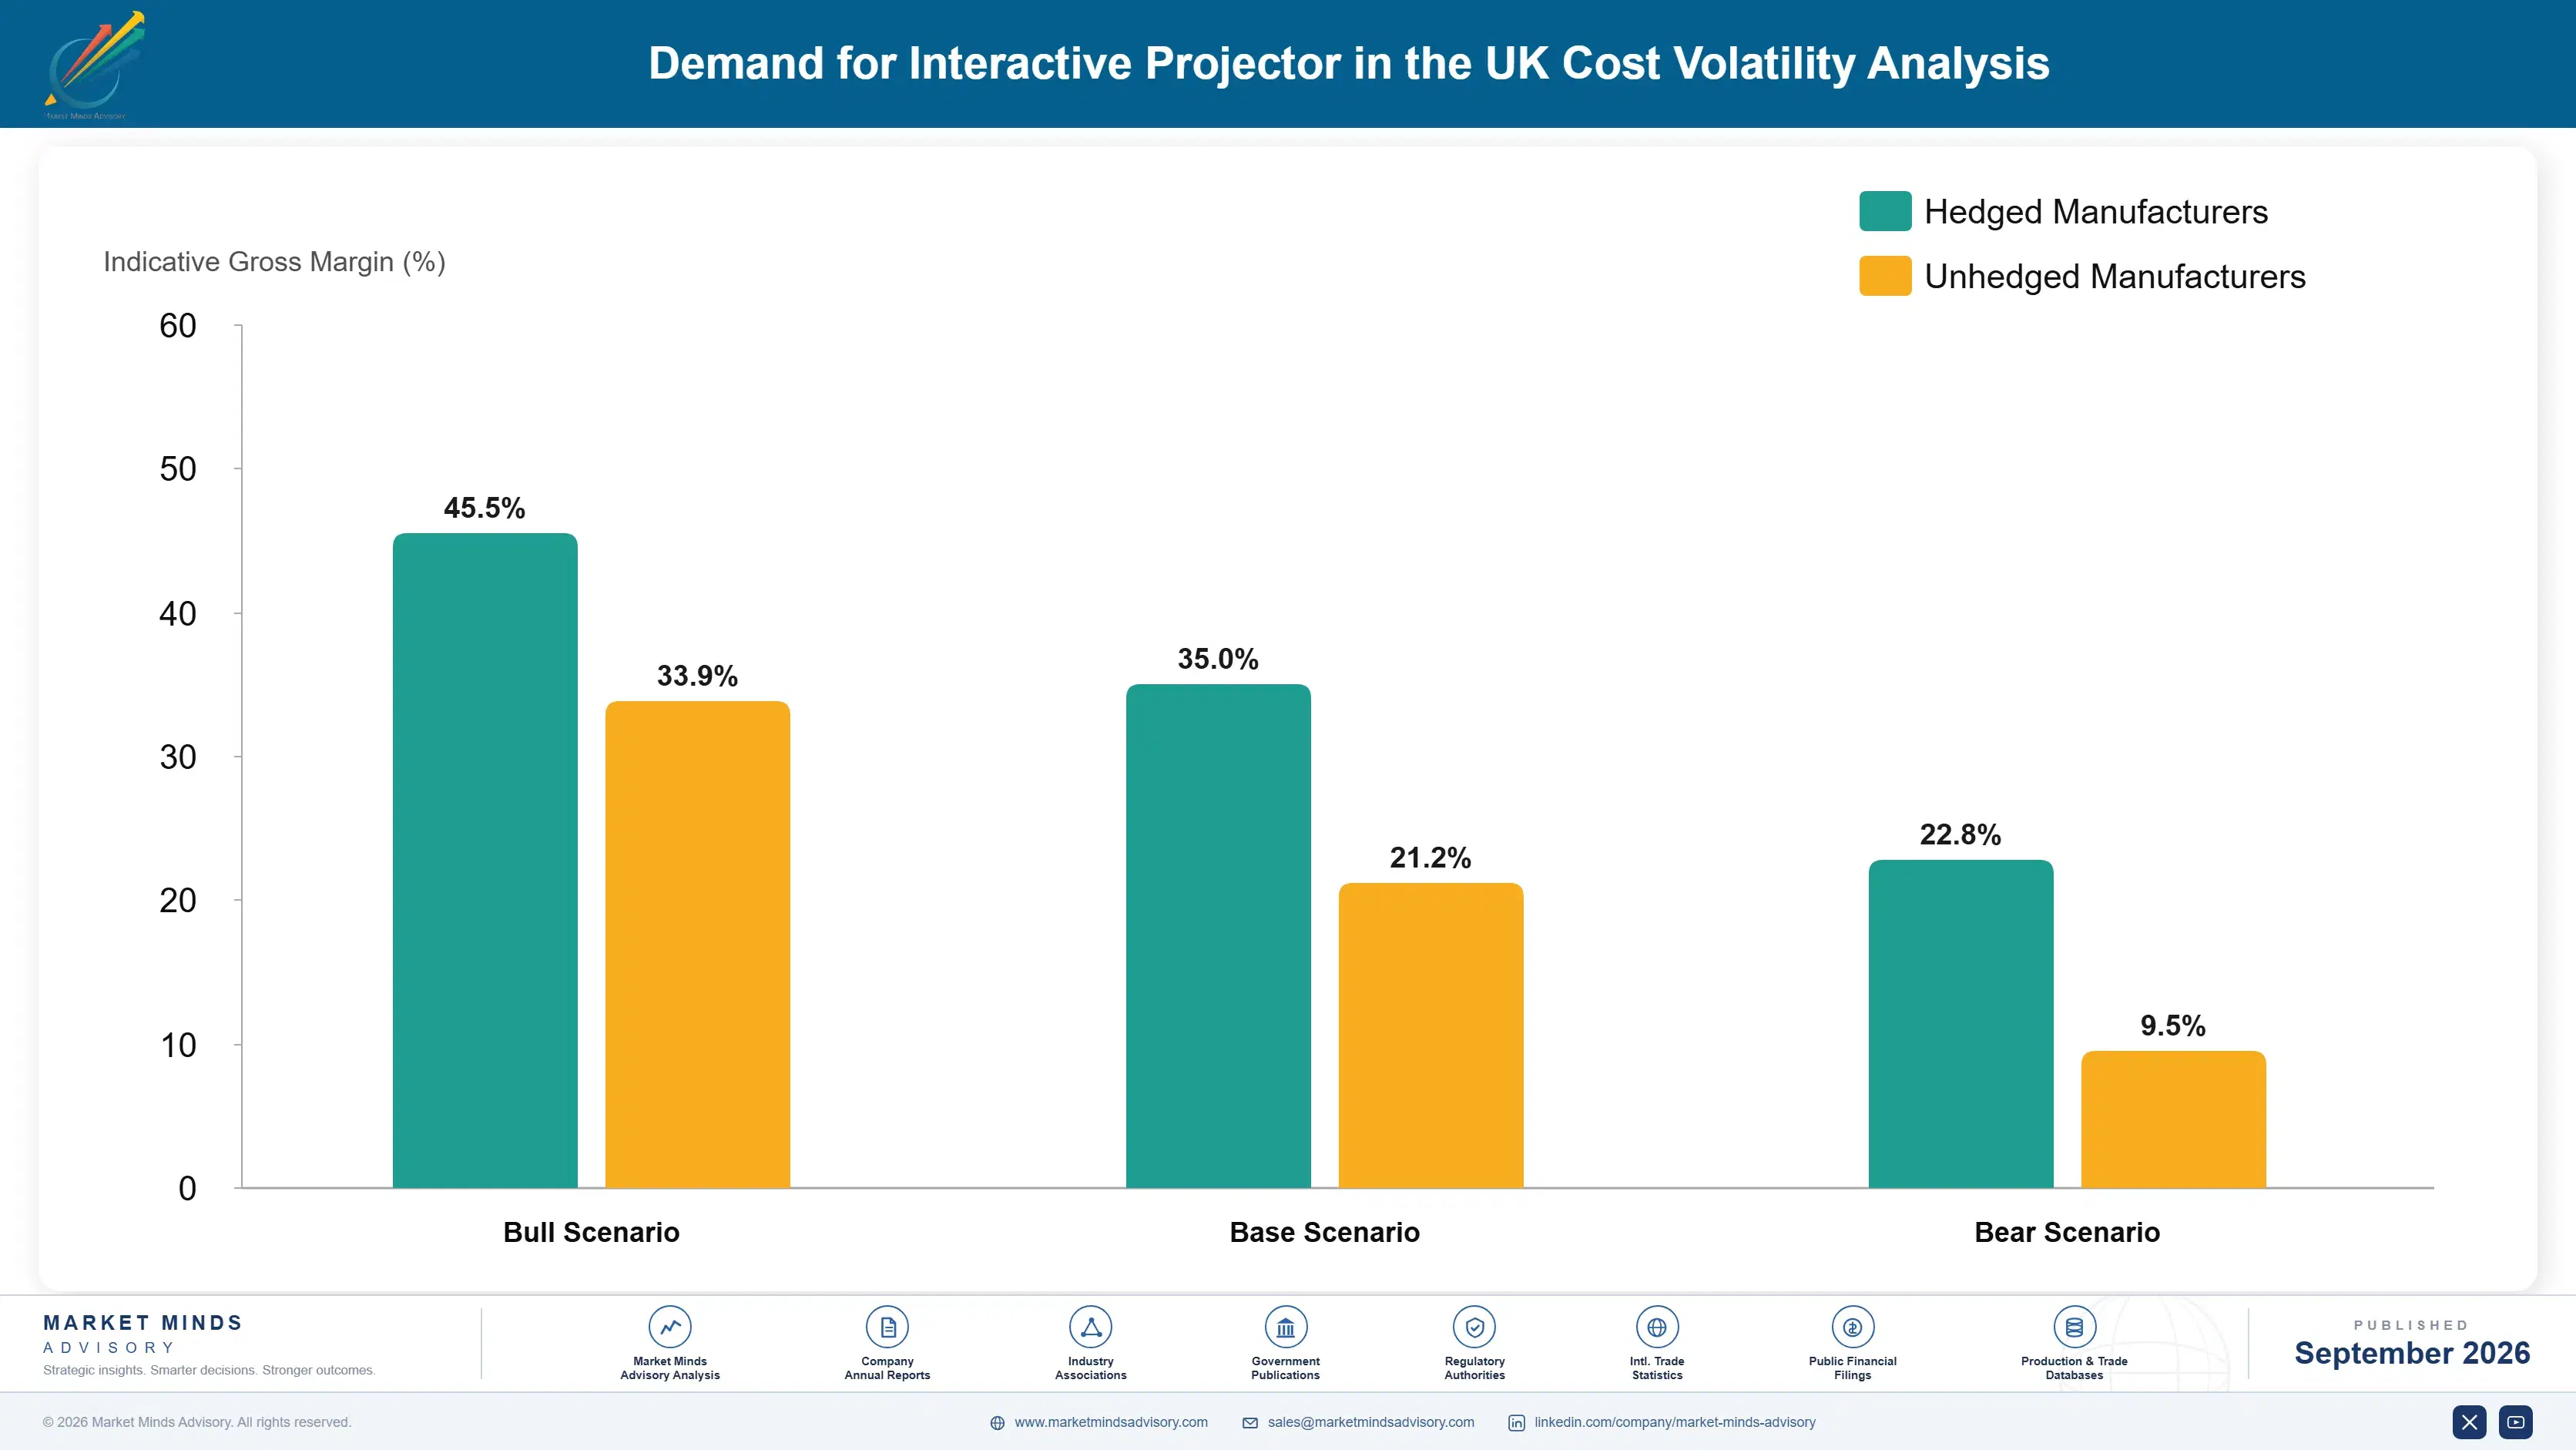
Optical projection components and digital light processing or liquid crystal display panels together represent the largest cost input for interactive projector manufacturers, running an estimated 48 to 56 percent of cost of goods sold, sourced primarily from a concentrated group of specialised optical component manufacturers based in Japan, China, and Taiwan. Assembly and testing costs add a smaller but meaningful share across most manufacturer operations.
Display panel component pricing rose meaningfully across the broader consumer electronics sector during 2021 and 2022 amid global semiconductor and component shortages that delayed several manufacturers' production schedules, a pattern consistent with consumer electronics sector supply trends tracked across multiple manufacturer annual reports and public disclosures reviewed for this analysis. Manufacturers without long-term component supply agreements faced longer production delays than those with priority allocation relationships.

The competitive disadvantage falls hardest on smaller manufacturers without the purchasing scale to secure priority component allocation during periods of constrained supply, forcing some to delay shipment relative to larger competitors with established component supplier relationships. Exposure varies by product tier too, since manufacturers building ultra-short-throw configurations requiring specialised optics face materially greater component cost exposure than manufacturers offering standard-throw designs built on more widely available optical technology.
united-kingdom-interactive-projector-market-cost-volatility-analysis-1788425090616

Securing Long-Term Component Supply Agreements

Larger manufacturers are negotiating multi-year fixed-volume component supply agreements directly with optical and display panel manufacturers to secure priority allocation ahead of demand cycles, protecting production schedules from short-notice allocation changes during periods of constrained industry-wide component supply. This approach has become standard practice among the largest projector manufacturers tracked in this report. This reduces exposure to short-notice pricing changes.

Standardising Optical Designs Across Product Lines

Several manufacturers are standardising optical component designs across multiple product lines to simplify sourcing and negotiate better volume pricing terms, accepting somewhat reduced product differentiation in exchange for more predictable component availability and cost. This approach has become increasingly common among manufacturers competing on cost predictability. This approach has become increasingly common among manufacturers managing multiple product lines.

Diversifying Component Sourcing Across Multiple Regions

Smaller manufacturers are increasingly qualifying component suppliers across multiple manufacturing regions rather than depending on a single geographic source, reducing exposure to any single region's supply disruption while adding modest qualification cost and lead time. This approach has become standard among manufacturers managing multiple supplier relationships. This approach has become increasingly common among smaller manufacturers competing on delivery reliability.

Portfolio Architecture for Margin Defence

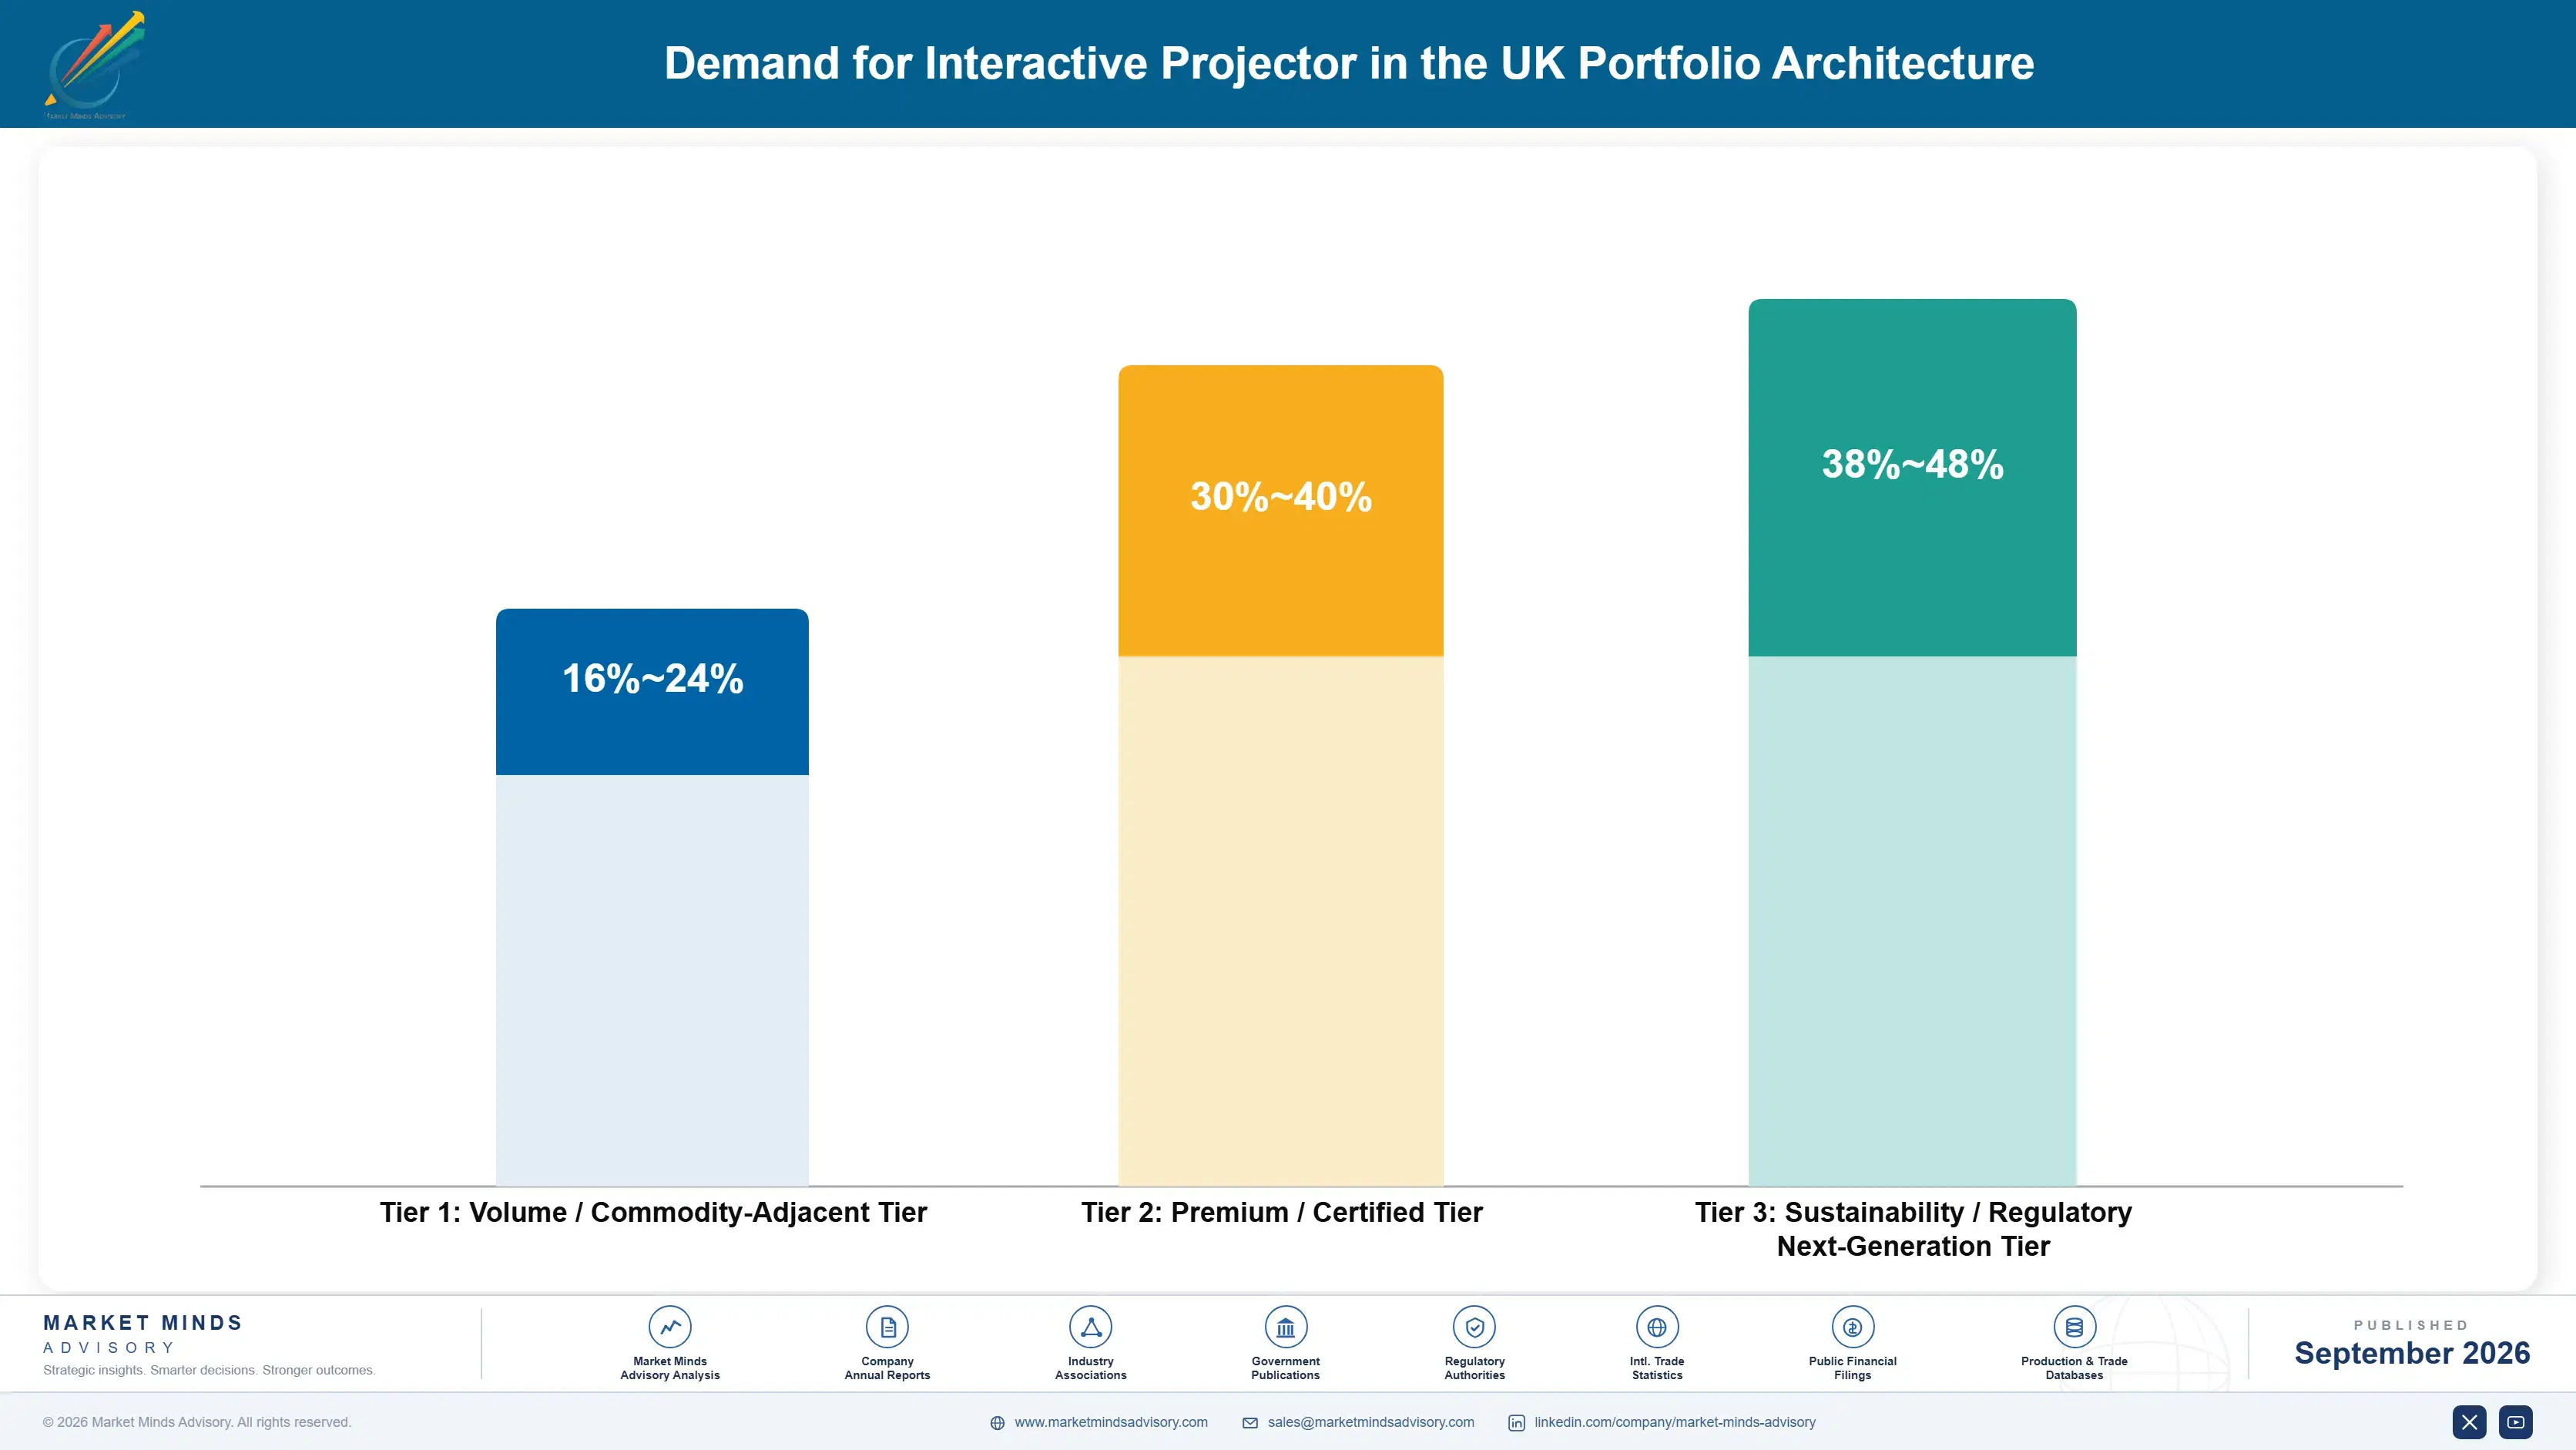
Portfolio economics split into three tiers. Volume tier standard-throw hardware carries thinner margins under continued price competition from flat panel alternatives and lower-cost regional manufacturers, while premium certified ultra-short-throw configurations bundling proprietary software carry meaningfully higher margins tied to engineering depth and software differentiation. The sustainability and next-generation tier, built around extended service and maintenance contract attachment, currently carries the strongest margins given recurring revenue characteristics distinct from one-time hardware sales.
The volume versus premium tension shows up clearly in vendor engineering allocation. Investment devoted to defending standard-throw hardware margin against flat panel price competition competes directly against investment needed for ultra-short-throw engineering depth and proprietary software development, and vendors that under-invest in either risk losing ground to a competitor optimised specifically for that segment of the market.

High-value margin pools concentrate in ultra-short-throw configurations bundled with proprietary software and in extended service contract attachment, where technical differentiation and recurring revenue still command premium pricing despite the category's overall shrinking unit volume trajectory. The volume standard-throw tier remains essential for market reach in less space-constrained installations but contributes a shrinking share of blended gross margin across the category overall.

Volume / Commodity-Adjacent Tier

Standard-throw hardware and price-sensitive customer segments facing continued price competition from flat panel alternatives and lower-cost regional manufacturers across most standard installations and buyer types broadly across the country. specifically.
Gross Margin: 16-24%

Premium / Certified Tier

Ultra-short-throw configurations bundling proprietary software, carrying margins tied to engineering depth and software differentiation, the pricing power of which still commands meaningfully premium rates across institutional accounts today. specifically nationally.
Gross Margin: 30-40%

Sustainability / Regulatory / Next-Generation Tier

Extended service and maintenance contract attachment commanding the strongest current margins given genuinely limited competition in this differentiated, recurring revenue capability across the wider category overall. specifically nationally. for the category.
Gross Margin: 38-48%
united-kingdom-interactive-projector-market-portfolio-architecture-1788425091119

High-value Sub-segments and Strategic Watch-out

Extended Service and Maintenance Contract Attachment

The fastest-growing margin segment in this report, combining strong current margins with accelerating institutional demand for predictable recurring revenue arrangements this decade and beyond. Vendors positioned early here are likely to retain pricing power well into the next several years. Buyers increasingly request this capability by name during vendor evaluation.
Gross Margin: 38-48%

Ultra-Short-Throw Bundled Software Configurations

Premium bundled offerings tied to institutional demand for unified procurement, offering strong margins and durable transaction value across space-constrained accounts broadly. This window will likely narrow once bundled software becomes a standard category expectation broadly. Vendors should invest here while differentiation still commands a meaningful premium overall.
Gross Margin: 30-40%

Standard Institutional Hardware Replacement Contracts

The largest existing revenue base, standard hardware facing steady price competition but funding most vendors' ongoing engineering investment across the wider portfolio. Vendors serving this tier depend heavily on volume rather than technical differentiation consistently. Execution discipline on tender pricing matters more here than added features.
Gross Margin: 18-26%

Flat Panel Substitution Exposure in Standard Rooms

A shrinking strategic watch-out segment as flat panel displays continue displacing standard-throw projectors across most non-space-constrained installations tracked in this report. Vendors still exposed here should actively diversify before substitution accelerates further erosion quickly. Waiting too long risks losing remaining accounts during the next evaluation.
Gross Margin: 8-16%

Institutional Lock-In and Replacement Cycle Economics

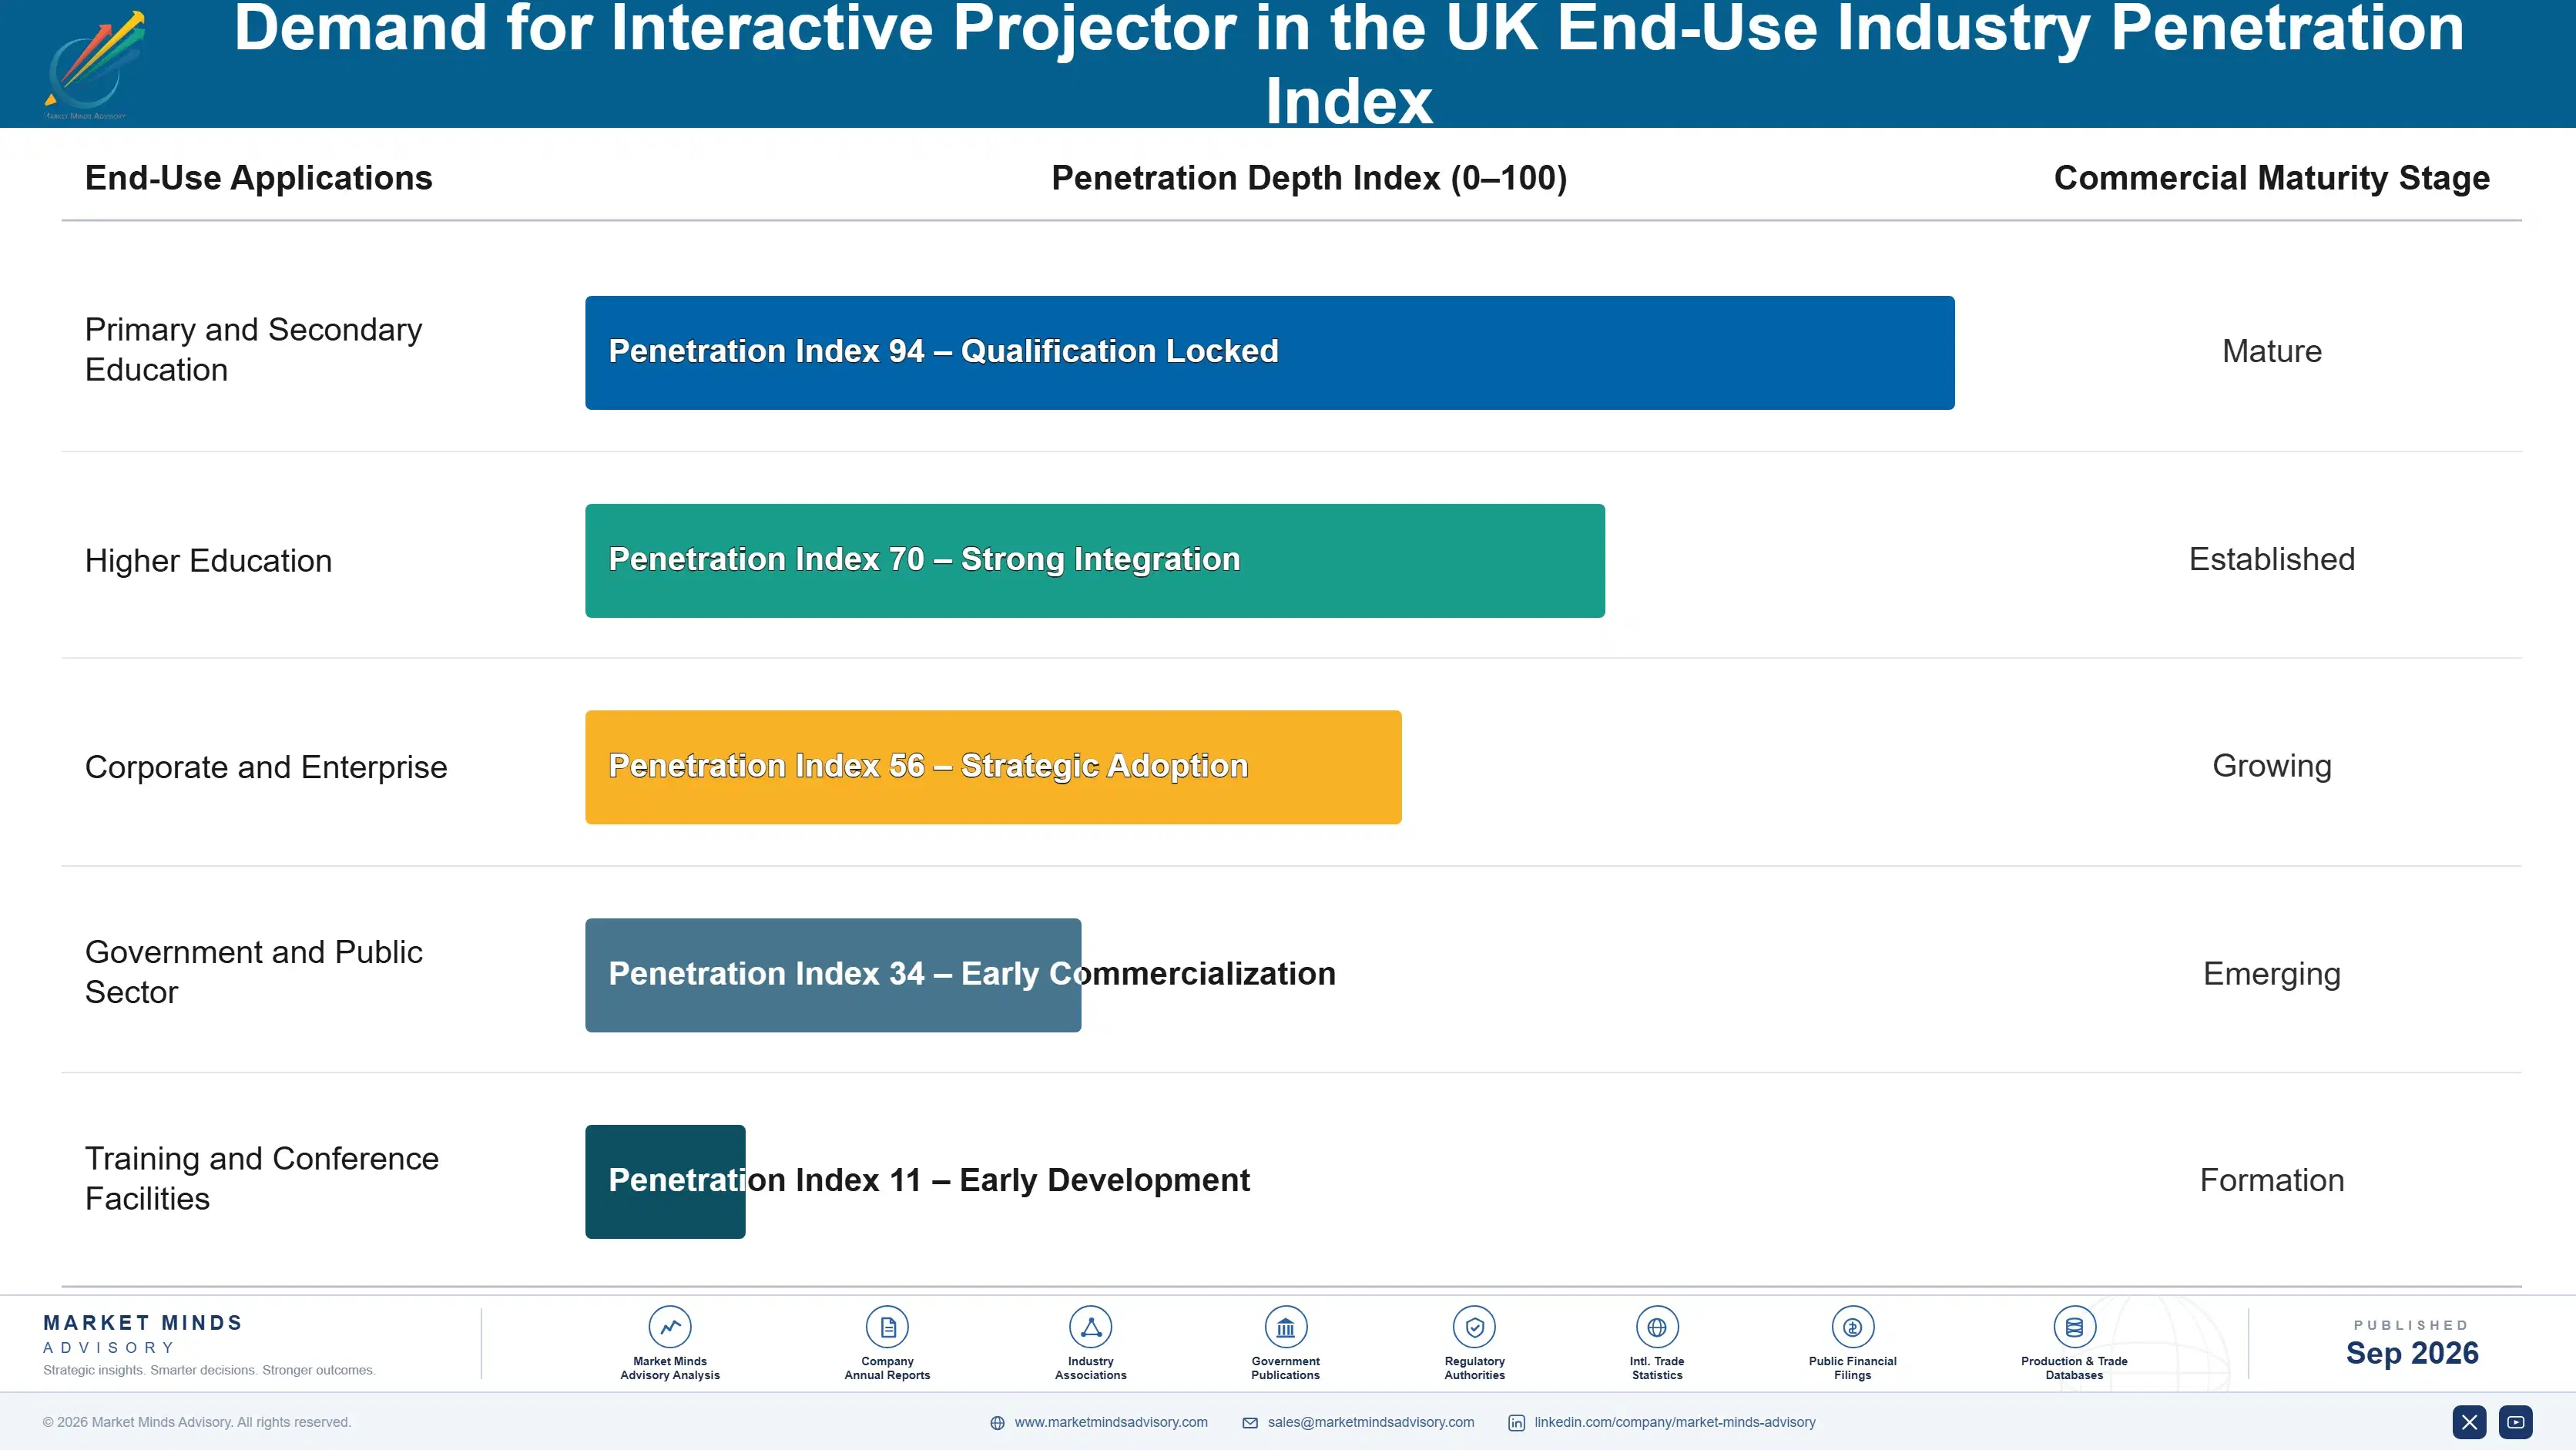
Revenue behaves like a periodic replacement annuity tied to institutional refresh cycles rather than a continuous subscription relationship, since schools and enterprises typically replace projector installations only once every seven years on average, and that replacement rhythm explains most of this category's revenue timing once initial installation relationships are established across a given institution's estate.
Adoption depth varies sharply by end-use vertical. State schools integrate projector procurement deeply into broader multi-year classroom technology funding and refresh planning cycles, creating durable, government-funding-linked vendor relationships, while corporate enterprises with smaller, more discretionary technology budgets treat projector replacement more transactionally around individual office refurbishment projects, creating shallower vendor loyalty and greater exposure to flat panel substitution at each replacement decision point.

Buyer profiles are shifting generationally too. Procurement officers who came up through the standard-throw projection era still favour proven, familiar vendor relationships even as flat panel alternatives improve, while newer facilities and technology leaders increasingly default to evaluating total cost of ownership and space flexibility as standard procurement considerations, a difference in buying philosophy that is already shaping which vendors win newly launched institutional programmes versus established legacy replacement contracts.
united-kingdom-interactive-projector-market-end-use-penetration-index-1788425091615

Where the Category Defends Value Next

These are among the four positions where our research anticipates prominent divergence between winners and laggards over the coming forecast period. Each is grounded in the demand model, the regulatory perimeter, and the announced capacity pipeline.
01 / ULTRA-SHORT-THROW INVESTMENT STRATEGY

Space-efficient engineering is separating category defenders from decliners

Vendors that built proven ultra-short-throw engineering capability are capturing a disproportionate share of the category's remaining genuinely differentiated installations as flat panel substitution continues across less space-constrained rooms nationally. Vendors without demonstrated ultra-short-throw expertise risk being relegated to a shrinking standard-throw segment carrying materially lower long-term volume than engineering leaders currently retain. Building this capability now, while space-constrained installations remain the category's clearest defensible niche, looks like the more urgent investment priority for most vendors, since delaying investment risks ceding this defensible niche to faster-moving competitors.
02 / SOFTWARE BUNDLING STRATEGY

Proprietary collaboration tools are compounding into durable transaction value

Vendors that developed proprietary collaboration software platforms are capturing meaningfully higher average transaction value than vendors relying entirely on third-party integration partnerships for comparable functionality. This dynamic rewards vendors willing to invest in software development well ahead of confirmed institutional-wide software procurement standardisation. Vendors without proprietary software should prioritise smaller pilot bundling arrangements to build credibility, since pilot deployments with two or three institutions tend to reveal most recurring procurement objections and reduce the risk of costly early missteps across the wider institutional base.
03 / SERVICE CONTRACT ATTACHMENT POSITIONING

Recurring service revenue remains a genuinely underexploited opportunity

Extended service and maintenance contract attachment remains underexploited relative to its clear recurring revenue potential as vendors continue prioritising one-time hardware sales over longer-term institutional relationship value. Vendors building genuine service delivery infrastructure now are positioning for meaningful recurring revenue advantage as the category's overall unit volume trajectory continues shrinking gradually. Treating service attachment as a secondary afterthought rather than a distinct strategic asset risks underinvesting in an important buffer against declining hardware volume, since early movers tend to lock in the most valuable multi-year service relationships first.
04 / STANDARD-THROW HARDWARE EXPOSURE

Vendors without differentiation face continued flat panel substitution pressure

Vendors remaining concentrated in standard-throw hardware positioning without ultra-short-throw or software differentiation face continued substitution pressure as flat panel displays capture a growing share of new installations across most non-space-constrained rooms tracked in this report. Vendors should actively diversify toward ultra-short-throw engineering, proprietary software, or service contract attachment rather than defending standard-throw positioning alone. Treating standard-throw positioning as a stable long-term stance rather than a declining one risks meaningfully understating the category's ongoing substitution pressure, already visible in disclosed unit volume trends.

Engagement Snapshot From the Field

A live engagement with an industry participant carrying material or product regulatory and market exposure ahead of a defining policy shift, showing how our research translates into a defensible multi-year portfolio strategy.
MARKET MINDS ADVISORY · CLIENT ENGAGEMENT SUMMARY
Demand for Interactive Projector in the UK Producer Strategic Portfolio Review and Transition Roadmap 2026·Investment Scenario on Demand for Interactive Projector in the UK Exposure Evaluation 2025-26
CLIENT PROFILE
The client is a regional multi-academy trust operating thirty two schools across the north of England (client-reported, unverified by MMA), historically procuring classroom display technology independently across individual schools without a unified trust-wide technology standard or coordinated vendor negotiation approach. The trust's schools range from small rural primaries to larger urban secondary academies across the region.
STRATEGIC CHALLENGE
Leadership needed to evaluate whether to standardise on interactive projectors or transition toward flat panel displays across a phased multi-year refresh programme, without the internal technical expertise to independently assess total cost of ownership differences at the scale the trust required. Board-level attention to budget efficiency added further urgency to the standardisation decision.
MMA APPROACH
MMA benchmarked total cost of ownership across both technology options using the trust's actual classroom dimensions and existing infrastructure, prioritising room-by-room analysis over a single trust-wide technology mandate. The engagement included structured interviews with facilities staff across a representative sample of schools to validate realistic installation constraints. MMA also modelled realistic transition costs to support the trust's internal budget approval process.
KEY FINDINGS
  1. Roughly forty percent of classrooms across the trust's estate were genuinely too small for flat panel displays of the size teachers actually wanted without ultra-short-throw projector alternatives.
  2. Several schools within the trust had been paying meaningfully different prices for comparable equipment due to independent, uncoordinated procurement negotiations conducted separately.
  3. A phased rollout sequence starting with the schools facing the most urgent equipment failures reduced overall disruption compared to a simultaneous trust-wide refresh programme.
  4. Teacher adoption of bundled collaboration software exceeded initial expectations once early pilot results were shared transparently across the trust's schools. This transparency proved essential to securing broader staff buy-in across the trust.
CLIENT PROFILE
The client is a regional multi-academy trust operating thirty two schools across the north of England (client-reported, unverified by MMA), historically procuring classroom display technology independently across individual schools without a unified trust-wide technology standard or coordinated vendor negotiation approach. The trust's schools range from small rural primaries to larger urban secondary academies across the region.
STRATEGIC CHALLENGE
Leadership needed to evaluate whether to standardise on interactive projectors or transition toward flat panel displays across a phased multi-year refresh programme, without the internal technical expertise to independently assess total cost of ownership differences at the scale the trust required. Board-level attention to budget efficiency added further urgency to the standardisation decision.
MMA APPROACH
MMA benchmarked total cost of ownership across both technology options using the trust's actual classroom dimensions and existing infrastructure, prioritising room-by-room analysis over a single trust-wide technology mandate. The engagement included structured interviews with facilities staff across a representative sample of schools to validate realistic installation constraints. MMA also modelled realistic transition costs to support the trust's internal budget approval process.
KEY FINDINGS
  1. Roughly forty percent of classrooms across the trust's estate were genuinely too small for flat panel displays of the size teachers actually wanted without ultra-short-throw projector alternatives.
  2. Several schools within the trust had been paying meaningfully different prices for comparable equipment due to independent, uncoordinated procurement negotiations conducted separately.
  3. A phased rollout sequence starting with the schools facing the most urgent equipment failures reduced overall disruption compared to a simultaneous trust-wide refresh programme.
  4. Teacher adoption of bundled collaboration software exceeded initial expectations once early pilot results were shared transparently across the trust's schools. This transparency proved essential to securing broader staff buy-in across the trust.
RECOMMENDED STRATEGY
Phase 1: Phase 1 (Months 1 to 2): Benchmark total cost of ownership using actual classroom dimensions across the estate. Include facilities walkthroughs across a representative sample of schools. Phase 2: Phase 2 (Months 3 to 6): Refresh schools facing the most urgent equipment failures first using the validated approach. Document lessons learned before extending to remaining schools. Phase 3: Phase 3 (Months 7 to 11): Extend the room-by-room technology approach across remaining schools in the trust. Formalise ongoing procurement governance across the full trust estate.
OUTCOME
Eleven months after the engagement began, the trust successfully completed a coordinated technology refresh combining ultra-short-throw projectors and flat panel displays based on room-specific analysis, reporting meaningfully reduced overall procurement cost relative to its prior uncoordinated approach (client-reported, unverified by MMA). Leadership also reported improved confidence in managing future refresh cycles centrally.

Frequently Asked Questions

Foundational context covering the market sizes, CAGR, scope, country, region and competition that inform every finding below. This section is provided to cover basics and most often pre-purchase conversations, answered from the MMA Primary Research Dataset.

What is the current size of the Demand for Interactive Projector in the UK?

Demand for interactive projectors in the United Kingdom reached an estimated USD 0.28 billion in 2025, according to MMA Analysis based on primary research and company disclosures. This base year figure anchors the forecast period beginning in 2026.

How large will the Demand for Interactive Projector in the UK be by 2036?

MMA projects the market will reach approximately USD 0.56 billion by 2036 under the base case scenario. That represents roughly a 1.88 times expansion from the 2026 starting value of USD 0.30 billion.

What is the CAGR for the Demand for Interactive Projector in the UK 2026 to 2036?

The base case compound annual growth rate is 6.5% across the 2026 to 2036 forecast window. Bull and bear scenarios range from 5.2% to 7.7% depending on government classroom funding and flat panel substitution pace.

Which segment is growing fastest?

Interactive Whiteboard Integration Systems lead all segments at an 11.0% CAGR, roughly 1.69 times the overall market rate. This segment benefits from institutions consolidating procurement into fewer, more integrated vendor relationships.

Who are the major companies in the Demand for Interactive Projector in the UK?

Leading vendors include Seiko Epson Corporation, BenQ Corporation, Optoma Technology, ViewSonic Corporation, and Panasonic Corporation. Together these five hold an estimated 54% combined share on a disclosed segment revenue basis.

Which country is growing fastest?

This report's scope is the United Kingdom specifically, which grows at the overall market rate of 6.5% annually. England's state school system drives the majority of national demand through government-funded refresh programmes.

Report Segmentation Architecture

The full report scope spans multiple orthogonal segmentation dimensions, with cross-tabulated demand data provided for each dimension pair. Coverage extends further to regional breakdowns, trend trajectories, and the competitive detail needed to support segment-level decision-making.

By Primary Market Dimension

  • Ultra-Short-Throw Interactive Projectors
  • Short-Throw Interactive Projectors
  • Standard-Throw Interactive Projectors
  • Portable and Compact Interactive Projectors
  • Interactive Whiteboard Integration Systems
  • Touch Overlay and Software Accessory Systems

By End-Use Industry

  • Primary and Secondary Education
  • Higher Education
  • Corporate and Enterprise
  • Government and Public Sector
  • Training and Conference Facilities

By Commercial Dimension

  • Direct Institutional Procurement Contracts
  • Education Framework Agreement Channels
  • Reseller and Systems Integrator Channels
  • Extended Service and Maintenance Contracts

By Region

  • North America
  • Western Europe
  • East Asia
  • South Asia and Pacific
  • Latin America
  • Middle East and Africa
  • Eastern Europe

Scope, Methodology, and Coverage

Every figure in this report is reproducible from documented input assumptions. The scope below maps the historical period, the forecast horizon, the segmentation dimensions, and the countries covered, alongside the underlying primary and qualitative methodology.
Historical Period
2020 to 2025
Forecast Period
2026 to 2036
Base Year
2025 (USD billions; MMA Primary Research Dataset, September 2026)
Market Definition
This report covers interactive projector hardware, touch overlay systems, and associated integration software sold for classroom, meeting room, and training environment use within the United Kingdom, including ultra-short-throw, short-throw, and standard-throw configurations. It excludes non-interactive standard projectors without touch or annotation capability, and flat panel interactive display products that do not use projection technology.
Quantitative Units
USD billions (current prices); installed unit counts; average price per installed unit
Segmentation Dimensions
By Primary Market Dimension; By End-Use Industry; By Commercial Dimension; By Region
Regions Covered
North America, Western Europe, East Asia, South Asia and Pacific, Latin America, Middle East and Africa, Eastern Europe
Countries Covered
United Kingdom (England, Scotland, Wales, Northern Ireland), with incidental cross-border vendor activity referenced across other regions
Key Companies Profiled
Seiko Epson Corporation; BenQ Corporation; Optoma Technology Inc.; ViewSonic Corporation; Panasonic Corporation; Sony Corporation; Sharp NEC Display Solutions Ltd; Hitachi Ltd; Casio Computer Co Ltd; InFocus Corporation; Christie Digital Systems USA Inc; Barco NV; Vivitek Corporation; Promethean Limited; SMART Technologies ULC; Boxlight Corporation; Newline Interactive Inc; Ricoh Company Ltd; Acer Inc; LG Electronics Inc
Quantitative Methodology
Primary survey, n=3,800 respondents, Q4 2025, six countries; demand-side model with trade association cross-validation
Qualitative Methodology
47 expert interviews, Q4 2025; applied to validate demand model assumptions, identify emerging dynamics, and assess competitive positioning
Report Format
PDF and XLSX data workbook (Word format preview document)
Publisher
Market Minds Advisory
Report Code
MMA-2026-TEC-461
Published
September 2026
Contact
sales@marketmindsadvisory.com | www.marketmindsadvisory.com

Purchase the full Demand for Interactive Projector in the UK Report (2026 to 2036).

The full report delivers complete segmentation data across all six product and technology segments, detailed United Kingdom regional and devolved nation breakdowns, and competitive profiles for all twenty companies named in this summary. It includes the underlying primary survey dataset of three thousand eight hundred respondents and forty seven expert interviews conducted during the fourth quarter of 2025. Buyers also receive downloadable data tables covering historical 2020 to 2025 figures alongside the full 2026 to 2036 annual forecast. A dedicated appendix addresses total cost of ownership benchmarks against flat panel alternatives.
Full UK Regional and Devolved Nation Data Tables
All Twenty Company Competitive Profiles and Rankings
Ten-Year Annual Forecast Model With Scenarios
Primary Survey Raw Data Access and Tables
Total Cost of Ownership Benchmark Appendix and Guide
Quarterly Update Subscription Option for Buyers

Built For The People Who Decide

From boardroom strategy to bench-side execution, this report is read cover-to-cover by leaders shaping the next decade of their industry, turning demand scenarios, market dynamics and valuation benchmarks into decisions.
CXOs/ Presidents/ VPs/ Managers
M&A and Corporate Development
Strategy Teams and R&D Heads
Procurement and Product Directors
Regulatory and Compliance Leaders
Investor Relations and Equity Analysts