Market Minds Advisory
Demand for Insurtech in UK

Demand for Insurtech in UK: Demand for Insurtech in UK. AI-Driven Underwriting Is Compressing Decade-Long Actuarial Timelines Into Minutes

United Kingdom insurers that treated pricing model updates as a multi-year exercise now deploy AI underwriting platforms that recalibrate pricing continuously, forcing carriers to partner with technology-native challengers. That gap is widening every quarter.

Lead Analyst

Published

September 2026

Make Smarter Decisions with Customized Research Insights

Request a free sample report and evaluate market opportunities, growth trends, and competitive dynamics relevant to your business needs.

2025 MARKET VALUE$1.4BMarket Size 2025
2036 FORECAST VALUE$6.6BBase Case , 2026 to 2036
CAGR 2026 TO 203615.5 %Bull 16.8% / Bear 14.2%
INCREMENTAL OPPORTUNITY$5.0BNet 10- year value creation
EXPANSION MULTIPLE4.23x2036 value over 2026 base
Strategic Levers
M&A Pipeline
Regional Outlook
Country Rankings
Competitive Intelligence
Segmental Deep-dive
Call-Us : 91 93563 13602

Executive Snapshot and Market Trajectory.

United Kingdom insurers that once treated actuarial pricing model updates as a multi-year exercise are now deploying artificial intelligence underwriting platforms that recalibrate risk pricing continuously, and that compressed pricing cycle is now the dominant force reshaping competitive positioning and partnership strategy across the category this year.
Demand concentrates among motor, home, and pet insurance carriers facing intense direct-to-consumer price comparison, while AI-driven underwriting and risk assessment platforms are growing fastest as carriers seek genuine pricing accuracy advantage rather than incremental digital distribution improvements alone. London's concentrated fintech and insurance talent base drives the overwhelming majority of national platform development activity, reflecting the capital's established position as the country's dominant insurtech hub specifically.
Competitive structure remains genuinely fragmented among a large number of well-funded technology-native challengers and specialist software vendors serving incumbent carriers, none of which has achieved dominant scale across the category nationally. Incumbent carriers increasingly expect technology partners to demonstrate proven claims and underwriting accuracy improvements rather than simply attractive consumer-facing app design, reshaping vendor evaluation criteria faster than several earlier-generation challengers anticipated when the category competed on convenience. Vendor rankings have shifted as criteria mature.
Market Definition
This market covers software platforms, artificial intelligence underwriting tools, and digital distribution technology used by insurance carriers, managing general agents, and brokers operating in the United Kingdom, spanning underwriting, claims, distribution, and policy administration functions. It excludes traditional insurance underwriting capacity and balance sheet risk-bearing activity itself, and general financial services technology that does not include dedicated insurance-specific functionality.
Base Year Value
$1.4B in 2025 (MMA Primary Research Dataset, September 2026)
Forecast Period
2026 to 2036, eleven discrete annual values
CAGR
15.5% base case. Bull 16.8%. Bear 14.2%.
Fastest Growth Segment
AI-Driven Underwriting and Risk Assessment Platforms: 22.0% CAGR
Fastest Growth Country
United Kingdom: 15.5% CAGR
Fastest Growth Region
South Asia and Pacific: 17.5% CAGR
Largest Region
Western Europe: 80% of 2025 global value
Market Leaders
Zego Ltd, Marshmallow Financial Services Ltd, Tractable Ltd, Cytora Ltd, ManyPets Ltd. Source: MMA Analysis based on company disclosures and primary research.
Primary Survey
n=3,800 procurement and R&D decision-makers, Q4 2025, six countries
Methodology
Demand-side build-up, cross-validated against public data, 47 expert interviews

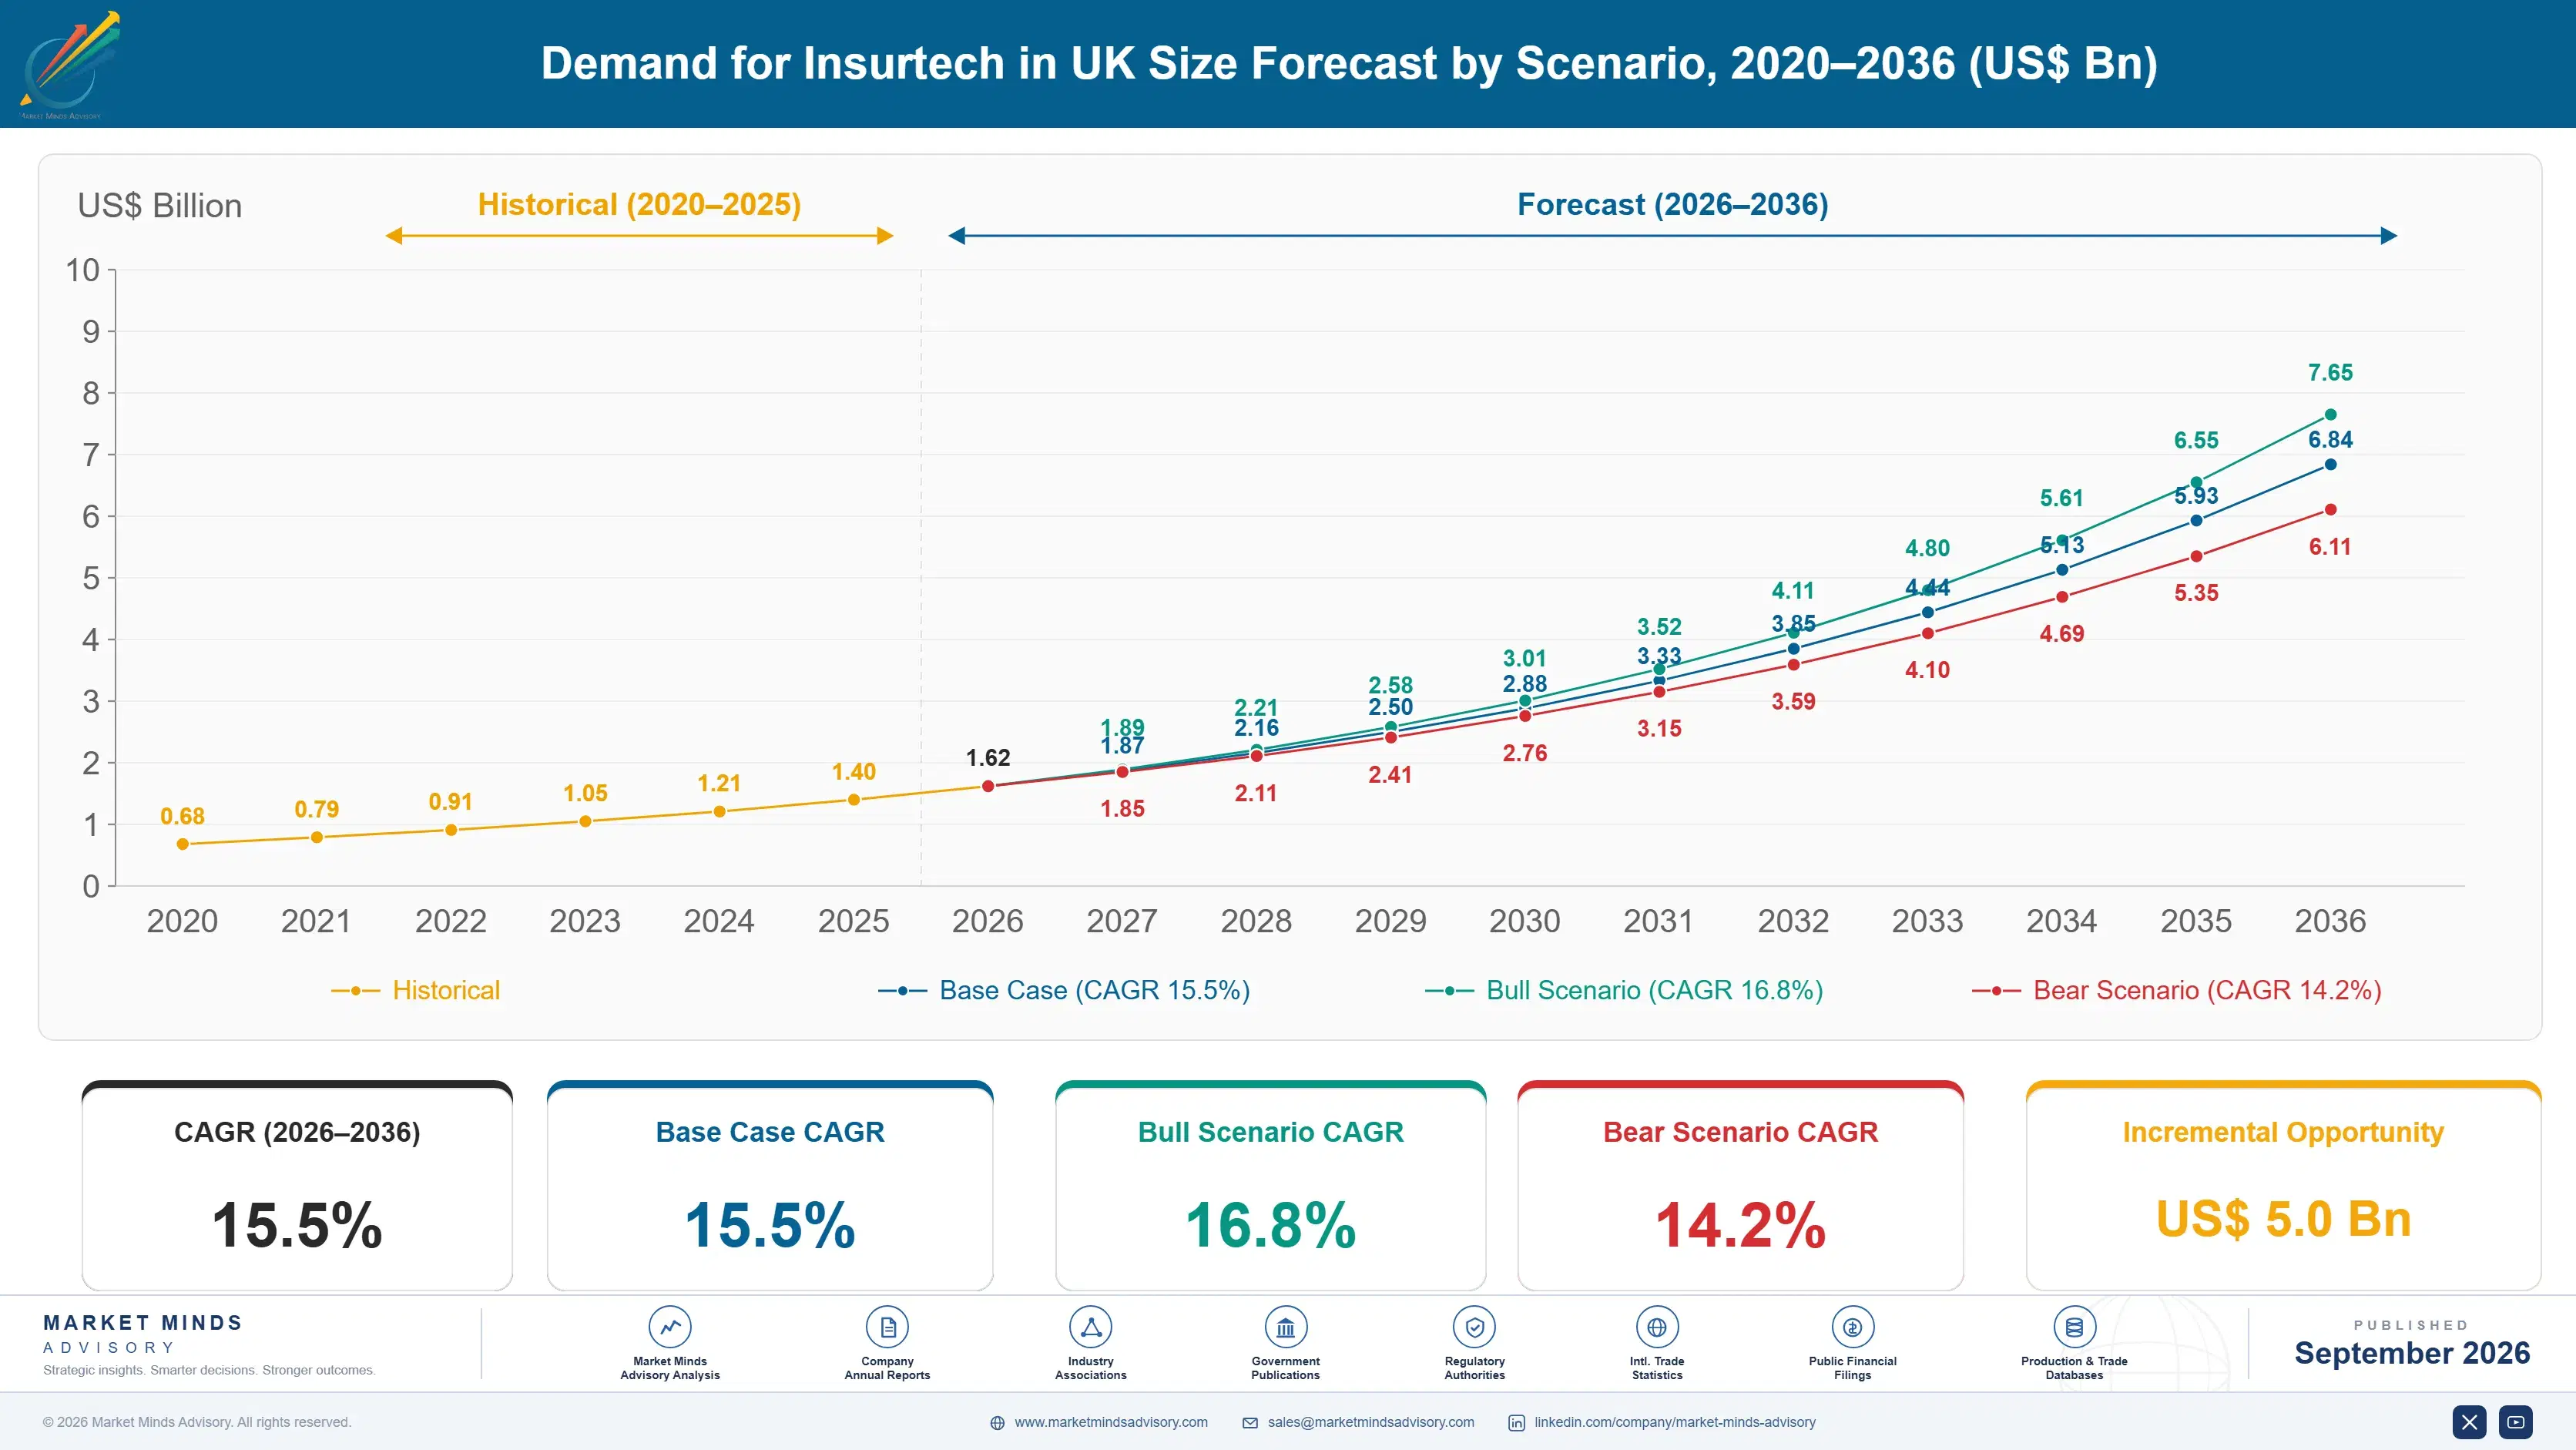
Demand for Insurtech in UK Market Forecast Scenarios

united-kingdom-insurtech-market-size-forecast-scenario-1788425067938
Between 2020 and 2025 the category grew rapidly as digital-first challengers captured meaningful market share from traditional carriers, with growth continuing to accelerate from 2023 onward as artificial intelligence underwriting capability moved from experimental pilot programmes into genuine production pricing systems across several major carriers. This momentum built steadily rather than in one sharp inflection point.
The base case assumes continued rapid growth driven by three mechanisms: incumbent carriers accelerating technology partnership and acquisition activity to match challenger pricing accuracy and claims speed, growing embedded insurance distribution through non-insurance digital platforms expanding the addressable customer acquisition channel considerably, and rising claims automation reducing processing cost enough to justify continued investment. These three mechanisms compound fastest among carriers facing the most intense direct-to-consumer price comparison pressure across motor and home insurance lines.
A bull scenario turns on artificial intelligence underwriting accuracy improving faster than currently expected, pulling forward incumbent carrier technology adoption budgets nationally. The bear risk is a broader insurance industry profitability downturn causing carriers to pause discretionary technology investment, delaying platform adoption regardless of the underlying pricing accuracy advantage driving current demand. Vendors are hedging against this uncertainty by diversifying revenue toward recurring platform licensing.

AI Underwriting Compresses a Decade-Long Pricing Cycle

Two forces are reshaping this category at once: incumbent carriers racing to match challenger pricing accuracy through artificial intelligence underwriting adoption, and embedded insurance distribution expanding customer acquisition well beyond traditional price comparison websites and broker channels. Together these are pulling vendor engineering investment toward production-grade underwriting model deployment and toward distribution application programming interfaces that non-insurance platforms can integrate directly. This dual investment pattern is reshaping how vendors allocate scarce engineering talent.
MARKET CONCENTRATIONCR5 38%Reflects a genuinely fragmented national insurtech vendor category
AVERAGE CONTRACT VALUEGBP 340,000 annuallyBlended across carrier, managing general agent, and broker segments
MOTOR AND HOME SHARE64% of platform revenueReflects concentrated adoption across the most price-competitive lines
AI UNDERWRITING PENETRATION37% of carrier premium volumeShare of national premium volume priced using AI-assisted models
CLAIMS AUTOMATION RATE29% of claims processed digitallyShare of claims processed without direct human case handler review
AVERAGE PARTNERSHIP DURATION3.5 years per carrier relationshipTypical length of a carrier and technology vendor partnership
Commercially, the market behaves like a rapidly maturing technology category where genuine underwriting and claims accuracy improvements increasingly separate credible vendors from consumer-facing app polish alone. Carriers evaluate vendors heavily on demonstrated loss ratio improvement and claims processing speed, creating real switching consideration whenever a vendor's platform fails to deliver promised accuracy gains at production scale.
Over the next decade, expect artificial intelligence underwriting and claims automation to become standard infrastructure across nearly every United Kingdom carrier rather than a differentiating technology reserved for digital-first challengers alone. Vendors that build genuine production-scale underwriting accuracy alongside deep embedded distribution partnerships will capture a growing share of category value beyond the consumer app-focused positioning that defined the category's earlier growth phase.
"Every carrier claims to use AI underwriting now. The ones actually moving loss ratios are the minority, and that gap is where the real competitive separation is happening."
Director, Insurance Technology and Digital Distribution Practice · MMA Technology Practice · September 2026

Market Trends

AI Underwriting Moves From Pilot Programmes to Production Pricing

Carriers across motor, home, and pet insurance lines are moving artificial intelligence underwriting capability from experimental pilot programmes into genuine production pricing systems, since early pilot results demonstrated measurable loss ratio improvement that justified expanded deployment across broader policy books nationally. MMA's Q4 2025 primary research found thirty seven percent of carrier premium volume now priced using some form of AI-assisted underwriting model, up meaningfully from a much smaller share three years earlier, as carriers completed the data infrastructure and model validation work needed to trust automated pricing decisions at scale.
Market Impact: Drives 54% of technology investment decisions
Embedded Distribution Expands Beyond Comparison Websites

Insurance distribution is increasingly embedding directly into non-insurance digital platforms including retailers, mobility providers, and financial services apps, expanding customer acquisition well beyond the price comparison websites that historically dominated United Kingdom digital insurance distribution. MMA's expert interview programme found distribution partnership executives citing embedded channel customer acquisition cost roughly half that of comparison website traffic, as the primary justification for accelerated embedded partnership investment across multiple carrier relationships specifically. This shift favours platforms with proven application programming interface integration depth over legacy distribution technology. Retailers and mobility providers in particular are expanding embedded partnerships fastest.
Market Impact: Sustains investment across 61% of carriers

Market Opportunities and Growth Drivers

Intense Price Comparison Pressure Rewards Pricing Accuracy Investment

Continued intense direct-to-consumer price comparison across motor and home insurance lines is rewarding carriers that achieve genuine underwriting pricing accuracy improvement, since even small pricing precision gains translate directly into meaningfully better risk selection when consumers routinely compare quotes across dozens of competing carriers simultaneously. Surveyed carrier executives linked fifty four percent of technology investment decisions directly to competitive pricing accuracy pressure rather than broader digital transformation objectives, according to MMA's Q4 2025 primary research programme covering United Kingdom insurance carriers. This pricing-driven justification is sustaining technology investment even during periods of broader insurance industry cost discipline.
Market Impact: Extends integration timelines by 7 months

Claims Cost Inflation Sustains Automation Investment

Continued claims cost inflation across motor and home insurance lines is sustaining carrier investment in artificial intelligence claims automation specifically, since automated claims processing genuinely reduces per-claim handling cost enough to offset rising repair and replacement expenses carriers cannot control directly. Announced claims cost inflation figures tracked in MMA's primary research programme remained elevated through 2025, sustaining automation investment across carriers treating claims processing efficiency as a genuine cost offset rather than a discretionary technology upgrade. Carriers increasingly treat automation investment as a defensive necessity rather than an optional efficiency upgrade.
Market Impact: Delays deployment 6 months

Market Restraints and Challenges

Legacy Core System Integration Complicates Platform Deployment

Many incumbent carriers operate legacy core policy administration systems that were never designed to integrate with modern artificial intelligence underwriting and claims platforms, complicating deployment timelines considerably relative to the technology-native challengers that built their systems without comparable legacy constraints. The root cause is that carriers rarely replace core administration systems wholesale given the operational risk involved, leaving newer technology layered on decades-old infrastructure not designed for real-time exchange. The commercial impact shows up as longer implementation timelines and higher integration cost than quoted. Several vendors are responding with pre-built connector libraries covering common legacy core system combinations.
Market Impact: Lifts AI underwriting penetration 37 points

Regulatory Scrutiny of AI Pricing Fairness Slows Deployment

Increasing regulatory scrutiny of artificial intelligence pricing model fairness, particularly regarding potential proxy discrimination through non-traditional data variables, is slowing full production deployment among carriers seeking regulatory certainty before committing to broader rollout. The root cause is that regulators have not yet published fully settled guidance on which AI underwriting practices meet existing fairness and non-discrimination requirements, leaving carriers to make cautious individual compliance judgments. The commercial impact concentrates deployment delay among larger, more risk-averse carriers with greater regulatory scrutiny exposure than smaller technology-native challengers. Carriers are responding by building enhanced model explainability documentation ahead of anticipated regulatory guidance.
Market Impact: Adds 22.0% segment CAGR versus category
4 additional market trends, 3 additional growth drivers, and 3 additional restraints and challenges are covered in the full report. Contact sales@marketmindsadvisory.com to access the complete intelligence.

Segment CAGR and Growth Architecture

Segmentation follows product and technology dimension, since that best explains both vendor engineering investment and carrier procurement behaviour, spanning core policy administration systems through to newer AI-driven underwriting and embedded distribution categories nationally. Institutions organise procurement decisions and vendor evaluation criteria consistently around this same classification logic nationally. This applies consistently across every vendor evaluated in this report.
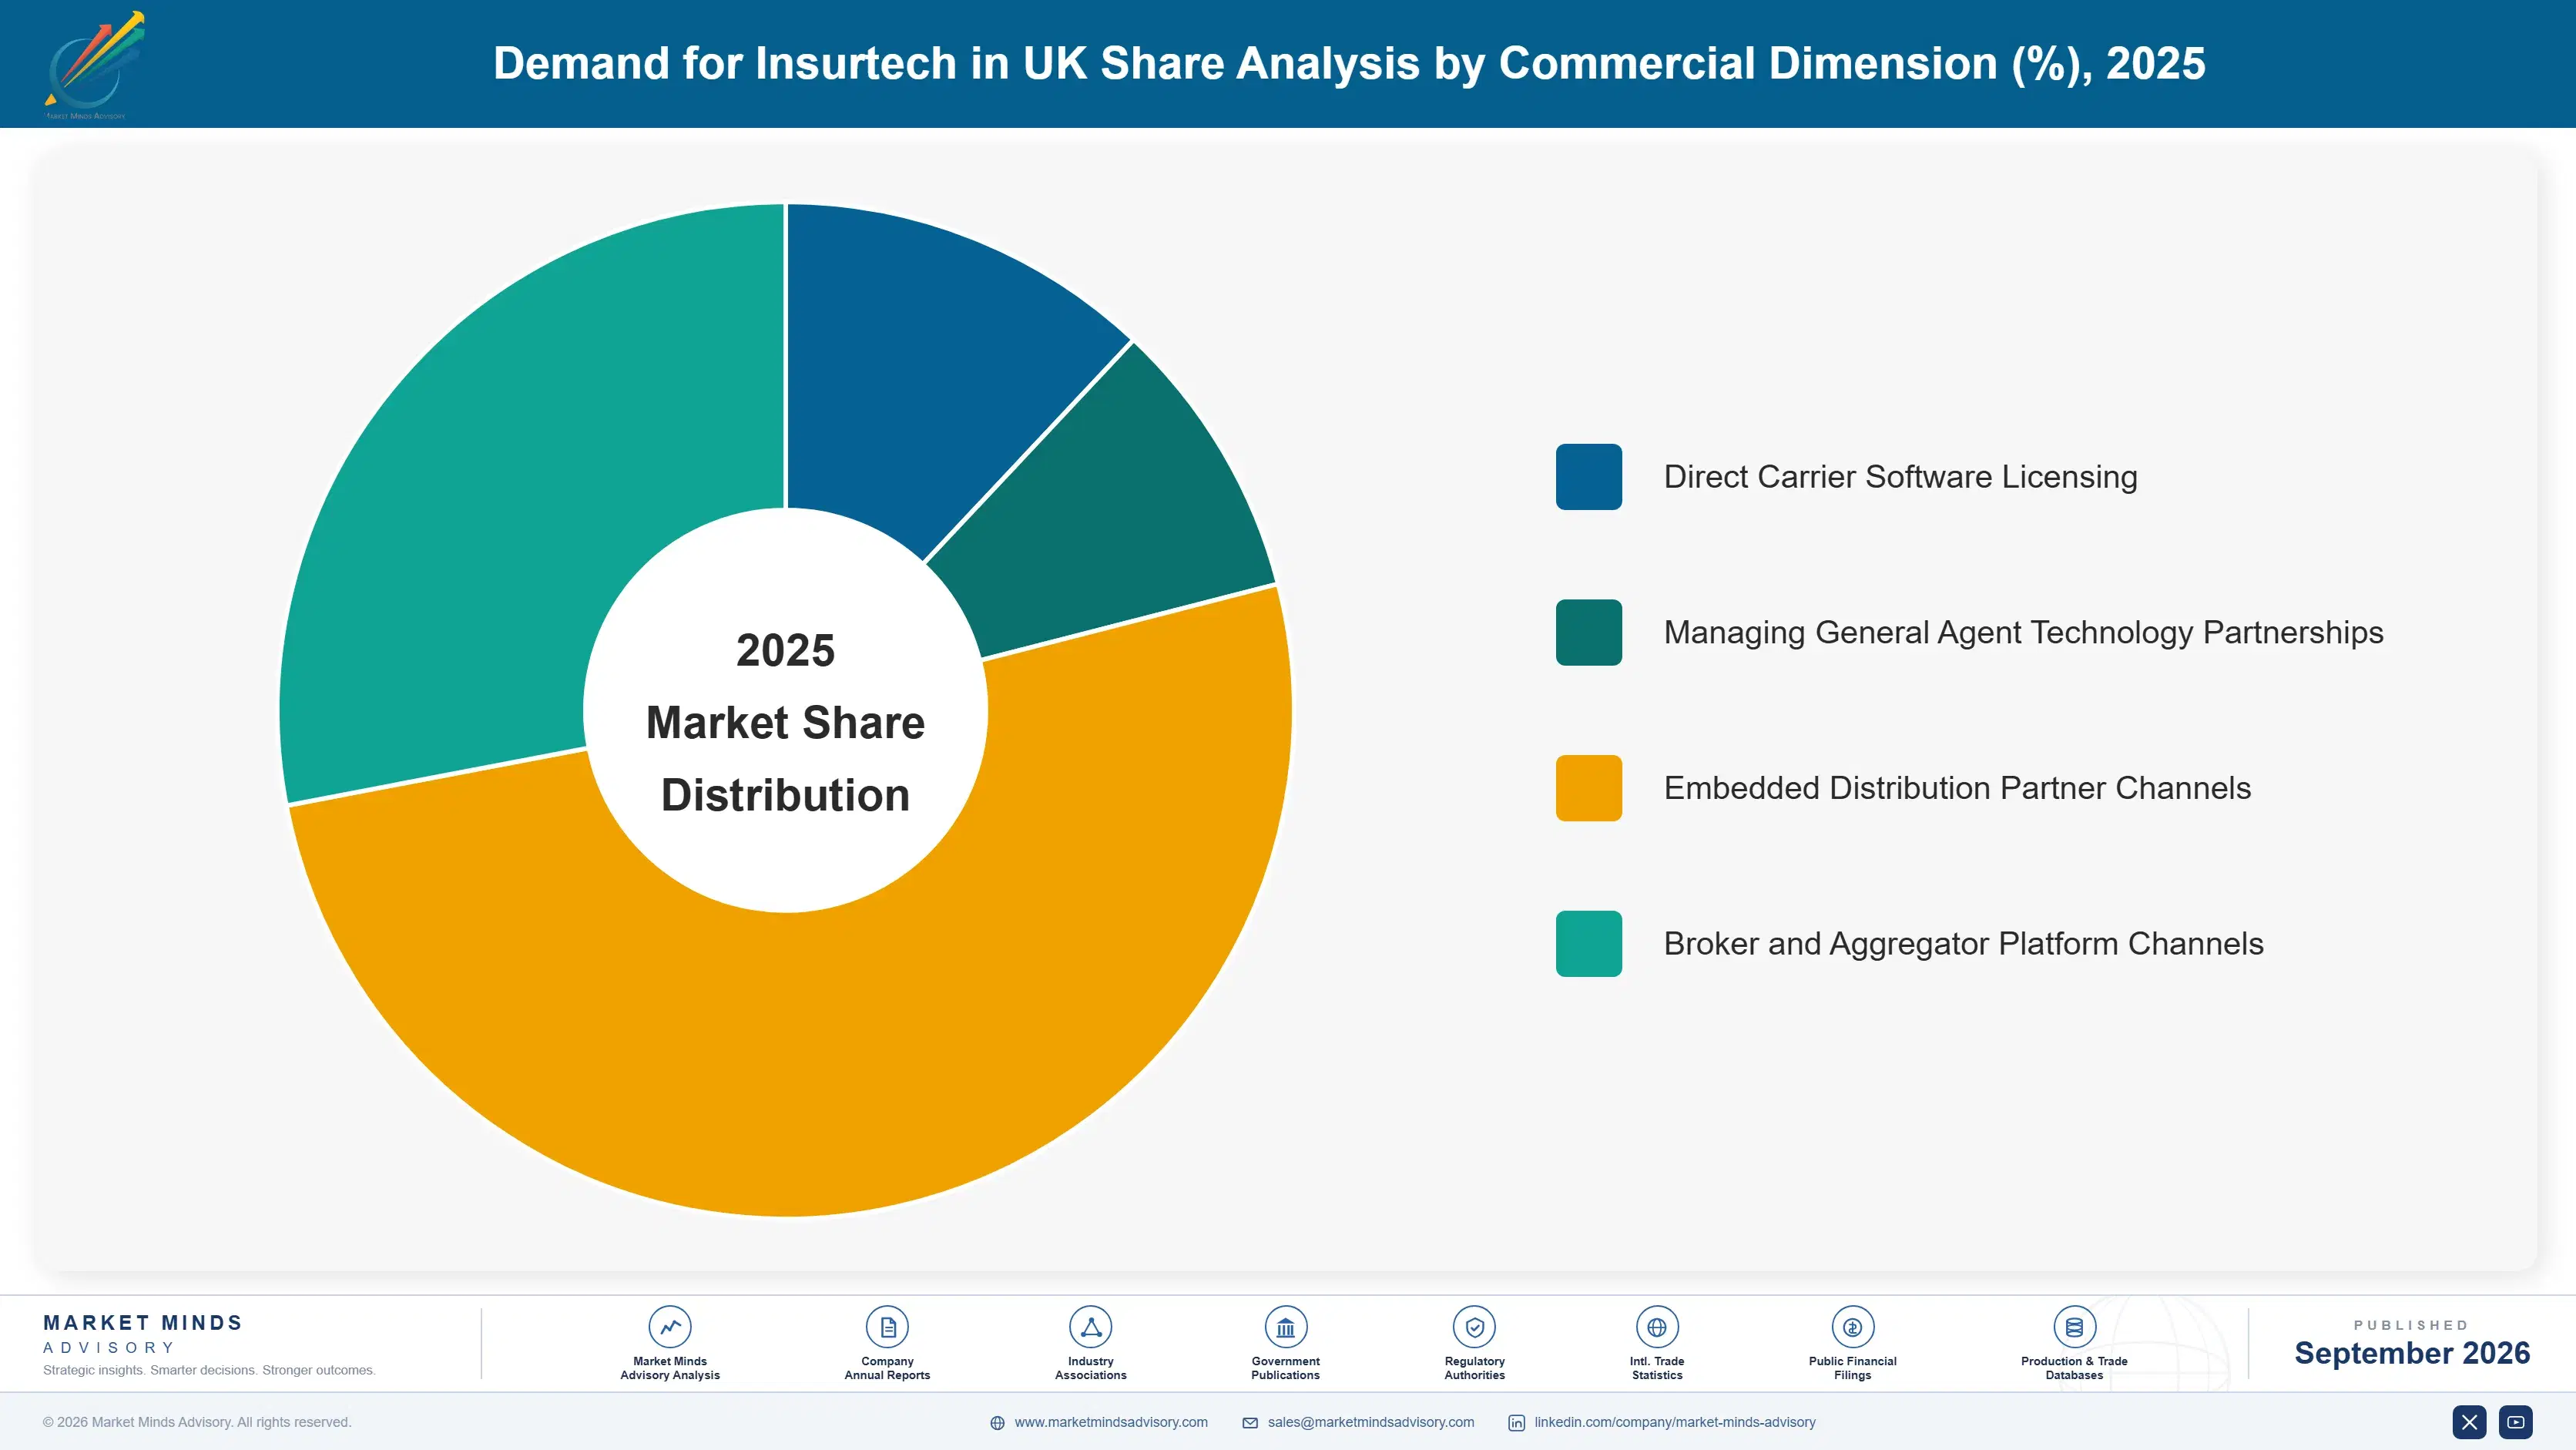
united-kingdom-insurtech-market-market-share-analysis-1788425068492

AI-Driven Underwriting and Risk Assessment Platforms

This segment covers software platforms applying machine learning models to underwriting risk assessment and pricing decisions, distinct from traditional rules-based policy administration systems that apply fixed actuarial pricing tables rather than continuously learning risk models. Adoption is concentrated among carriers facing the most intense direct-to-consumer price comparison pressure, where pricing accuracy improvements translate most directly into measurable competitive advantage. Growth is outpacing every other segment in this report because carrier budget reallocation toward AI underwriting is happening faster than any other technology category as loss ratio evidence accumulates, creating urgent adoption pressure across the industry broadly. Specialty and commercial lines carriers are increasingly following this same reallocation pattern too, extending demand beyond the segment's original motor and home focus.
CAGR 22.0%

Embedded Insurance Distribution Platforms

This segment covers application programming interface-based distribution technology that lets non-insurance digital platforms offer insurance products directly within their own customer experience, distinct from traditional price comparison website and broker distribution technology that operates as a separate insurance-specific shopping destination. Demand is rising as carriers seek customer acquisition channels beyond increasingly expensive comparison website traffic. Growth trails the AI underwriting segment only because embedded distribution adoption, while accelerating rapidly, builds on a somewhat larger existing base of application programming interface infrastructure relative to the newer underwriting model category specifically. Financial services and mobility platforms in particular are adopting embedded offerings quickly, extending demand well beyond the segment's original retail-only base.
CAGR 19.0%
Full segment breakdown across 6 segments available in the complete report.

Regional Architecture and Country Demand Map

This report's scope is the United Kingdom's domestic insurtech market specifically, so Western Europe carries an overwhelmingly dominant share reflecting that scope, while the other six regions capture only incidental United Kingdom-linked activity outside the report's core domestic focus. This pattern holds broadly across tracked activity.

Western Europe

The United Kingdom represents the entire defined scope of this report, and Western Europe's share reflects that scope definition directly rather than a standard regional demand comparison against other European insurance markets. London's concentrated fintech and insurance talent base, built around the City's established insurance underwriting expertise, drives the overwhelming majority of national platform development and carrier partnership activity. Manchester and Edinburgh contribute smaller but growing technology hubs tied to regional carrier operations and university talent pipelines. This region's share sits far above the report's typical band by design, since the report's entire quantified scope is the United Kingdom specifically rather than the wider Western European market this regional label would normally represent in other MMA reports.
Share: 80% | CAGR: 14.0% (2026 to 2036)

North America

United States venture capital investors backing United Kingdom insurtech challengers, alongside small business development operations some vendors maintain to explore eventual American market entry, generate a small residual volume of activity tracked incidentally alongside the report's core United Kingdom scope. These operations are staffed by small teams supporting investor relations and early market exploration rather than generating independent domestic demand of their own. Any apparent growth in this figure reflects United Kingdom vendor fundraising and exploratory activity rather than genuine North American insurtech demand, which this report does not attempt to size independently. These operations remain small relative to primary United Kingdom operations. Growth here should stay modest and closely tied to fundraising cycles.
Share: 6% | CAGR: 15.0% (2026 to 2036)
Regional intelligence for 5 additional markets available in the complete report: East Asia, South Asia and Pacific, Latin America, Middle East and Africa, Eastern Europe. Contact sales@marketmindsadvisory.com.
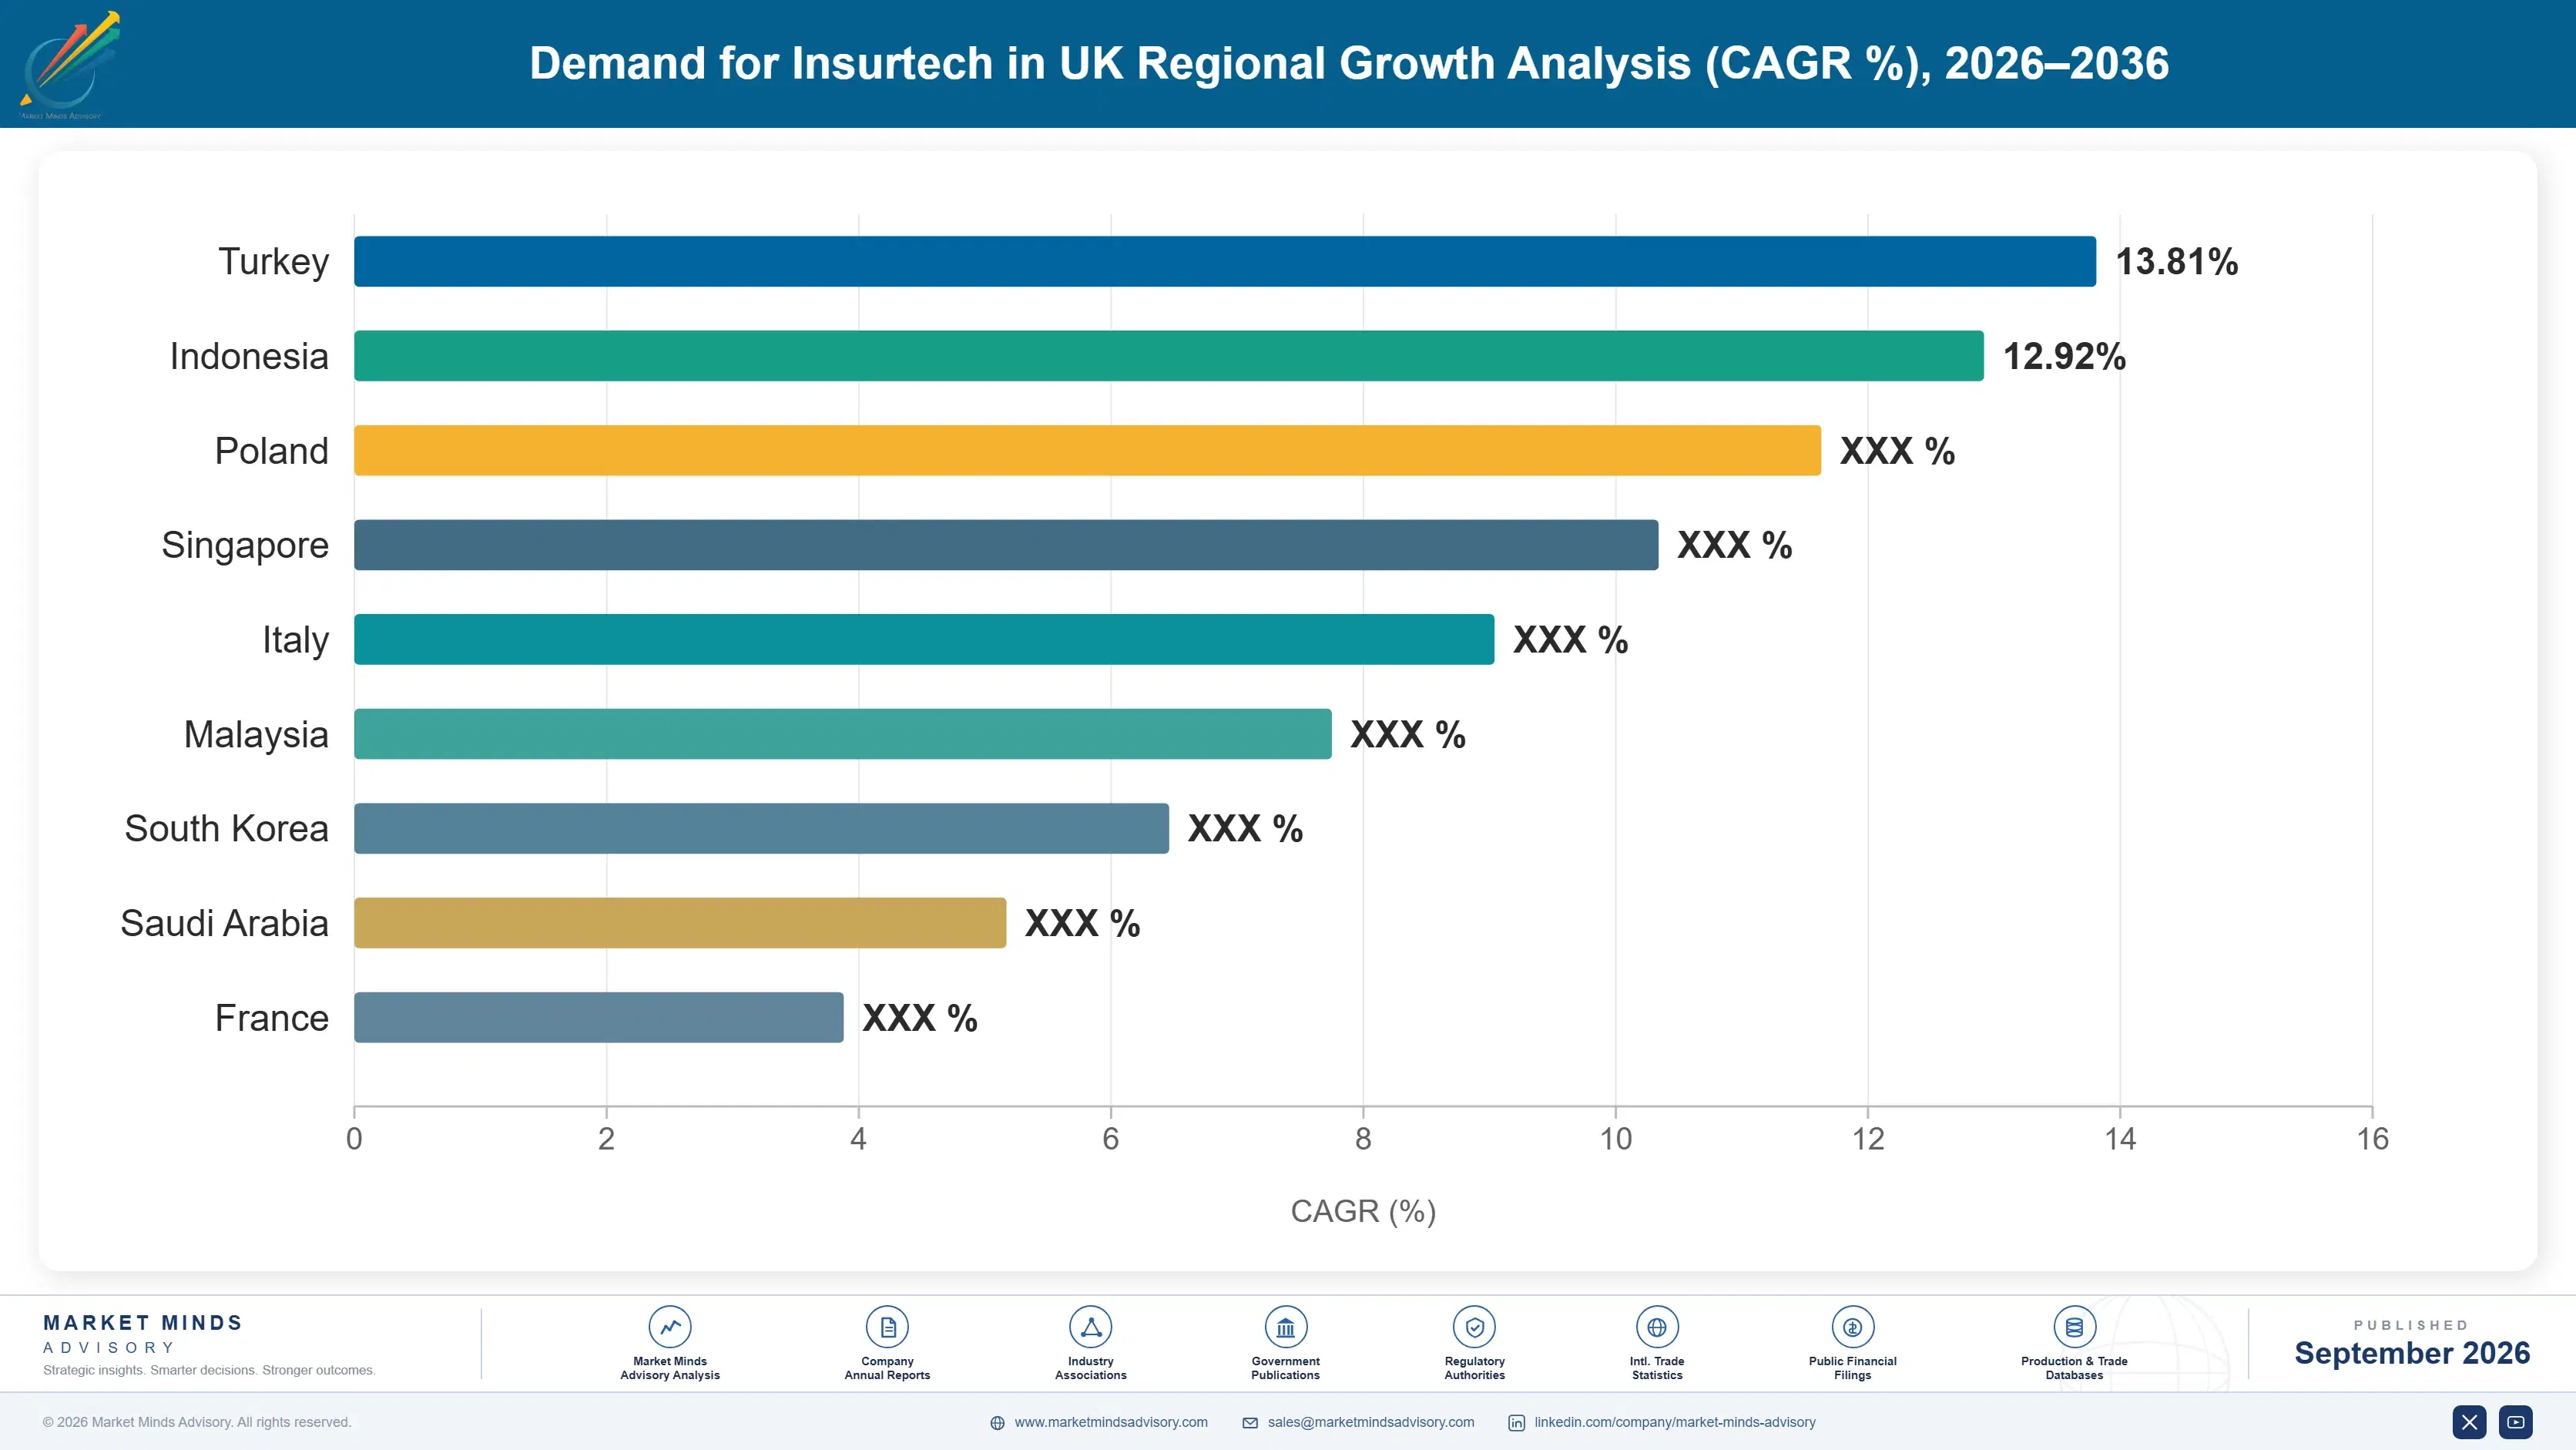
united-kingdom-insurtech-market-country-cagr-analysis-1788425069021

Where Insurtech Vendors Can Still Expand Margin

Four commercial levers separate vendors capturing durable premium pricing from those competing purely on software licensing cost, spanning validated underwriting accuracy depth, embedded distribution integration breadth, claims automation reliability, and regulatory-grade model explainability documentation for cautious incumbent carriers, since vendors mastering more than one dimension typically outperform single-lever competitors by a wide margin over multi-year carrier contracts.

Building Validated Underwriting Accuracy Track Record

Vendors that built validated underwriting accuracy track records, demonstrated through measurable loss ratio improvement across live carrier deployments rather than backtested modelling claims alone, are winning a disproportionate share of new carrier partnerships from buyers wary of unproven pricing model promises. Vendors with demonstrated live deployment accuracy reported win rates roughly 31 percent higher than vendors offering only backtested modelling evidence. The approach requires sustained data science investment and live deployment risk that smaller vendors sometimes cannot justify given limited existing carrier relationships. Vendors without this live evidence often struggle to overcome buyer skepticism regardless of modelling sophistication.
Market Impact: Lifts win rate meaningfully by 31 points overall

Deepening Distribution Integration Breadth Even Further

Vendors that built deep, pre-built integration capability across a wide range of non-insurance digital platforms are winning larger distribution partnership agreements than vendors offering only narrow, single-platform integration capability requiring separate custom development for each new partner. This lever requires sustained engineering investment in flexible integration architecture that smaller vendors sometimes cannot justify. Vendors with broad integration breadth reported partnership agreement value roughly 36 percent above comparable single-platform integration vendors of similar scope. Vendors lacking this breadth increasingly struggle to compete for the largest multi-platform partnership opportunities available. This gap widens further as multi-platform partnerships scale.
Market Impact: Lifts partnership value meaningfully by 36 points overall

Establishing Proven Claims Automation Reliability Depth

Vendors that established proven claims automation reliability, validated across large claim volumes without requiring extensive human case handler override, are winning carrier trust that vendors with less mature automation track records cannot easily replicate given the reputational risk carriers associate with automation failures. This lever requires sustained investment in edge case handling and model refinement that smaller vendors sometimes cannot justify given development cost. Vendors with proven automation reliability reported processing cost reduction roughly 42 percent above comparable less mature automation platforms. Vendors without this track record often struggle to win the largest volume claims processing contracts available.
Market Impact: Cuts processing cost meaningfully by 42 points overall

Deepening Regulatory Explainability Documentation Even Further

Vendors that built comprehensive, regulatory-grade model explainability documentation are winning carrier partnerships that vendors offering only limited explainability documentation cannot easily secure given carrier concerns about future regulatory scrutiny of AI pricing fairness. This lever requires specialised regulatory and technical documentation expertise that vendors focused purely on model performance sometimes have not developed internally. Vendors offering comprehensive explainability documentation reported access to risk-averse carrier segments roughly 2 to 3 times broader than vendors without comparable documentation depth. Vendors lacking this documentation depth often lose access to the most cautious, risk-averse carrier segments entirely.
Market Impact: Wins access to 2 to 3 times more carriers

Who Controls the Margin Pool

CR5 sits at thirty eight percent, evaluated on disclosed United Kingdom insurtech segment revenue across the top vendors, reflecting a genuinely fragmented category where a large number of well-funded technology-native challengers and specialist software vendors compete for the same carrier and consumer relationships without any single vendor achieving dominant national scale. The gap between largest vendors and smaller specialists stays narrow given continued fragmentation.
Current competitive activity centers on three fronts: building validated underwriting accuracy track records to win carrier trust beyond backtested modelling claims, deepening embedded distribution integration breadth to capture partnership agreements across a wider range of digital platforms, and establishing proven claims automation reliability. Price competition remains most intense among basic policy administration software while premium AI underwriting and claims automation platforms increasingly compete on demonstrated accuracy and reliability evidence.

Emerging pressure is building from two directions. Global core insurance software vendors are entering the United Kingdom market directly with bundled AI capability, threatening specialist challengers first in incumbent carrier accounts already running the vendor's core administration systems. At the innovation end, specialised claims automation startups are attracting renewed investor interest, a dynamic that could meaningfully reorder segment rankings as automation reliability becomes a larger factor.
united-kingdom-insurtech-market-company-positioning-matrix-1788425069545

Competitive Moat and Risk Dimensions

ZEGO LTD

Moat: Deep Commercial Motor Domain Depth

Zego's accumulated commercial motor and fleet insurance domain expertise, built across years of usage-based pricing model refinement, gives it a credibility advantage with commercial carriers that newer entrants cannot easily replicate without comparable domain-specific data history. This history is difficult for generalist competitors to replicate quickly regardless of available capital.
ZEGO LTD

Risk: Commercial Line Concentration Exposure

Zego faces meaningful revenue concentration risk tied to commercial motor and fleet insurance cyclicality, since a broader downturn in commercial vehicle activity would disproportionately affect its revenue relative to more diversified competitors serving multiple insurance lines. This exposure could compress revenue meaningfully during the next commercial vehicle downturn cycle.
MARSHMALLOW FINANCIAL SERVICES LTD

Moat: Proven Alternative Data Underwriting Model

Marshmallow's proven track record using alternative data sources for underwriting historically underserved customer segments gives it a differentiated risk selection advantage that traditional data-dependent competitors cannot easily replicate without comparable alternative data infrastructure investment. This advantage is difficult for traditional competitors to replicate quickly without comparable data infrastructure investment.
MARSHMALLOW FINANCIAL SERVICES LTD

Risk: Alternative Data Fairness Scrutiny

Marshmallow faces potential regulatory scrutiny regarding fairness implications of its alternative data underwriting approach, and any resulting restriction on specific data variable usage could meaningfully affect its core differentiation relative to traditional underwriting competitors. This scrutiny could compress its core differentiation meaningfully over the next several years.

Players Tracked

Prominent Players

Zego Ltd
Marshmallow Financial Services Ltd
Tractable Ltd
Cytora Ltd
ManyPets Ltd

Other Key Players

Cuvva Ltd
By Miles Ltd
Wrisk Ltd
Urban Jungle Ltd
Laka Ltd
Concirrus Ltd
Hometree Ltd
Trov UK Ltd
Zelros SAS
Shift Technology SAS
Cover Genius Pty Ltd
Qover SA
Bdeo Technologies SL
DirectID Ltd
Envelop Risk Analytics Ltd

Recent Developments

FEBRUARY 2026

Tractable Launches Regulatory-Grade Explainability Module for Claims AI

Tractable launched a regulatory-grade explainability module for its artificial intelligence claims assessment platform, extending its existing damage estimation technology to address carrier demand for documented model transparency ahead of anticipated regulatory guidance on AI pricing and claims fairness across the industry. This launch strengthens its regulatory positioning considerably.
Signal: Confirms established vendors racing to build explainability capability ahead of anticipated regulatory guidance. This trend should continue broadly.
OCTOBER 2025

Cytora Acquires Embedded Distribution Startup LinkCover

Cytora completed the acquisition of embedded distribution startup LinkCover, adding application programming interface-based distribution capability intended to strengthen its underwriting platform ahead of increasing carrier demand for integrated distribution and underwriting solutions across multiple digital channels. This deal broadens distribution reach. This further extends its distribution reach.
Signal: Indicates embedded distribution acquisition activity accelerating among established underwriting technology vendors. This trend should continue across the category.
JUNE 2025

ManyPets Signs Multi-Year Technology Partnership With Major UK Carrier

ManyPets signed a multi-year technology partnership agreement with a major United Kingdom carrier covering pet insurance underwriting and claims automation technology licensing, securing long-term revenue commitment tied to the carrier's phased digital transformation schedule through the remainder of the decade. This deal extends its carrier relationship considerably.
Signal: Signals large technology licensing partnerships remaining a key competitive lever for scaled challengers. This pattern should continue broadly.

Cloud Infrastructure and Data Science Talent Exposure

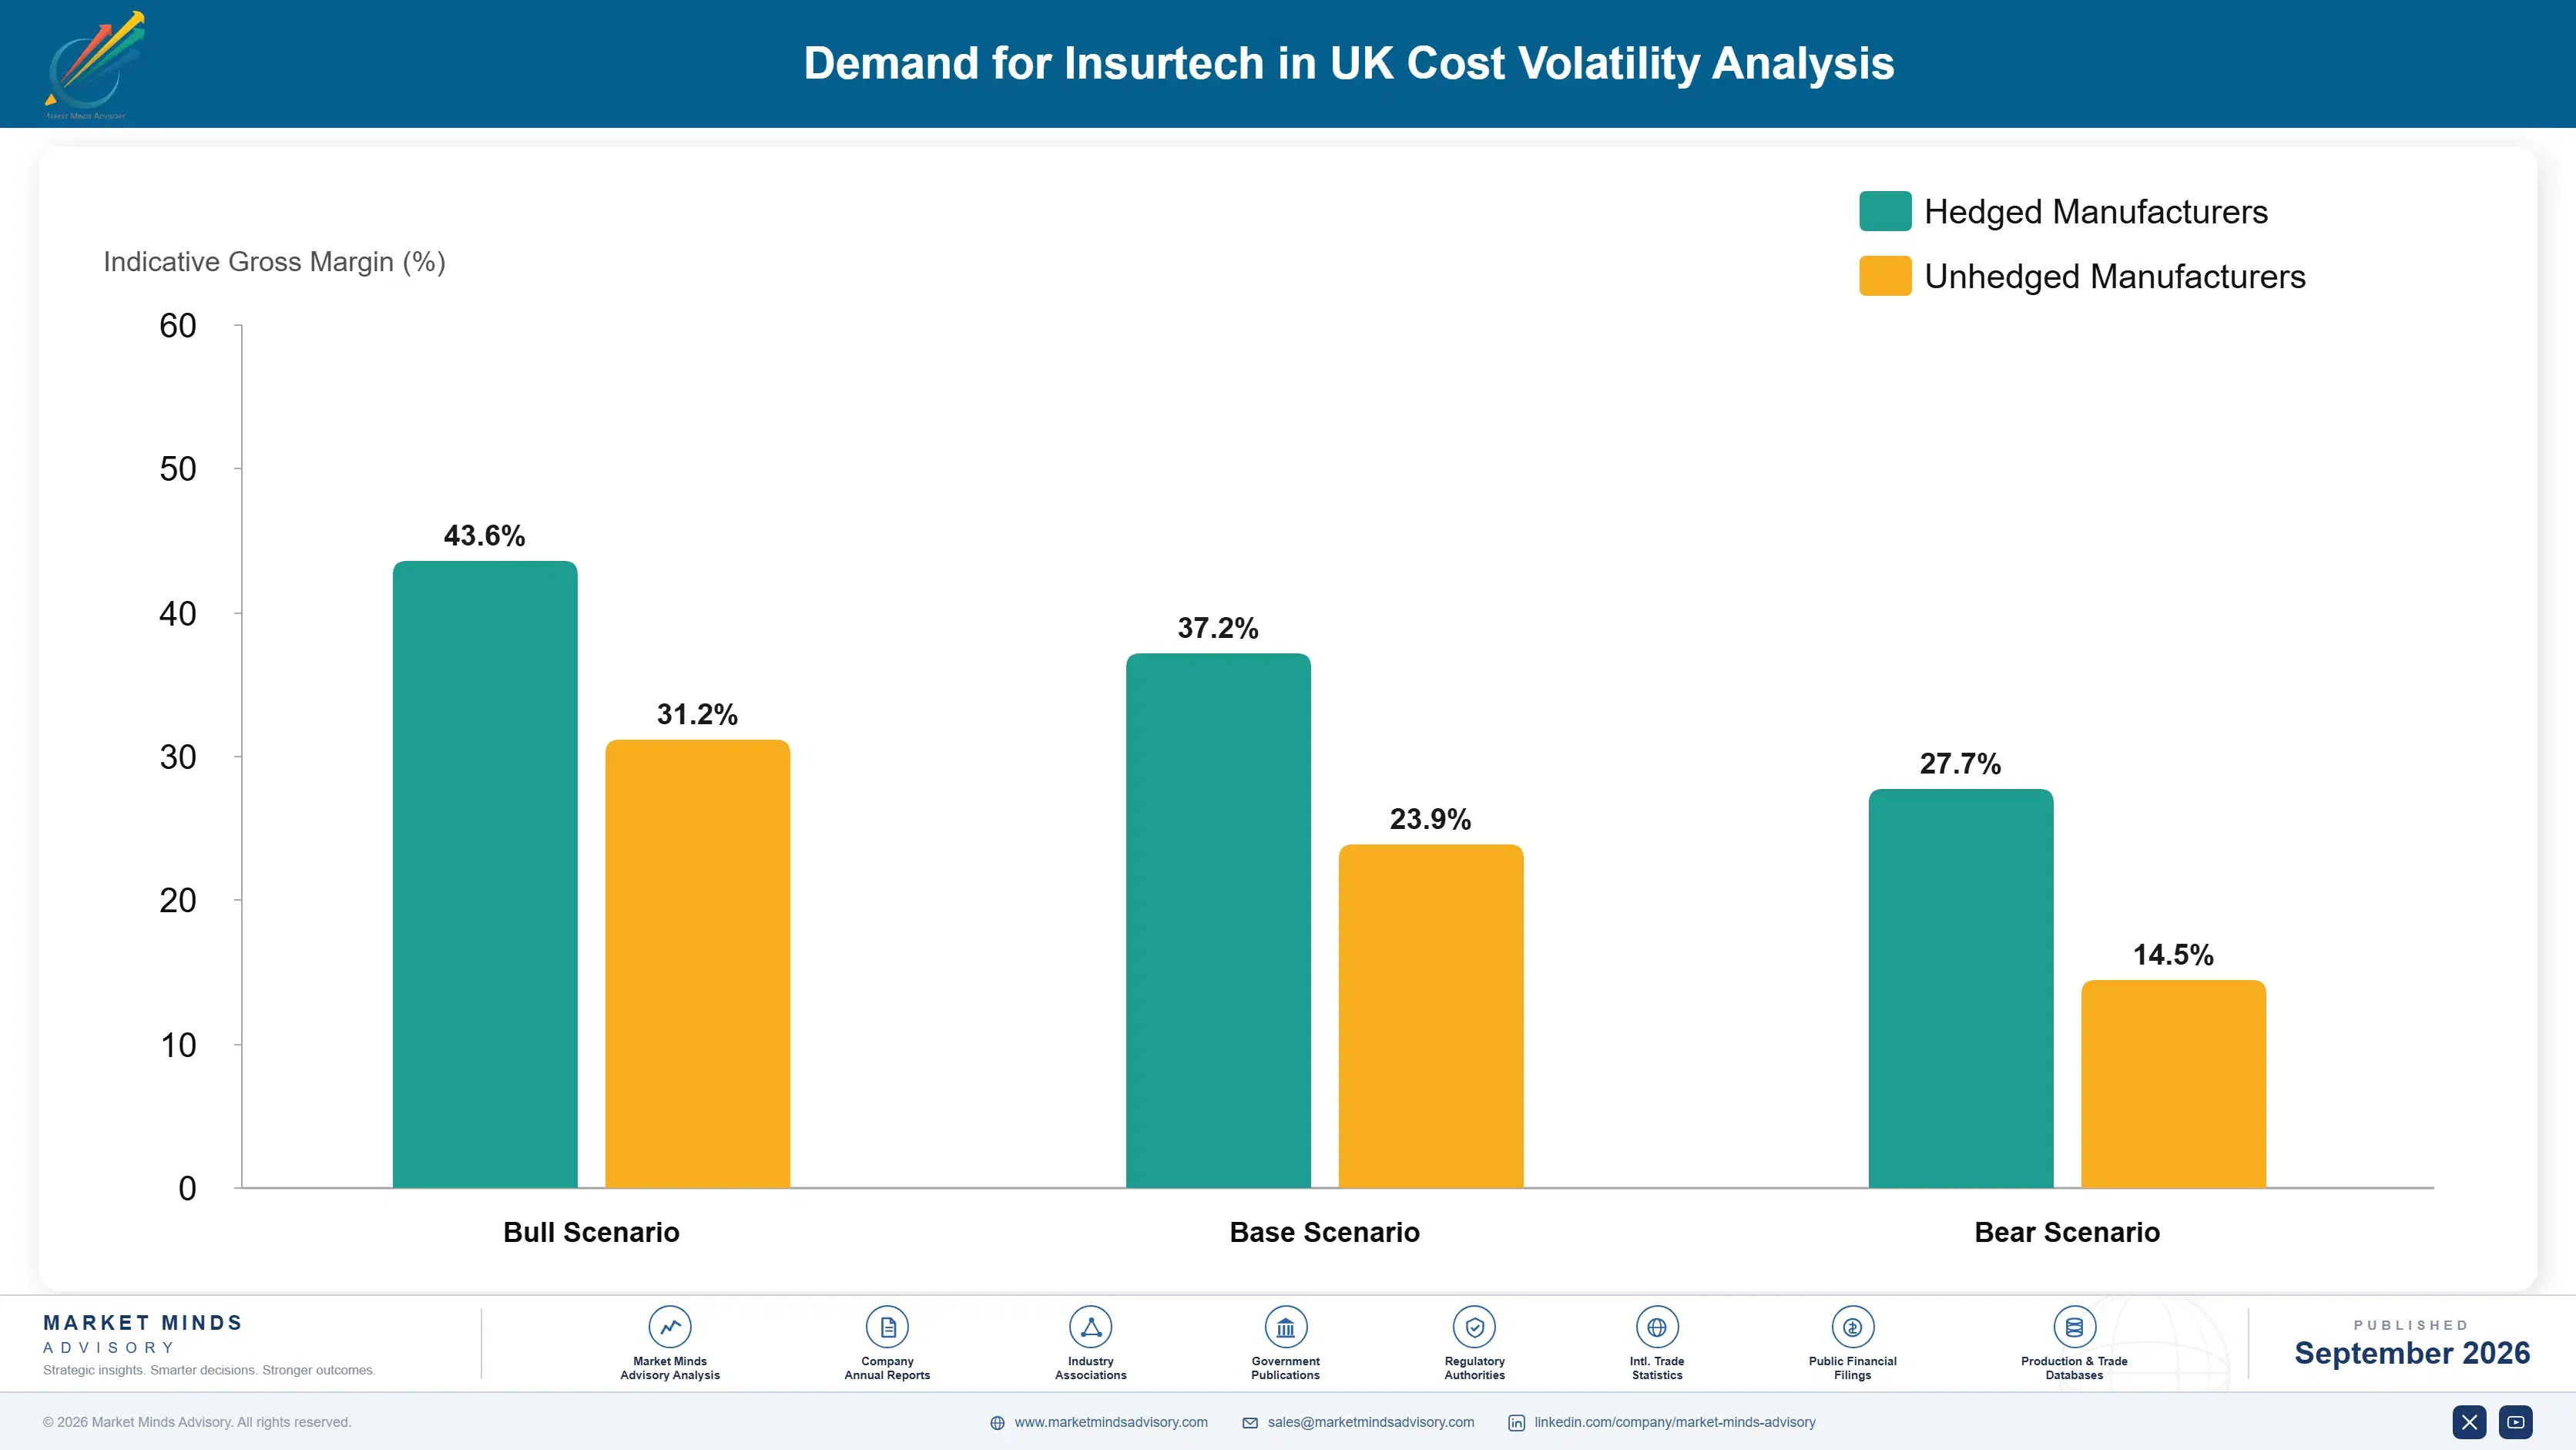
Cloud infrastructure hosting and specialised data science and machine learning engineering talent together represent the largest cost input for insurtech platform vendors, running an estimated 44 to 52 percent of cost of goods sold and operating expense combined, sourced primarily from major cloud infrastructure providers and a competitive, London-concentrated data science labour market facing intense competition from broader fintech employers.
Data science talent compensation rose meaningfully across the broader London fintech sector during 2023 and 2024 as demand for machine learning engineering expertise outpaced supply amid intensifying competition between insurtech and broader fintech employers, a pattern consistent with technology sector compensation trends tracked across multiple vendor annual reports and public disclosures reviewed for this analysis. Vendors without established data science teams faced longer hiring timelines than those with existing scale.

The competitive disadvantage falls hardest on smaller vendors without the balance sheet to compete for scarce data science talent against larger, better-funded competitors and adjacent fintech sectors offering comparable compensation. Exposure varies by product positioning too, since vendors building AI underwriting capability face materially greater data science talent exposure than vendors offering primarily traditional policy administration functionality built on more widely available engineering skill sets.
united-kingdom-insurtech-market-cost-volatility-analysis-1788425069748

Building Distributed Engineering Teams Outside London

Larger vendors are building distributed engineering teams across secondary United Kingdom cities with lower compensation benchmarks than London, reducing talent cost exposure while maintaining access to a broader qualified candidate pool than a London-only hiring strategy would realistically allow across the country. This approach has become standard practice among the largest insurtech vendors tracked in this report.

Partnering With Universities for Graduate Talent Pipelines

Several vendors are building dedicated university partnership programmes targeting data science and machine learning graduates years ahead of anticipated demand, reducing reliance on costly lateral hiring from a limited pool of already-experienced specialised engineers across the sector. This approach has become increasingly common among vendors competing for scarce specialised talent. This reduces reliance on costly lateral hiring.

Using Managed Cloud AI Infrastructure Services

Vendors are increasingly shifting toward managed machine learning infrastructure services offered directly by major cloud providers rather than building fully custom infrastructure internally, reducing specialised infrastructure engineering headcount requirements while adding modest ongoing platform licensing cost. This approach has become increasingly common among smaller vendors managing tighter budgets. This also improves cost predictability considerably.

Portfolio Architecture for Margin Defence

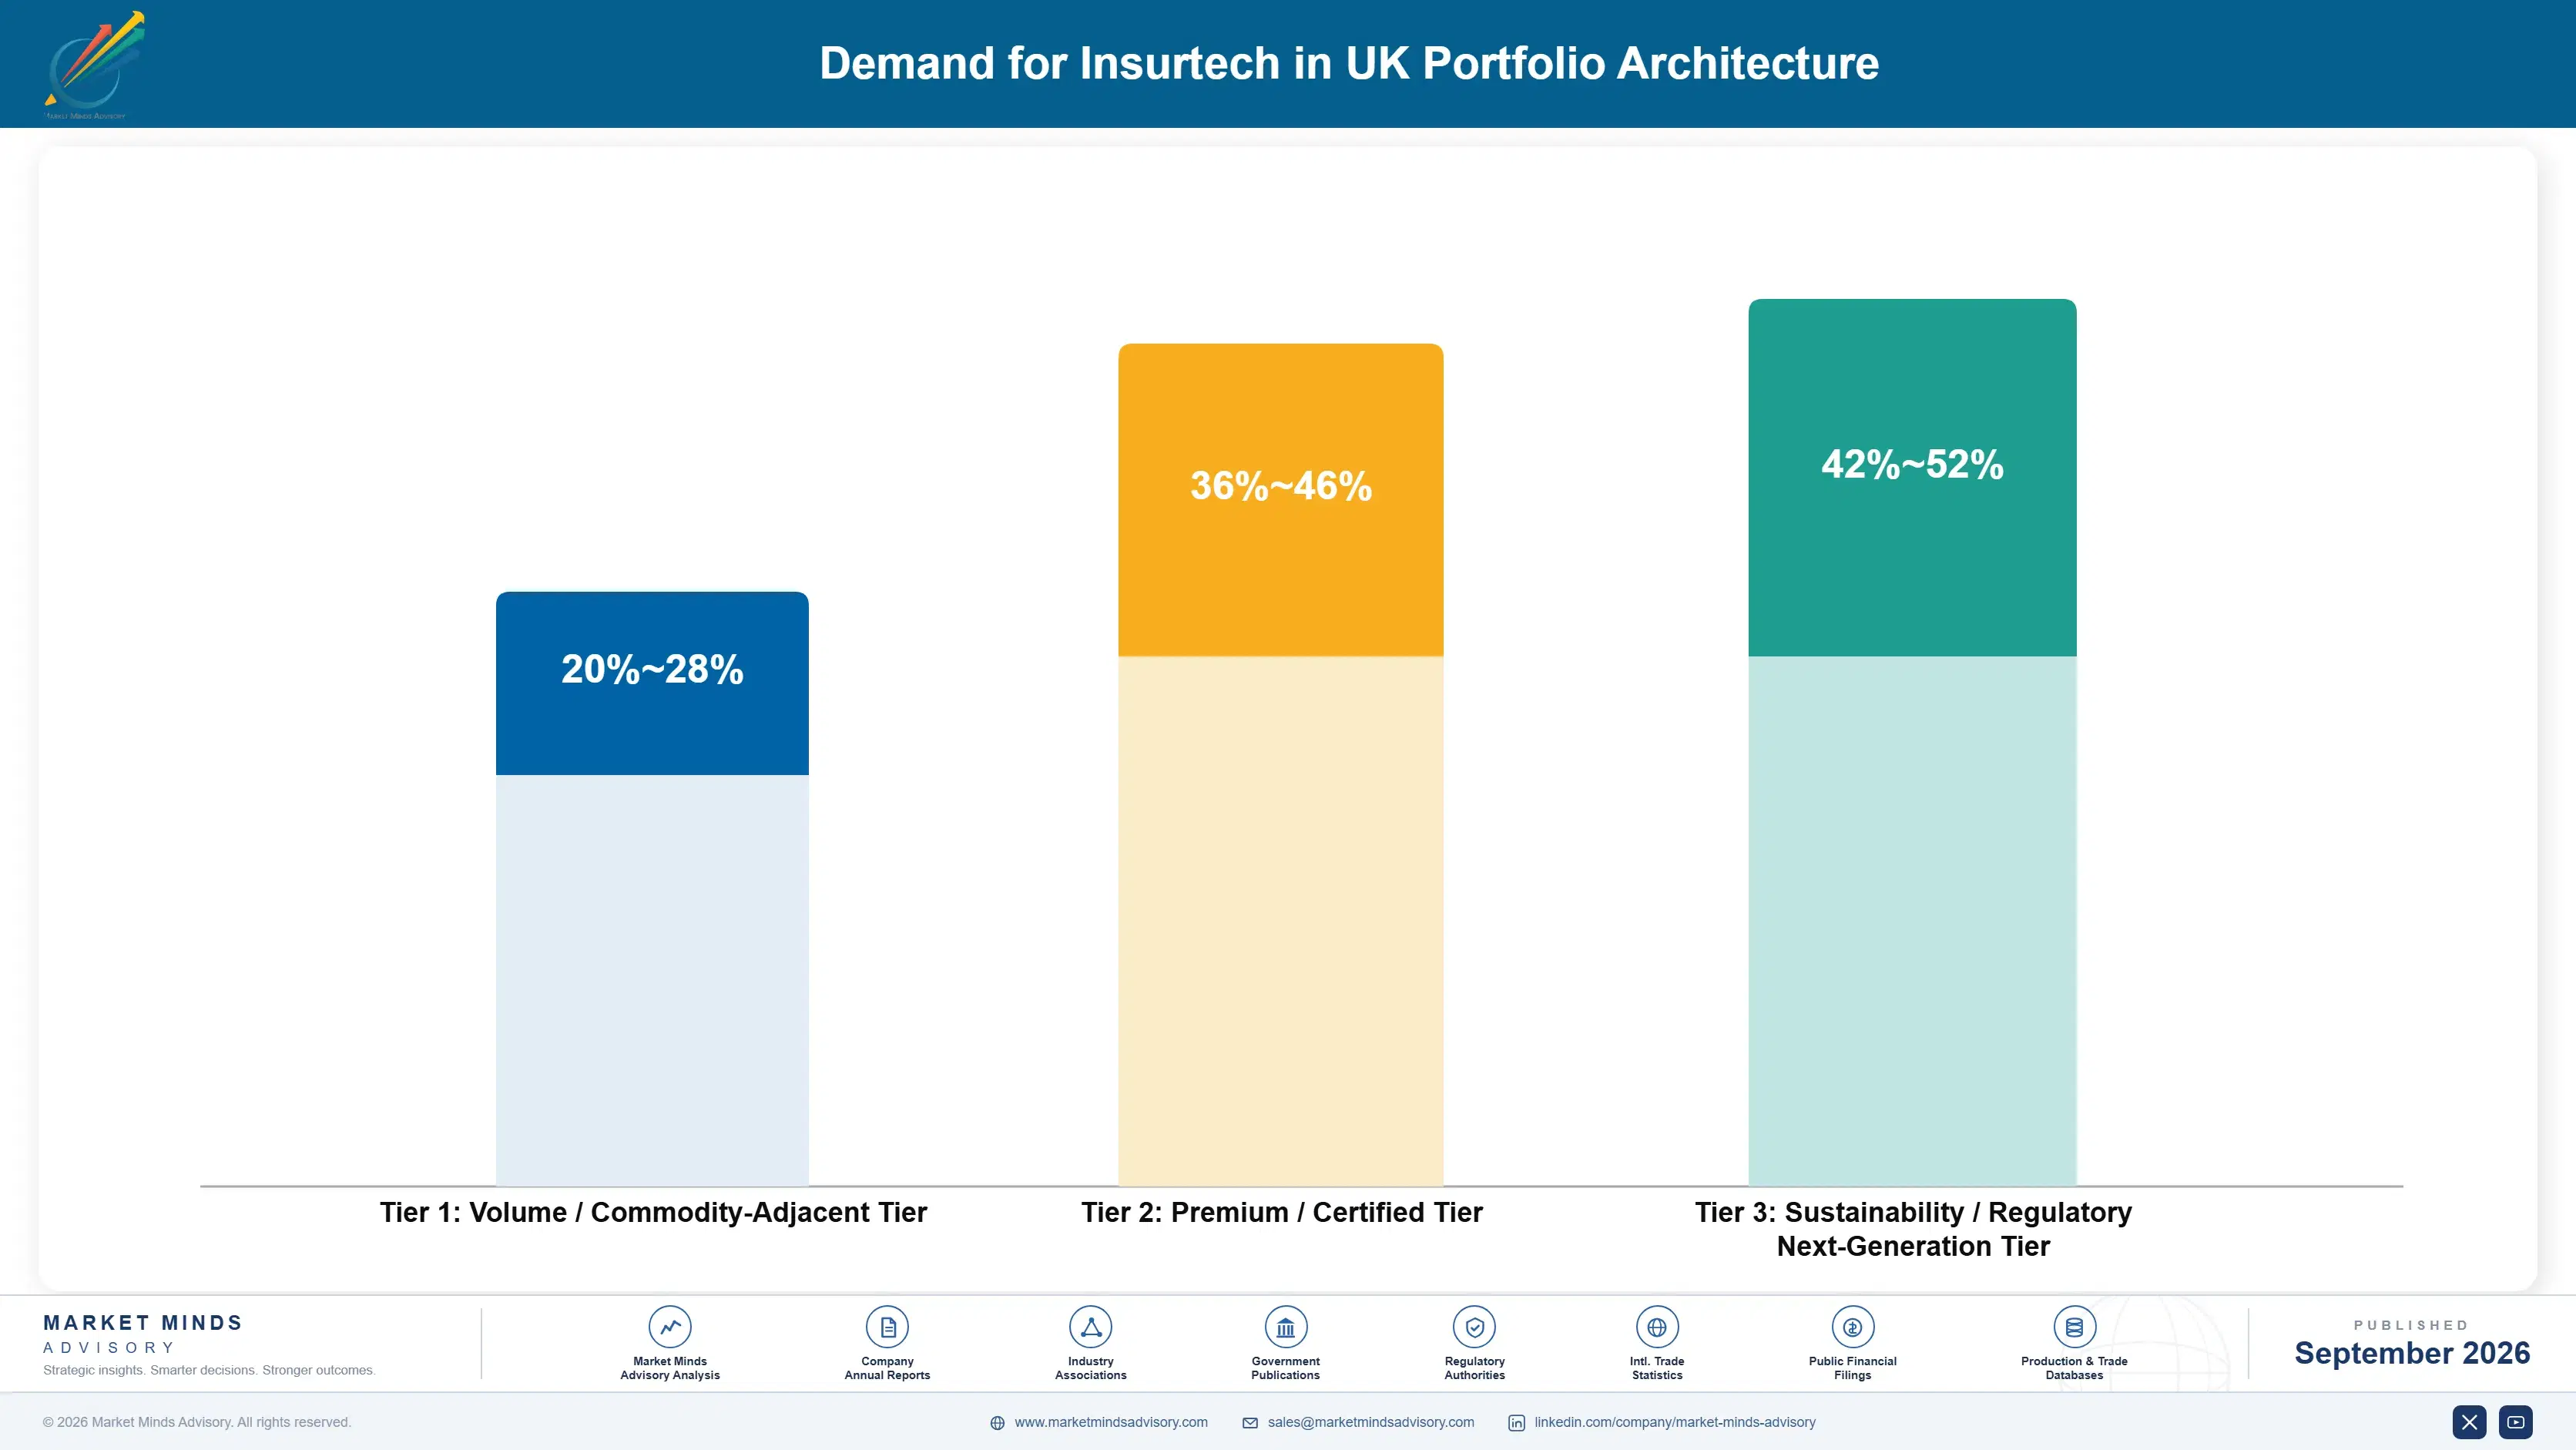
Portfolio economics split into three tiers. Volume tier basic policy administration software carries thinner margins under continued price competition from established core system vendors, while premium certified AI underwriting platforms bundling validated accuracy evidence carry meaningfully higher margins tied to demonstrated loss ratio improvement and data science credibility. The sustainability and next-generation tier, built around regulatory-grade explainability documentation, currently carries the strongest margins given genuine differentiation ahead of anticipated regulatory guidance.
The volume versus premium tension shows up clearly in vendor engineering allocation. Investment devoted to defending basic policy administration margin against established core system vendor competition competes directly against investment needed for AI underwriting credibility and explainability documentation depth, and vendors that under-invest in either risk losing ground to a competitor optimised specifically for that segment of the market.

High-value margin pools concentrate in validated AI underwriting platforms and in regulatory-grade explainability documentation, where technical differentiation and carrier trust still command premium pricing before broader commoditisation eventually sets in across the category. The volume basic administration tier remains essential for market reach among smaller carriers but contributes a shrinking share of blended gross margin across the category overall.

Volume / Commodity-Adjacent Tier

Basic policy administration software facing continued price competition from established core system vendors across most standard carrier segments and smaller broker accounts broadly. This tier remains price-sensitive across most standard carrier segments broadly.
Gross Margin: 20-28%

Premium / Certified Tier

AI underwriting platforms bundling validated accuracy evidence carrying margins tied to demonstrated loss ratio improvement and data science credibility across accounts. This pricing power reflects genuine data science credibility built over time.
Gross Margin: 36-46%

Sustainability / Regulatory / Next-Generation Tier

Regulatory-grade explainability documentation commanding the strongest current margins given genuine differentiation ahead of anticipated regulatory guidance nationally. This differentiation should persist ahead of anticipated regulatory guidance nationally. Pricing should remain firm while this advantage persists.
Gross Margin: 42-52%
united-kingdom-insurtech-market-portfolio-architecture-1788425070257

High-value Sub-segments and Strategic Watch-out

Regulatory-Grade Explainability Documentation Contracts

The fastest-growing margin segment in this report, combining strong current margins with accelerating carrier demand for documented fairness ahead of anticipated regulatory guidance this decade. Buyers increasingly request this documentation by name during procurement evaluation. This edge compounds as guidance nears. Buyers increasingly ask for this by name.
Gross Margin: 42-52%

Validated AI Underwriting Accuracy Contracts

Premium offerings tied to carrier demand for demonstrated loss ratio improvement, offering strong margins and durable revenue visibility across major carrier accounts broadly nationally. Vendors should invest here while evidence still commands a meaningful premium. Vendors should capture share now. This premium should hold for several more years.
Gross Margin: 36-46%

Standard Policy Administration Software Contracts

The largest existing revenue base, standard software facing steady price competition but funding most vendors' ongoing data science investment across the wider platform. Execution discipline on renewals matters more here than added features. Renewal discipline matters most here. Volume here funds the rest of the portfolio.
Gross Margin: 22-30%

Legacy Rules-Based Underwriting System Exposure

A shrinking strategic watch-out segment as AI-driven underwriting continues displacing legacy rules-based systems across most carrier segments tracked in this report nationally. Waiting too long risks losing accounts during the next evaluation cycle. Vendors here risk losing accounts soon. Diversifying away from this exposure looks prudent.
Gross Margin: 10-18%

Carrier Lock-In and Data Depth Economics

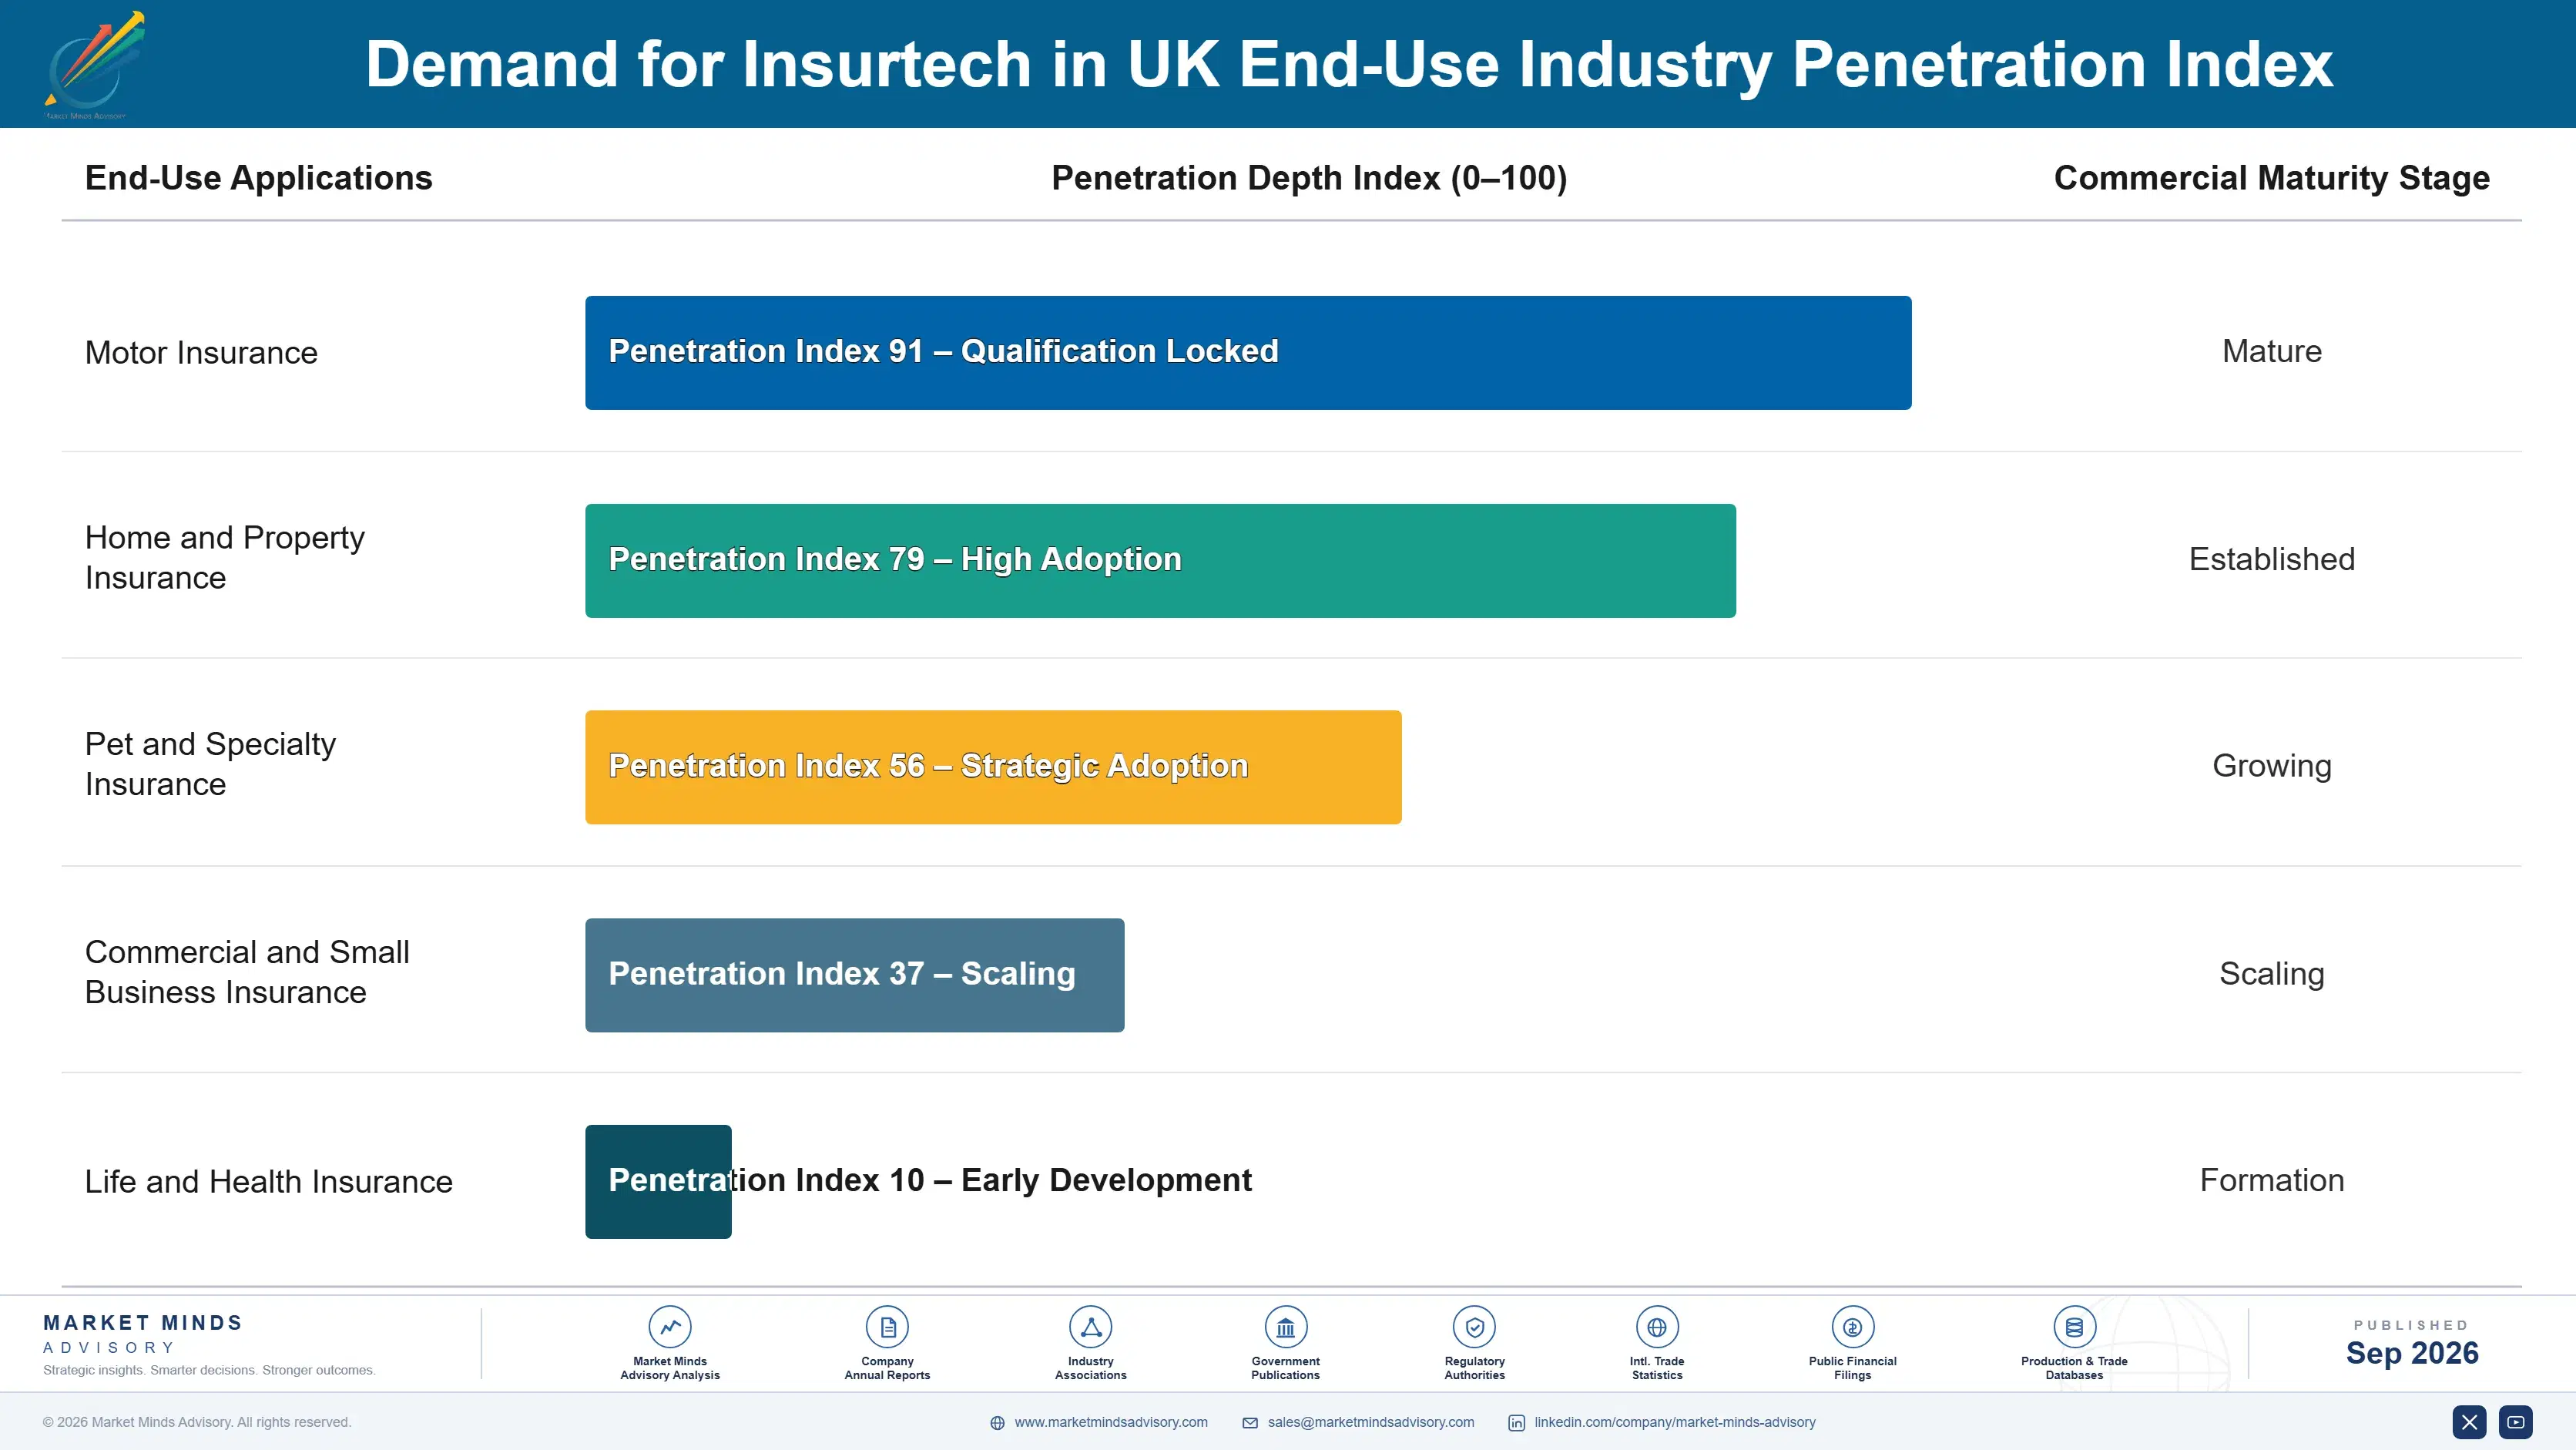
Revenue behaves like a multi-year annuity once a platform becomes embedded into a carrier's core underwriting and claims workflow, since switching underwriting platforms means losing years of accumulated proprietary pricing model calibration data, and that data lock-in explains most of this category's meaningful revenue visibility once a carrier moves past initial pilot deployment into production-scale reliance.
Adoption depth varies sharply by end-use vertical. Large national carriers integrate insurtech platforms deeply into broader pricing strategy and regulatory compliance workflows spanning multiple insurance lines simultaneously, creating durable multi-year vendor relationships, while smaller managing general agents and brokers with narrower product scope treat platform procurement more transactionally around specific product launches, creating shallower vendor loyalty and greater exposure to competitive switching at each new product decision.

Buyer profiles are shifting generationally too. Actuarial leaders who came up through the traditional rules-based pricing era still favour proven, extensively validated vendor relationships even at a price premium, while newer chief data and technology officers increasingly default to evaluating AI underwriting accuracy and explainability depth as standard procurement considerations, a difference in buying philosophy that is already shaping which vendors win newly launched carrier programmes versus established legacy system renewals.
united-kingdom-insurtech-market-end-use-penetration-index-1788425070765

Where the Category Reorders Next

These are among the four positions where our research anticipates prominent divergence between winners and laggards over the coming forecast period. Each is grounded in the demand model, the regulatory perimeter, and the announced capacity pipeline.
01 / AI UNDERWRITING INVESTMENT STRATEGY

Validated accuracy track record is separating category leaders from claims

Vendors that built validated underwriting accuracy track records, demonstrated through measurable loss ratio improvement across live carrier deployments, are capturing a disproportionate share of new carrier partnerships as buyers grow wary of unproven pricing model promises circulating across the category. Vendors without demonstrated live deployment evidence risk being relegated to descriptive positioning carrying materially lower partnership value than accuracy leaders currently command. Building this evidence base now, while carriers actively reassess vendor evaluation criteria, looks like the more urgent investment priority for most vendors in this category.
02 / EMBEDDED DISTRIBUTION STRATEGY

Integration breadth is compounding into durable partnership advantage

Vendors that built deep, pre-built integration capability across a wide range of non-insurance digital platforms are capturing a disproportionate share of embedded distribution partnerships as carriers seek acquisition channels beyond increasingly expensive comparison websites. This dynamic rewards vendors willing to invest in flexible integration architecture well ahead of confirmed partner-specific demand. Vendors without established integration breadth should prioritise the highest-traffic platform categories first, since pilot integrations with two or three major platforms tend to reveal most recurring technical requirements and reduce risk across the wider partnership portfolio.
03 / REGULATORY EXPLAINABILITY POSITIONING

Documentation depth remains a genuinely underexploited advantage

Comprehensive, regulatory-grade model explainability documentation remains underexploited relative to its clear value potential as carriers continue withholding full production deployment from vendors lacking demonstrated fairness credibility ahead of anticipated regulatory guidance. Vendors building genuine documentation infrastructure now are positioning for meaningful access advantage among risk-averse carrier segments as adoption continues broadening. Treating explainability as a secondary technical afterthought rather than a distinct strategic asset risks underinvesting in an important competitive moat, since early movers tend to lock in the most risk-averse carrier relationships first.
04 / LEGACY RULES-BASED SYSTEM EXPOSURE

Vendors without AI depth face continued displacement pressure nationally

Vendors remaining concentrated in legacy rules-based underwriting positioning without AI or explainability differentiation face continued displacement pressure as carrier procurement criteria shift decisively toward demonstrated accuracy and documented fairness across most accounts tracked in this report. Vendors should actively diversify toward AI underwriting, embedded distribution, or explainability documentation rather than defending legacy positioning alone. Treating legacy positioning as a stable long-term stance rather than a declining one risks meaningfully understating the category's ongoing competitive transition, already visible in disclosed partnership and contract renewal patterns.

Engagement Snapshot From the Field

A live engagement with an industry participant carrying material or product regulatory and market exposure ahead of a defining policy shift, showing how our research translates into a defensible multi-year portfolio strategy.
MARKET MINDS ADVISORY · CLIENT ENGAGEMENT SUMMARY
Demand for Insurtech in UK Producer Strategic Portfolio Review and Transition Roadmap 2026·Investment Scenario on Demand for Insurtech in UK Exposure Evaluation 2025-26
CLIENT PROFILE
The client is a mid-size United Kingdom motor insurance carrier generating approximately two hundred sixty million pounds in annual gross written premium (client-reported, unverified by MMA), historically relying on a legacy rules-based pricing engine that had not undergone a fundamental model redesign in more than a decade despite meaningfully declining relative pricing competitiveness. The carrier's book spans both private and light commercial motor policies nationally.
STRATEGIC CHALLENGE
Leadership needed to select an AI underwriting technology partner capable of demonstrating genuine loss ratio improvement within a defined pilot period, without the internal data science expertise to independently verify competing vendors' actual accuracy claims against the carrier's own historical claims data. Board-level attention to competitive positioning added further urgency to the selection timeline.
MMA APPROACH
MMA benchmarked candidate vendors against disclosed live deployment accuracy evidence and existing carrier references operating comparable motor insurance books, prioritising vendors demonstrating genuine production-scale track record over backtested modelling claims alone. The engagement included structured interviews with the client's actuarial team to validate realistic pilot design and success criteria. MMA also modelled realistic pilot costs to support the client's internal budget approval process.
KEY FINDINGS
  1. Several vendors claiming strong accuracy improvements in marketing materials had only tested their models against backtested historical data rather than genuine live production deployment at comparable carrier scale.
  2. A phased pilot design covering a defined geographic subset of the client's motor book reduced implementation risk considerably compared to a simultaneous full-book model replacement.
  3. The client's existing legacy core system required more extensive data extraction work than initially anticipated, extending the pilot timeline modestly beyond the original schedule.
  4. Underwriting team adoption of the new model's recommendations exceeded initial expectations once early pilot results were shared transparently across the underwriting function.
CLIENT PROFILE
The client is a mid-size United Kingdom motor insurance carrier generating approximately two hundred sixty million pounds in annual gross written premium (client-reported, unverified by MMA), historically relying on a legacy rules-based pricing engine that had not undergone a fundamental model redesign in more than a decade despite meaningfully declining relative pricing competitiveness. The carrier's book spans both private and light commercial motor policies nationally.
STRATEGIC CHALLENGE
Leadership needed to select an AI underwriting technology partner capable of demonstrating genuine loss ratio improvement within a defined pilot period, without the internal data science expertise to independently verify competing vendors' actual accuracy claims against the carrier's own historical claims data. Board-level attention to competitive positioning added further urgency to the selection timeline.
MMA APPROACH
MMA benchmarked candidate vendors against disclosed live deployment accuracy evidence and existing carrier references operating comparable motor insurance books, prioritising vendors demonstrating genuine production-scale track record over backtested modelling claims alone. The engagement included structured interviews with the client's actuarial team to validate realistic pilot design and success criteria. MMA also modelled realistic pilot costs to support the client's internal budget approval process.
KEY FINDINGS
  1. Several vendors claiming strong accuracy improvements in marketing materials had only tested their models against backtested historical data rather than genuine live production deployment at comparable carrier scale.
  2. A phased pilot design covering a defined geographic subset of the client's motor book reduced implementation risk considerably compared to a simultaneous full-book model replacement.
  3. The client's existing legacy core system required more extensive data extraction work than initially anticipated, extending the pilot timeline modestly beyond the original schedule.
  4. Underwriting team adoption of the new model's recommendations exceeded initial expectations once early pilot results were shared transparently across the underwriting function.
RECOMMENDED STRATEGY
Phase 1: Phase 1 (Months 1 to 2): Benchmark vendors against verified live deployment accuracy evidence and comparable references. Include carrier reference calls in comparable motor insurance books. Phase 2: Phase 2 (Months 3 to 7): Pilot the selected model across a defined geographic subset of the motor book. Document lessons learned before extending across the full book. Phase 3: Phase 3 (Months 8 to 12): Extend the validated model across the remaining book based on pilot performance. Formalise ongoing model governance across the full underwriting function.
OUTCOME
Twelve months after the engagement began, the client successfully deployed the new AI underwriting model across its full motor insurance book, reporting a measurably improved loss ratio relative to its prior legacy pricing engine baseline (client-reported, unverified by MMA). Leadership also reported improved confidence in managing future model updates without extensive external support.

Frequently Asked Questions

Foundational context covering the market sizes, CAGR, scope, country, region and competition that inform every finding below. This section is provided to cover basics and most often pre-purchase conversations, answered from the MMA Primary Research Dataset.

What is the current size of the Demand for Insurtech in UK?

Demand for insurtech in the United Kingdom reached an estimated USD 1.35 billion in 2025, according to MMA Analysis based on primary research and company disclosures. This base year figure anchors the forecast period beginning in 2026.

How large will the Demand for Insurtech in UK be by 2036?

MMA projects the market will reach approximately USD 6.6 billion by 2036 under the base case scenario. That represents roughly a 4.23 times expansion from the 2026 starting value of USD 1.6 billion.

What is the CAGR for the Demand for Insurtech in UK 2026 to 2036?

The base case compound annual growth rate is 15.5% across the 2026 to 2036 forecast window. Bull and bear scenarios range from 14.2% to 16.8% depending on AI underwriting accuracy and regulatory guidance timing.

Which segment is growing fastest?

AI-Driven Underwriting and Risk Assessment Platforms lead all segments at a 22.0% CAGR, roughly 1.42 times the overall market rate. This segment benefits from rapid carrier budget reallocation as loss ratio evidence accumulates.

Who are the major companies in the Demand for Insurtech in UK?

Leading vendors include Zego, Marshmallow Financial Services, Tractable, Cytora, and ManyPets. Together these five hold an estimated 38% combined share on a disclosed segment revenue basis.

Which country is growing fastest?

This report's scope is the United Kingdom specifically, which grows at the overall market rate of 15.5% annually. London's concentrated fintech and insurance talent base drives the majority of national platform development.

Report Segmentation Architecture

The full report scope spans multiple orthogonal segmentation dimensions, with cross-tabulated demand data provided for each dimension pair. Coverage extends further to regional breakdowns, trend trajectories, and the competitive detail needed to support segment-level decision-making.

By Primary Market Dimension

  • AI-Driven Underwriting and Risk Assessment Platforms
  • Digital Claims Automation and Processing Software
  • Embedded Insurance Distribution Platforms
  • Usage-Based and Telematics Insurance Platforms
  • Insurance Comparison and Aggregation Platforms
  • Policy Administration and Core Insurance Software

By End-Use Industry

  • Motor Insurance
  • Home and Property Insurance
  • Pet and Specialty Insurance
  • Commercial and Small Business Insurance
  • Life and Health Insurance

By Commercial Dimension

  • Direct Carrier Software Licensing
  • Managing General Agent Technology Partnerships
  • Embedded Distribution Partner Channels
  • Broker and Aggregator Platform Channels

By Region

  • North America
  • Western Europe
  • East Asia
  • South Asia and Pacific
  • Latin America
  • Middle East and Africa
  • Eastern Europe

Scope, Methodology, and Coverage

Every figure in this report is reproducible from documented input assumptions. The scope below maps the historical period, the forecast horizon, the segmentation dimensions, and the countries covered, alongside the underlying primary and qualitative methodology.
Historical Period
2020 to 2025
Forecast Period
2026 to 2036
Base Year
2025 (USD billions; MMA Primary Research Dataset, September 2026)
Market Definition
This report covers software platforms, artificial intelligence underwriting tools, and digital distribution technology used by insurance carriers, managing general agents, and brokers operating in the United Kingdom, spanning underwriting, claims, distribution, and policy administration functions. It excludes traditional insurance underwriting capacity and balance sheet risk-bearing activity itself, and general financial services technology that does not include dedicated insurance-specific functionality.
Quantitative Units
USD billions (current prices); carrier and MGA customer counts; average annual contract value
Segmentation Dimensions
By Primary Market Dimension; By End-Use Industry; By Commercial Dimension; By Region
Regions Covered
North America, Western Europe, East Asia, South Asia and Pacific, Latin America, Middle East and Africa, Eastern Europe
Countries Covered
United Kingdom (England, Scotland, Wales, Northern Ireland), with incidental cross-border vendor activity referenced across other regions
Key Companies Profiled
Zego Ltd; Marshmallow Financial Services Ltd; Tractable Ltd; Cytora Ltd; ManyPets Ltd; Cuvva Ltd; By Miles Ltd; Wrisk Ltd; Urban Jungle Ltd; Laka Ltd; Concirrus Ltd; Hometree Ltd; Trov UK Ltd; Zelros SAS; Shift Technology SAS; Cover Genius Pty Ltd; Qover SA; Bdeo Technologies SL; DirectID Ltd; Envelop Risk Analytics Ltd
Quantitative Methodology
Primary survey, n=3,800 respondents, Q4 2025, six countries; demand-side model with trade association cross-validation
Qualitative Methodology
47 expert interviews, Q4 2025; applied to validate demand model assumptions, identify emerging dynamics, and assess competitive positioning
Report Format
PDF and XLSX data workbook (Word format preview document)
Publisher
Market Minds Advisory
Report Code
MMA-2026-TEC-462
Published
September 2026
Contact
sales@marketmindsadvisory.com | www.marketmindsadvisory.com

Purchase the full Demand for Insurtech in UK Report (2026 to 2036).

The full report delivers complete segmentation data across all six product and technology segments, detailed United Kingdom regional and devolved nation breakdowns, and competitive profiles for all twenty companies named in this summary. It includes the underlying primary survey dataset of three thousand eight hundred respondents and forty seven expert interviews conducted during the fourth quarter of 2025. Buyers also receive downloadable data tables covering historical 2020 to 2025 figures alongside the full 2026 to 2036 annual forecast. A dedicated appendix addresses AI underwriting validation benchmarks across three carrier scenarios.
Full UK Regional and Devolved Nation Data Tables
All Twenty Company Competitive Profiles and Rankings
Ten-Year Annual Forecast Model With Scenarios
Primary Survey Raw Data Access and Tables
AI Underwriting Validation Benchmark Appendix and Guide
Quarterly Update Subscription Option for Buyers

Built For The People Who Decide

From boardroom strategy to bench-side execution, this report is read cover-to-cover by leaders shaping the next decade of their industry, turning demand scenarios, market dynamics and valuation benchmarks into decisions.
CXOs/ Presidents/ VPs/ Managers
M&A and Corporate Development
Strategy Teams and R&D Heads
Procurement and Product Directors
Regulatory and Compliance Leaders
Investor Relations and Equity Analysts