Market Minds Advisory
Demand for Digital Power Conversion in the UK

Demand for Digital Power Conversion in the UK: Demand for Digital Power Conversion in the UK: Grid Scarcity, Partial Load Efficiency and the Value of Seeing Every Rail

British industrial buyers pay among the highest electricity prices anywhere and wait about seven years for new grid capacity, which makes every efficiency point worth more here than almost anywhere else.

Lead Analyst

Published

September 2026

Make Smarter Decisions with Customized Research Insights

Request a free sample report and evaluate market opportunities, growth trends, and competitive dynamics relevant to your business needs.

2025 MARKET VALUE$14.6BMarket Size 2025
2036 FORECAST VALUE$39.2BBase Case , 2026 to 2036
CAGR 2026 TO 20369.4 %Bull 10.6% / Bear 8.2%
INCREMENTAL OPPORTUNITY$23.2BNet 10- year value creation
EXPANSION MULTIPLE2.46x2036 value over 2026 base
Strategic Levers
M&A Pipeline
Regional Outlook
Country Rankings
Competitive Intelligence
Segmental Deep-dive
Call-Us : 91 93563 13602

Executive Snapshot and Market Trajectory.

Digital control of power conversion is usually sold on efficiency and mostly bought for visibility. Being able to read current and temperature on every rail is what lets a British operator right-size the next installation, which matters when grid capacity takes about seven years to arrive.
Data centre and computing conversion grows at 14.1%, half again the market rate of 9.4%, because accelerated computing loads are where partial load efficiency and telemetry both pay hardest. Grid-interactive and renewable conversion follows at 12.4%. Western Europe takes 30% of value, with the United Kingdom the analytical centre of this report and one of the highest industrial electricity price environments anywhere in the developed world. Cheap Nordic power weakens the same argument entirely.
Concentration sits near 39% across the top five on measured conversion product and module revenue, split between semiconductor suppliers and power supply manufacturers who increasingly compete for the same designs. Digital control adds around 15% component cost, which is why it wins in infrastructure and loses in consumer volume. Telemetry now attaches to roughly 62% of installed units. That gap is architectural and will not close with volume.
Market Definition
This market covers power conversion products and modules employing digital control and telemetry, spanning data centre and computing power conversion, grid-interactive and renewable conversion, telecommunications and network power, industrial automation and motor drives, electric vehicle charging conversion, and medical and instrumentation power. Value is measured as conversion product, module and controller revenue at supplier level, with the United Kingdom treated as the analytical centre within a global sizing frame. Purely analogue-controlled conversion, batteries and energy storage cells, transmission and distribution equipment, and general power management software are excluded.
Base Year Value
$14.6B in 2025 (MMA Primary Research Dataset, September 2026)
Forecast Period
2026 to 2036, eleven discrete annual values
CAGR
9.4% base case. Bull 10.6%. Bear 8.2%.
Fastest Growth Segment
Data Centre and Computing Power Conversion: 14.1% CAGR
Fastest Growth Country
India: 12.6% CAGR
Fastest Growth Region
South Asia and Pacific: 11.6% CAGR
Largest Region
Western Europe: 30% of 2025 global value
Market Leaders
Infineon Technologies, Texas Instruments, Vicor, Delta Electronics and Analog Devices lead on measured conversion product and module revenue. Source: MMA Primary Research Dataset, July 2026.
Primary Survey
n=3,800 procurement and R&D decision-makers, Q4 2025, six countries
Methodology
Demand-side build-up, cross-validated against public data, 47 expert interviews

Demand for Digital Power Conversion in the UK Market Forecast Scenarios

united-kingdom-digital-power-conversion-market-size-forecast-scenario-1788425168247
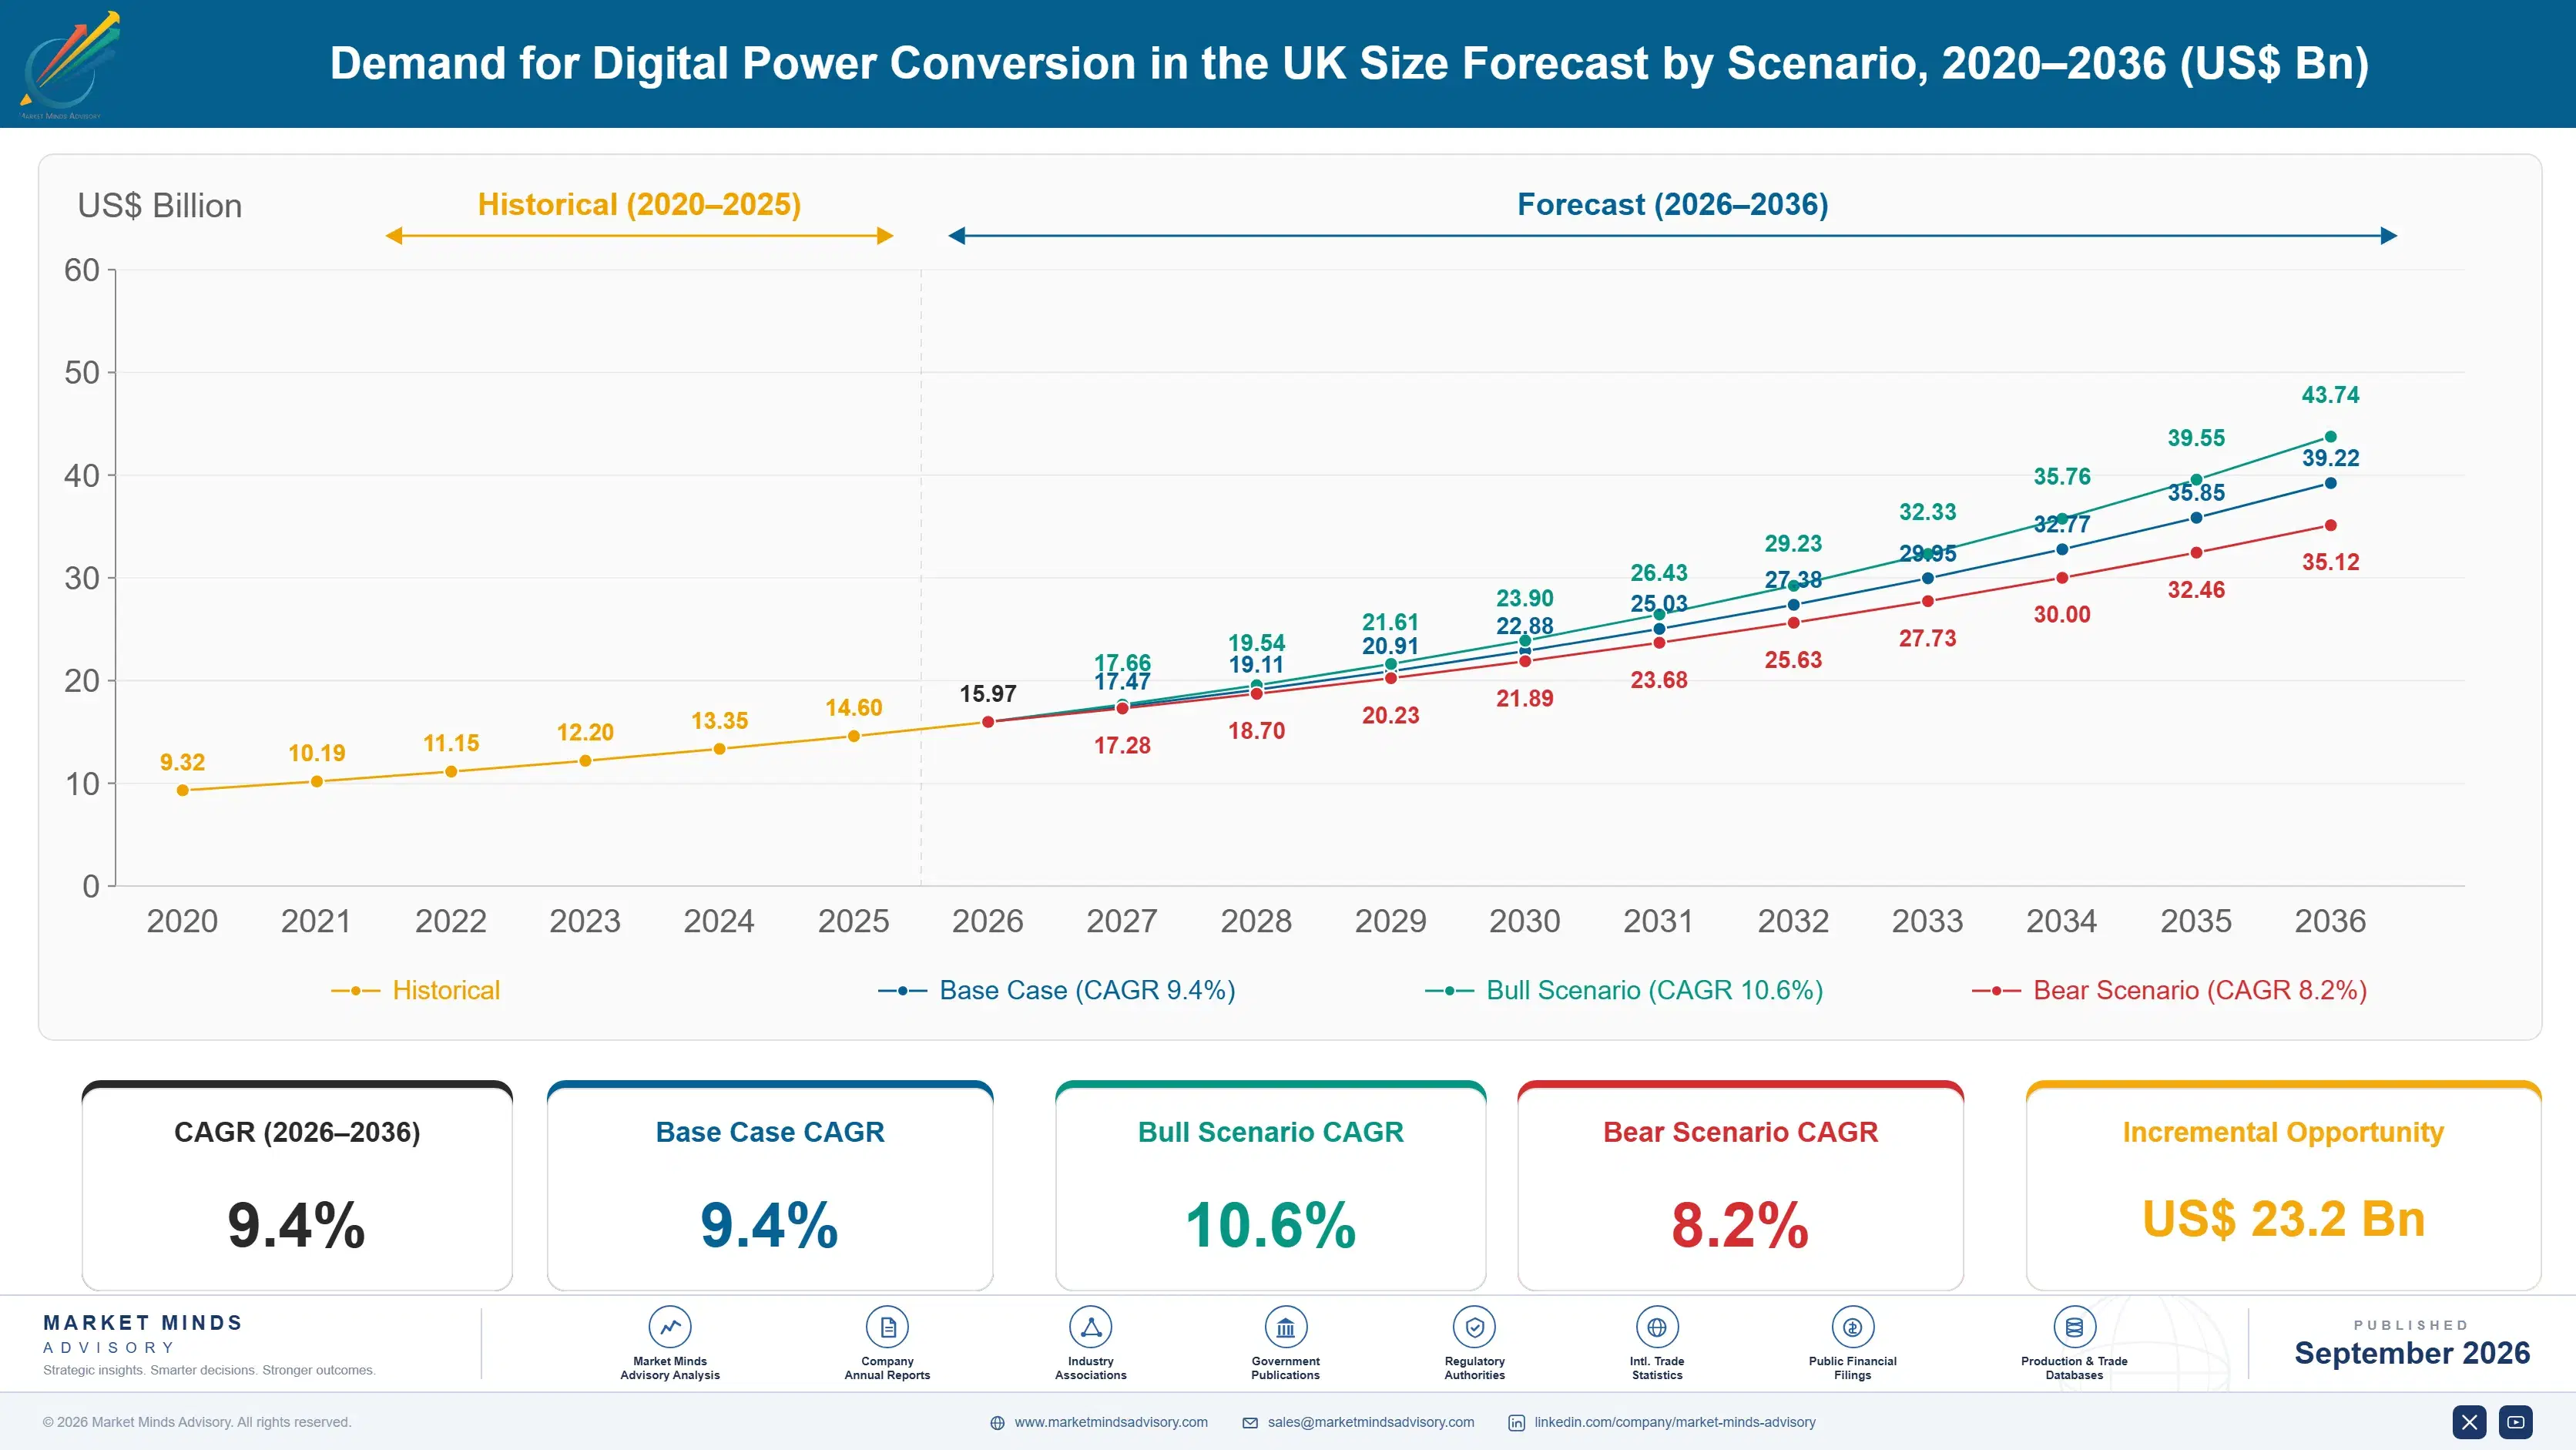
Growth ran at 8.2% from 2020 to 2025, driven at first by telecommunications and industrial adoption where digital control replaced analogue designs on reliability and configurability rather than efficiency. British industrial buyers moved earlier than most European peers, since electricity prices here have been uncomfortable for considerably longer. Accelerated computing then arrived and changed both the volume and specification of what buyers wanted.
The base case at 9.4% rests on three mechanisms. Partial load efficiency, where digital control delivers around 4.1 points of improvement, matters because equipment spends its life well below rated load rather than at data sheet peaks. Grid connection waits near seven years in constrained British locations make every efficiency point equivalent to capacity nobody can otherwise obtain. Third, telemetry now attaching to roughly 62% of units lets operators size installations against measured draw instead of nameplate ratings.
The bull case at 10.6% assumes computing construction proceeds at announced rates and that grid constraint pushes operators further toward efficiency as a capacity substitute. The bear case at 8.2% is that the 15% cost premium on digital control keeps adoption confined to infrastructure applications, leaving industrial and consumer volume with analogue designs that remain cheaper to build.

When Efficiency Becomes Capacity

The efficiency argument for digital conversion is real and routinely made in the wrong units. Peak efficiency figures on a data sheet describe a condition equipment rarely occupies. What matters is behaviour at 20% to 40% of rated load, where most installations run, and digital control delivers roughly 4.1 points there by adapting switching behaviour to the load rather than to a single design point.
TOP FIVE CONCENTRATION39%Moderately concentrated among semiconductor and power supply manufacturers
UK INDUSTRIAL ELECTRICITY PRICEUSD 0.28 per kWhAmong the highest paid by industrial users anywhere
PARTIAL LOAD EFFICIENCY GAIN4.1 pointsImprovement at typical operating load rather than peak
DIGITAL CONTROL COST PREMIUM15%Additional component expense against equivalent analogue control designs
GRID CONNECTION WAIT7 yearsDelay before new industrial grid capacity becomes available
TELEMETRY ATTACH RATE62%Installed units reporting per-rail current and temperature data
In the United Kingdom that arithmetic carries unusual weight. Industrial electricity runs near USD 0.28 per kilowatt hour, among the highest anywhere, so an efficiency point converts into money faster here than where power is cheap. The grid position sharpens it further. Connection waits reaching seven years mean an operator who cannot buy capacity can only find it inside what they hold, and conversion losses are the obvious place to look.
Telemetry is the quieter reason these products win. Reading current and temperature per rail, now attaching to about 62% of installed units, lets an operator size the next installation against measured draw instead of conservative nameplate ratings. That routinely releases capacity nobody knew they had. It is the least discussed benefit and, among British operators facing connection queues, frequently the real justification.
"Suppliers keep selling peak efficiency because it is the number on the data sheet. Buyers who have measured their own installations know the equipment lives at a third of rated load and has done for years. The interesting products are the ones honest enough to publish the curve rather than the point."
Director, Power Electronics and Industrial Energy Practice · MMA Energy Practice · September 2026

Market Trends

Grid Scarcity Turns Efficiency Into Available Capacity

Connection waits reaching about seven years in constrained British locations mean an operator wanting more power frequently cannot buy it at any price, which changes efficiency from a cost question into a capacity one. Recovering 4.1 points at typical operating load releases headroom inside an existing connection, and that headroom has a value set by what the operator would otherwise pay to wait. Data centre operators in the South East have made exactly this calculation. It reframes a component decision as an infrastructure one entirely. The component budget stopped being where the decision sits.
Market Impact: Costs USD 0.28 per kilowatt hour
Telemetry Replaces Nameplate Ratings in Sizing Decisions

Per-rail current and temperature reporting now attaches to roughly 62% of installed units, which lets operators design the next installation against what equipment actually draws rather than against nameplate figures carrying substantial and undocumented margin. Measured sizing typically releases capacity that was never used, and in grid-constrained locations that released headroom is worth considerably more than the equipment cost. The benefit is invisible on any specification comparison. It shows up when somebody finally builds an installation against real numbers rather than assumptions. Nobody sells this properly because it sounds like a software feature.
Market Impact: Grows at 14.1% annually

Market Opportunities and Growth Drivers

British Industrial Electricity Prices Sharpen Every Calculation

Industrial electricity in the United Kingdom runs near USD 0.28 per kilowatt hour, among the highest levels paid by industrial users anywhere in the developed world, which shortens payback on efficiency improvement well below what the same investment achieves in France or the United States. British manufacturers and data centre operators consequently adopted digital conversion earlier than most European peers and specify it more consistently. The price gap is a policy and market outcome rather than a temporary condition. It has been widening rather than closing for several years. British buyers ask different questions as a result.
Market Impact: Adds 15% to component cost

Accelerated Computing Loads Punish Conversion Inefficiency Hardest

High-density computing racks concentrate power draw at levels where every conversion stage loss becomes heat that must then be removed at further cost, so efficiency improvements pay twice inside the same facility. Digital control delivers roughly 4.1 points at typical operating load, and it manages the rapid load transients that accelerated computing produces far better than fixed analogue compensation does. Data centre conversion grows at 14.1%, faster than anything else here. Specification decisions are being made by facility engineers rather than by component buyers. Thermal removal cost is the second half of the argument.
Market Impact: Adds support across 15 year lifetimes

Market Restraints and Challenges

Digital Control Costs More Than Analogue Always Will

Digital control adds around 15% to component cost against an equivalent analogue design, and that gap is architectural rather than a matter of manufacturing volume, since the controller, memory and interface simply are not present in the analogue alternative. Commercially this confines adoption to applications where efficiency, telemetry or configurability carry enough value to absorb the premium. Consumer and high-volume industrial designs continue choosing analogue for sound reasons. Suppliers mitigate through integration that folds control into existing silicon, narrowing but never closing the gap. That is a sound engineering answer rather than a laggard one.
Market Impact: Bypasses a 7 year connection wait

Firmware in Power Equipment Creates Liability Nobody Wanted

A digitally controlled converter contains software, which means version management, security patching and support obligations across an installed base that previously needed none of these things. The root cause is that adding programmability adds everything that comes with programmability. Commercially this raises support cost and exposes suppliers to security requirements written for computing equipment rather than for power hardware. Mitigation runs through signed firmware, defined update paths and long-term support commitments, which several suppliers now price separately rather than absorbing. Organisations built entirely on analogue economics have found this genuinely uncomfortable to absorb.
Market Impact: Reports on 62% of units
3 additional market trends, 4 additional growth drivers, and 2 additional restraints and challenges are covered in the full report. Contact sales@marketmindsadvisory.com to access the complete intelligence.

Segment CAGR and Growth Architecture

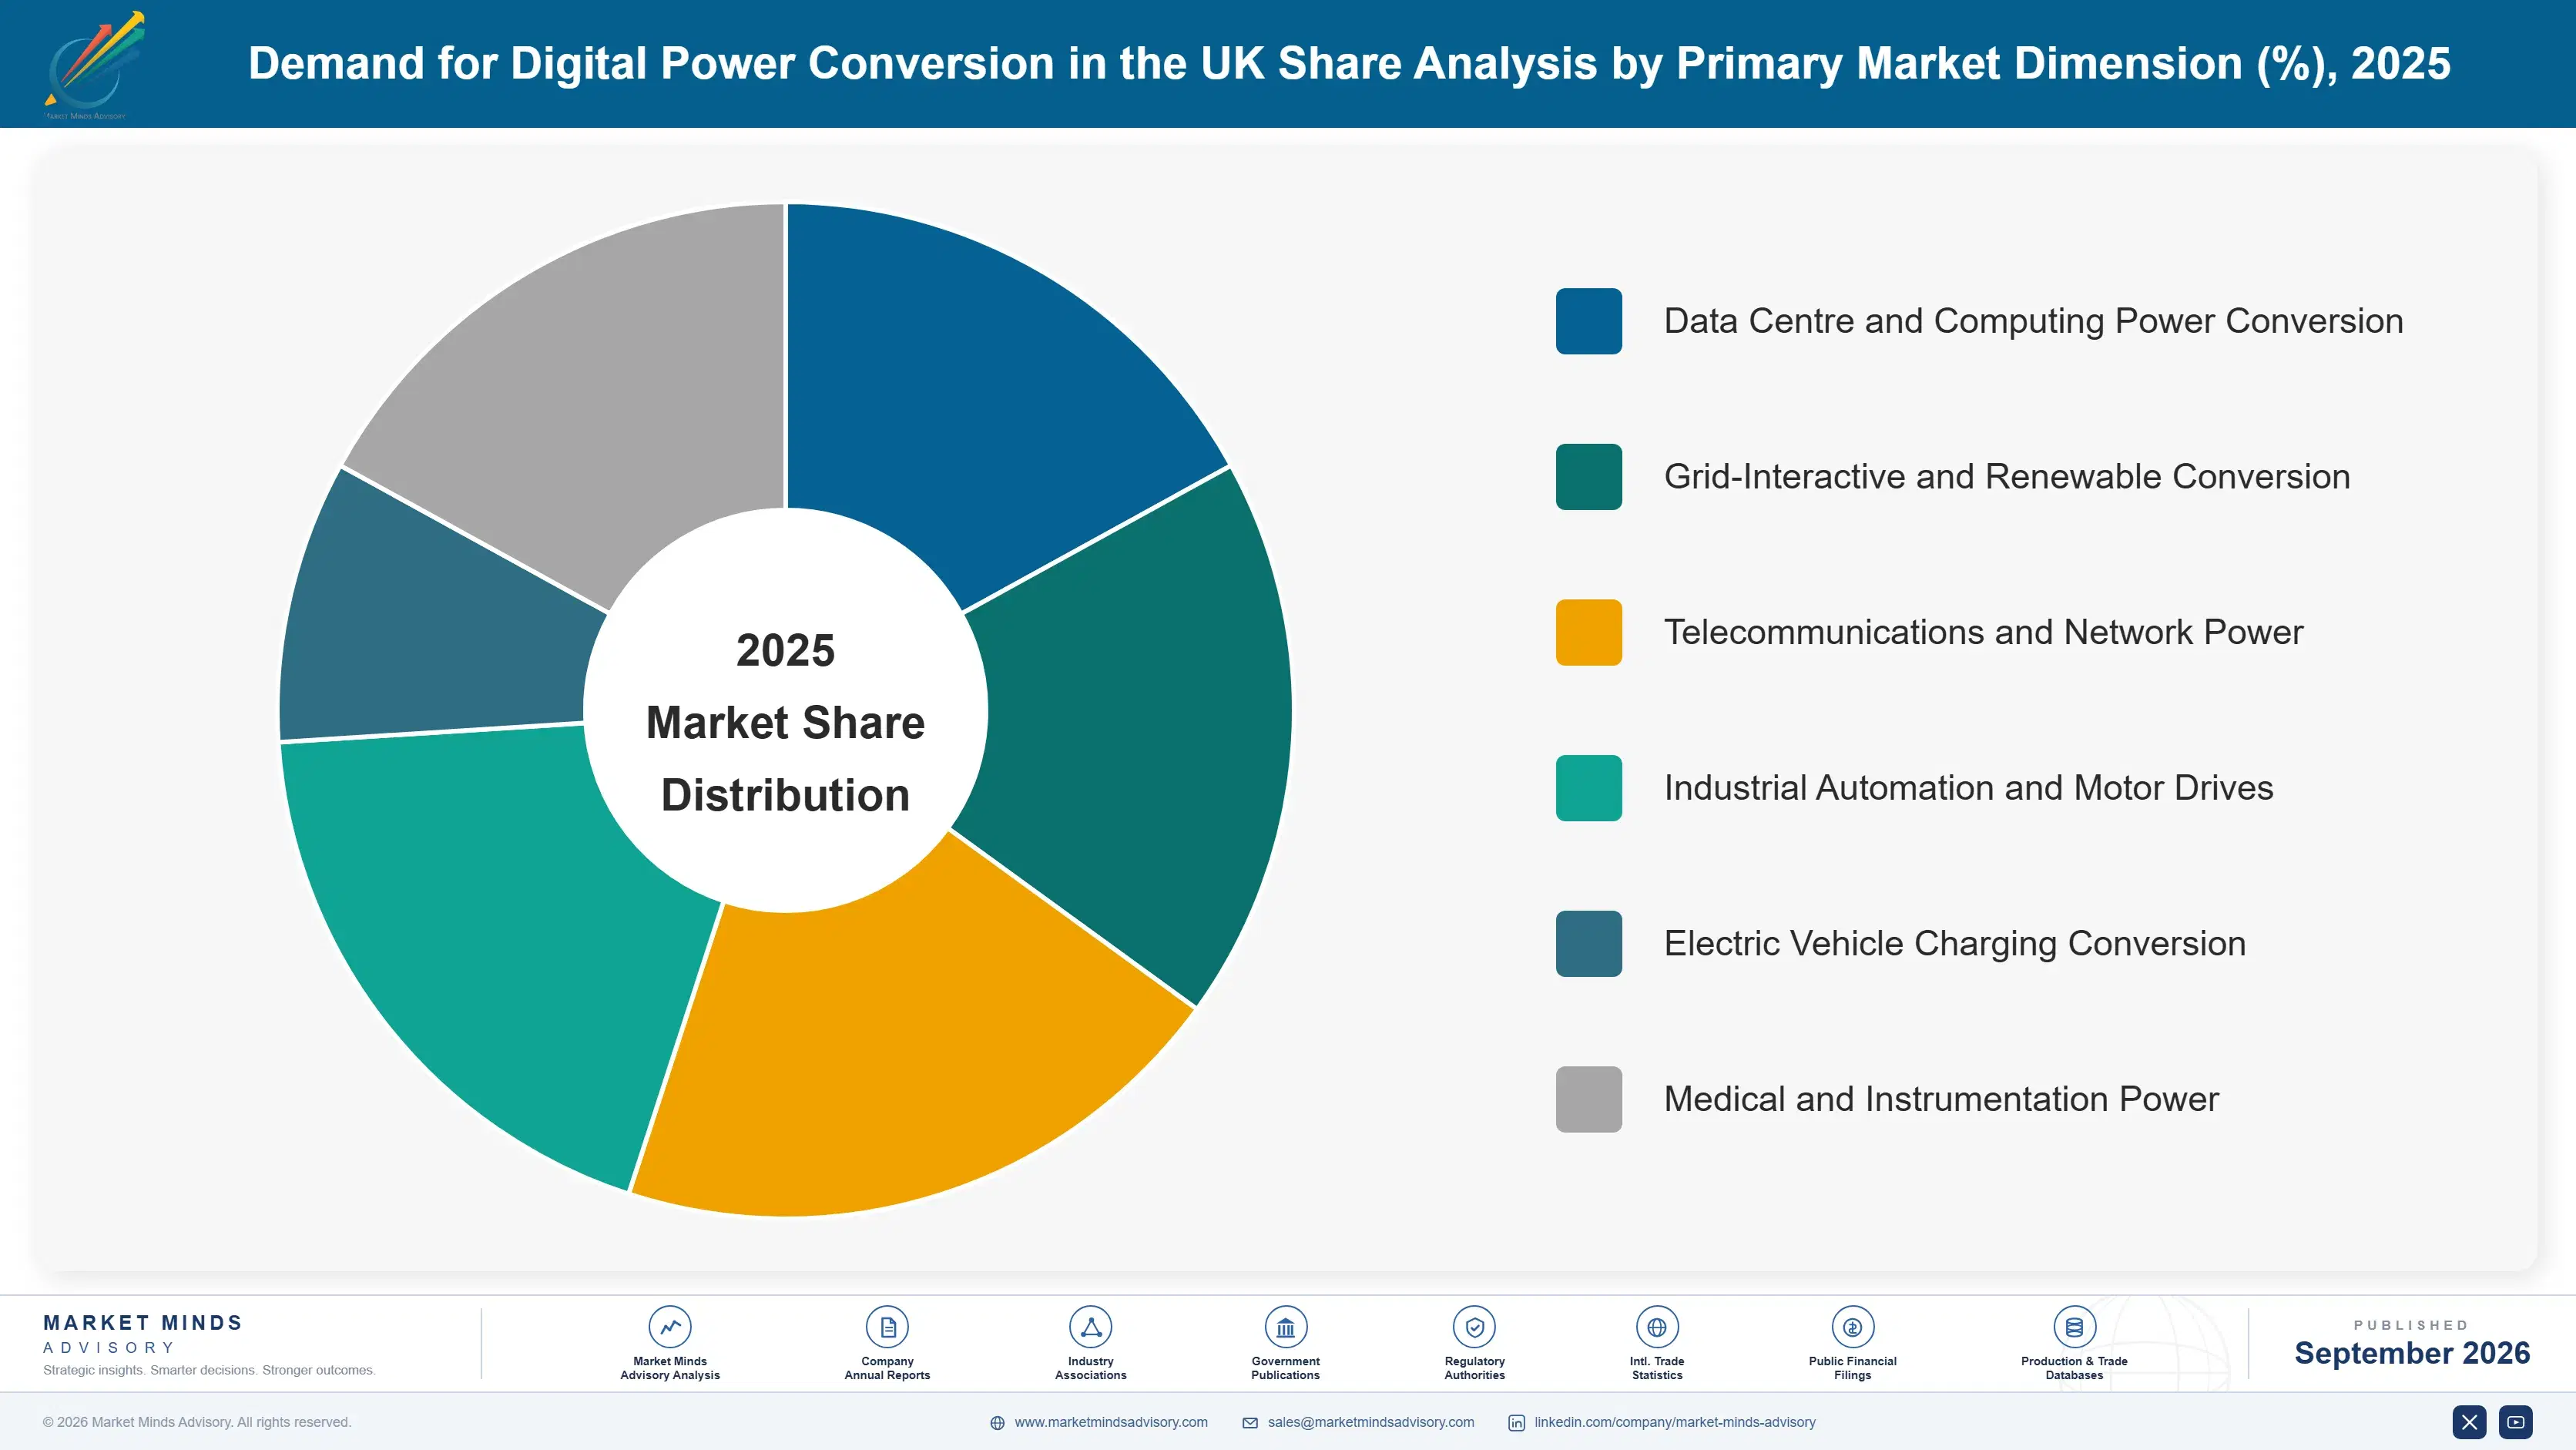
Segmentation follows the application context, because that determines whether the 15% cost premium on digital control is worth paying. Where power is expensive, constrained or difficult to measure, it pays comfortably. Where equipment is built to a price and runs at a predictable load, analogue control remains the sensible engineering answer and probably always will.
united-kingdom-digital-power-conversion-market-market-share-analysis-1788425168795

Data Centre and Computing Power Conversion

Data centre conversion grows at 14.1%, half again the market rate of 9.4%, because high-density computing punishes conversion loss twice: once as wasted energy and again as heat requiring removal. Digital control handles the rapid load transients that accelerated computing produces considerably better than fixed analogue compensation, and it delivers around 4.1 points at the partial loads where equipment actually operates. British demand is sharpened by grid connection waits near seven years, which turn recovered efficiency into capacity that cannot otherwise be obtained. Specification has moved from component buyers to facility engineers, who evaluate against total facility power rather than against unit cost. Rack capability rather than component price is what these buyers are actually solving for.
CAGR 14.1%

Grid-Interactive and Renewable Conversion

Grid-interactive conversion grows at 12.4% because inverters and bidirectional converters connecting to increasingly variable networks require control behaviour that changes with grid conditions, which fixed analogue designs cannot provide. British network operators impose connection requirements around reactive power, fault ride-through and frequency response that effectively require digital control to satisfy. Telemetry serves the compliance evidence those requirements demand. The segment's commercial character differs from the rest of this market, since specifications are set by network codes rather than by buyers, and a code revision can obsolete a product line without any competitor doing anything at all. Compliance evidence rather than performance is what network operators examine, which suits suppliers with telemetry depth and disadvantages those without it.
CAGR 12.4%
Full segment breakdown across 6 segments available in the complete report.

Regional Architecture and Country Demand Map

This report is United Kingdom centred within a global sizing frame, so regional shares describe where comparable digital conversion value is bought worldwide. Electricity price, grid constraint and computing construction explain the pattern better than industrial output does. Cheap electricity weakens the argument wherever it is found.

Western Europe

Western Europe holds 30%, above the regional band, because the United Kingdom is the analytical subject of this report and British demand sits within a regional market where high electricity prices and grid constraint are widely shared. British industrial electricity near USD 0.28 per kilowatt hour and connection waits reaching seven years in the South East make efficiency a capacity question rather than a cost one, and United Kingdom demand grows at 8.6%. German industrial adoption follows motor drive and automation refresh cycles. Nordic data centre construction buys on power availability, where cheap electricity weakens the efficiency argument considerably. Irish data centre construction faces its own grid moratorium constraints, which produce the same substitution logic seen in the South East.
Share: 30% | CAGR: 7.8% (2026 to 2036)

East Asia

East Asia matches Western Europe on share because conversion products are largely manufactured here and much of the world's computing and telecommunications equipment is assembled here as well, so component demand registers regionally regardless of where the finished equipment operates. Chinese suppliers hold strong positions in industrial and telecommunications conversion at prices Western manufacturers do not attempt to match. Japanese and Korean demand follows semiconductor fabrication and automotive electronics. Growth at 10.4% runs ahead of the market, carried by regional computing construction and by continued manufacturing concentration rather than by any efficiency argument. Grid constraint is not the driver here that it is in Britain, so adoption rests on manufacturing cost and on export specification requirements instead.
Share: 30% | CAGR: 10.4% (2026 to 2036)
Regional intelligence for 5 additional markets available in the complete report: North America, South Asia and Pacific, Latin America, Middle East and Africa, Eastern Europe. Contact sales@marketmindsadvisory.com.
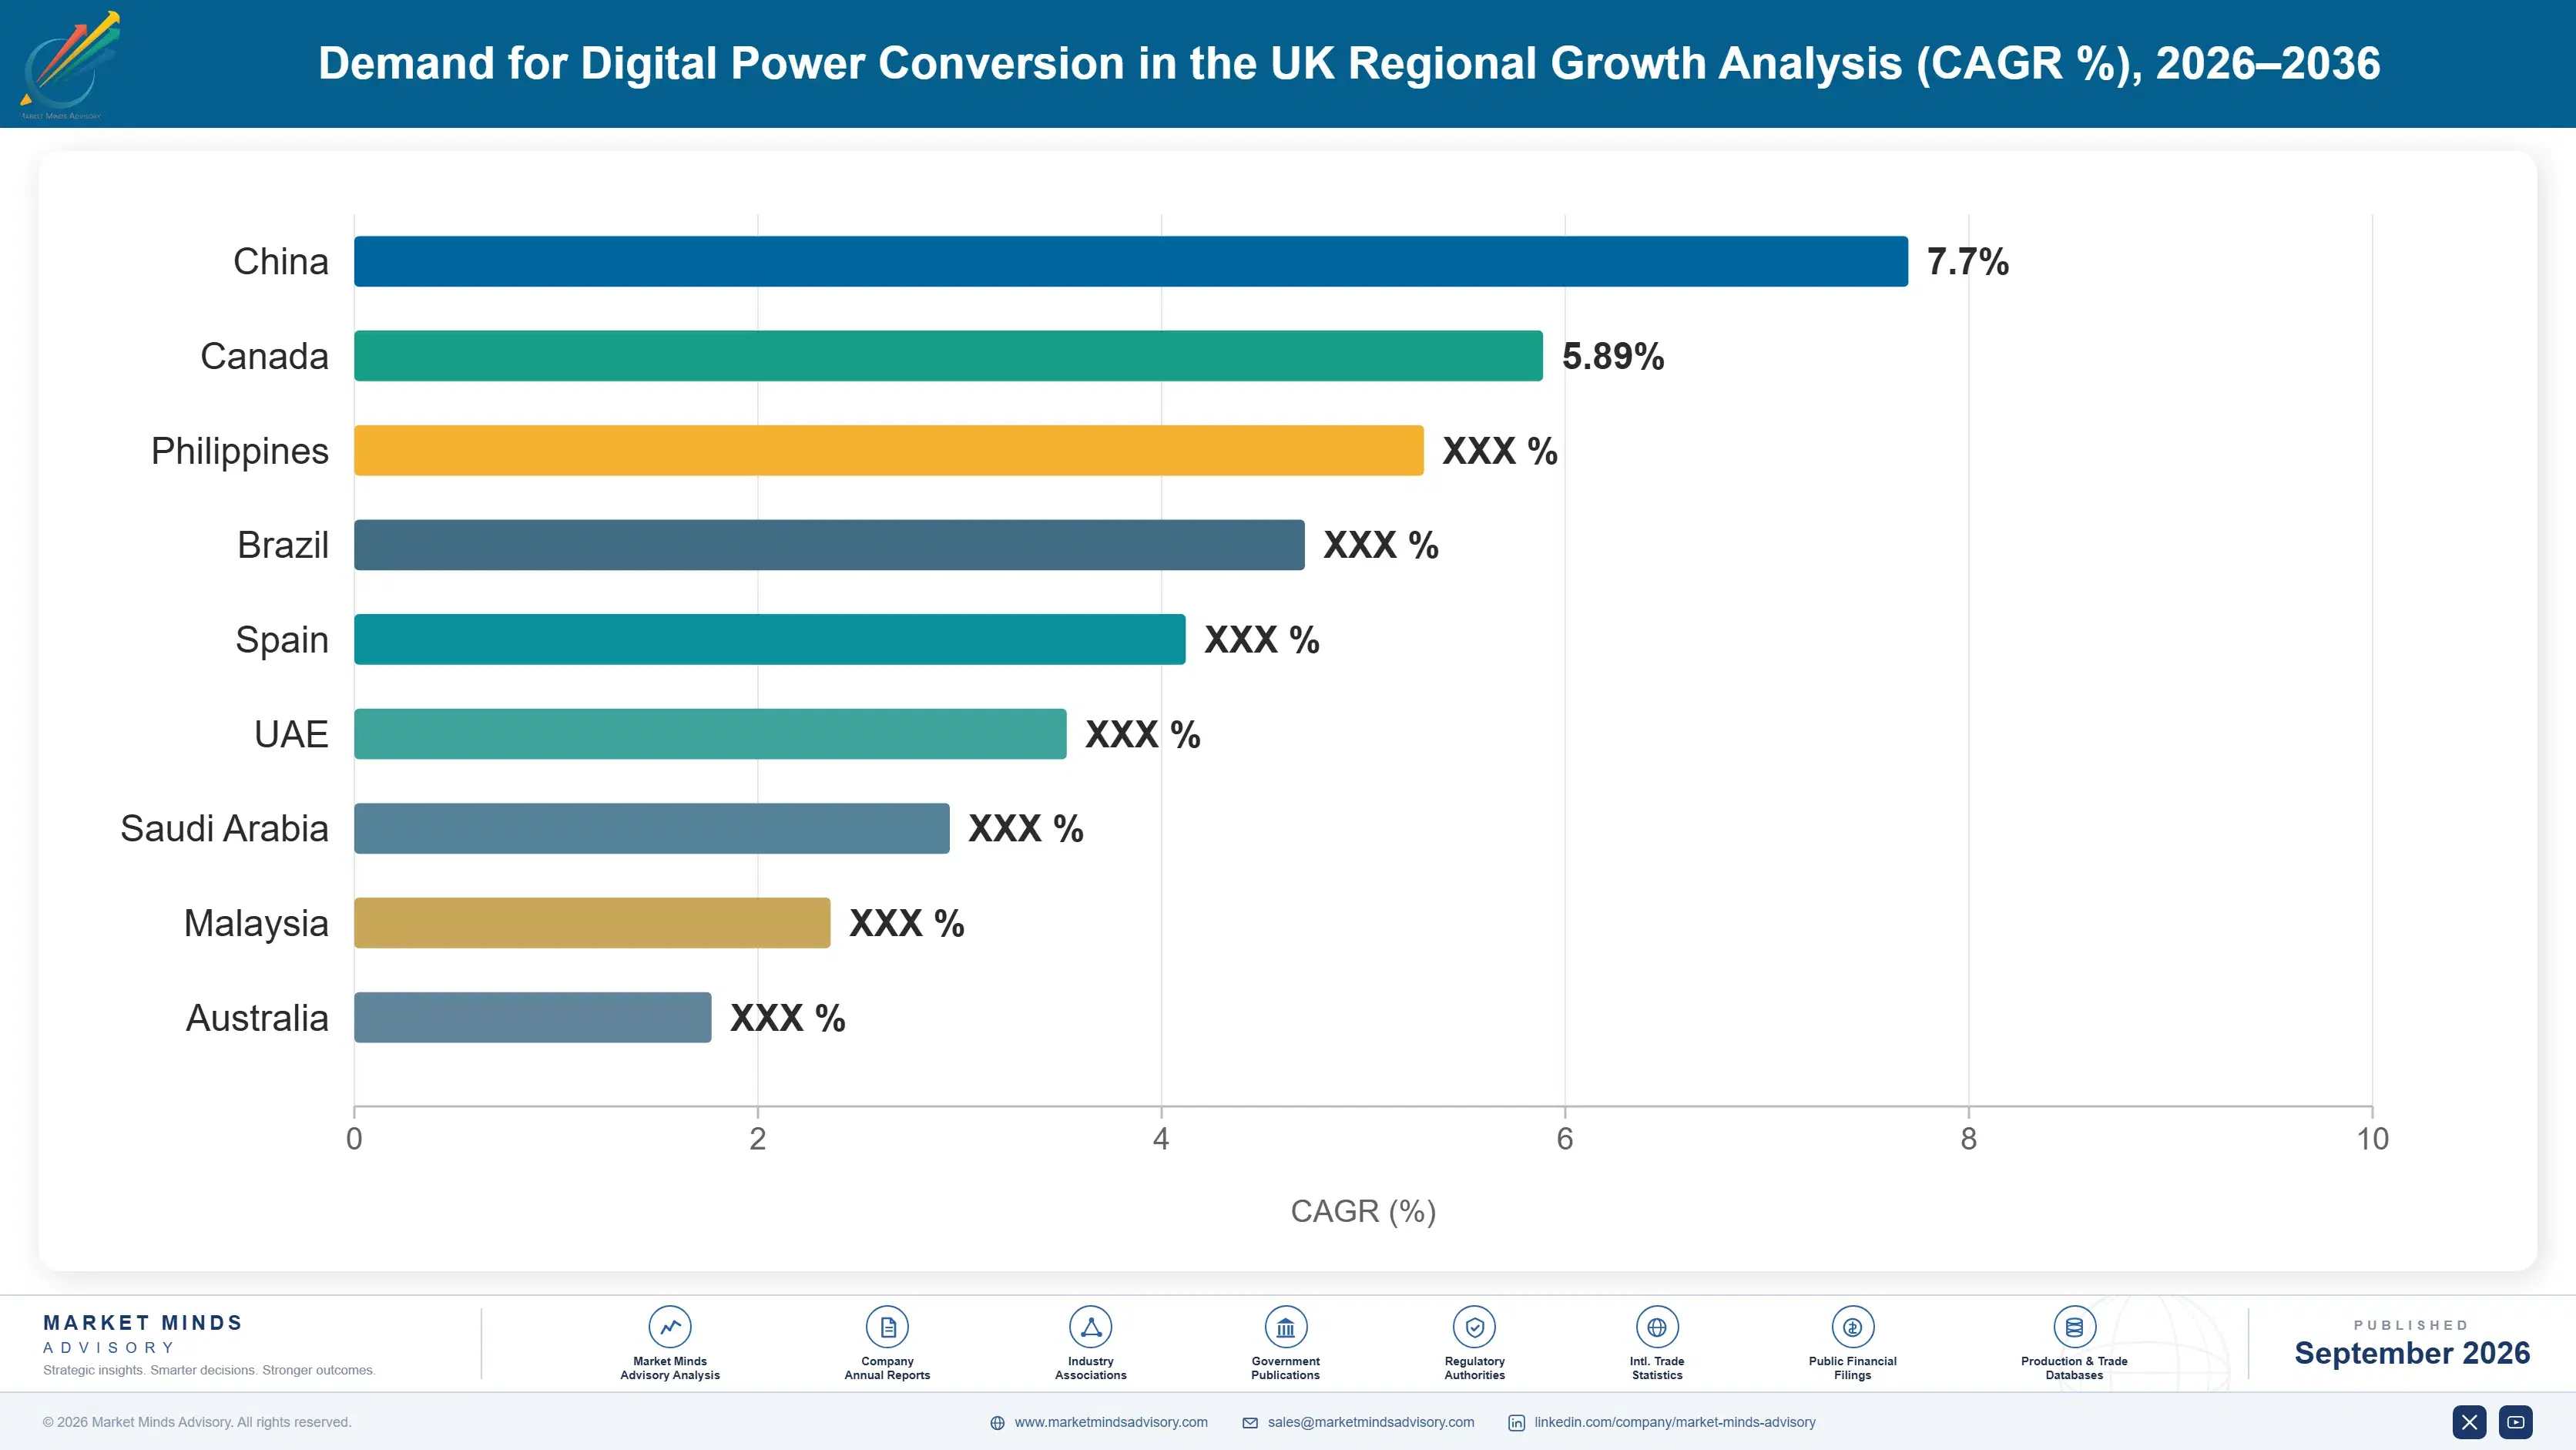
united-kingdom-digital-power-conversion-market-country-cagr-analysis-1788425169336

Selling Capacity Rather Than Efficiency

Peak efficiency is the number on the data sheet and the number that loses arguments, because buyers who have measured their own installations know the equipment runs at a third of rated load. The levers worth pulling all move the conversation toward partial load behaviour, released capacity and what the telemetry actually shows about it.

Publish the Partial Load Curve, Not the Peak

Equipment spends its life between 20% and 40% of rated load and almost never at the point where peak efficiency is quoted, which every experienced facilities engineer knows and most data sheets ignore. Suppliers publishing full efficiency curves win specifications against competitors quoting a single number, because the curve is where the 4.1 point advantage becomes visible. Buyers evaluating on published curves select digital control at roughly twice the rate. It requires admitting that peak efficiency was always the least useful figure available. The curve is the honest document and most suppliers still do not publish one.
Market Impact: Selects digital control at 2 times the rate

Price Released Capacity Where Grid Waits Are Long

In British locations where connection waits reach seven years, an operator cannot buy more power at any price, so efficiency recovered inside an existing connection is capacity rather than saving. Framing the sale against what waiting costs, rather than against kilowatt hours saved, moves the discussion to infrastructure budgets that dwarf component budgets entirely. Operators making this calculation approve at values around 3 times what an energy saving case supports. The framing only works where grid constraint is genuine, which limits it usefully. Component budgets and infrastructure budgets are not the same conversation at all.
Market Impact: Approves at around 3 times the usual value

Make Telemetry the Sizing Tool, Not a Feature

Per-rail measurement attaches to roughly 62% of installed units and is generally listed as a specification bullet rather than sold as what it is, which is the instrument that lets an operator size the next installation against measured draw. Nameplate-based sizing carries margin that measurement routinely recovers, releasing capacity nobody had accounted for. Suppliers providing sizing analysis alongside the hardware attach to roughly 40% more of the customer's subsequent projects. The analysis costs little and creates the position that the hardware alone does not. Nobody buys a sizing service and everybody accepts one offered alongside hardware.
Market Impact: Attaches to roughly 40% more customer projects overall

Price Firmware Support Rather Than Absorbing It

Digital conversion contains software, which brings version management, security patching and support obligations across installed bases running 15 years or more, none of which existed in the analogue business these organisations grew up in. Suppliers absorbing that cost silently are funding it from hardware margin that was never priced for it. Separately priced long-term support recovers around 6% of installed base value annually and customers accept it once the obligation is explained. Most suppliers have not had the conversation yet. The obligation exists whether or not anybody prices it, and it compounds with every unit shipped.
Market Impact: Recovers around 6% of installed base value annually

Who Controls the Margin Pool

Concentration sits near 39% across the top five on measured conversion product and module revenue, and the competitive picture is unusual because two different kinds of company are converging on the same designs. Semiconductor suppliers sell controllers and integrated stages to equipment makers building their own conversion. Power supply manufacturers sell complete modules. As integration advances, each increasingly finds itself bidding against the other for the same socket in the same design.
Competition runs on three dimensions. Partial load efficiency is first among informed buyers, though peak figures still dominate published comparison. Second is telemetry depth and the software that makes measurement useful rather than merely available. Third is firmware support commitment across installed bases running fifteen years, which buyers now ask about explicitly and several suppliers still answer vaguely.

Two pressures will move positions. Integration of digital control into power silicon narrows the cost premium and shifts advantage toward semiconductor suppliers with process capability. Meanwhile facility engineers rather than component buyers increasingly write the specification in computing and grid applications, which favours suppliers who can discuss total facility power rather than unit performance characteristics on a data sheet.
united-kingdom-digital-power-conversion-market-company-positioning-matrix-1788425169857

Competitive Moat and Risk Dimensions

INFINEON TECHNOLOGIES

Moat: Power silicon process depth

Infineon manufactures the power semiconductors underneath conversion stages as well as the digital controllers that manage them, which lets it integrate control into silicon and narrow the cost premium that limits adoption. Its breadth across automotive, industrial and computing spreads exposure across cycles that do not move together. Long design relationships with equipment manufacturers renew across product generations.
INFINEON TECHNOLOGIES

Risk: Module supplier competition

Equipment makers increasingly buy complete conversion modules rather than building stages from components, which moves the purchasing decision to power supply manufacturers and away from semiconductor suppliers entirely. Competing there means selling a different product to a different buyer. Facility-level specification in computing applications also favours suppliers who can discuss total facility power rather than component performance characteristics.
VICOR

Moat: High density conversion architecture

Vicor holds distinctive positions in high density power conversion suited to accelerated computing, where delivering current close to the load at high density is the constraint that determines rack capability. Its architecture and packaging are difficult to replicate quickly. Relationships with computing platform designers give it early visibility into requirements several product generations ahead of general market awareness.
VICOR

Risk: Computing cycle concentration

Revenue depends heavily on accelerated computing construction, which is currently exceptional and has historically been cyclical. Industrial, telecommunications and grid applications are served less completely, limiting the diversification that would smooth a slowdown. The company also lacks the power semiconductor process depth that lets larger competitors integrate control into silicon and attack the cost premium directly.

Players Tracked

Prominent Players

Infineon Technologies
Texas Instruments
Vicor
Delta Electronics
Analog Devices

Other Key Players

STMicroelectronics
onsemi
Renesas
Monolithic Power Systems
Flex Power Modules
Advanced Energy Industries
Eaton
ABB
Murata Manufacturing
TDK-Lambda
XP Power
Bel Fuse
Artesyn Embedded Power
Navitas Semiconductor
Power Integrations

Recent Developments

MARCH 2025

British data centre operators specify conversion efficiency against connection capacity

Operators in grid-constrained locations across the South East began evaluating conversion equipment against how much additional computing an existing connection could support, rather than against energy cost savings. The change moved specification decisions from procurement into facility planning teams entirely. Energy cost had never justified replacement on its own.
Signal: Where grid capacity cannot be bought, efficiency becomes an infrastructure purchase rather than an operating saving.
JULY 2025

Suppliers begin publishing full efficiency curves rather than peak figures

Several conversion manufacturers replaced single peak efficiency claims with published curves across the load range, responding to buyers who had measured their own installations and knew equipment rarely operates near rated load. Competitors quoting single figures lost specifications on the comparison. The comparison had never been made publicly before.
Signal: Buyers who measure their own installations have made peak efficiency claims a liability rather than an advantage.
NOVEMBER 2025

Long-term firmware support terms become a specification requirement

Industrial and data centre buyers began requiring explicit security patching and firmware support commitments across equipment lifetimes measured in fifteen years, reflecting obligations that analogue conversion never carried. Several suppliers priced support separately rather than absorbing it into hardware margin. Hardware margin had been funding it invisibly.
Signal: Programmability brought support obligations that suppliers built on analogue economics had never needed to price at all.

What Digital Conversion Costs

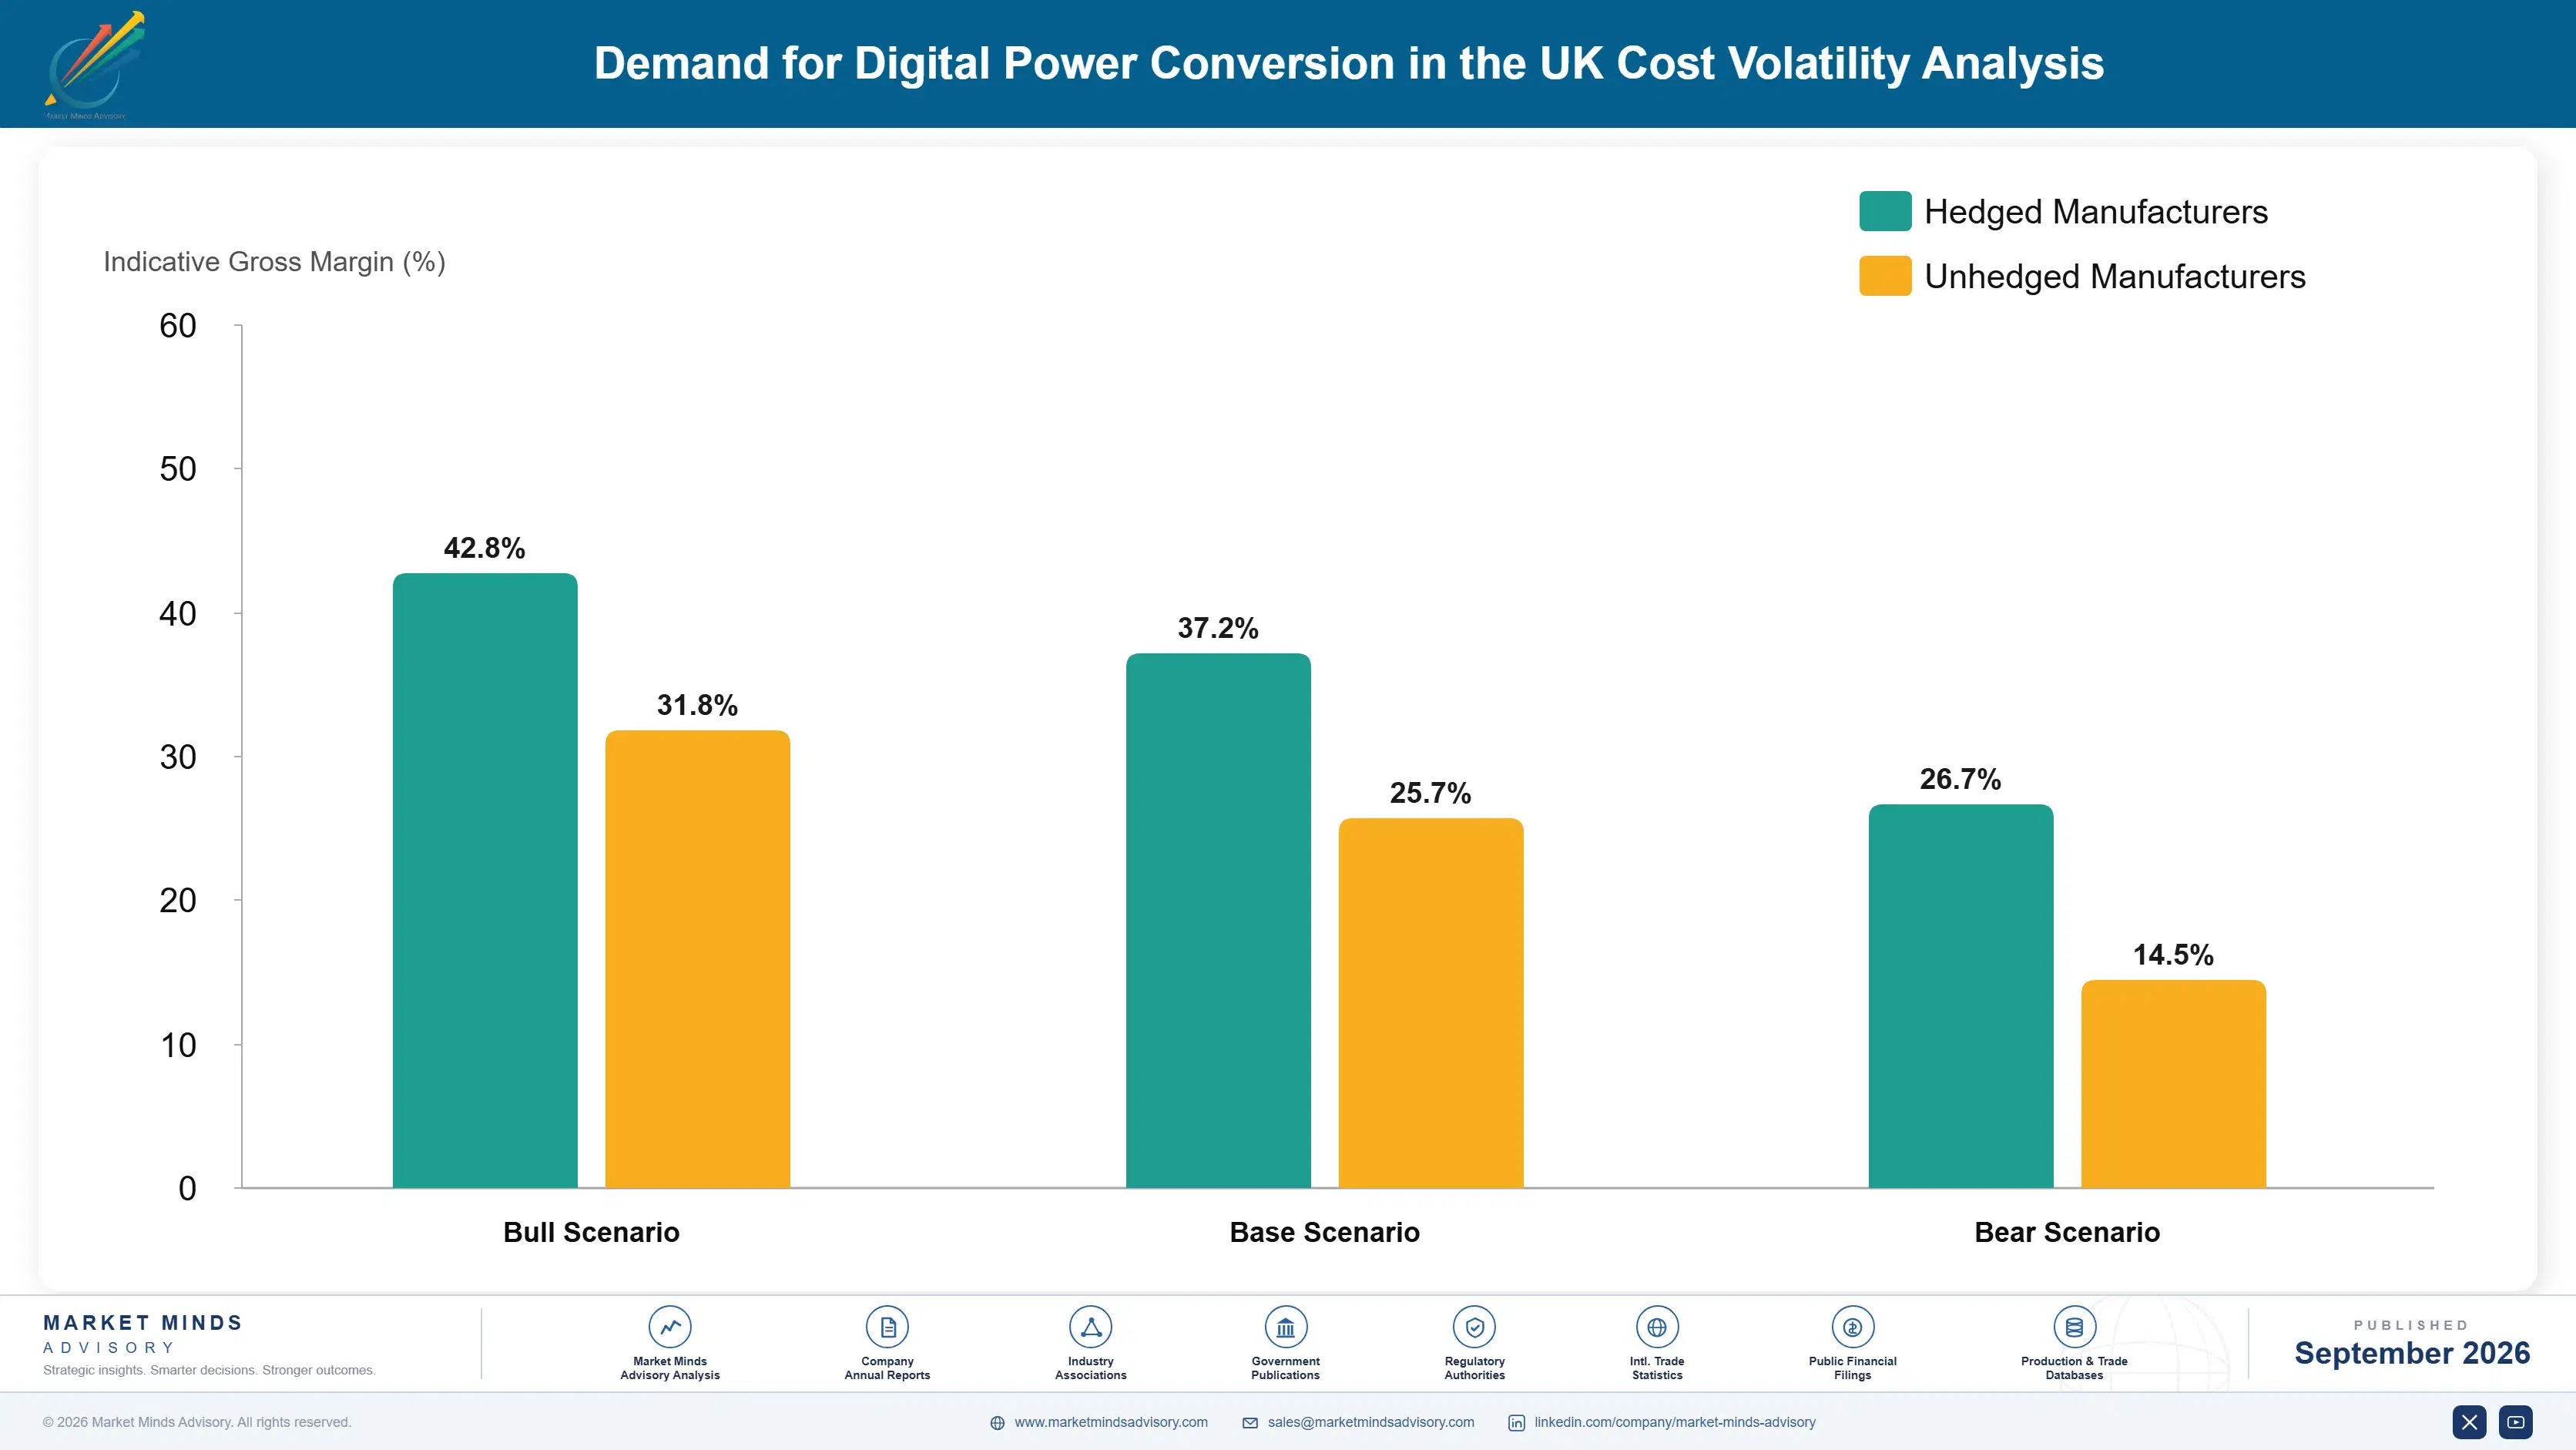
Cost structure is dominated by semiconductor content. Power switching devices, magnetics, controllers and passive components together account for roughly 63% of manufactured cost, with the digital controller, memory and communication interface adding the 15% premium that separates these products from analogue equivalents. Magnetics remain the most awkward item, since transformers and inductors are large, hard to automate and come from a concentrated supplier base.
Wide bandgap semiconductor pricing has been the sharpest recent influence. Silicon carbide and gallium nitride devices enable the switching frequencies that make high density conversion practical, and their pricing fell substantially through 2024 and 2025 as automotive capacity expanded faster than automotive demand absorbed it. Infineon Technologies and Texas Instruments both referenced power semiconductor pricing conditions in recent annual reporting. Conversion manufacturers benefited, which is a rare direction for a component cost story.

Exposure varies by integration depth. Manufacturers producing their own power semiconductors control pricing and availability on the largest cost element and can integrate control into silicon. Module builders purchasing devices on the open market carry full exposure to whatever the market offers. Suppliers concentrated in computing applications carry demand cyclicality alongside component exposure, and those two risks have historically arrived together.
united-kingdom-digital-power-conversion-market-cost-volatility-analysis-1788425170052

Design across silicon carbide and gallium nitride options

The two wide bandgap technologies suit different voltage and frequency ranges, and their pricing has moved independently as automotive and computing demand shifted between them. Designing platforms that accommodate either, where the application permits, preserves the option to follow whichever offers better economics. It costs additional qualification effort and removes an exposure that concentrated single-technology designs cannot avoid at all.

Standardise magnetics across product families deliberately

Transformers and inductors are physically large, awkward to automate and come from a concentrated supplier base, which makes them most likely to constrain delivery when demand rises. Sharing magnetic designs across product families concentrates purchasing volume onto fewer parts and improves both availability and unit cost. It constrains electrical design choices, and the purchasing advantage usually exceeds the engineering compromise.

Recover firmware support cost through separate pricing

Software brings patching, version management and support obligations across installed bases running fifteen years, none of which analogue conversion required or hardware margin was priced to fund. Separately priced support recovers around 6% of installed base value annually. Customers accept it once the obligation is explained honestly, and suppliers absorbing it silently fund somebody else's compliance from their own margin.

Portfolio Architecture for Margin Defence

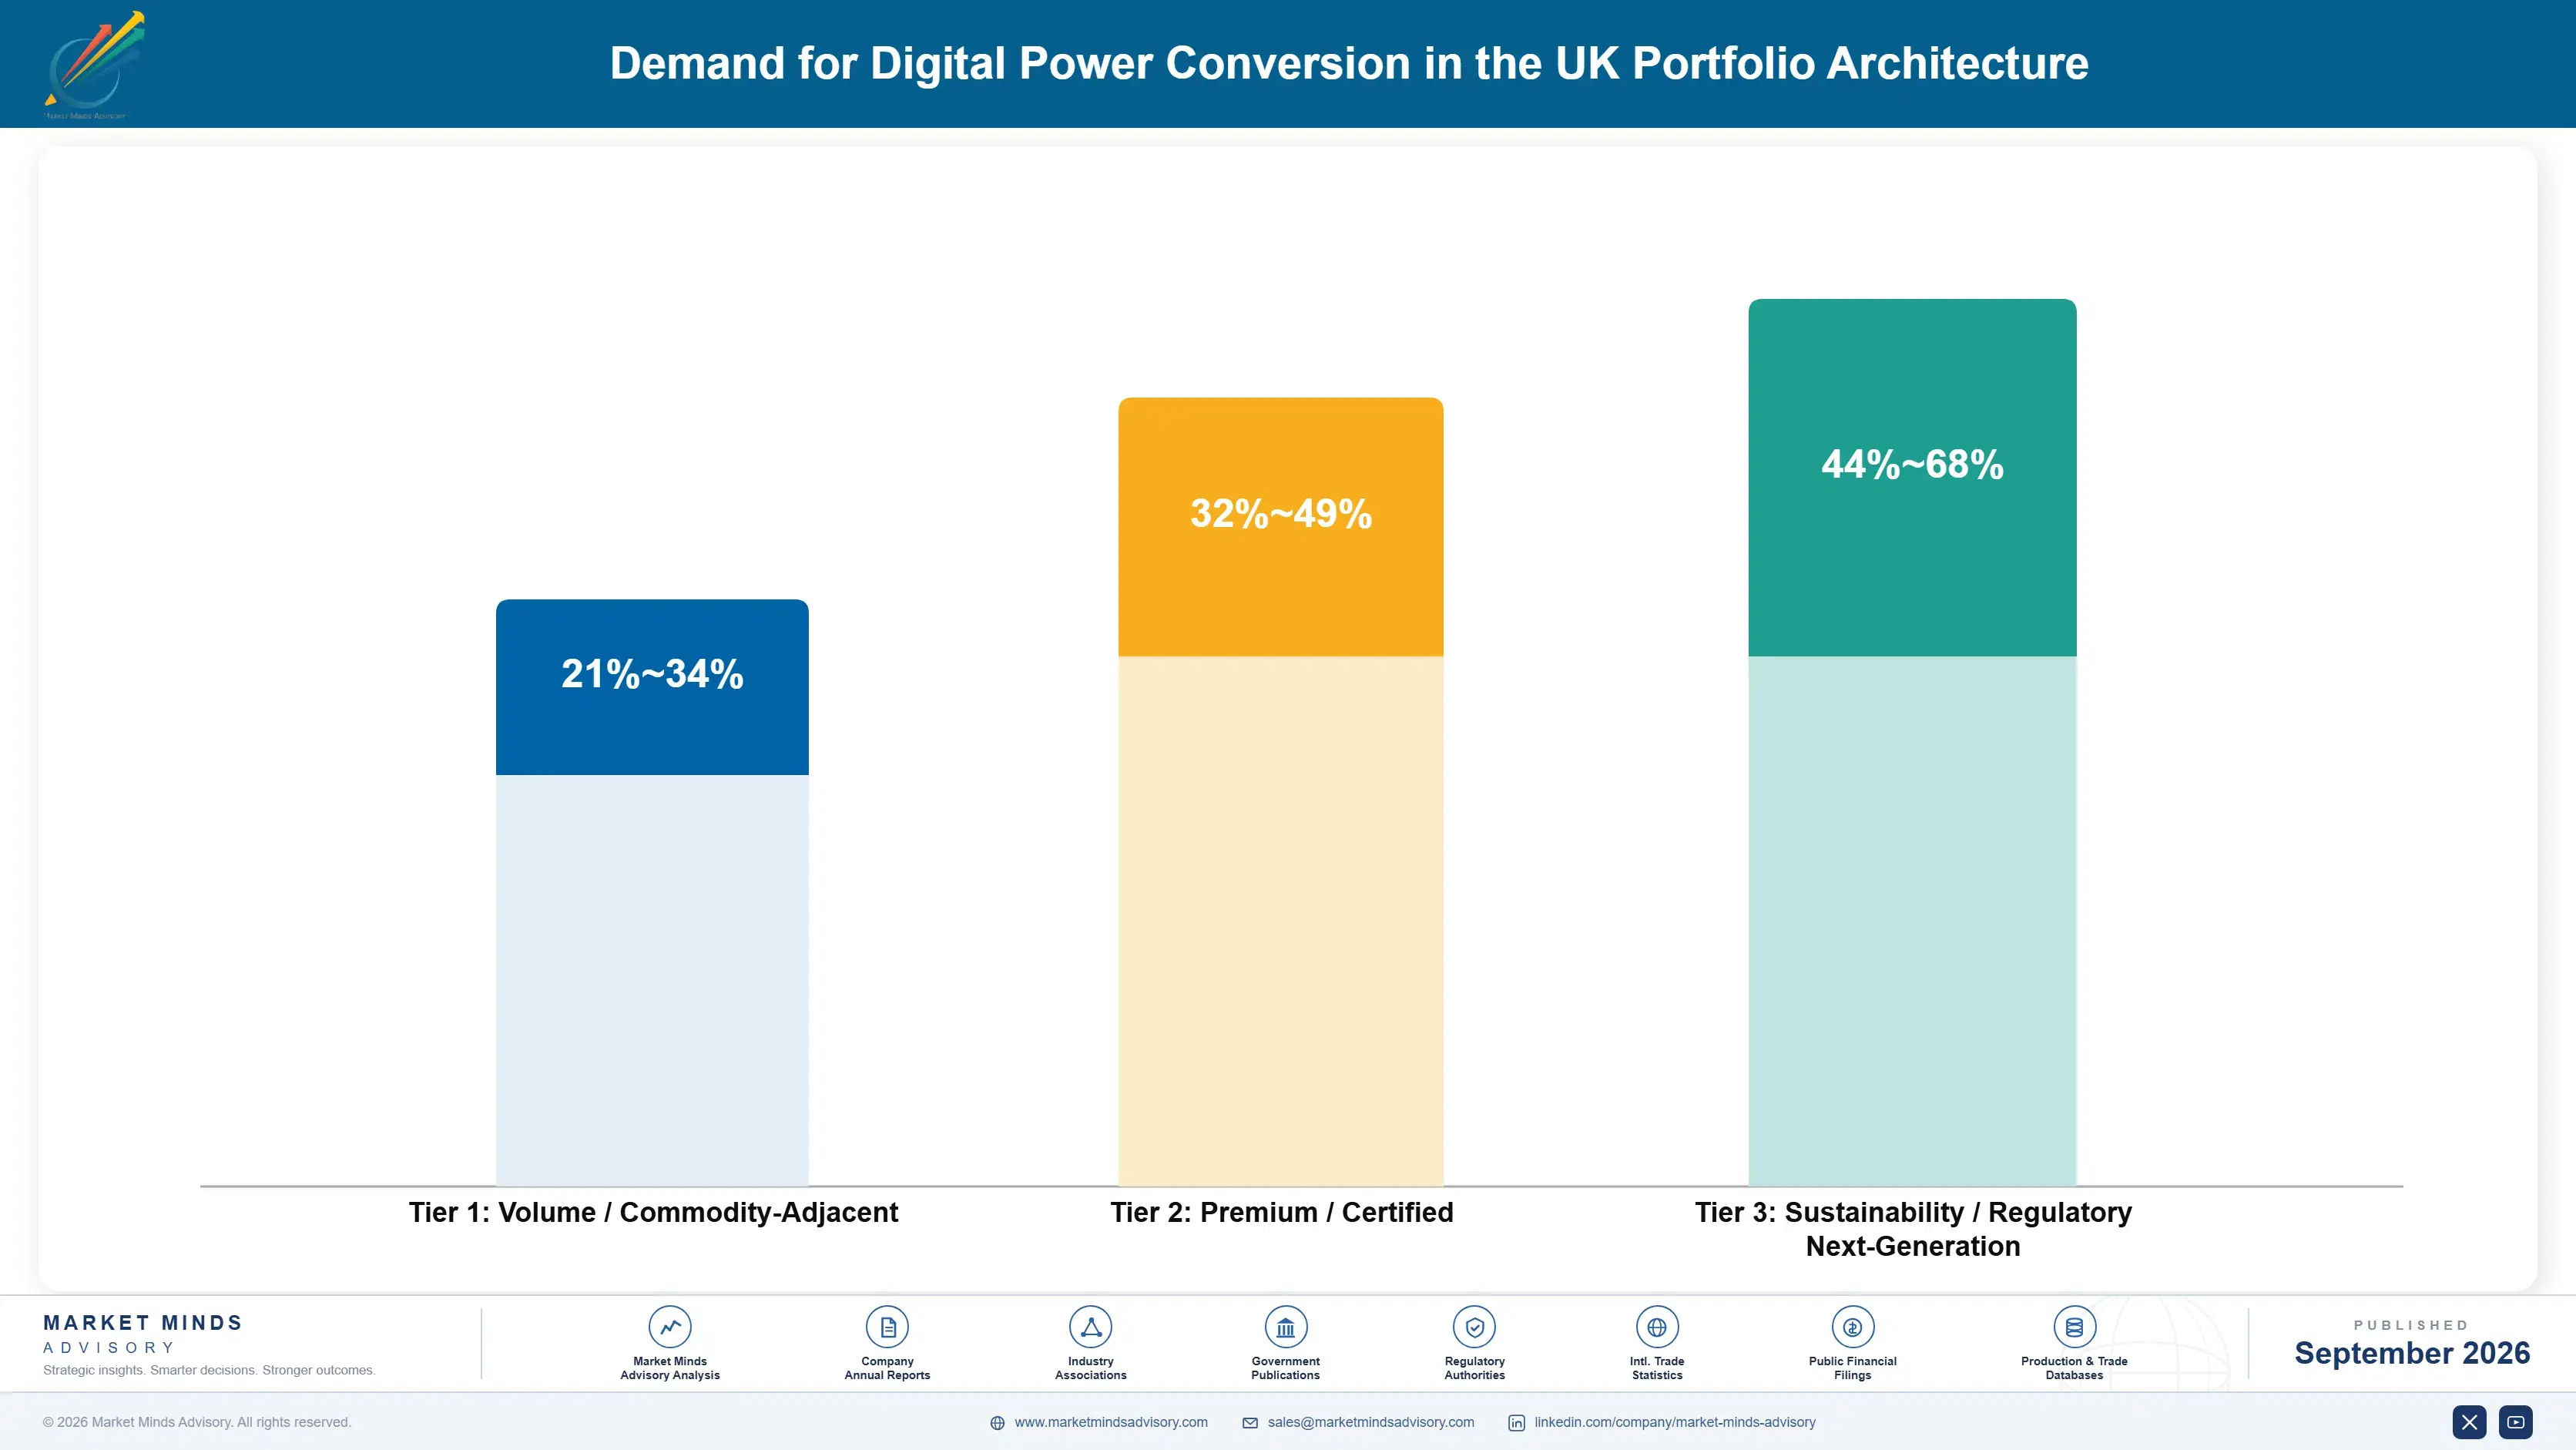
Margin architecture separates on whether the buyer can measure what they are getting. Commodity conversion modules sold on specification sheets earn thin margins because comparison is easy and the 15% digital premium looks like pure cost. High density computing conversion earns considerably more, since the constraint being solved is rack capability rather than component price. Grid-interactive products earn well because network codes restrict who can comply at all.
The tension runs between volume applications and constrained ones. Industrial and telecommunications conversion ships in far larger quantities at prices that make the digital premium difficult to justify, which is why analogue designs still win much of that work. Computing and grid applications ship less and pay more, because the buyer is solving a capacity or compliance problem rather than a component cost one. Suppliers organised for volume struggle to serve the second group.

High-value revenue concentrates in high density computing conversion and in grid-interactive products meeting network code requirements. Both are defended by engineering capability rather than by price, and both have buyers who evaluate against facility or network outcomes. Long-term firmware support is the emerging third pool, recurring across fifteen year installed bases and currently given away by most suppliers.

Volume / Commodity-Adjacent

Standard conversion modules and controllers sold into industrial, telecommunications and instrumentation applications on published specification. The range separates suppliers with integrated silicon from those assembling purchased components. Analogue alternatives compete directly here on cost.
Gross Margin: 21-34%

Premium / Certified

High density computing conversion and electric vehicle charging products where thermal, transient and density requirements restrict credible suppliers. Margin reflects engineering differentiation rather than component content. Facility engineers rather than component buyers make these selections.
Gross Margin: 32-49%

Sustainability / Regulatory / Next-Generation

Grid-interactive conversion meeting network code requirements, plus long-term firmware support and telemetry analysis services. The widest range in the portfolio, reflecting code variation between jurisdictions and support pricing that most suppliers have not yet established. Highest margin and least contested.
Gross Margin: 44-68%
united-kingdom-digital-power-conversion-market-portfolio-architecture-1788425170555

High-value Sub-segments and Strategic Watch-out

High Density Computing Conversion

High value with the fastest growth at 14.1%, solving rack capability rather than component cost and specified by facility engineers evaluating total facility power. The range reflects density achieved and integration depth. British demand is sharpened further by connection waits that make recovered efficiency into capacity.
Gross Margin: 40-58%

Grid-Interactive Compliance Products

High value with strong growth at 12.4%, protected because network codes restrict which products can connect at all rather than which perform best. The range reflects code variation between jurisdictions. A code revision can obsolete a product line without any competitor doing anything, which cuts both ways.
Gross Margin: 46-68%

Industrial and Telecommunications Modules

The volume core, shipping in the largest quantities at prices where the 15% digital premium is hardest to justify against analogue alternatives. The range separates integrated silicon suppliers from module assemblers. It funds the manufacturing scale that higher-margin products then benefit from directly. Volume is the point.
Gross Margin: 20-33%

Unpriced Firmware Support

The strategic watch-out, where suppliers absorb patching and support obligations across fifteen year installed bases from hardware margin never priced to carry them. The cost grows with every unit shipped and appears nowhere in any product line review. Most suppliers have not yet measured what it actually costs them.
Gross Margin: 0-8%

How This Demand Renews

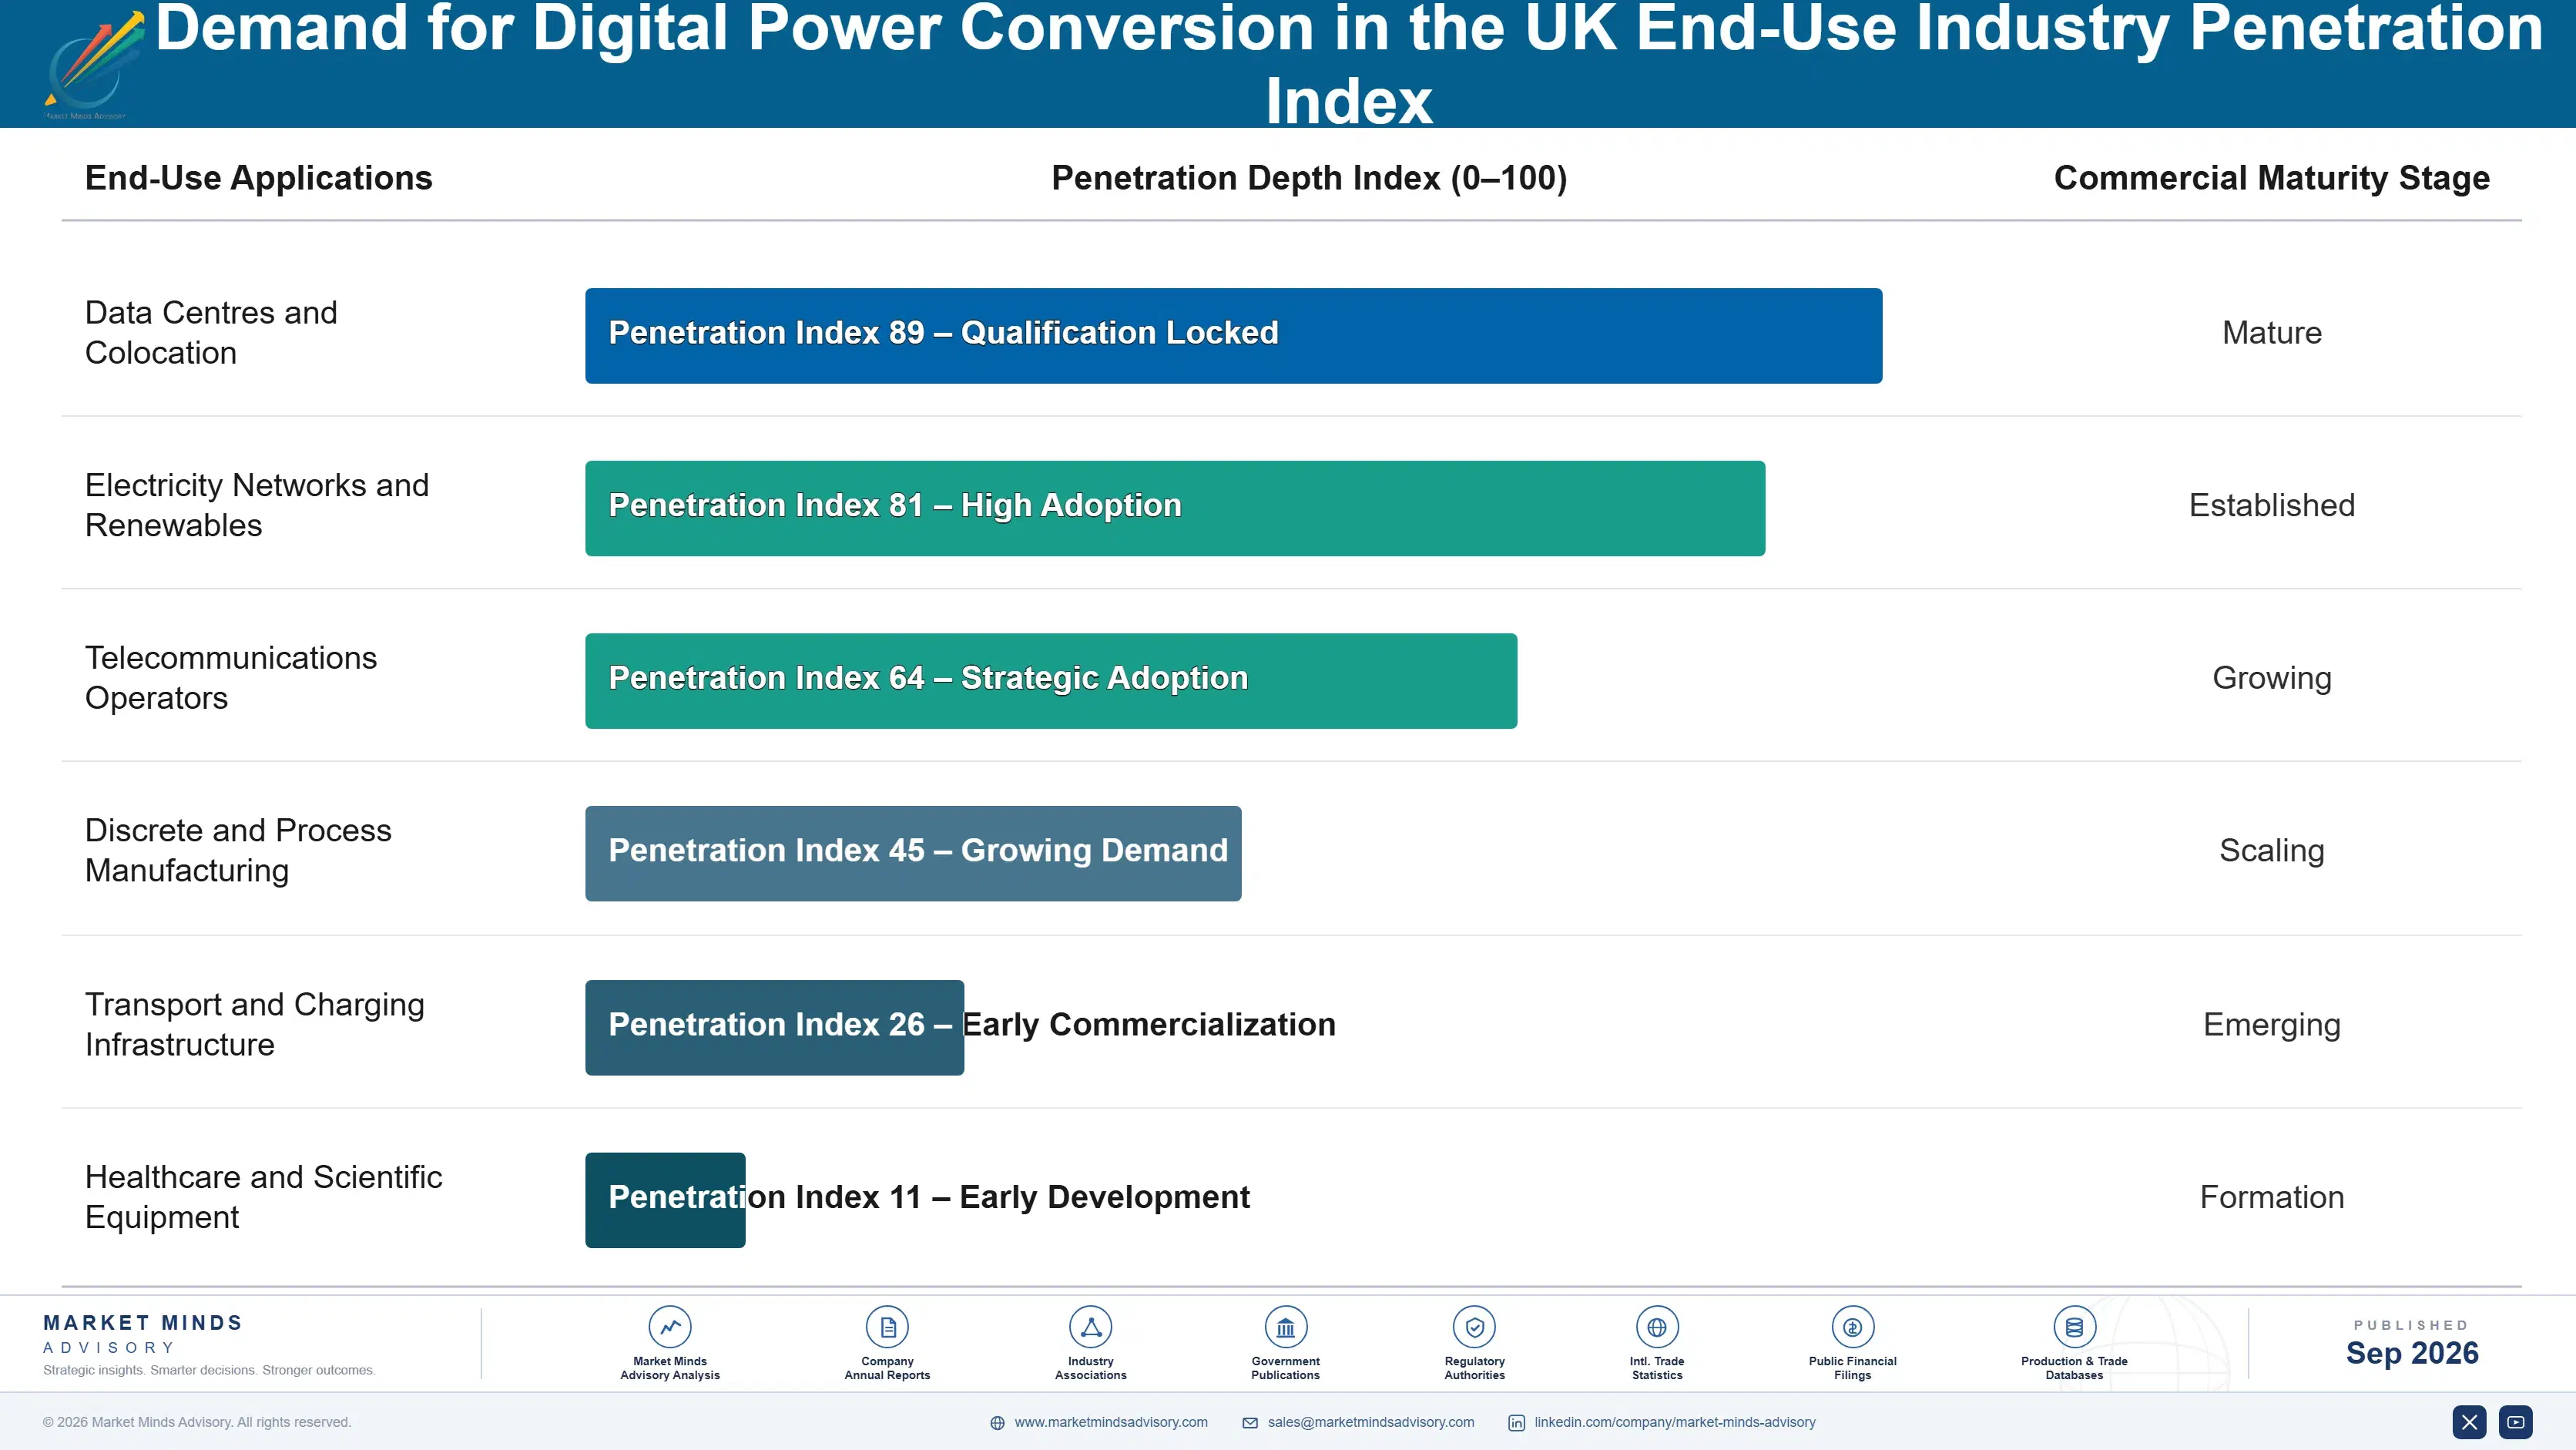
Recurrence follows the equipment the conversion sits inside. Computing conversion refreshes with platform generations running two to three years, which is fast enough that a design win renews frequently and a loss is recoverable. Industrial and grid conversion lasts fifteen years or more, so a design win is close to permanent and a loss removes a supplier for years. Firmware support recurs annually across those long lives, whether or not anybody charges for it.
Adoption depth varies with how much the buyer measures. Operators who have instrumented their installations specify digital control consistently, because they have seen partial load behaviour and know what nameplate sizing costs them. Those who have not buy on peak efficiency and unit price, and generally choose analogue. The dividing line is measurement practice rather than industry, which is why adoption varies so widely between similar British facilities.

The specifying buyer has moved. Conversion was historically selected by component engineers against electrical specification and unit cost. In computing and grid applications it is now chosen by facility engineers and network compliance teams evaluating facility power or code conformance. Suppliers whose sales organisations still address component engineering are talking to a function that reviews rather than decides.
united-kingdom-digital-power-conversion-market-end-use-penetration-index-1788425171043

What Actually Wins Designs

These are among the four positions where our research anticipates prominent divergence between winners and laggards over the coming forecast period. Each is grounded in the demand model, the regulatory perimeter, and the announced capacity pipeline.
01 / PARTIAL LOAD DISCLOSURE

Publish the whole curve and win the specification

Equipment spends its working life between 20% and 40% of rated load and almost never near the point where peak efficiency is quoted, which every experienced facilities engineer already knows and most published data sheets continue to ignore. Suppliers publishing full efficiency curves win against competitors quoting a single figure, because the curve is precisely where the 4.1 point advantage becomes visible. Buyers evaluating on curves select digital control at roughly twice the rate of those shown a peak number.
02 / CAPACITY VALUE FRAMING

Sell released capacity where grid queues are long

In British locations where connection waits reach about seven years an operator cannot buy more power at any price, so efficiency recovered inside an existing connection is capacity rather than an operating saving. Framing the proposal against what waiting costs moves the decision into infrastructure budgets that dwarf component budgets entirely, and operators making that calculation approve at values around 3 times what an energy case supports. The framing works only where the constraint is genuine, which limits it usefully.
03 / TELEMETRY SIZING SERVICE

Sell measurement as sizing, not as a feature

Per-rail measurement attaches to roughly 62% of installed units and is usually listed as a specification bullet rather than sold as the instrument that lets an operator size the next installation against measured draw instead. Nameplate sizing carries conservative margin that measurement routinely recovers, releasing capacity nobody had accounted for anywhere in the estate. Suppliers providing sizing analysis alongside hardware attach to roughly 40% more of the customer's subsequent projects, at analysis cost that is close to trivial against the hardware.
04 / FIRMWARE SUPPORT PRICING

Charge for support before the installed base grows

Digitally controlled conversion carries software obligations across installed bases running fifteen years, including patching, version management and security response that the analogue business these organisations grew up in never required of anybody selling hardware. Suppliers absorbing that silently fund it from hardware margin that was never priced to carry it, and the cost compounds with every single unit shipped. Separately priced long-term support recovers around 6% of installed base value annually once the obligation is explained honestly to the customer.

Engagement Snapshot From the Field

A live engagement with an industry participant carrying material or product regulatory and market exposure ahead of a defining policy shift, showing how our research translates into a defensible multi-year portfolio strategy.
MARKET MINDS ADVISORY · CLIENT ENGAGEMENT SUMMARY
Demand for Digital Power Conversion in the UK Producer Strategic Portfolio Review and Transition Roadmap 2026·Investment Scenario on Demand for Digital Power Conversion in the UK Exposure Evaluation 2025-26
CLIENT PROFILE
A British colocation operator running four data centres across the South East with approximately 46 MW of contracted grid capacity (client-reported, unverified by MMA). Two sites were at their connection limit with customer demand unmet, and the distribution network operator had quoted roughly seven years for additional capacity at the constrained locations. Neither site could grow.
STRATEGIC CHALLENGE
The operator had assumed expansion required either new grid capacity or new sites, and had budgeted approximately GBP 38 million for a fifth facility (client-reported, unverified by MMA). Nobody had examined how much of the existing 46 MW was actually being delivered to customer equipment rather than lost in conversion, distribution and cooling along the way.
MMA APPROACH
MMA measured delivered power against contracted capacity at rack level across all four sites, which required instrumenting circuits the operator had never monitored. We reviewed conversion architecture, interviewed 17 facility and engineering staff and four equipment suppliers. Options were assessed against megawatts released within existing connections rather than against equipment cost.
KEY FINDINGS
  1. Conversion and distribution losses consumed approximately 5.8 MW across the four sites, considerably more than the operator had assumed from nameplate efficiency figures.
  2. Installed conversion equipment operated at around 31% of rated load on average, where analogue designs perform several points below their published peak efficiency.
  3. Rack capacity had been allocated against nameplate ratings carrying roughly 22% margin, so measured sizing released headroom without any equipment change at all.
  4. The two unconstrained sites had spare connection capacity that customer allocation practice had made invisible to the commercial team for several years.
CLIENT PROFILE
A British colocation operator running four data centres across the South East with approximately 46 MW of contracted grid capacity (client-reported, unverified by MMA). Two sites were at their connection limit with customer demand unmet, and the distribution network operator had quoted roughly seven years for additional capacity at the constrained locations. Neither site could grow.
STRATEGIC CHALLENGE
The operator had assumed expansion required either new grid capacity or new sites, and had budgeted approximately GBP 38 million for a fifth facility (client-reported, unverified by MMA). Nobody had examined how much of the existing 46 MW was actually being delivered to customer equipment rather than lost in conversion, distribution and cooling along the way.
MMA APPROACH
MMA measured delivered power against contracted capacity at rack level across all four sites, which required instrumenting circuits the operator had never monitored. We reviewed conversion architecture, interviewed 17 facility and engineering staff and four equipment suppliers. Options were assessed against megawatts released within existing connections rather than against equipment cost.
KEY FINDINGS
  1. Conversion and distribution losses consumed approximately 5.8 MW across the four sites, considerably more than the operator had assumed from nameplate efficiency figures.
  2. Installed conversion equipment operated at around 31% of rated load on average, where analogue designs perform several points below their published peak efficiency.
  3. Rack capacity had been allocated against nameplate ratings carrying roughly 22% margin, so measured sizing released headroom without any equipment change at all.
  4. The two unconstrained sites had spare connection capacity that customer allocation practice had made invisible to the commercial team for several years.
RECOMMENDED STRATEGY
Phase 1: Instrument all four sites permanently and reallocate customer capacity against measured draw rather than nameplate ratings, releasing headroom immediately across all four sites. Phase 2: Replace conversion equipment at the two constrained sites with digitally controlled designs selected on partial load performance rather than peak efficiency. Phase 3: Defer the fifth facility until released capacity across the existing estate has been measured, sold and demonstrably exhausted at both constrained locations.
OUTCOME
Measured reallocation and conversion replacement released roughly 6.4 MW of usable capacity across the estate (client-reported, unverified by MMA), at a cost near GBP 9 million. The fifth facility was deferred by three years, and the operator now specifies conversion equipment on published partial load curves rather than on peak efficiency figures.

Frequently Asked Questions

Foundational context covering the market sizes, CAGR, scope, country, region and competition that inform every finding below. This section is provided to cover basics and most often pre-purchase conversations, answered from the MMA Primary Research Dataset.

What is the current size of the Demand for Digital Power Conversion in the UK?

The market was worth USD 14.6 billion in 2025 and reaches USD 15.97 billion in 2026 on a global sizing frame. The United Kingdom is the analytical centre of this report.

How large will the Demand for Digital Power Conversion in the UK be by 2036?

MMA forecasts USD 39.22 billion by 2036, an expansion of 2.46 times over the forecast period. That represents USD 23.25 billion of incremental annual revenue against 2026.

What is the CAGR for the Demand for Digital Power Conversion in the UK 2026 to 2036?

The base case is 9.4% compound annual growth, with a bull case at 10.6% and a bear case at 8.2%. United Kingdom demand specifically grows at 8.6% across the period.

Which segment is growing fastest?

Data centre and computing conversion grows at 14.1%, half again the market rate of 9.4%. High density computing punishes conversion loss twice, as wasted energy and again as heat.

Who are the major companies in the Demand for Digital Power Conversion in the UK?

Infineon Technologies, Texas Instruments, Vicor, Delta Electronics and Analog Devices lead on measured conversion product revenue. Together they hold roughly 39%, split between semiconductor and power supply manufacturers.

Which country is growing fastest?

India grows fastest at 12.6%, on simultaneous data centre construction, industrial expansion and renewable connection. United Kingdom demand grows at 8.6% from a considerably more mature base.

Report Segmentation Architecture

The full report scope spans multiple orthogonal segmentation dimensions, with cross-tabulated demand data provided for each dimension pair. Coverage extends further to regional breakdowns, trend trajectories, and the competitive detail needed to support segment-level decision-making.

By Primary Market Dimension

  • Data Centre and Computing Power Conversion
  • Grid-Interactive and Renewable Conversion
  • Telecommunications and Network Power
  • Industrial Automation and Motor Drives
  • Electric Vehicle Charging Conversion
  • Medical and Instrumentation Power

By End-Use Industry

  • Data Centres and Colocation
  • Electricity Networks and Renewables
  • Telecommunications Operators
  • Discrete and Process Manufacturing
  • Transport and Charging Infrastructure
  • Healthcare and Scientific Equipment

By Commercial Dimension

  • Component and Controller Supply
  • Complete Module Supply
  • Facility Engineer Specified Purchases
  • Network Code Compliance Programmes
  • Long-Term Firmware Support Contracts
  • Distribution and Design House Channels

By Region

  • Western Europe
  • East Asia
  • North America
  • South Asia and Pacific
  • Latin America
  • Middle East and Africa
  • Eastern Europe

Scope, Methodology, and Coverage

Every figure in this report is reproducible from documented input assumptions. The scope below maps the historical period, the forecast horizon, the segmentation dimensions, and the countries covered, alongside the underlying primary and qualitative methodology.
Historical Period
2020 to 2025
Forecast Period
2026 to 2036
Base Year
2025 (USD billions; MMA Primary Research Dataset, September 2026)
Market Definition
This market covers power conversion products, modules and controllers employing digital control loops and telemetry, spanning data centre and computing power conversion, grid-interactive and renewable conversion, telecommunications and network power, industrial automation and motor drives, electric vehicle charging conversion, and medical and instrumentation power. Value is measured as conversion product, module and controller revenue at supplier level, including attributable firmware support, with the United Kingdom treated as the analytical centre within a global sizing frame required by the seven-region reporting structure. Purely analogue-controlled conversion, battery cells and energy storage systems, transmission and distribution equipment, uninterruptible power supply batteries, and general power management software are excluded from scope.
Quantitative Units
USD billions, conversion product, module and controller revenue at supplier level
Segmentation Dimensions
Application context, end-use industry, commercial channel, region
Regions Covered
Western Europe, East Asia, North America, South Asia and Pacific, Latin America, Middle East and Africa, Eastern Europe
Countries Covered
United Kingdom, Ireland, Germany, France, Netherlands, Sweden, Norway, Denmark, Spain, Italy, Poland, Czechia, Hungary, United States, Canada, Mexico, Brazil, Chile, China, Japan, South Korea, Taiwan, Singapore, India, Australia, Vietnam, Malaysia, Saudi Arabia, United Arab Emirates, South Africa
Key Companies Profiled
Infineon Technologies, Texas Instruments, Vicor, Delta Electronics, Analog Devices, STMicroelectronics, onsemi, Renesas, Monolithic Power Systems, Flex Power Modules, Advanced Energy Industries, Eaton, ABB, Murata Manufacturing, TDK-Lambda, XP Power, Bel Fuse, Artesyn Embedded Power, Navitas Semiconductor, Power Integrations
Quantitative Methodology
Primary survey, n=3,800 respondents, Q4 2025, six countries; demand-side model with trade association cross-validation
Qualitative Methodology
47 expert interviews, Q4 2025; applied to validate demand model assumptions, identify emerging dynamics, and assess competitive positioning
Report Format
PDF and XLSX data workbook (Word format preview document)
Publisher
Market Minds Advisory
Report Code
MMA-2026-ENE-611
Published
September 2026
Contact
sales@marketmindsadvisory.com | www.marketmindsadvisory.com

Purchase the full Demand for Digital Power Conversion in the UK Report (2026 to 2036).

The full MMA report examines digital power conversion through the constraint that actually drives British demand, which is grid capacity rather than energy cost, and sets out why partial load behaviour matters more than peak efficiency. It sizes the market to 2036 across six application contexts, seven regions and 30 countries, with segment growth rates and regional demand mechanisms detailed throughout. Competitive analysis covers 20 suppliers assessed on measured conversion product and module revenue, with moat and risk assessment for the two leaders. The report quantifies component cost structure, firmware support economics and margin architecture across three portfolio tiers. It closes with four verdicts and an anonymised colocation operator engagement.
Six application contexts sized through 2036
Seven regions with demand mechanism analysis
Twenty suppliers on consistent revenue basis
Partial load efficiency and grid wait benchmarks
Margin architecture across three portfolio tiers
Anonymised British colocation power architecture engagement

Built For The People Who Decide

From boardroom strategy to bench-side execution, this report is read cover-to-cover by leaders shaping the next decade of their industry, turning demand scenarios, market dynamics and valuation benchmarks into decisions.
CXOs/ Presidents/ VPs/ Managers
M&A and Corporate Development
Strategy Teams and R&D Heads
Procurement and Product Directors
Regulatory and Compliance Leaders
Investor Relations and Equity Analysts