Market Minds Advisory
Ultrasound Market

Ultrasound Market: The Operator Is The Constraint

A cheap device in untrained hands gives a confident wrong answer, which is worse than no scan, and that single fact explains why software rather than hardware now decides how far the modality spreads.

Lead Analyst

Published

September 2026

Make Smarter Decisions with Customized Research Insights

Request a free sample report and evaluate market opportunities, growth trends, and competitive dynamics relevant to your business needs.

2025 MARKET VALUE$12.4BMarket Size 2025
2036 FORECAST VALUE$34.0BBase Case , 2026 to 2036
CAGR 2026 TO 20369.6 %Bull 10.8% / Bear 8.4%
INCREMENTAL OPPORTUNITY$20.4BNet 10- year value creation
EXPANSION MULTIPLE2.50x2036 value over 2026 base
Strategic Levers
M&A Pipeline
Regional Outlook
Country Rankings
Competitive Intelligence
Segmental Deep-dive
Call-Us : 91 93563 13602

Executive Snapshot and Market Trajectory

Ultrasound is the only major imaging modality where the answer depends on who is holding the probe. Roughly 240 supervised hours separate a novice from competent independent practice, and around 12% of examinations get repeated because the first was not diagnostic. The scarce resource has never been the machine.
East Asia takes 29% of value on examination volume concentrated across the region, with North America at 28% on professional fee structures that pay far more per study. Software and artificial intelligence applications grow at 14.4%, half again the market rate of 9.6%, because acquisition guidance turns an untrained clinician into an adequate one, which is the only thing that has ever moved this constraint.
Concentration is moderate at 48% because software, contrast and therapeutic applications each attract different competitors. Reimbursement is the quiet obstacle nobody discusses: in most systems the interpretation fee exceeds the scanning fee, so bedside imaging changes who gets paid. Institutional resistance follows, and it has nothing whatever to do with clinical merit. Contrast utilisation sits near 6% of eligible examinations for closely related reasons, and product marketing has never moved it.
Market Definition
The market covers the ultrasound modality beyond imaging hardware alone, including diagnostic imaging services and scanning volume, ultrasound software and artificial intelligence applications, service, maintenance and managed contracts, ultrasound contrast agents, therapeutic and focused ultrasound, and training, certification and education programmes. Imaging system and transducer hardware sales, other imaging modalities, general radiology information systems, and surgical energy devices are excluded from scope.
Base Year Value
$12.4B in 2025 (MMA Primary Research Dataset, August 2026)
Forecast Period
2026 to 2036, eleven discrete annual values
CAGR
9.6% base case. Bull 10.8%. Bear 8.4%.
Fastest Growth Segment
Ultrasound Software and AI Applications: 14.4% CAGR
Fastest Growth Country
India: 11.7% CAGR
Fastest Growth Region
South Asia and Pacific: 11.8% CAGR
Largest Region
East Asia: 29% of 2025 global value
Market Leaders
GE HealthCare, Siemens Healthineers, Philips, Bracco, Canon Medical Systems. Source: MMA Analysis based on disclosed ultrasound modality revenue across systems, software, service and contrast, company annual reports 2025.
Primary Survey
n=3,800 procurement and R&D decision-makers, Q4 2025, six countries
Methodology
Demand-side build-up, cross-validated against public data, 47 expert interviews

Ultrasound Market Forecast Scenarios

ultrasound-devices-market-size-forecast-scenario-1787699275544
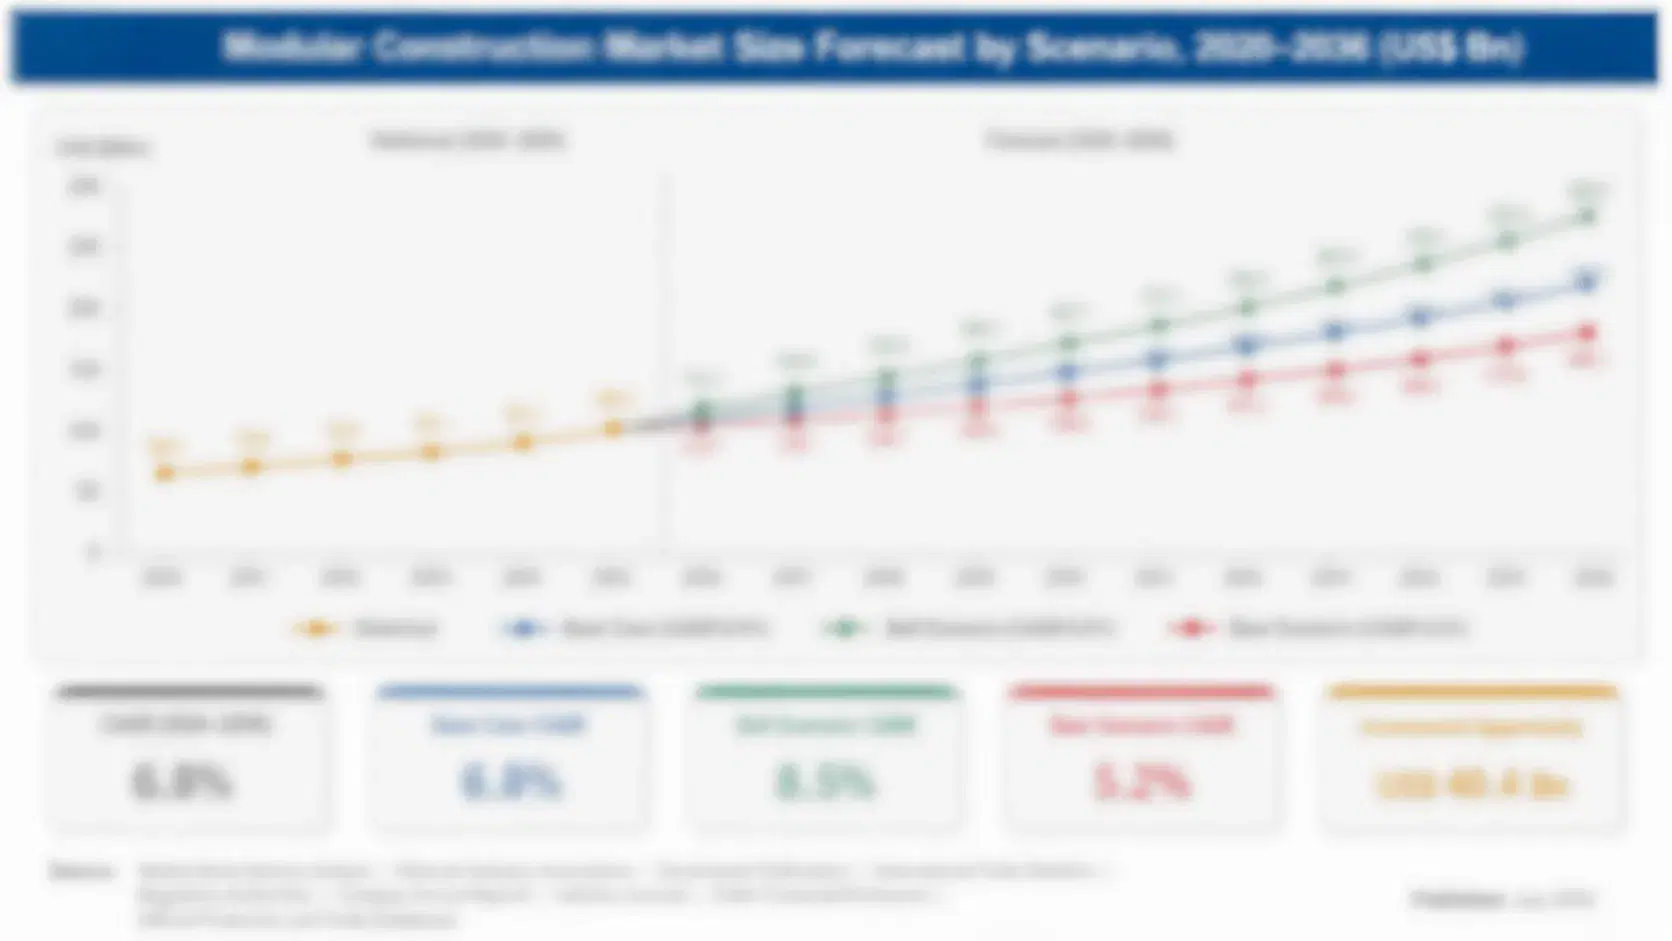
Growth from 2020 to 2025 ran at 8.0% and the recurring layers grew considerably faster than examination volume did. Software applications for automated measurement and view recognition moved from research demonstrations into cleared products across the period. Contrast utilisation rose slowly against persistent workflow and billing friction. Therapeutic applications advanced through reimbursement decisions rather than clinical breakthroughs.
The 9.6% base case rests on three mechanisms. Acquisition guidance software keeps extending scanning to clinicians who never completed 240 supervised hours, which expands where the modality can be used at all. Service and managed contracts keep growing with installed bases that expand faster than they are replaced. And Asian examination volume keeps rising as diagnostic capacity spreads into districts that previously referred patients elsewhere. All three run on recurring layers rather than on hardware sales.
The bull case at 10.8% assumes reimbursement adapts to bedside imaging rather than resisting it, which would remove the institutional obstacle that clinical evidence has never addressed. The bear case at 8.4% is repeat examination rates staying near 12% as untrained scanning spreads faster than guidance software reaches it, which would slow adoption through quality concerns rather than through any cost constraint.

Who Holds The Probe

Every other imaging modality gives the same answer regardless of who pressed the button. Ultrasound does not. Roughly 240 supervised scanning hours separate a novice from competent independent practice, and around 12% of examinations are repeated because the first produced nothing diagnostic. That operator dependency is the modality's defining commercial fact, and it explains why cheap hardware has never expanded ultrasound as far as the price alone would suggest it should have.
FIVE-FIRM CONCENTRATION48%Share of ultrasound modality revenue held by the leading providers
CONTRAST STUDY FEE$210Typical additional charge for a contrast enhanced ultrasound examination
TOP SCANNING COUNTRYChina 26%Chinese share of global diagnostic ultrasound examination volume
OPERATOR TRAINING HOURS240Supervised scanning hours required before competent independent practice
REPEAT SCAN RATE12%Examinations repeated because the first was not diagnostic
CONTRAST UTILISATION6%Share of eligible examinations performed with contrast enhancement
Software is what finally addresses that. View recognition, automated measurement and real-time acquisition guidance let a clinician who never completed formal training obtain an image adequate for the question being asked. Growth at 14.4% follows, and it runs on hardware the software vendor frequently did not build. The value migrated to a layer manufacturers do not control by owning the installed base.
Reimbursement is the obstacle nobody argues about openly. In most health systems the professional interpretation fee exceeds the technical scanning fee, so a clinician who scans and interprets at the bedside collapses two payments into one and moves revenue between departments. Resistance to point-of-care imaging is framed as quality and is partly about payment. Contrast utilisation sits near 6% for related reasons.
"The debate is always framed as quality. Ask who bills for the study and the argument gets much shorter, and considerably more honest, than any of the published position statements."
Principal, Imaging and Diagnostics Practice · MMA Healthcare Practice · August 2026

Market Trends

Acquisition Guidance Software Removes The Training Barrier

Real-time view recognition and probe guidance let a clinician who never completed 240 supervised hours acquire an image adequate for the specific question asked, which addresses the constraint that has limited this modality since it existed. Growth at 14.4% follows directly. The software runs on hardware the vendor frequently did not build, so value migrates to a layer that established manufacturers do not control through installed base ownership, which is an uncomfortable position for companies organised around selling systems. Clinical validation and workflow integration decide adoption instead, and those are capabilities system manufacturers did not necessarily build.
Market Impact: Covers 26% of global examinations

Managed Service Contracts Replace Transactional Repair Billing

Installed bases are expanding faster than they are being replaced, which grows the population needing service regardless of what happens to system sales in any given year. Health systems increasingly buy managed contracts covering uptime and probe availability rather than paying for individual repairs, because predictable annual cost suits budget planning better than unpredictable events do. Growth at 7.6% is steady rather than spectacular and it is considerably more defensible than hardware revenue against price competition. It also removes the reason customers currently have to use third-party probe repairers at all.
Market Impact: Serves 3 approved clinical indications

Market Opportunities and Growth Drivers

Asian Diagnostic Capacity Expands Examination Volume Rapidly

Diagnostic imaging capacity across China, India and Southeast Asia has spread into cities and districts that previously referred patients considerable distances for any scan at all, and ultrasound leads that expansion because it needs no shielding and modest power. India grows fastest of any country at 11.7% as diagnostic chains and private hospital networks scale. Examination volume across East Asia already accounts for roughly 26% of the global total in China alone, and it continues rising. Operator availability rather than equipment cost limits how fast that expansion can actually go.
Market Impact: Collapses 2 separate payments

Therapeutic Applications Advance Through Reimbursement Decisions

Focused ultrasound for prostate tissue ablation, essential tremor and uterine fibroids advances when payers agree to cover the procedure rather than when clinical evidence improves, which is why adoption looks uneven across countries with similar clinical practice. Growth at 9.0% tracks coverage decisions country by country. Providers investing ahead of reimbursement carry capital equipment that cannot be used economically, and those waiting find that referral patterns have already formed around alternative treatments. Coverage decisions arrive unevenly and reshape referral patterns within a couple of quarters when they do. Timing decides the return.
Market Impact: Repeats 12% of examinations

Market Restraints and Challenges

Reimbursement Structures Resist Bedside Imaging Quietly

Professional interpretation fees exceed technical scanning fees in most health systems, so a clinician scanning and interpreting at the bedside collapses two payments into one and moves revenue between departments. Root cause is a fee structure designed when imaging was performed in one place and read in another. The commercial impact is institutional resistance framed as quality concern, which slows adoption regardless of evidence. Mitigation runs through documentation and coding support that lets point-of-care studies be billed properly. The obstacle was never clinical in the first place. Coding support removes it.
Market Impact: Replaces 240 training hours

Untrained Scanning Produces Confident Wrong Answers

Around 12% of examinations are repeated because the first was not diagnostic, and a non-diagnostic scan is at least visible as a failure. The genuine risk is a confident incorrect interpretation from an inadequate image, which nobody counts. Root cause is that ultrasound quality depends on operator skill in a way other modalities simply do not. The commercial impact is justified caution about rapid expansion. Mitigation runs through guidance software and structured competency programmes rather than through hardware improvement. A confident wrong answer is worse than none at all. Nobody counts those cases.
Market Impact: Covers 8 years per installation
3 additional market trends, 4 additional growth drivers, and 2 additional restraints and challenges are covered in the full report. Contact sales@marketmindsadvisory.com to access the complete intelligence.

Segment CAGR and Growth Architecture

Segmentation follows the layer of the ultrasound modality being sold: examinations, software, service, contrast, therapy or training, rather than the hardware format that delivers any of them. Six layers cover the market without overlap. Clinical specialty and commercial arrangement are treated as separate dimensions throughout this report. Hardware format sits outside this hierarchy entirely.
ultrasound-devices-market-market-share-analysis-1787699275829

Ultrasound Software and AI Applications

Growth at 14.4%, half again the market rate of 9.6%, comes from addressing operator dependency rather than from improving images, since view recognition and acquisition guidance let clinicians who never completed 240 supervised hours obtain usable studies. The software frequently runs on hardware its vendor did not build, which separates the value from installed base ownership entirely. Established manufacturers who assumed their systems would carry the software layer have discovered that clearance, clinical validation and workflow integration decide it instead, and those are different capabilities. The assumption that owning the system secures whatever runs on it no longer holds anywhere. Reach across platforms rather than imaging performance decides who wins this layer.
CAGR 14.4%

Ultrasound Contrast Agents

Contrast enhancement lets ultrasound characterise liver lesions and assess cardiac perfusion in ways unenhanced imaging cannot, and utilisation sits near 6% of eligible examinations because the workflow is awkward rather than because the clinical case is weak. Administration requires a licensed operator, a separate billing code and a longer appointment slot. Growth at 9.6% follows workflow simplification and expanding indications rather than any new agent chemistry. Providers who solved the scheduling and coding problem use contrast several times more often than comparable institutions do. Selling the workflow around the agent rather than the agent alone is what changes the number. A longer appointment slot is the practical obstacle nobody has been willing to solve.
CAGR 9.6%
Full segment breakdown across 6 segments available in the complete report.

Regional Architecture and Country Demand Map

Geography follows examination volume and fee structure together, and those pull in different directions. East Asia leads on scanning volume, North America follows closely on professional fee levels, and India grows fastest of any country across the period. Fee structure decides how much revenue each examination carries.

North America

Professional interpretation fees exceed technical fees substantially, which makes bedside imaging a payment question as much as a clinical one and produces institutional resistance that published position statements describe in other terms. Point-of-care adoption is nonetheless furthest advanced here, driven by emergency and critical care departments willing to absorb the billing complexity. Software applications reach clearance and commercial adoption faster than elsewhere. Managed service contracts covering uptime and probe availability are well established across large health systems and increasingly displace transactional repair billing. Software applications increasingly reach clinical departments directly rather than through radiology procurement, which changes who a vendor has to persuade entirely. Departments decide for themselves now. Persuasion targets shifted.
Share: 28% | CAGR: 8.8% (2026 to 2036)

Western Europe

Salaried physician arrangements across much of the region remove the fee-splitting problem that shapes American resistance to bedside imaging, which lets adoption follow clinical judgement more directly. Contrast utilisation is higher than in North America for liver characterisation, where European guidelines have supported its use for longer. Software clearance runs through European regulation that has become more demanding for clinical decision support, which slows commercial launch. Therapeutic ultrasound reimbursement varies considerably between national systems and shapes where equipment gets installed. Managed uptime contracting is growing steadily and displaces transactional repair billing across the larger hospital groups and national systems. Transactional repair is fading steadily. Predictable cost drives that change across estates.
Share: 22% | CAGR: 8.0% (2026 to 2036)
Regional intelligence for 5 additional markets available in the complete report: East Asia, South Asia and Pacific, Latin America, Middle East and Africa, Eastern Europe. Contact sales@marketmindsadvisory.com.
ultrasound-devices-market-country-cagr-analysis-1787699276125

Selling Past The Operator Constraint

Roughly 240 supervised hours separate novice from competent practice, 12% of examinations get repeated, contrast reaches only 6% of eligible studies, and interpretation fees exceed scanning fees. Four levers work on guidance software, billing support, contrast workflow and service contracting rather than on imaging performance. Imaging performance settles none of it, and it has not for years.

Sell Guidance Software Independently Of Hardware

Acquisition guidance addresses the 240 hour training requirement that has constrained this modality since it began, and growth at 14.4% is running in that layer rather than in imaging performance. Software vendors reaching clinicians directly bypass the installed base entirely, which established manufacturers find uncomfortable and cannot easily prevent. Building software that runs across multiple hardware platforms reaches a far larger addressable population than tying it to one manufacturer's systems, and clinical validation rather than hardware ownership decides adoption. Reach rather than performance decides this. Ownership secures nothing here. Validation carries it.
Market Impact: Replaces all 240 supervised operator training hours entirely

Provide Coding Support For Bedside Examinations

Professional interpretation fees exceed technical scanning fees in most systems, so bedside imaging collapses 2 payments into one and moves revenue between departments, which produces resistance framed as clinical concern. Vendors who supply documentation templates, image archiving and coding guidance let point-of-care studies be billed properly, which removes the financial objection rather than arguing against it. Clinical evidence has never resolved this obstacle because the obstacle was never clinical in the first place. Removing the objection works where arguing against it has failed for two decades. The objection was financial.
Market Impact: Recovers 2 of the collapsed clinical payment streams

Fix Contrast Workflow Rather Than Contrast Chemistry

Contrast reaches only 6% of eligible examinations, and the barrier is a licensed administrator, a separate billing code and a longer appointment slot rather than any weakness in the clinical case. Providers who solved scheduling and coding use contrast several times more often than comparable institutions. Suppliers selling agents alone leave that multiplier unrealised. Selling the workflow around the agent, including protocol design and scheduling templates, reaches utilisation levels that product marketing has never achieved. The constraint was never the chemistry. Scheduling and coding are the real work here, and suppliers have consistently declined to do it.
Market Impact: Lifts utilisation from only 6% of eligible studies

Convert Repair Billing Into Managed Uptime Contracts

Installed bases grow faster than they are replaced, which expands the serviceable population regardless of system sales, and health systems prefer predictable annual cost to unpredictable repair events across an 8 year installed life. Managed contracts covering uptime and probe availability are considerably more defensible than hardware revenue against price competition. They also remove the commercial reason customers currently have to use third-party repairers for individual probe failures. Predictable annual cost suits hospital budgeting better than unpredictable repair events, and the aggregate arithmetic favours the provider. Uptime is what customers actually want to buy.
Market Impact: Secures 8 full years of installed base revenue

Who Controls the Margin Pool

Measured on disclosed ultrasound modality revenue across systems, software, service and contrast, the five largest providers hold a CR5 of 48%, which is considerably lower than in hardware alone because each layer attracts different competitors. GE HealthCare, Siemens Healthineers and Philips span systems, software and service, while Bracco holds a dominant contrast position and Canon contributes strong imaging and clinical application depth. Each layer is a different competitive contest with different entrants.
Three contests define activity. Examination and service revenue competes on installed base coverage and uptime commitments among established manufacturers. Software competes on clinical validation and cross-platform reach, where specialist developers compete on equal terms with much larger companies. Therapeutic ultrasound competes on reimbursement coverage decisions country by country, which is a regulatory and payer capability rather than a commercial one. A provider organised for one contest is rarely equipped for the others.

Pressure builds as software value separates from hardware ownership and as specialist developers reach clinicians directly. Rankings shift toward whoever addresses operator dependency convincingly. Reimbursement structures remain the largest unaddressed obstacle, and almost nobody is working on it commercially. Nobody is working on it commercially.
ultrasound-devices-market-company-positioning-matrix-1787699276415

Competitive Moat and Risk Dimensions

GE HEALTHCARE

Moat: Installed Base And Service Coverage

GE combines a very large installed base with service coverage reaching hospitals that smaller providers cannot practically support, which sustains managed contract revenue independently of new system sales. That reach depends on field engineers and parts logistics rather than on any technology. A superior software product still needs the hardware serviced, and service relationships shape who gets evaluated.
GE HEALTHCARE

Risk: Software Layer Disintermediation

Acquisition guidance software increasingly runs across multiple hardware platforms and reaches clinicians directly, which means installed base ownership no longer guarantees participation in the fastest growing layer. Service reach protects service revenue without protecting software revenue at all. Growth at 14.4% is accessible to developers who own no hardware whatsoever.
BRACCO

Moat: Contrast Agent Regulatory Position

Bracco holds approved ultrasound contrast agents across major markets with indication coverage built over many years of regulatory work, which is a genuine barrier since new agents require full clinical development. Contrast is written into imaging protocols that institutions revise slowly. A competitor with an equivalent agent still faces indication-by-indication approval and protocol change nobody schedules willingly.
BRACCO

Risk: Utilisation Ceiling Constraint

Contrast reaches only around 6% of eligible examinations, and the constraint is workflow, licensing and billing rather than agent availability or regulatory coverage. A strong position in a market operating far below its clinical potential caps growth regardless of competitive standing. Solving the workflow problem matters more commercially than defending the regulatory position does.

Players Tracked

Prominent Players

GE HealthCare
Siemens Healthineers
Philips
Bracco
Canon Medical Systems

Other Key Players

Lantheus Medical Imaging
Insightec
EDAP TMS
Profound Medical
Us2.ai
DiA Imaging Analysis
Exo Imaging
Butterfly Network
Mindray
Samsung Medison
Fujifilm Healthcare
Konica Minolta
Hologic
SonoSim
Clarius Mobile Health

Recent Developments

FEBRUARY 2025

Acquisition guidance software cleared for multiple hardware platforms

An ultrasound guidance application received clearance covering several manufacturers' hardware platforms rather than a single system family, a regulatory development rather than any corporate transaction. That separates the software value from installed base ownership and lets the developer reach clinicians whose systems came from competing manufacturers.
Signal: Cross-platform clearance separates software revenue from hardware ownership, which established manufacturers cannot easily prevent. Reach changes entirely.
JUNE 2025

Health system adopts managed uptime contracting across imaging estate

A large health system replaced transactional repair billing with managed uptime and probe availability contracts across its ultrasound estate, a procurement decision rather than any corporate event. Predictable annual cost suited budget planning better than unpredictable repair events, and third-party repair usage fell as a direct consequence.
Signal: Managed contracting removes the commercial reason customers have to use independent probe repair operators. Predictability wins here.
SEPTEMBER 2025

Payer extends coverage for focused ultrasound tissue ablation

A national payer extended reimbursement coverage for a focused ultrasound ablation indication, a coverage decision rather than any corporate transaction. Equipment installed ahead of the decision had been operating well below economic utilisation, and referral patterns began shifting within two quarters of the change. Utilisation followed the decision closely.
Signal: Therapeutic ultrasound adoption follows coverage decisions rather than clinical evidence, country by country. Evidence follows coverage.

What The Modality Costs

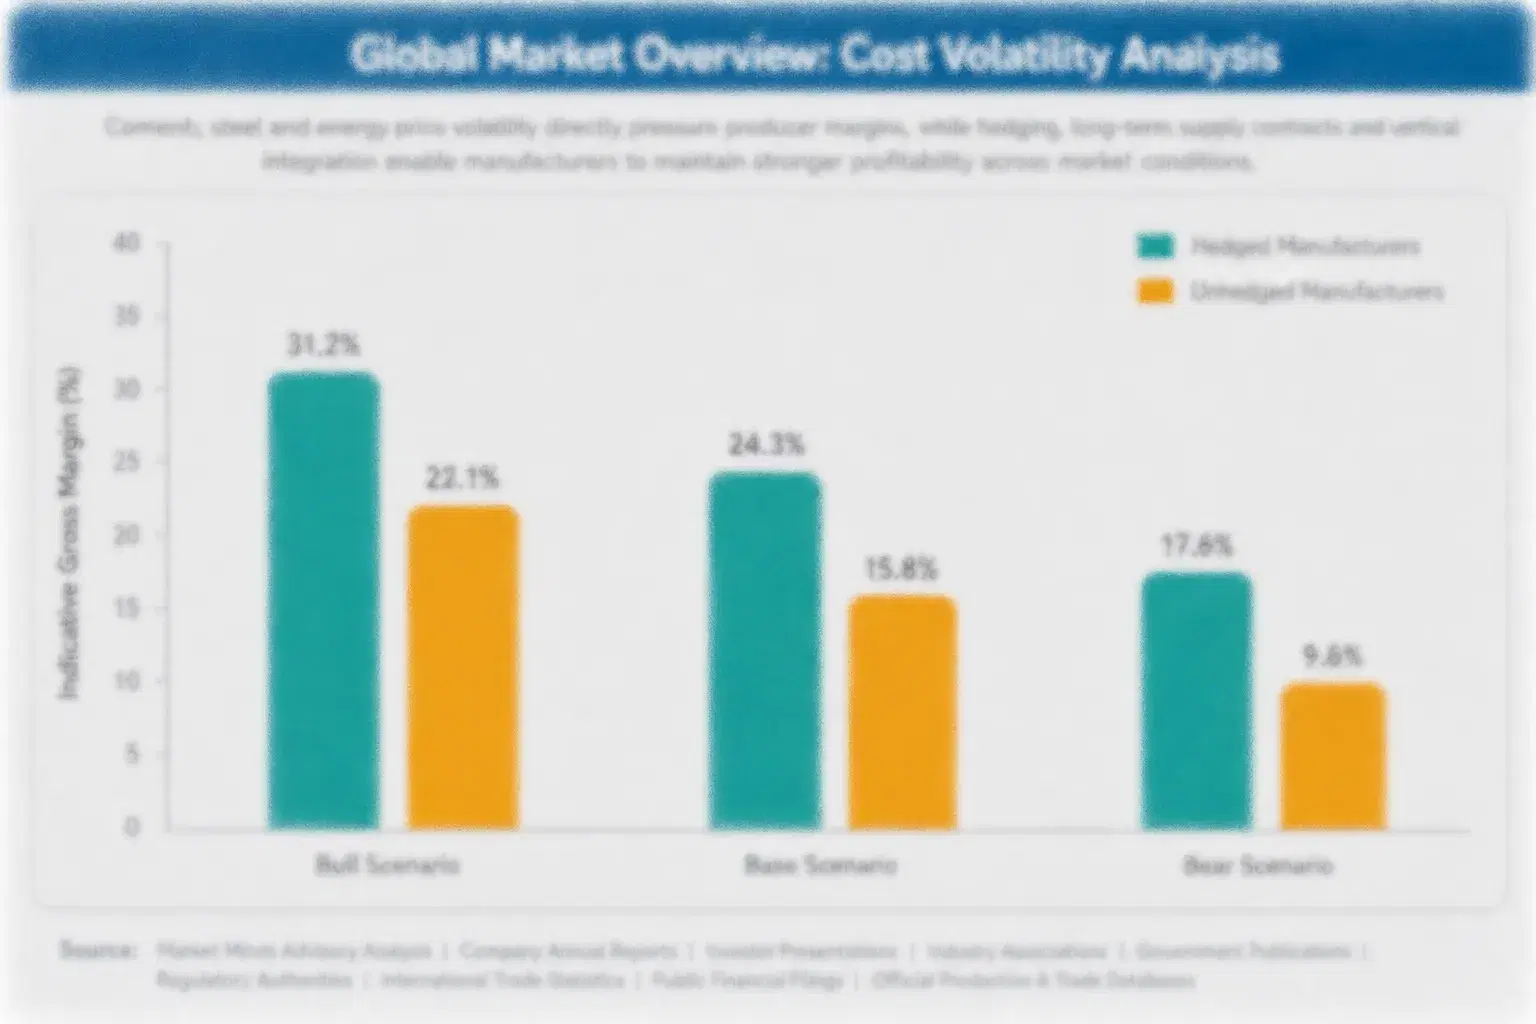
Cost structure varies enormously by layer, which is what makes this a portfolio question rather than an operating one. Software carries development, clinical validation and regulatory clearance cost with almost no marginal cost per deployment. Service carries field engineer time, parts inventory and logistics, which are 44 to 53% of managed contract cost. Contrast agents carry pharmaceutical manufacturing and distribution. Therapeutic systems carry capital equipment economics closer to hardware.
The volatility that mattered was clinical validation and regulatory cost for software. Requirements for clinical decision support tightened across major markets through the period, extending development timelines and cost, which Siemens Healthineers and Philips annual report disclosures describe across their digital health portfolios. Field service labour cost also rose with wage inflation through 2022 and 2023, and IEA industrial energy data records the logistics cost movement.

Exposure divides by layer weighting rather than by scale. Providers weighted toward service carry labour cost that inflation moves directly and that automation addresses only partially. Software-weighted competitors carry regulatory cost that rises with scrutiny and falls per unit with volume. Contrast suppliers carry pharmaceutical cost structures in a market operating far below clinical potential.
ultrasound-devices-market-cost-volatility-analysis-1787699276676

Build software for cross-platform hardware compatibility

Clinical validation and regulatory clearance cost the same whether software runs on one manufacturer's systems or on several, so restricting compatibility spreads that fixed cost across a far smaller addressable population. Cross-platform clearance multiplies the reachable base without multiplying development cost. It also removes the dependence on installed base ownership that established manufacturers rely on commercially.

Price service on uptime rather than incidents

Field service labour cost rises with wage inflation and repair volume is unpredictable per account while being reliable in aggregate across an installed base. Uptime contracting matches revenue to the cost structure and gives providers predictable annual budgeting. It also removes the transactional comparison against third-party repairers that individual repair pricing invites at every probe failure.

Sell contrast workflow alongside the agent

Contrast reaches around 6% of eligible examinations and pharmaceutical fixed costs therefore spread across far less volume than the clinical case supports. Selling protocol design, scheduling templates and coding guidance alongside the agent addresses the actual constraint. Providers who solved workflow use contrast several times more often, which changes the volume the fixed cost base is spread across.

Portfolio Architecture for Margin Defence

Margin follows how far a layer sits from hardware. Examination and scanning volume earns thinly and is priced by health systems rather than by suppliers. Training and education programmes earn modestly. Service and managed contracts earn steadily and defensibly across long installed lives. Contrast earns well in a market operating far below potential. Software earns best of all, since marginal cost per deployment is close to nothing once clearance is held.
The tension is that the highest margin layer is the one least connected to installed base ownership. Software reaching clinicians directly across multiple hardware platforms does not need a manufacturer's systems, while service revenue depends entirely on them. Companies built around hardware find their strongest asset protects the layer growing slowest and does nothing for the layer growing fastest, which is an awkward position that few have addressed openly.

High-value pools sit in three places. Cross-platform guidance software, where clinical validation rather than hardware ownership decides adoption. Managed uptime contracting, which is defensible against price competition and removes third-party repair. And contrast workflow services, which address a utilisation ceiling that product marketing has repeatedly failed to move.

Volume / Commodity-Adjacent

Examination and scanning service revenue together with training and education programmes, both priced by health systems rather than by suppliers. The 9-point range is wide because scanning economics differ enormously between fee-for-service and salaried physician health systems.
Gross Margin: 19-28%

Premium / Certified

Service, maintenance and managed uptime contracts across installed bases, and therapeutic ultrasound systems where reimbursement coverage exists. The 10-point spread separates managed contracting from transactional repair billing, which carry different cost structures entirely.
Gross Margin: 38-48%

Sustainability / Regulatory / Next-Generation

Ultrasound software and artificial intelligence applications together with contrast agents and their associated workflow services. The 32-point range is wide because software marginal cost is near zero while contrast carries full pharmaceutical manufacturing and distribution economics.
Gross Margin: 52-84%
ultrasound-devices-market-portfolio-architecture-1787699276958

High-value Sub-segments and Strategic Watch-out

Cross-Platform Guidance Software

Highest value and fastest growth at 14.4%, with marginal cost near zero once clearance is held across multiple hardware platforms. The risk is that regulatory requirements for clinical decision support keep tightening, which raises the fixed cost of entry and slows every commercial launch considerably.
Gross Margin: 76-84%

Contrast Agents And Workflow

Strong margins with growth at 9.6%, held back by utilisation near 6% of eligible examinations for workflow rather than clinical reasons. The risk is that the workflow constraint persists, leaving pharmaceutical fixed costs spread across far less volume than the clinical case genuinely supports. Workflow decides it.
Gross Margin: 58-66%

Managed Service Contracts

The defensible core, growing with installed bases that expand faster than replacement and largely insulated from hardware price competition. Providers hold it because it also removes the commercial reason customers have to use third-party probe repair operators at all. Nobody exits it voluntarily. Renewal is close to automatic.
Gross Margin: 40-46%

Hardware Disintermediation

The strategic watch-out. Software value increasingly separates from installed base ownership as guidance applications clear across multiple platforms and reach clinicians directly. The risk is that a manufacturer's strongest asset protects only the layers growing most slowly across the whole modality. That is an awkward position to hold.
Gross Margin: 24-30%

Recurring Beyond The Machine

Almost every layer of this market recurs and only the hardware underneath it does not. Examinations generate revenue per study, service contracts renew annually, software licenses renew, contrast is consumed per administration and training repeats with staff turnover. The installed system is a one-off purchase that enables a decade of recurring revenue across five other layers, which is why the modality is far more attractive as a whole than hardware economics alone suggest.
Stickiness varies by layer and not in the way manufacturers expect. Service contracts are sticky through installed base ownership. Contrast is sticky through imaging protocols institutions revise slowly. Software is the least sticky of all, since cross-platform clearance means a competing application can replace it without touching the hardware, which inverts the assumption that owning the system secures everything running on it.

The buyer differs sharply by layer too. Service contracting runs through biomedical engineering and hospital finance weighing predictable cost. Software is increasingly chosen by clinical departments who evaluate whether it helps them get an answer. Contrast is decided by radiology protocol committees. Therapeutic ultrasound requires payer engagement before any provider conversation is worth having, which is a capability entirely separate from selling.
ultrasound-devices-market-end-use-penetration-index-1787699277264

Where The Constraint Actually Binds

These are among the four positions where our research anticipates prominent divergence between winners and laggards over the coming forecast period. Each is grounded in the demand model, the regulatory perimeter, and the announced capacity pipeline.
01 / OPERATOR DEPENDENCY SOLVING

The scarce resource was never the machine

Roughly 240 supervised scanning hours separate a complete novice from competent independent practice, and around 12% of examinations get repeated because the first produced nothing diagnostic at all. Acquisition guidance software addresses that constraint directly, which is exactly why growth running at 14.4% sits in the software layer rather than in imaging performance. Cheap hardware never expanded this modality anywhere near as far as its price suggested it should have done, because hardware was never what was actually limiting it.
02 / REIMBURSEMENT OBSTACLE REMOVAL

Ask who bills before arguing about quality

Professional interpretation fees exceed the technical scanning fees across most health systems, so a clinician who scans and interprets at the bedside collapses two payments into one and moves revenue between hospital departments. Resistance to point-of-care imaging is invariably framed as a quality concern, and it is at least partly a payment concern instead. Vendors who supply documentation, archiving and coding support simply remove the financial objection, instead of arguing against a clinical one that was never the real issue.
03 / CONTRAST WORKFLOW INVESTMENT

Six percent is a workflow number not clinical

Contrast enhancement currently reaches only around 6% of all eligible examinations, and the constraint is a licensed administrator, a separate billing code and a longer appointment slot rather than any weakness in the clinical evidence. Providers who have solved the scheduling and coding problem use contrast several times more often than otherwise entirely comparable institutions do. Suppliers who sell the agent alone leave that entire multiplier completely unrealised, and product marketing has repeatedly failed to move the number at all.
04 / PLATFORM INDEPENDENCE BUILDING

Owning the system no longer owns the software

Acquisition guidance applications increasingly clear regulation across multiple hardware platforms and reach clinicians directly, which means that installed base ownership no longer guarantees any participation at all in the fastest growing layer of the whole modality. Clinical validation and workflow integration decide adoption instead, and both are entirely different capabilities from manufacturing imaging systems well. Growth running at 14.4% annually is fully accessible to specialist developers who own no imaging hardware at all and who never intend to build any.

Engagement Snapshot From the Field

A live engagement with an industry participant carrying material or product regulatory and market exposure ahead of a defining policy shift, showing how our research translates into a defensible multi-year portfolio strategy.
MARKET MINDS ADVISORY · CLIENT ENGAGEMENT SUMMARY
Ultrasound Producer Strategic Portfolio Review and Transition Roadmap 2026·Investment Scenario on Ultrasound Exposure Evaluation 2025-26
CLIENT PROFILE
An imaging provider with established ultrasound systems and service positions across European and Asian markets, reporting ultrasound modality revenue of 720 million dollars across hardware, service and software (client-reported, unverified by MMA). Software applications were sold only on the company's own systems. Contrast was distributed through a partner and workflow support was not offered at all.
STRATEGIC CHALLENGE
Software revenue had grown far more slowly than the market despite competitive clinical performance, and two large accounts had adopted a competitor's guidance application running on the company's own hardware. Management was preparing a software feature expansion. Nobody had examined whether restricting software to the company's systems was itself the limiting factor.
MMA APPROACH
MMA modelled the addressable population for the software portfolio under current platform restriction against cross-platform clearance, using installed base data across the target markets. Twenty-two expert interviews with clinical department leads, radiologists and biomedical engineering managers established how software and service decisions are actually made. The analysis treated platform restriction and workflow support, rather than software capability, as the causes.
KEY FINDINGS
  1. Platform restriction confined the software portfolio to under a third of the addressable installed base in target markets, and the restriction delivered no measurable hardware advantage in return.
  2. Both lost accounts had chosen the competitor application because it also ran on their other manufacturers' systems, avoiding two separate workflows for the same clinical task.
  3. Contrast utilisation at accounts the company served sat near the market average, and no workflow, protocol or coding support had ever been offered to any of them.
  4. Service revenue was leaking to third-party probe repair at accounts still billed transactionally rather than through managed uptime contracting arrangements. Uptime contracting had never been proposed.
CLIENT PROFILE
An imaging provider with established ultrasound systems and service positions across European and Asian markets, reporting ultrasound modality revenue of 720 million dollars across hardware, service and software (client-reported, unverified by MMA). Software applications were sold only on the company's own systems. Contrast was distributed through a partner and workflow support was not offered at all.
STRATEGIC CHALLENGE
Software revenue had grown far more slowly than the market despite competitive clinical performance, and two large accounts had adopted a competitor's guidance application running on the company's own hardware. Management was preparing a software feature expansion. Nobody had examined whether restricting software to the company's systems was itself the limiting factor.
MMA APPROACH
MMA modelled the addressable population for the software portfolio under current platform restriction against cross-platform clearance, using installed base data across the target markets. Twenty-two expert interviews with clinical department leads, radiologists and biomedical engineering managers established how software and service decisions are actually made. The analysis treated platform restriction and workflow support, rather than software capability, as the causes.
KEY FINDINGS
  1. Platform restriction confined the software portfolio to under a third of the addressable installed base in target markets, and the restriction delivered no measurable hardware advantage in return.
  2. Both lost accounts had chosen the competitor application because it also ran on their other manufacturers' systems, avoiding two separate workflows for the same clinical task.
  3. Contrast utilisation at accounts the company served sat near the market average, and no workflow, protocol or coding support had ever been offered to any of them.
  4. Service revenue was leaking to third-party probe repair at accounts still billed transactionally rather than through managed uptime contracting arrangements. Uptime contracting had never been proposed.
RECOMMENDED STRATEGY
Phase 1: Phase one: pursue cross-platform clearance for the guidance software portfolio, since restriction limits reach without producing any hardware advantage. Reach is the constraint. Phase 2: Phase two: build contrast workflow support covering protocol design, scheduling and coding, and sell it alongside the partner distributed agent. Phase 3: Phase three: convert transactional service accounts to managed uptime contracting, which removes the reason customers use third-party repairers. Predictability sells itself.
OUTCOME
Cross-platform clearance was filed in two major markets and the addressable base for the software portfolio expanded substantially on modelling (client-reported, unverified by MMA). Contrast workflow support was piloted at six accounts and utilisation rose materially at four of them. Managed uptime conversion recovered service revenue at three accounts where third-party repair had taken hold.

Frequently Asked Questions

Foundational context covering the market sizes, CAGR, scope, country, region and competition that inform every finding below. This section is provided to cover basics and most often pre-purchase conversations, answered from the MMA Primary Research Dataset.

What is the current size of the Ultrasound Market?

The market was worth 12.4 billion dollars in 2025, covering examinations, software, service, contrast agents, therapeutic applications and training. It reaches 13.59 billion dollars in 2026.

How large will the Ultrasound Market be by 2036?

MMA forecasts 33.98 billion dollars by 2036, an increase of 20.39 billion dollars over the 2026 base. That represents an expansion multiple of 2.50 times across the forecast period.

What is the CAGR for the Ultrasound Market 2026 to 2036?

The base case compounds at 9.6% annually. The bull case reaches 10.8% if reimbursement adapts to bedside imaging, while the bear case sits at 8.4% on persistent repeat examination rates.

Which segment is growing fastest?

Ultrasound software and artificial intelligence applications, at 14.4%, half again the market rate of 9.6%. Acquisition guidance addresses the operator dependency that has always constrained this modality.

Who are the major companies in the Ultrasound Market?

GE HealthCare, Siemens Healthineers, Philips, Bracco and Canon Medical Systems lead on disclosed ultrasound modality revenue. Insightec, Lantheus and several specialist software developers hold significant layer positions.

Which country is growing fastest?

India at 11.7%, as diagnostic chains and private hospital networks extend imaging capacity rapidly. China performs the largest examination volume at roughly 26% of the global total.

Report Segmentation Architecture

The full report scope spans multiple orthogonal segmentation dimensions, with cross-tabulated demand data provided for each dimension pair. Coverage extends further to regional breakdowns, trend trajectories, and the competitive detail needed to support segment-level decision-making.

By Modality Layer

  • Diagnostic Imaging Services and Scanning Volume
  • Ultrasound Software and AI Applications
  • Service, Maintenance and Managed Contracts
  • Ultrasound Contrast Agents
  • Therapeutic and Focused Ultrasound
  • Training, Certification and Education Programmes

By End-Use Specialty

  • Radiology and General Imaging
  • Cardiology
  • Obstetrics and Foetal Medicine
  • Emergency and Critical Care
  • Urology and Prostate Care
  • Neurology and Movement Disorders

By Commercial Dimension

  • Software Licence Subscription
  • Managed Uptime Service Contract
  • Transactional Repair Billing
  • Contrast Agent Supply and Workflow
  • Procedure Reimbursement Coverage
  • Training and Certification Programme

By Region

  • North America
  • Western Europe
  • East Asia
  • South Asia and Pacific
  • Latin America
  • Middle East and Africa
  • Eastern Europe

Scope, Methodology, and Coverage

Every figure in this report is reproducible from documented input assumptions. The scope below maps the historical period, the forecast horizon, the segmentation dimensions, and the countries covered, alongside the underlying primary and qualitative methodology.
Historical Period
2020 to 2025
Forecast Period
2026 to 2036
Base Year
2025 (USD billions; MMA Primary Research Dataset, August 2026)
Market Definition
Scope covers the ultrasound modality beyond imaging hardware, spanning diagnostic imaging services and scanning volume, ultrasound software and artificial intelligence applications, service, maintenance and managed contracts, ultrasound contrast agents, therapeutic and focused ultrasound, and training, certification and education programmes. Imaging system and transducer hardware sales, all other imaging modalities including computed tomography and magnetic resonance, general radiology information and picture archiving systems sold outside ultrasound applications, and surgical energy devices are excluded. This report addresses the modality's service, software and therapeutic layers; ultrasound imaging hardware is covered in a separate MMA report.
Quantitative Units
USD billions (current prices); examinations performed; software deployments; contrast administrations; managed contract coverage
Segmentation Dimensions
By Modality Layer; By End-Use Specialty; By Commercial Dimension; By Region
Regions Covered
North America, Western Europe, East Asia, South Asia and Pacific, Latin America, Middle East and Africa, Eastern Europe
Countries Covered
China, USA, Japan, Germany, India, France, UK, South Korea, Italy, Brazil, Spain, Canada, Australia, Turkey, Poland
Key Companies Profiled
GE HealthCare, Siemens Healthineers, Philips, Bracco, Canon Medical Systems, Lantheus Medical Imaging, Insightec, EDAP TMS, Profound Medical, Us2.ai, DiA Imaging Analysis, Exo Imaging, Butterfly Network, Mindray, Samsung Medison, Fujifilm Healthcare, Konica Minolta, Hologic, SonoSim, Clarius Mobile Health
Quantitative Methodology
Primary survey, n=3,800 respondents, Q4 2025, six countries; demand-side model with trade association cross-validation
Qualitative Methodology
47 expert interviews, Q4 2025; applied to validate demand model assumptions, identify emerging dynamics, and assess competitive positioning
Report Format
PDF and XLSX data workbook (Word format preview document)
Publisher
Market Minds Advisory
Report Code
MMA-2026-MED-123
Published
August 2026
Contact
sales@marketmindsadvisory.com | www.marketmindsadvisory.com

Purchase the full Ultrasound Market Report (2026 to 2036).

The full report runs to 182 pages and covers all six modality layer segments, seven regions and 20 profiled companies in detail. It includes the complete segment CAGR set, regional reimbursement structure comparison, and analysis of operator dependency and repeat examination rates across care settings. Company profiles carry evaluation on disclosed ultrasound modality revenue across systems, software, service and contrast, with moat and risk assessment for the top five providers. The competitive section extends to 16 tracked clinical, regulatory and reimbursement developments across 2024 and 2025. Primary research inputs include a quantitative survey of 3,800 respondents and 47 expert interviews conducted in Q4 2025.
Six modality layer segments with individual CAGR forecasts
Seven regional markets with reimbursement structure comparison analysis
Twenty company profiles on consistent modality revenue evaluation basis
Sixteen tracked clinical and reimbursement developments with commercial interpretation
Operator dependency and repeat examination analysis across care settings
Contrast utilisation barriers mapped by workflow and billing constraint

Built For The People Who Decide

From boardroom strategy to bench-side execution, this report is read cover-to-cover by leaders shaping the next decade of their industry, turning demand scenarios, market dynamics and valuation benchmarks into decisions.
CXOs/ Presidents/ VPs/ Managers
M&A and Corporate Development
Strategy Teams and R&D Heads
Procurement and Product Directors
Regulatory and Compliance Leaders
Investor Relations and Equity Analysts