Market Minds Advisory
Ultra-High Definition (UHD) Panel (4K) Market

Ultra-High Definition (UHD) Panel (4K) Market: Ultra-High Definition (UHD) Panel (4K) Market: Panel Constructions, Fab Economics and Premium Mix 2026 to 2036

A panel fab costs seven billion dollars, takes three years to build and cannot be turned off. That single fact explains why this industry keeps making things it loses money on.

Lead Analyst

Published

September 2026

Make Smarter Decisions with Customized Research Insights

Request a free sample report and evaluate market opportunities, growth trends, and competitive dynamics relevant to your business needs.

2025 MARKET VALUE$62.4BMarket Size 2025
2036 FORECAST VALUE$98.1BBase Case , 2026 to 2036
CAGR 2026 TO 20364.2 %Bull 5.4% / Bear 3.0%
INCREMENTAL OPPORTUNITY$33.1BNet 10- year value creation
EXPANSION MULTIPLE1.51x2036 value over 2026 base
Strategic Levers
M&A Pipeline
Regional Outlook
Country Rankings
Competitive Intelligence
Segmental Deep-dive
Call-Us : 91 93563 13602

Executive Snapshot and Market Trajectory.

Panel prices fall about 6% a year and have done for two decades, which is not a cycle but the ordinary condition of the industry. A fab that cost USD 7 billion cannot be idled economically, so everybody runs everything and the price simply keeps falling regardless of demand.
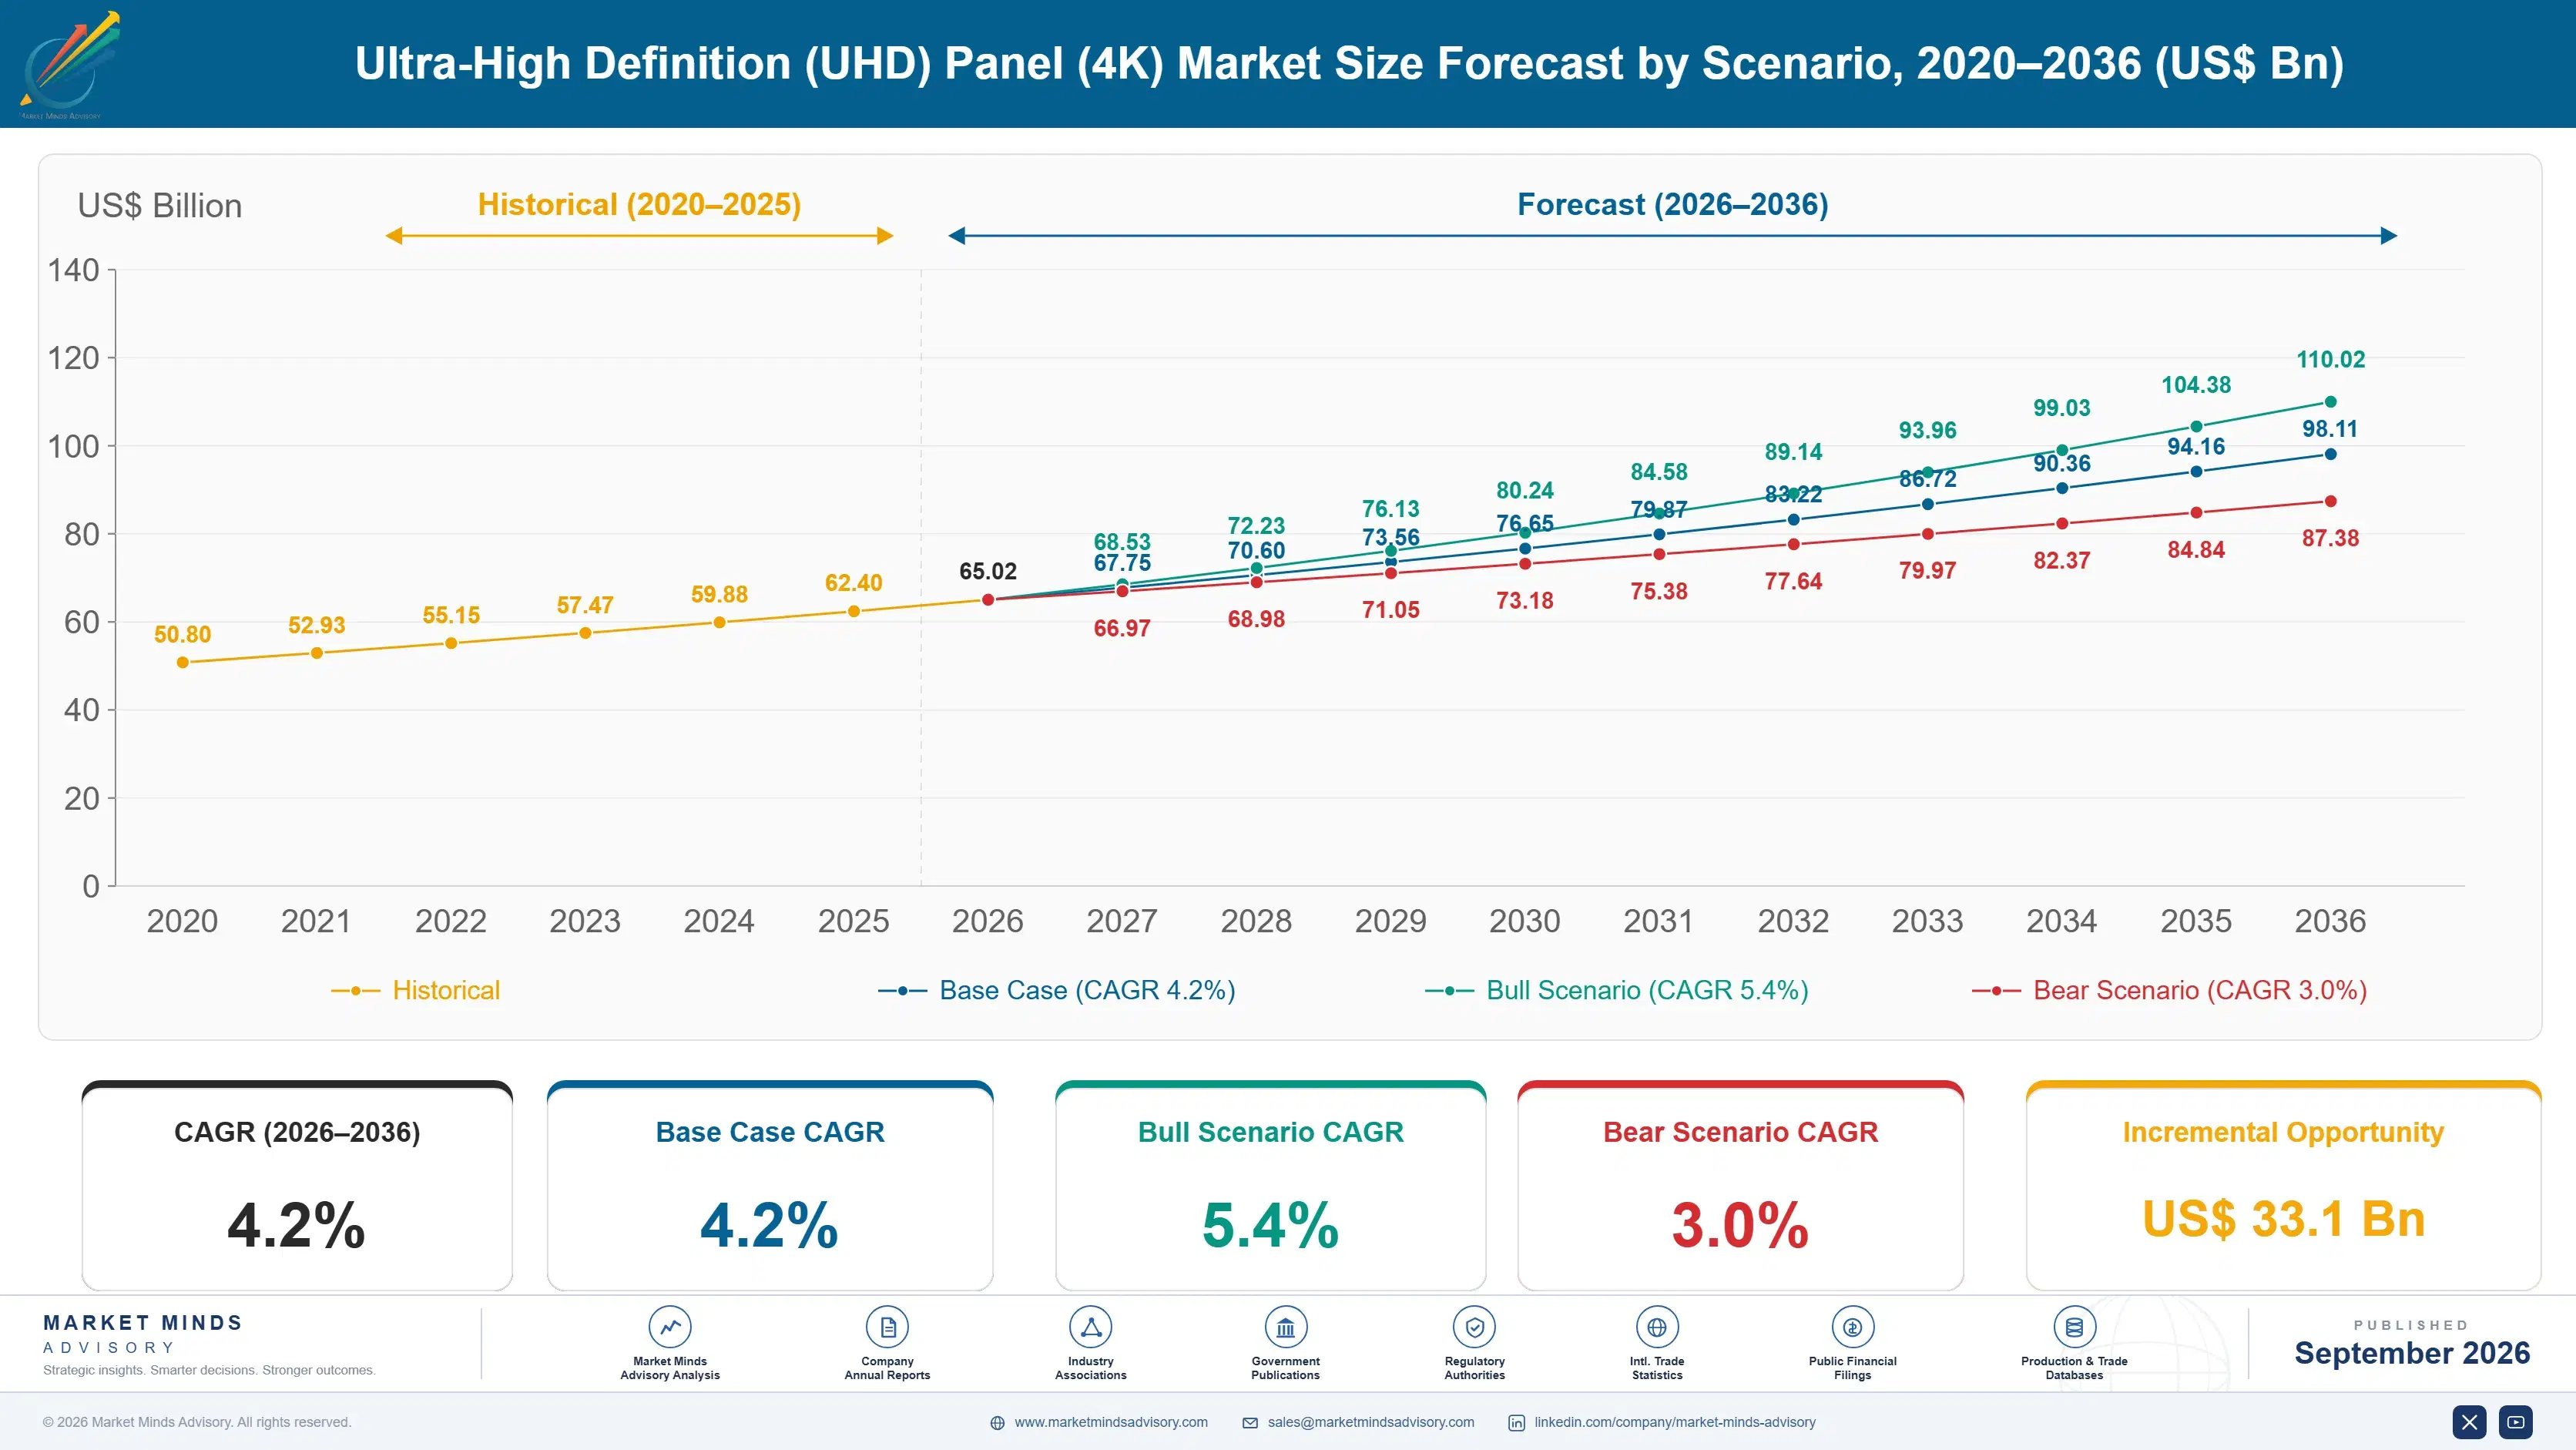
The market reaches USD 65.02 billion in 2026 and USD 98.11 billion by 2036, a 1.51 times expansion at 4.2%. MicroLED modular panels grow at 6.3%, half again the market rate of 4.2%, from a base so small the percentage flatters it. East Asia holds 52% of shipments by set assembly destination, and India grows fastest at 8.4% on domestic television manufacturing. Units are flat and only mix is moving.
Five manufacturers hold 78% of panel and module shipment revenue, among the highest concentration in any electronics component category and a direct result of capital intensity nobody else can meet. BOE and TCL China Star dominate large LCD. LG Display and Samsung Display hold the OLED positions. Chinese state-supported capacity moved production out of Korea, Japan and Taiwan almost entirely. That relocation took barely fifteen years.
Market Definition
This report covers ultra high definition display panels at four thousand horizontal pixels and above, measured as panel and module shipments: microLED modular panels, mini-LED backlit liquid crystal panels, organic light emitting diode panels, quantum dot film enhanced panels, standard light emitting diode backlit panels, and open cell panel supply. It excludes finished television and monitor sets, display driver integrated circuits, glass substrate and materials manufacture, projection systems, and lower resolution panels of any construction.
Base Year Value
$62.4B in 2025 (MMA Primary Research Dataset, September 2026)
Forecast Period
2026 to 2036, eleven discrete annual values
CAGR
4.2% base case. Bull 5.4%. Bear 3.0%.
Fastest Growth Segment
MicroLED Modular Panels: 6.3% CAGR
Fastest Growth Country
India: 8.4% CAGR
Fastest Growth Region
South Asia and Pacific: 6.4% CAGR
Largest Region
East Asia: 52% of 2025 global value
Market Leaders
BOE Technology, TCL China Star, LG Display, Samsung Display and HKC lead on ultra high definition panel and module shipment revenue. Source: MMA Analysis.
Primary Survey
n=3,800 procurement and R&D decision-makers, Q4 2025, six countries
Methodology
Demand-side build-up, cross-validated against public data, 47 expert interviews

Ultra-High Definition (UHD) Panel (4K) Market Forecast Scenarios

ultra-high-definition-uhd-panel-4k-market-size-forecast-scenario-1789987058747
Between 2020 and 2025 the category compounded at 3.2% through a violent cycle nobody enjoyed. Pandemic demand pulled purchases forward and prices rose briefly for the first time in years, then collapsed harder than they rose as that demand disappeared and the capacity built for it arrived. Korean and Japanese producers exited large panel manufacturing during the correction and have not returned.
The base case holds 4.2% on three mechanisms, none of them unit growth. Average shipped diagonal keeps rising, and a larger panel consumes more glass area at the same price per square metre, growing revenue without selling another set. Premium construction is taking mix share, with mini-LED and OLED commanding price premiums standard panels never will. And Indian domestic television manufacturing is expanding on production incentives, which adds genuine unit demand from a small base.
The bull case at 5.4% assumes microLED manufacturing yield improves enough to reach consumer price points, which would create a genuinely new premium tier rather than another increment. The bear case at 3.0% is more Chinese capacity arriving on schedules set by provincial policy rather than by demand, which is exactly what happened through the last two cycles and could happen again.

A Fab You Cannot Turn Off

The economics of this industry are set by one physical fact. A latest generation fabrication plant costs around USD 7 billion, takes three years to build and runs at a fixed cost regardless of output rate. Idling it destroys more value than selling below cost does. So everybody runs everything, supply exceeds demand in most years, and prices fall about 6% annually as a matter of course.
TOP FIVE CONCENTRATION78%Among the highest in any electronics component category
FAB CAPITAL COSTUSD 7 billionInvestment required for a single latest generation facility
PANEL PRICE DECLINE6%Average annual fall in price per shipped square metre
CAPACITY UTILISATION RATE82%Industry loading across the largest fabrication lines globally
AVERAGE PANEL DIAGONAL58 inchesShipped size across the whole ultra high definition category
GLASS SUBSTRATE COST SHARE17%Share of finished panel cost before module assembly
Capital intensity at that level decides geography as well as pricing. Chinese provincial governments funded fab construction on employment and industrial policy grounds rather than on returns, and Korean, Japanese and Taiwanese producers could not compete against capital priced that way. Large panel manufacturing left those countries inside about fifteen years, which is remarkably fast for an industry this heavy. Concentration now runs at 78% across five manufacturers.
Growth comes from mix and from size rather than from units. People replace a television every seven to ten years and that has not changed, so the unit market is broadly flat. What moves is average diagonal, now around 58 inches, and the share of shipments carrying mini-LED backlighting or OLED construction that commands a premium a standard panel never will. Everything else deflates.
"This industry has produced remarkable engineering and very little cumulative profit, and both facts have the same cause. When your asset cannot be idled and your competitor's capital came from a provincial government, price is not something anybody controls."
Director, Display Technologies and Electronic Components Practice · MMA Technology Practice · September 2026

Market Trends

Average Diagonal Rises While Unit Volume Stays Flat

The number of televisions sold each year has barely moved in a decade, because replacement cycles run seven to ten years and household counts grow slowly. What has moved is size: average shipped diagonal now sits around 58 inches and keeps climbing a little every year. That matters commercially because a panel is priced by glass area, so a larger screen consumes more of a fab's output and generates more revenue without anybody selling an additional set. Growth in this market is almost entirely an area story rather than a unit one.
Market Impact: India compounds at 8.4% annually

Premium Construction Is Where Any Margin Remains

Standard light emitting diode backlit panels are a commodity in the fullest sense, differentiated by nothing a consumer can see and priced accordingly at declining rates every year. Mini-LED backlighting and organic light emitting diode construction both command real premiums, because the contrast difference is visible on a shop floor without anybody explaining it. That is the only defensible position in this industry and every manufacturer knows it, which is why capacity keeps shifting toward premium lines even where the volumes remain modest. Standard panels grow at 1.4% and everything else grows faster.
Market Impact: Displays run 24 hours daily

Market Opportunities and Growth Drivers

Indian Television Manufacturing Adds Genuine Unit Demand

Almost nowhere in this market produces unit growth any more, and India is the exception. Production linked incentives have drawn television assembly into India at scale, domestic ownership rates remain well below saturation, and ultra high definition penetration in new purchases is rising quickly from a low level. India grows at 8.4%, faster than any other country in this market. Panel makers who established module supply relationships with Indian assemblers early are taking that volume, and the ones who treated India as a distant export market are discovering how much local presence matters.
Market Impact: Utilisation must exceed 82%

Commercial Signage Buys On Different Terms Entirely

A consumer buying a television compares price on a shop floor and a facilities manager specifying signage compares total cost across a five year deployment, which changes what each will pay for. Commercial displays run continuously rather than a few hours daily, so brightness retention, thermal design and warranty terms matter far more than the panel price. That supports margins consumer channels cannot, and it is why modular LED and microLED construction found its first real market in signage rather than in living rooms. The volumes are small and the economics are considerably better.
Market Impact: Replacement runs 7 to 10 years

Market Restraints and Challenges

Fabs Cannot Be Idled Without Destroying More Value

A latest generation plant costs around USD 7 billion and carries fixed depreciation, cleanroom operation and staffing costs that continue whether the line runs or not. The root cause is physical: a fabrication line cannot be stopped and restarted cheaply, and utilisation below roughly 82% moves unit cost sharply upward. Commercially this means producers keep shipping below cash cost during downturns rather than cutting output, which is why prices fall about 6% a year on average. Mitigation runs through premium mix, since a differentiated panel escapes commodity pricing while occupying the same line.
Market Impact: Average diagonal reaches 58 inches

Unit Demand Has Not Grown For A Decade

Television unit shipments have been broadly flat for years, because replacement cycles run seven to ten years and the developed world already owns the sets it needs. The root cause is saturation rather than economics: an additional television per household adds little that anybody wants, and screen sizes have approached the limit of what an ordinary living room accommodates. Commercially this caps volume growth permanently and forces every producer to compete for a fixed pie. Mitigation runs through average diagonal, premium mix and the Indian market, which is the only genuine unit expansion available.
Market Impact: Standard panels grow at 1.4%
3 additional market trends, 4 additional growth drivers, and 2 additional restraints and challenges are covered in the full report. Contact sales@marketmindsadvisory.com to access the complete intelligence.

Segment CAGR and Growth Architecture

Segmentation follows panel construction, since how a panel produces light determines what it costs to make and whether it escapes commodity pricing. Six classes cover the market: microLED modular panels, mini-LED backlit liquid crystal panels, organic light emitting diode panels, quantum dot film enhanced panels, standard backlit panels, and open cell supply. End application and shipment channel are separate dimensions.
ultra-high-definition-uhd-panel-4k-market-market-share-analysis-1789987059317

MicroLED Modular Panels

MicroLED modular panels grow at 6.3%, half again the market rate of 4.2%, from a base small enough that the percentage flatters the reality considerably. Each pixel is a discrete emitter, which removes the backlight entirely and produces contrast and brightness nothing else matches. The obstacle is manufacturing yield: placing millions of microscopic emitters without defects is a transfer problem nobody has solved at consumer cost, so the technology found its first real market in commercial signage where modular assembly is normal and the price tolerance is far higher. Whether it reaches living rooms depends on a yield improvement that has been five years away for a decade. Nobody in the industry says that publicly.
CAGR 6.3%

Mini-LED Backlit LCD Panels

Mini-LED backlit panels grow at 5.6% and are the most commercially sensible thing happening in this industry. Replacing a handful of edge-lit zones with thousands of individually dimmed backlight zones produces most of the contrast benefit of organic light emitting diode construction at a fraction of the manufacturing difficulty, on lines that already exist. The difference is visible on a shop floor without a salesperson explaining it, which is the only kind of differentiation that survives consumer purchasing. Chinese manufacturers moved into this aggressively because it lets a commodity fab produce a premium product without rebuilding anything at all. That combination is genuinely rare in any manufacturing industry anywhere at all.
CAGR 5.6%
Full segment breakdown across 6 segments available in the complete report.

Regional Architecture and Country Demand Map

East Asia leads at 52% of shipments measured by set assembly destination, far above the standard band, since most televisions are still built where the panels are made. Eastern Europe and South Asia and Pacific both sit above their bands on assembly relocation into Poland, Vietnam and India.

East Asia

East Asia holds 52% of shipments by assembly destination, far above the 30% band ceiling, and panel manufacturing concentration explains most of it. Chinese fabrication capacity produces the great majority of large panels anywhere, Korean lines produce most organic light emitting diode panels, and Taiwanese producers hold specialist positions in monitors and commercial displays. Set assembly stayed close to that capacity for logistics reasons that only recently began to change. Provincial industrial policy rather than commercial return funded the Chinese build-out, which is why nobody else could match it. Growth at 5.0% sits above the global rate on premium mix rather than on any volume expansion. Nothing about that concentration is likely to reverse.
Share: 52% | CAGR: 5.0% (2026 to 2036)

South Asia and Pacific

At 16% South Asia and Pacific sits well above the 12% band ceiling, and assembly relocation is the whole explanation. Vietnamese plants building sets for Korean and Japanese brands take substantial panel volume, and Indian television manufacturing under production linked incentives has grown faster than anything else in this market. India grows at 8.4%, faster than any other country here, on genuine unit expansion rather than on mix. Domestic ownership rates remain well below saturation and ultra high definition penetration in new purchases is climbing quickly. Panel makers with local module relationships are taking that volume and the others are not. This is the only genuine unit growth market left anywhere.
Share: 16% | CAGR: 6.4% (2026 to 2036)
Regional intelligence for 5 additional markets available in the complete report: North America, Western Europe, Latin America, Middle East and Africa, Eastern Europe. Contact sales@marketmindsadvisory.com.
ultra-high-definition-uhd-panel-4k-market-country-cagr-analysis-1789987059858

Escaping A Deflationary Commodity Business

Prices fall about 6% a year and nobody controls that, because a fab nobody can idle keeps producing whatever the line makes. The only escapes are premium construction that commands a real price, applications where the buyer is not comparing on a shop floor, and the one market still growing in units. The levers below cover those.

Convert Commodity Lines To Mini-LED Backlighting

Standard backlit panels grow at 1.4% and carry no differentiation any consumer can see. Mini-LED backlighting delivers most of the contrast benefit of organic light emitting diode construction at a fraction of the manufacturing difficulty, and it runs on the same fabrication lines already installed and depreciating. The difference is visible on a shop floor without a salesperson explaining it, which is the only differentiation that survives consumer purchasing at all. Mini-LED panels compound at 5.6% against 4.2% for the market. The conversion cost is backlight assembly rather than a new fab.
Market Impact: Mini-LED compounds at 5.6% against 1.4% for standard

Sell Into Commercial Rather Than Consumer Channels

A consumer compares price on a shop floor in about four seconds and a facilities manager specifying signage compares total cost across a 5 year deployment. Commercial displays run around the clock rather than a few hours daily, so brightness retention, thermal design and warranty terms decide the purchase and price is one input among several. That supports margins the consumer channel cannot, which is exactly why modular and microLED construction found its first real market in signage. The volumes are far smaller and the economics are considerably better. Most panel makers still chase the volume instead.
Market Impact: Commercial displays run all 24 hours a day

Build Module Relationships Inside The Indian Market

India is the only country in this market producing genuine unit growth rather than mix improvement, compounding at 8.4% against 4.2% globally on production incentives, low ownership saturation and rising ultra high definition penetration in new purchases. Assembly is happening locally under policy that makes imported finished sets uneconomic, so the panel arrives as a component and the relationship that matters is with an Indian module and set assembler. Panel makers who established those relationships early are taking the volume. Treating India as a distant export destination has cost several producers years.
Market Impact: India alone compounds at 8.4% against 4.2% globally

Protect Utilisation Before Ever Protecting Price

A latest generation fab costs around USD 7 billion and its fixed cost continues whether the line runs or not, so unit cost rises sharply below roughly 82% utilisation. That makes loading the line the first priority and price the second, which is uncomfortable to admit and is what every producer actually does. The commercial discipline is to accept that pricing is not controllable and to compete on what is: mix, yield and utilisation. Producers who tried to hold price through a downturn lost share and did not hold price anyway. That lesson has been learned repeatedly.
Market Impact: Unit cost rises sharply below the 82% utilisation mark

Who Controls the Margin Pool

Five manufacturers hold 78% of panel and module shipment revenue, among the highest concentration in any electronics component category and a direct consequence of capital intensity almost nobody can meet. BOE Technology and TCL China Star dominate large liquid crystal panel output. LG Display and Samsung Display hold the organic light emitting diode positions. HKC competes on volume and cost. All participants are assessed on panel and module shipment revenue.
Competition runs on cost position and utilisation rather than on any product difference, because the products are broadly identical at the same specification. What separates producers is fab generation, yield, depreciation status and access to capital priced below commercial rates. Chinese producers hold advantages on all four, which is why Korean, Japanese and Taiwanese large panel manufacturing effectively ended inside fifteen years.

Rankings shift with capacity announcements rather than with product cycles. A new Chinese fab reaching volume production moves pricing for everybody and nothing a competitor does prevents it. The other variable is premium mix: whoever holds the organic light emitting diode and mini-LED positions escapes commodity pricing on a growing share of shipments, which is the only defensible ground left in this industry.
ultra-high-definition-uhd-panel-4k-market-company-positioning-matrix-1789987060392

Competitive Moat and Risk Dimensions

BOE TECHNOLOGY

Moat: Capacity Scale And Capital

BOE operates more large panel fabrication capacity than anybody, built with provincial government support that priced capital far below what a commercial competitor could obtain. In an industry where utilisation and depreciation status decide cost position, that combination is close to unassailable. Nothing about it is a technical advantage and all of it is a durable commercial one.
BOE TECHNOLOGY

Risk: Commodity Exposure Concentration

Scale in a deflationary commodity means scale in a business where prices fall about 6% a year and the largest producer absorbs the largest absolute loss when they do. The premium organic light emitting diode positions sit with Korean competitors, and mini-LED is being competed away quickly. Volume leadership in a falling market is a difficult place to stand.
LG DISPLAY

Moat: Large OLED Manufacturing Position

LG Display holds effectively the only volume manufacturing capability for large organic light emitting diode panels, built over more than a decade of process development that competitors repeatedly attempted and abandoned. That is a genuine technical position rather than a capital one, and it escapes the commodity pricing that governs everything else in this industry. Almost nothing here is defensible.
LG DISPLAY

Risk: Mini-LED Erodes The Premium

Mini-LED backlighting delivers most of the visible contrast benefit at a fraction of the manufacturing difficulty, on liquid crystal lines that already exist and are already depreciated. A consumer on a shop floor cannot reliably tell the difference, which is the comparison that decides the purchase. A technical advantage nobody can see is worth less than it should be.

Players Tracked

Prominent Players

BOE Technology
TCL China Star
LG Display
Samsung Display
HKC

Other Key Players

AUO
Innolux
Tianma Microelectronics
Sharp
Japan Display
Visionox
Foxconn Technology Group
Compal Electronics
TPV Technology
Amtran Technology
BOE Varitronix
Leyard Optoelectronic
Unilumin
Absen
Barco

Recent Developments

APRIL 2025

BOE Extends Mini-LED Backlight Capacity Across Existing Lines

BOE Technology extended mini-LED backlight assembly capacity across existing liquid crystal fabrication lines, an organic capital investment rather than an acquisition. The approach converts commodity output into a product commanding a visible price premium without building a new fab, which is the most economical differentiation available in this industry.
Signal: Escaping commodity pricing without new capital is the most valuable trick anybody in this industry has found.
OCTOBER 2024

Samsung Display Expands MicroLED Output For Commercial Installations

Samsung Display expanded microLED module production aimed at commercial installation and signage rather than consumer television, an organic manufacturing expansion rather than any transaction. Commercial buyers tolerate the price that current manufacturing yield requires, which consumer channels do not, so the technology is finding its first sustainable market there.
Signal: New display technology reaches commercial buyers years before it ever reaches any living room at all.
JUNE 2025

HKC Commissions Additional Panel Capacity On Provincial Support

HKC commissioned additional large panel fabrication capacity supported by provincial industrial funding, an organic capital investment rather than a partnership or acquisition. Capacity arriving on schedules set by policy rather than by demand is the mechanism that has driven pricing downward across this industry through two successive cycles.
Signal: Capacity built on policy timing rather than demand timing is exactly why prices never stop falling.

What A Panel Costs To Make

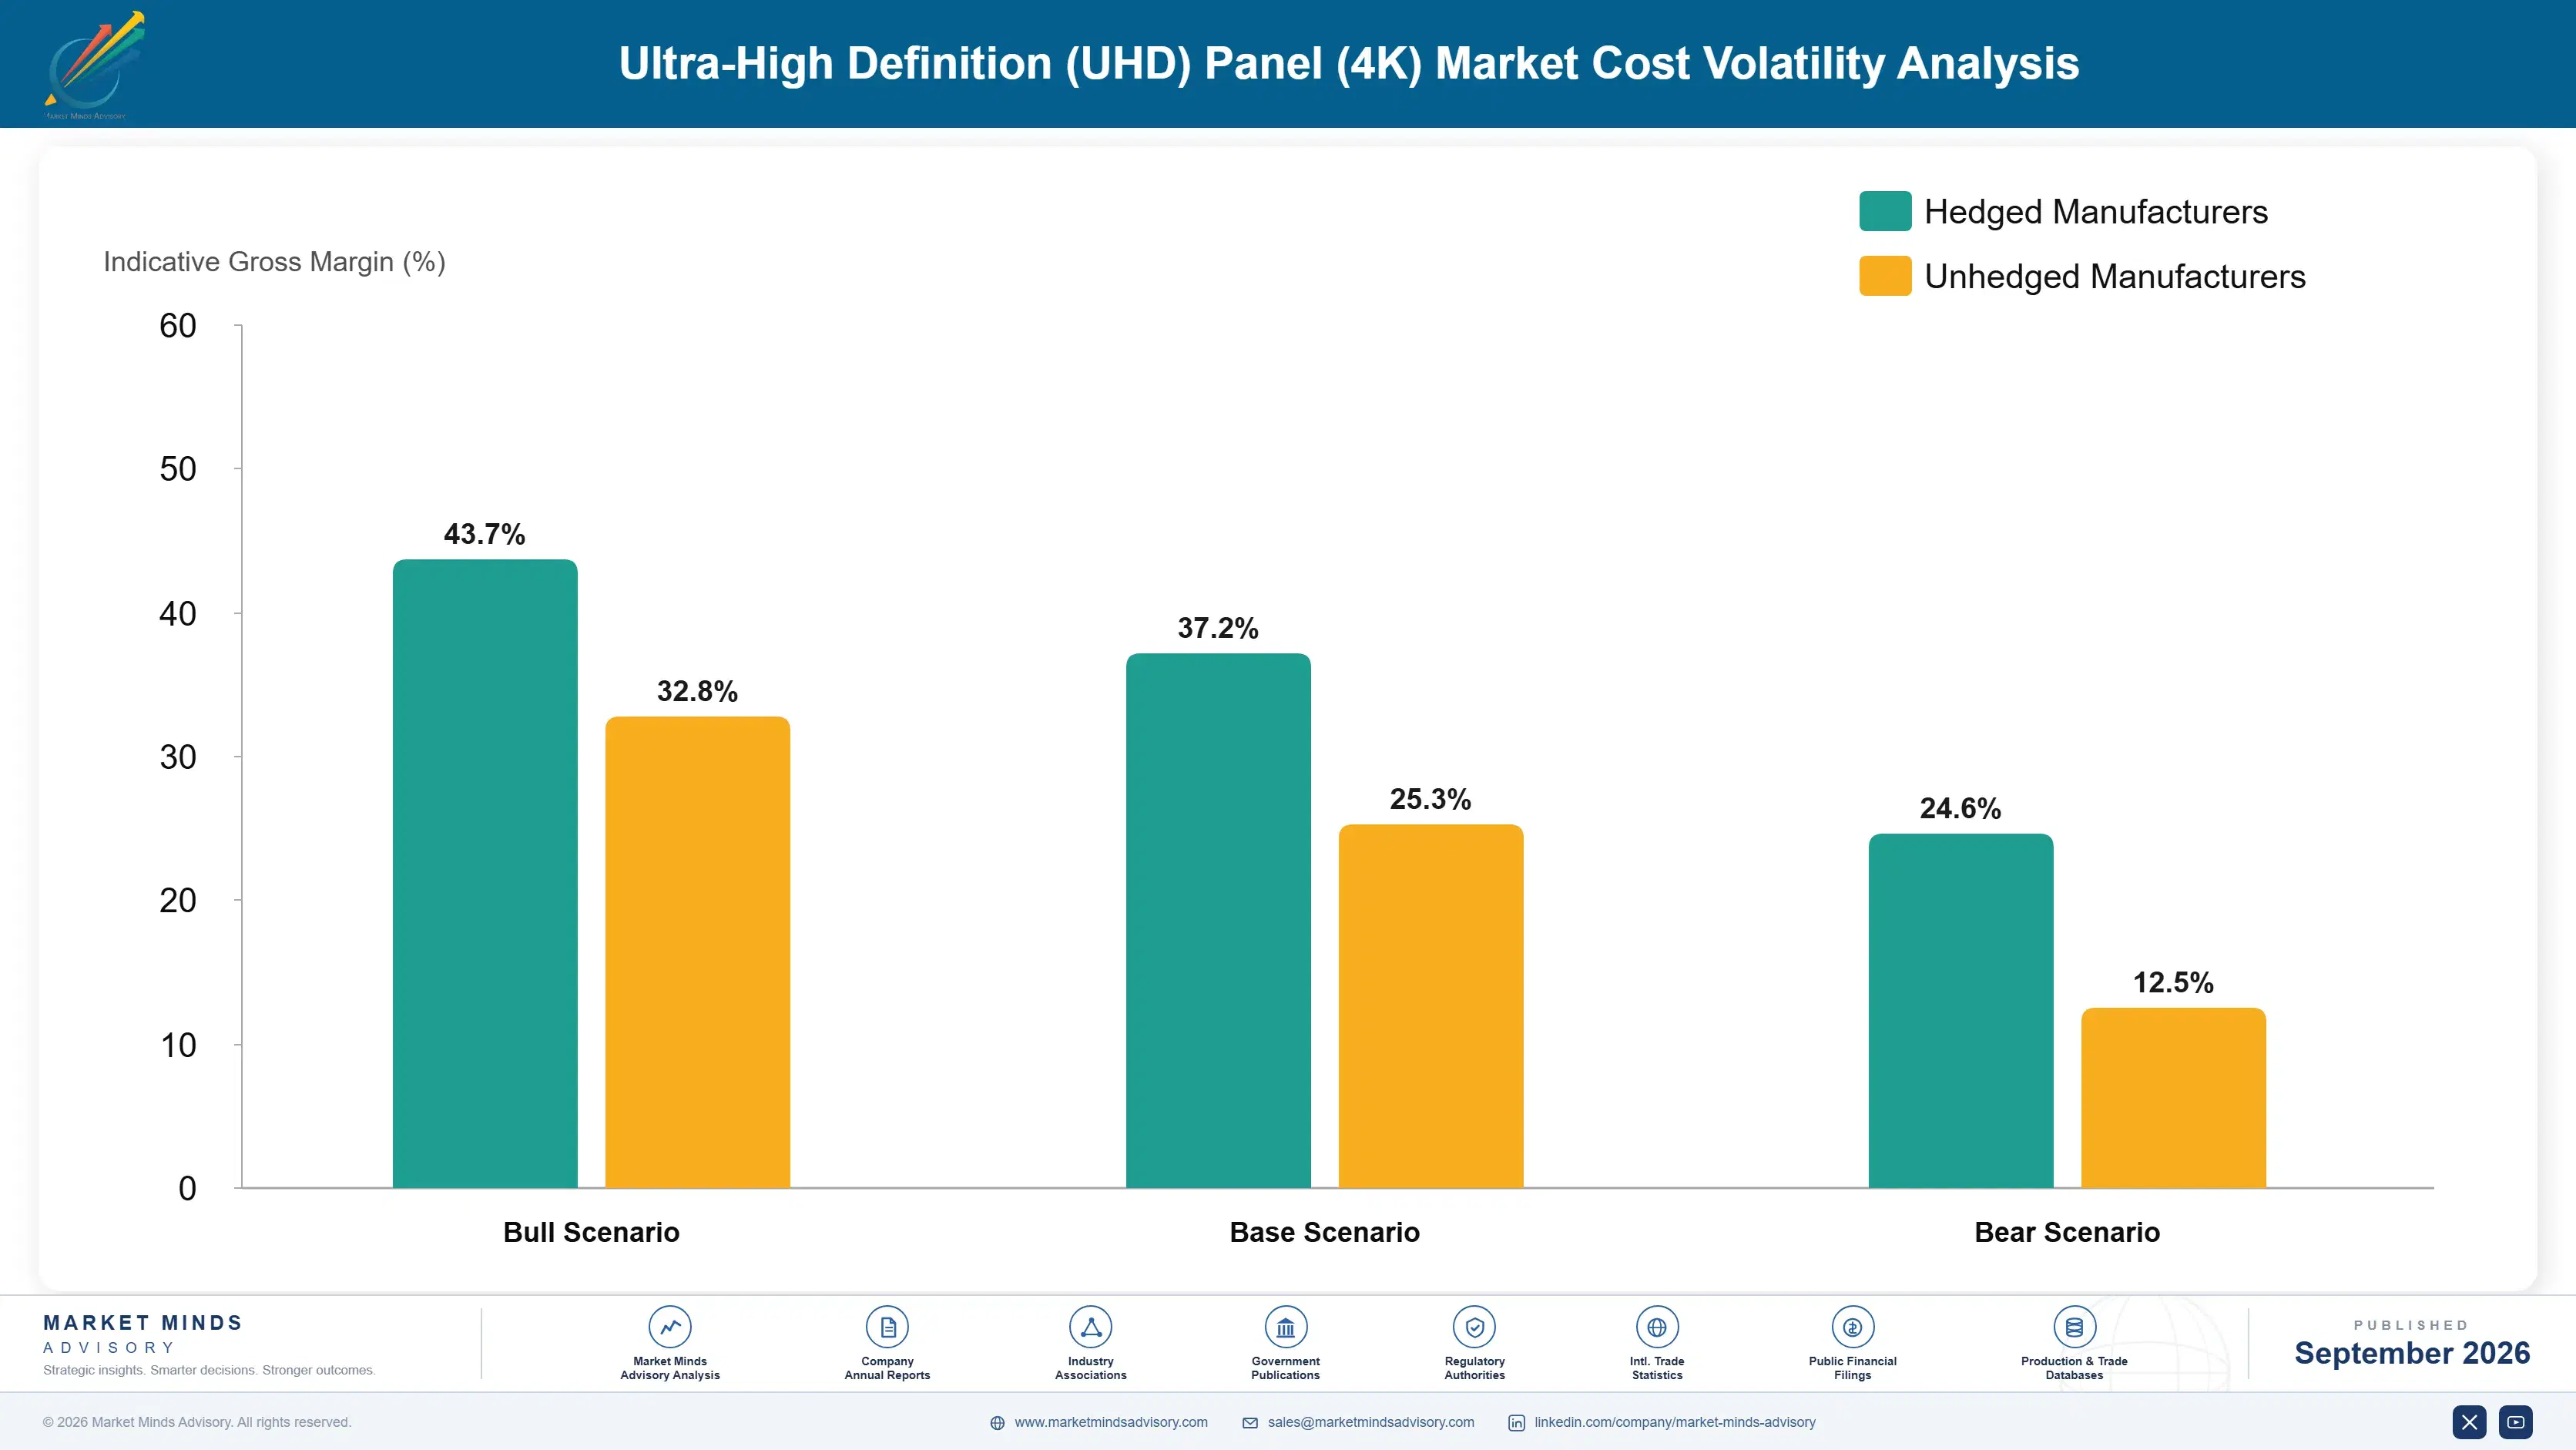
Fab depreciation accounts for roughly 34% of panel cost, which is what a USD 7 billion asset written down over a decade produces. Glass substrate contributes about 17%, from a supplier group narrow enough to count on one hand. Backlight units and driver components add around 21%, with cleanroom energy, labour and materials taking the balance.
BOE Technology Annual Report 2024 records depreciation and capacity utilisation as the dominant determinants of unit cost across its display operations. LG Display Annual Report 2024 describes comparable dynamics with heavier organic light emitting diode process weighting. Cleanroom energy costs rose materially across Chinese and Korean production through 2022 and 2023, and producers absorbed the increase entirely because panel pricing is set by supply conditions rather than by any cost position.

The competitive disadvantage mechanism is depreciation status rather than any input price. A fab written down over ten years carries a cost per square metre that a newly commissioned one cannot approach for most of a decade, which is why the industry's cost curve tracks build dates rather than technology. Producers with older fully depreciated capacity survive downturns that bankrupt anybody who built recently. Timing matters most.
ultra-high-definition-uhd-panel-4k-market-cost-volatility-analysis-1789987060589

Protect Utilisation Above Every Other Operating Metric

Fab depreciation runs about 34% of panel cost and continues whether the line produces or not, so unit cost rises sharply below roughly 82% loading. Every producer knows this and several still cut output during downturns hoping to support price, which has never worked because a competitor simply fills the gap. Load the line and compete on mix instead.

Contract Glass Substrate Supply On Long Terms

Glass substrate runs about 17% of panel cost from a supplier group narrow enough to count on one hand, which gives those suppliers pricing power that panel makers cannot answer individually. Long-term volume agreements with committed quantities secure both price and allocation during the periods when everybody wants glass at once. The commitment risk is smaller than the exposure.

Add Backlight Assembly Rather Than New Fabrication

Backlight units and driver components run around 21% of panel cost and mini-LED conversion happens in that stage rather than in the fab itself. Adding backlight assembly capacity to existing depreciated lines produces a premium product without the USD 7 billion any new fabrication plant requires. The constraint is backlight component supply rather than capital, which is an easier problem.

Portfolio Architecture for Margin Defence

Margin architecture separates on whether a consumer can see the difference. Open cell supply and standard backlit panels earn least, sold as pure commodity where price per square metre is the only variable. Quantum dot panels sit in the middle on a modest improvement. Mini-LED, organic light emitting diode and microLED construction earn most, because each produces a contrast difference visible on a shop floor without anybody explaining it.
The volume versus premium tension is a line allocation problem. The same fab can produce commodity panels at high volume or premium construction at lower throughput, and the premium product occupies capacity that would otherwise be filled cheaply. Below roughly 82% utilisation the arithmetic punishes any producer who allocates too much line time to a small premium segment, which is why the mix shift runs slower than anybody plans.

High-value pools sit in organic light emitting diode construction and in commercial microLED, and neither is reachable by capital alone. Organic light emitting diode manufacturing took more than a decade of process development that several well-funded competitors abandoned. MicroLED depends on a transfer yield problem nobody has solved at consumer cost. Both are technical positions in an industry decided by cheaper capital.

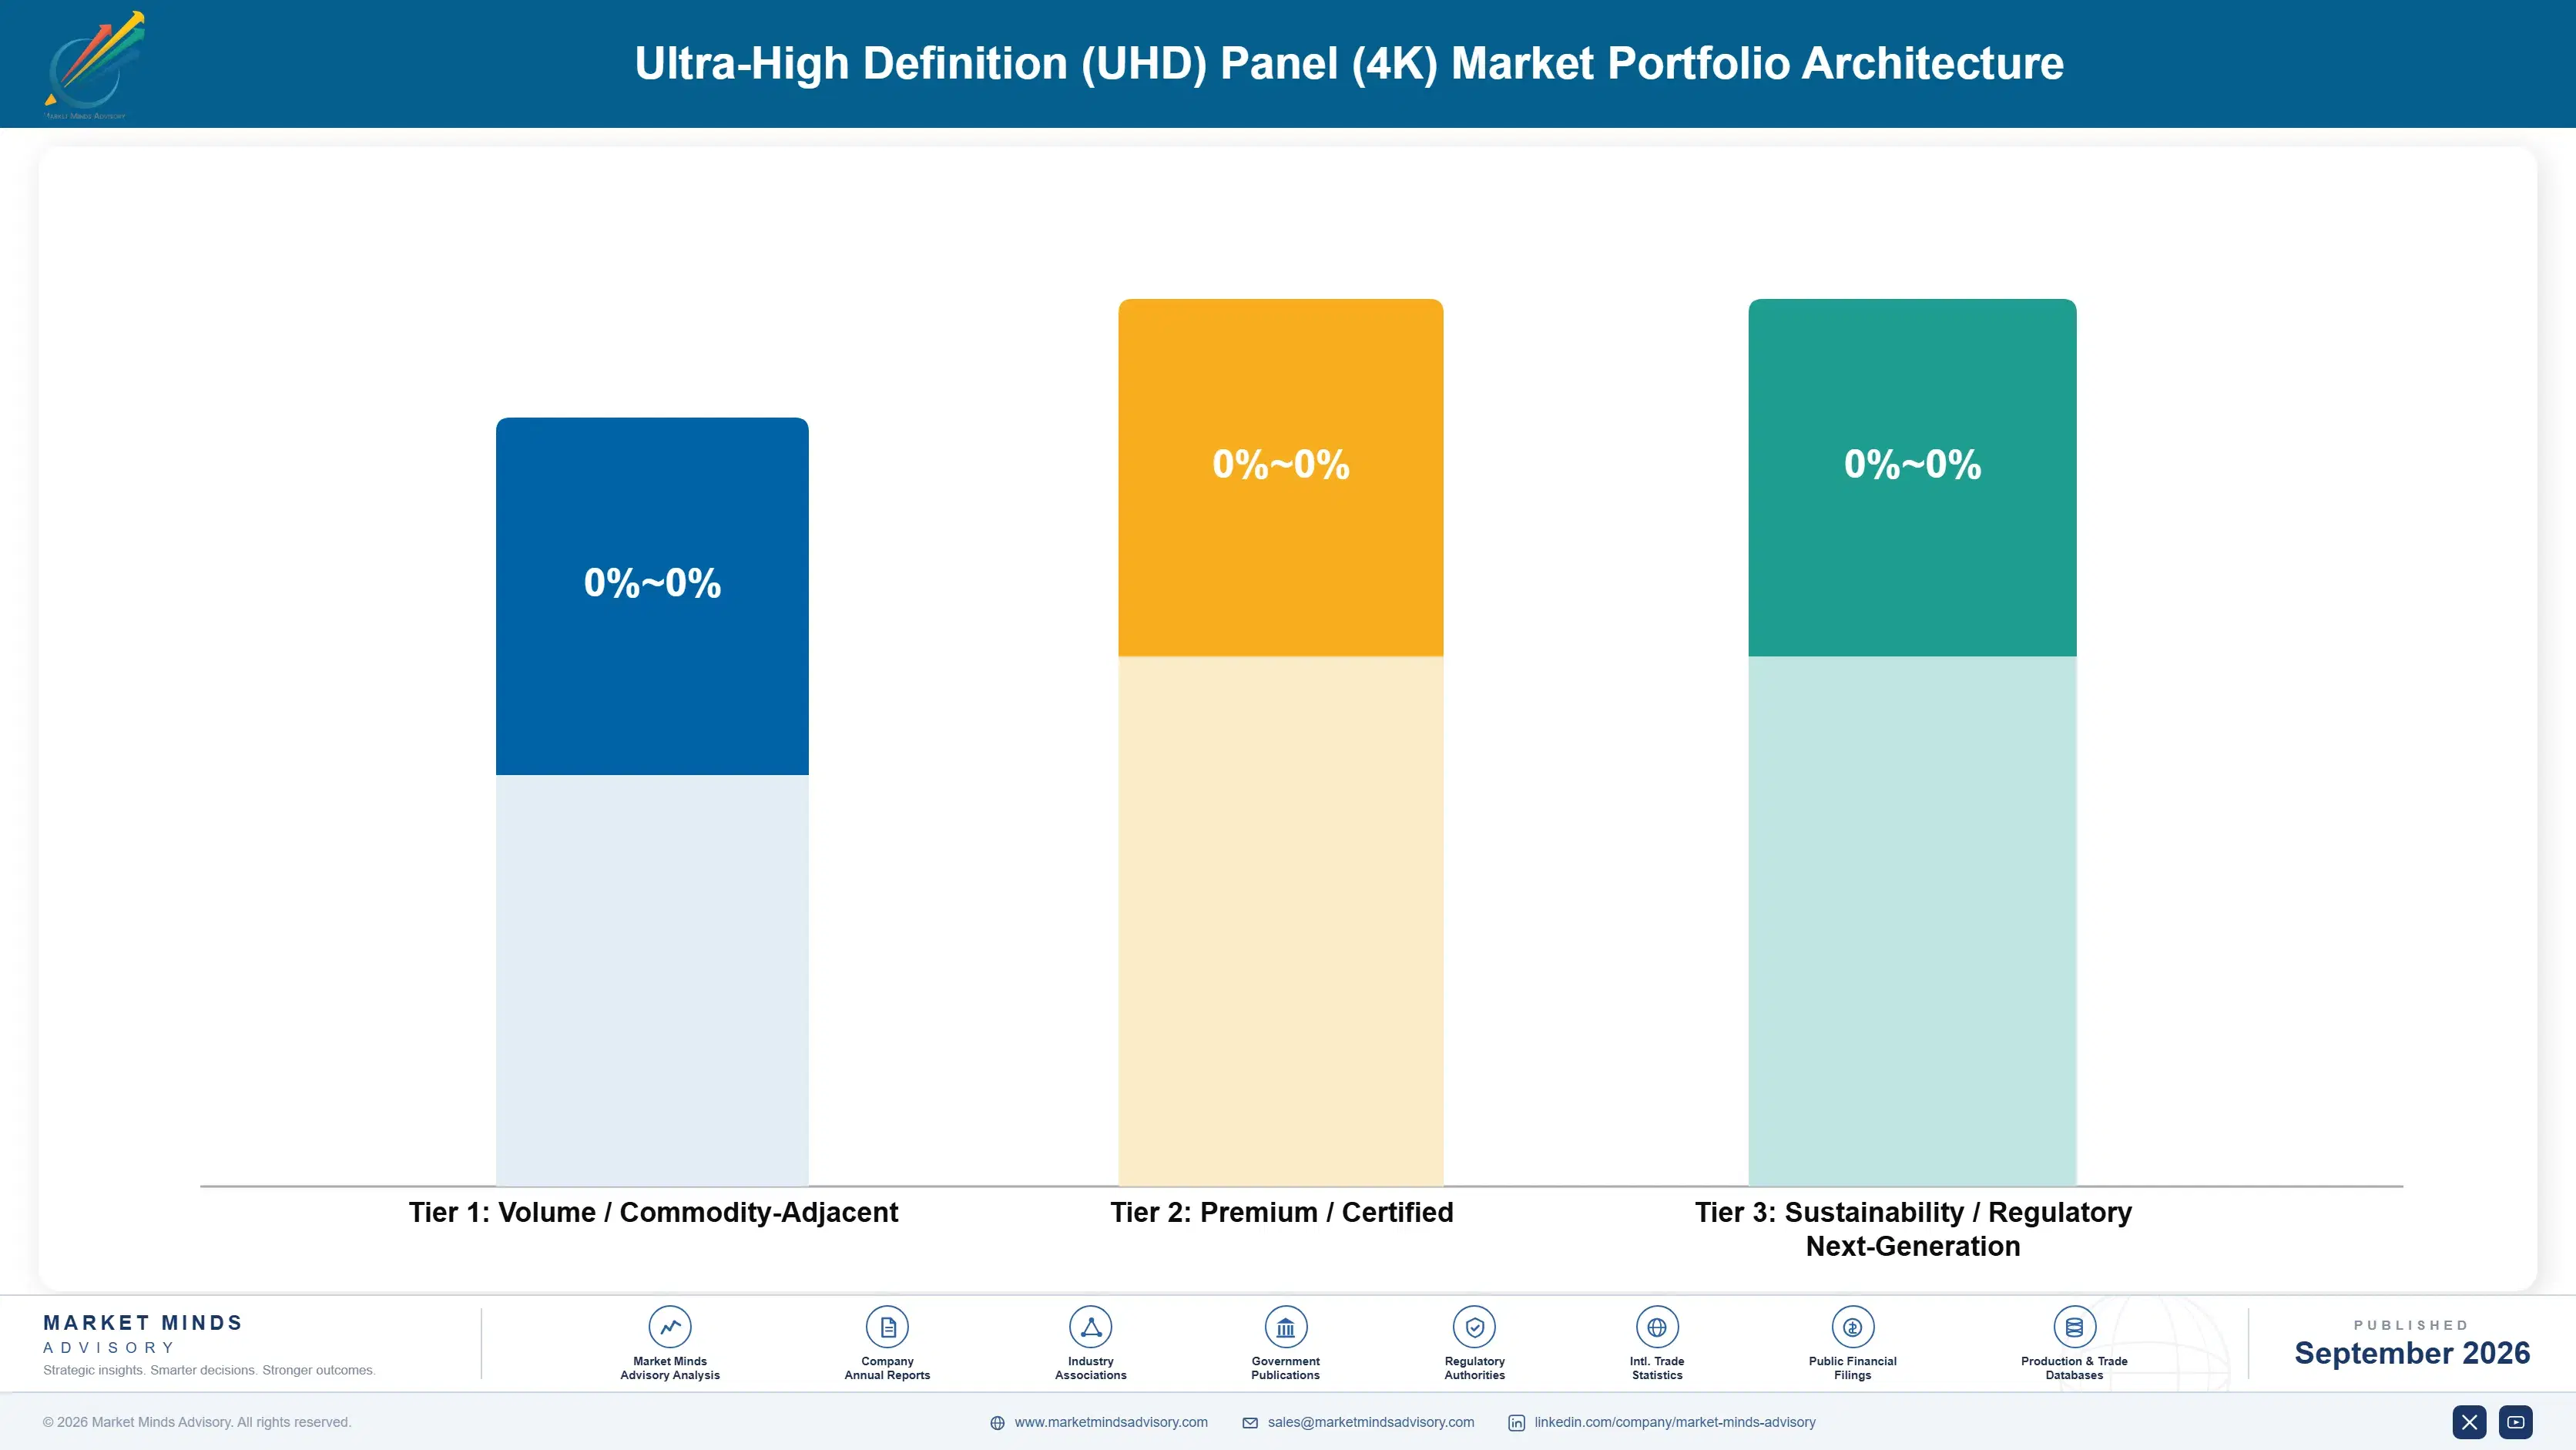
Volume / Commodity-Adjacent

Open cell supply and standard backlit panels sold as pure commodity where price per square metre is the only variable anybody compares. The eight point spread separates producers with fully depreciated fabs from those still writing down recent capacity.
Gross Margin: 4% to 12%

Premium / Certified

Quantum dot film enhanced and mini-LED backlit panels sold on a contrast improvement a consumer can see without anybody explaining it. The ten point spread tracks backlight assembly capacity and component supply position rather than fabrication capability.
Gross Margin: 16% to 26%

Sustainability / Regulatory / Next-Generation

Organic light emitting diode panels and microLED modular construction, where manufacturing capability rather than capital access limits the supplier list. The twelve point spread reflects how differently each producer amortised more than a decade of process development.
Gross Margin: 28% to 40%
ultra-high-definition-uhd-panel-4k-market-portfolio-architecture-1789987061097

High-value Sub-segments and Strategic Watch-out

MicroLED Modular Panels

Grows at 6.3% from a base small enough that the percentage flatters it considerably, on a transfer yield problem nobody has solved at consumer cost. The twelve point spread reflects process development amortisation. Commercial signage tolerates the price that consumer channels will not accept at all.
Gross Margin: 28% to 40%

Mini-LED Backlit LCD Panels

Grows at 5.6% and is the most commercially sensible thing in this industry, delivering visible contrast improvement on fabrication lines that already exist and are depreciated. The ten point spread reflects backlight assembly capacity. It escapes commodity pricing without any new fab investment at all.
Gross Margin: 16% to 26%

OLED UHD Panels

Grows at 4.8% and holds the strongest technical position in this industry, built over a decade of process development competitors repeatedly abandoned. The twelve point spread reflects yield maturity. Mini-LED is eroding the visible premium faster than the manufacturing advantage is eroding, which is the problem.
Gross Margin: 28% to 40%

Standard LED-Backlit LCD Panels

Grows at 1.4%, by far the slowest here, because nothing differentiates one from another and prices fall about 6% every year regardless of demand. The eight point spread reflects fab depreciation status alone. Producers keep making them because a fab cannot be idled economically at all.
Gross Margin: 4% to 12%

How Panel Volume Gets Committed

The annuity is the set maker relationship rather than any individual order. A television brand qualifies a panel supplier on colour consistency, defect rates and delivery reliability, then buys across model years because requalifying costs engineering time nobody will spend. That produces stable share despite a commodity product, which is why displacing an incumbent panel supplier takes a genuine failure rather than a better price.
Adoption depth varies by channel rather than by geography. Premium television brands adopt new construction first because they need something to advertise. Volume brands adopt eighteen months later when the price gap narrows. Commercial display integrators adopt on total cost across a deployment and will pay for brightness retention. Monitor makers adopt slowest of all, because a monitor buyer compares specifications rather than looking at a picture.

The deciding buyer sits further from the consumer than most people assume. A panel maker sells to a set assembler who sells to a brand who sells to a retailer, and the specification decision is usually taken by a brand engineer optimising cost against a price point. That person compares panel quotes, not pictures, which is why visible differentiation matters less than the industry hopes.
ultra-high-definition-uhd-panel-4k-market-end-use-penetration-index-1789987061590

Where Any Margin Actually Survives

These are among the four positions where our research anticipates prominent divergence between winners and laggards over the coming forecast period. Each is grounded in the demand model, the regulatory perimeter, and the announced capacity pipeline.
01 / PREMIUM MIX CONVERSION

Convert Existing Lines To Mini-LED Backlighting

Standard backlit panels grow at 1.4% and carry no differentiation any consumer can see, while prices across the category fall about 6% a year regardless of demand conditions. Mini-LED backlighting delivers most of the contrast benefit of organic light emitting diode construction at a fraction of the manufacturing difficulty, on fabrication lines that already exist and are already depreciated. The difference is visible on a shop floor without a salesperson explaining it, which is the only differentiation that survives consumer purchasing, and mini-LED compounds at 5.6% against 4.2% overall.
02 / UTILISATION DISCIPLINE PRIORITY

Load The Line Before Defending The Price

Fab depreciation runs about 34% of panel cost and continues whether the line produces or not, so unit cost rises sharply below roughly 82% loading. Producers who cut output during downturns hoping to support price have never succeeded, because a competitor simply fills the gap and the price falls anyway while the cutter carries idle capacity. The uncomfortable commercial discipline is to accept that pricing in this industry is not controllable by anybody and to compete instead on the things that are, meaning mix, yield and utilisation.
03 / COMMERCIAL CHANNEL PRIORITY

Sell Where Nobody Compares On A Shelf

A consumer compares price on a shop floor in seconds while a facilities manager specifying signage compares total cost across a five year deployment, which changes what each will pay. Commercial displays run all 24 hours a day rather than a few in the evening, so brightness retention, thermal design and warranty terms decide the purchase and price is one input among several. That supports margins the consumer channel cannot, which is exactly why modular and microLED construction found its first sustainable market in signage rather than anywhere else.
04 / INDIAN VOLUME POSITIONING

Build Module Relationships In India Now

India is the only country in this market producing genuine unit growth rather than mix improvement, compounding at 8.4% against 4.2% globally on production incentives and low ownership saturation. Assembly happens locally under policy that makes imported finished sets uneconomic, so the panel arrives as a component and the commercial relationship that matters is with an Indian module and set assembler. Panel makers who established those relationships early are taking the volume, and treating India as a distant export destination rather than a manufacturing base has cost several producers years.

Engagement Snapshot From the Field

A live engagement with an industry participant carrying material or product regulatory and market exposure ahead of a defining policy shift, showing how our research translates into a defensible multi-year portfolio strategy.
MARKET MINDS ADVISORY · CLIENT ENGAGEMENT SUMMARY
Ultra-High Definition (UHD) Panel (4K) Producer Strategic Portfolio Review and Transition Roadmap 2026·Investment Scenario on Ultra-High Definition (UHD) Panel (4K) Exposure Evaluation 2025-26
CLIENT PROFILE
A European television brand selling around four million sets annually across Western and Eastern European markets, assembling in Poland and sourcing panels from three Asian suppliers. Margin had compressed for four consecutive years as retail prices fell faster than panel costs, and the product team wanted to move the range toward mini-LED construction. Finance was not convinced the premium would hold at retail.
STRATEGIC CHALLENGE
The product team argued that visible contrast improvement would support a higher retail price and finance pointed at four years of evidence that every improvement had been competed away within two seasons. Neither had tested whether European retail buyers actually paid the premium or simply received a better panel at the same price. A range decision was due before the next model year.
MMA APPROACH
MMA tracked realised retail prices by construction type across four European markets over eight quarters, separating launch pricing from the price after the second markdown. We modelled panel cost by construction against those realised prices to establish where the premium actually persisted, and drew on 47 expert interviews conducted in Q4 2025 with retailers, panel suppliers and competing brand product managers.
KEY FINDINGS
  1. Mini-LED retail premium survived to the second markdown in 3 of the 4 markets, which finance had assumed happened in none of them (client-reported, unverified by MMA).
  2. The premium persisted at diagonals above 55 inches and disappeared entirely below them, which meant the range decision was about size rather than about construction.
  3. Two of the three panel suppliers quoted mini-LED at a cost premium roughly double the third, which nobody had compared because sourcing ran by supplier rather than by construction.
  4. Competing brands had moved mini-LED into their large diagonal ranges a full season earlier, which explained part of the margin compression finance had attributed to pricing.
CLIENT PROFILE
A European television brand selling around four million sets annually across Western and Eastern European markets, assembling in Poland and sourcing panels from three Asian suppliers. Margin had compressed for four consecutive years as retail prices fell faster than panel costs, and the product team wanted to move the range toward mini-LED construction. Finance was not convinced the premium would hold at retail.
STRATEGIC CHALLENGE
The product team argued that visible contrast improvement would support a higher retail price and finance pointed at four years of evidence that every improvement had been competed away within two seasons. Neither had tested whether European retail buyers actually paid the premium or simply received a better panel at the same price. A range decision was due before the next model year.
MMA APPROACH
MMA tracked realised retail prices by construction type across four European markets over eight quarters, separating launch pricing from the price after the second markdown. We modelled panel cost by construction against those realised prices to establish where the premium actually persisted, and drew on 47 expert interviews conducted in Q4 2025 with retailers, panel suppliers and competing brand product managers.
KEY FINDINGS
  1. Mini-LED retail premium survived to the second markdown in 3 of the 4 markets, which finance had assumed happened in none of them (client-reported, unverified by MMA).
  2. The premium persisted at diagonals above 55 inches and disappeared entirely below them, which meant the range decision was about size rather than about construction.
  3. Two of the three panel suppliers quoted mini-LED at a cost premium roughly double the third, which nobody had compared because sourcing ran by supplier rather than by construction.
  4. Competing brands had moved mini-LED into their large diagonal ranges a full season earlier, which explained part of the margin compression finance had attributed to pricing.
RECOMMENDED STRATEGY
Phase 1: Phase one: move mini-LED construction into the range above 55 inches only, where realised retail premium survives markdown, and leave smaller sizes alone. Phase 2: Phase two: consolidate mini-LED panel sourcing onto the supplier quoting the lower construction premium rather than spreading it across all three. Phase 3: Phase three: track realised price after second markdown by construction and diagonal, so range decisions stop being argued from launch pricing.
OUTCOME
The brand moved mini-LED into the range above 55 inches and consolidated sourcing onto one supplier (client-reported, unverified by MMA). Margin stabilised across the following model year for the first time in five. Realised price after second markdown now appears in every range planning review the brand runs.

Frequently Asked Questions

Foundational context covering the market sizes, CAGR, scope, country, region and competition that inform every finding below. This section is provided to cover basics and most often pre-purchase conversations, answered from the MMA Primary Research Dataset.

What is the current size of the Ultra-High Definition (UHD) Panel (4K) Market?

Global value reaches USD 65.02 billion in 2026, measured as ultra high definition panel and module shipment revenue. The 2025 base is USD 62.4 billion.

How large will the Ultra-High Definition (UHD) Panel (4K) Market be by 2036?

Panel and module shipment revenue reaches USD 98.11 billion by 2036, an increase of USD 33.09 billion over the forecast period. That represents 1.51 times expansion from 2026.

What is the CAGR for the Ultra-High Definition (UHD) Panel (4K) Market 2026 to 2036?

The base case runs at 4.2% annually, with a bull case at 5.4% if microLED yield reaches consumer price points and a bear case at 3.0% if more policy-driven capacity arrives.

Which segment is growing fastest?

MicroLED modular panels grow at 6.3%, half again the market rate of 4.2%, from a base small enough that the percentage flatters it. Commercial signage rather than consumer television carries that volume.

Who are the major companies in the Ultra-High Definition (UHD) Panel (4K) Market?

BOE Technology, TCL China Star, LG Display, Samsung Display and HKC lead on panel and module shipment revenue, together holding 78%. AUO, Innolux and Tianma hold smaller positions.

Which country is growing fastest?

India leads at 8.4%, on domestic television manufacturing under production incentives, low ownership saturation and rising ultra high definition penetration. Vietnam and Indonesia follow some way behind.

Report Segmentation Architecture

The full report scope spans multiple orthogonal segmentation dimensions, with cross-tabulated demand data provided for each dimension pair. Coverage extends further to regional breakdowns, trend trajectories, and the competitive detail needed to support segment-level decision-making.

By Panel Construction

  • MicroLED Modular Panels
  • Mini-LED Backlit LCD Panels
  • OLED UHD Panels
  • Quantum Dot Film Enhanced Panels
  • Standard LED-Backlit LCD Panels
  • Open Cell UHD Panel Supply

By End-Use Industry

  • Consumer Television
  • Computer Monitors And Displays
  • Commercial Digital Signage
  • Hospitality And Institutional Displays
  • Automotive And Transport Displays
  • Broadcast And Professional Monitoring

By Commercial Dimension

  • Direct Brand Supply Agreements
  • Contract Set Assembler Supply
  • Open Cell Component Sales
  • Module House Distribution
  • Commercial Integrator Channel
  • Original Design Manufacturer Supply

By Region

  • North America
  • Western Europe
  • East Asia
  • South Asia and Pacific
  • Latin America
  • Middle East and Africa
  • Eastern Europe

Scope, Methodology, and Coverage

Every figure in this report is reproducible from documented input assumptions. The scope below maps the historical period, the forecast horizon, the segmentation dimensions, and the countries covered, alongside the underlying primary and qualitative methodology.
Historical Period
2020 to 2025
Forecast Period
2026 to 2036
Base Year
2025 (USD billions; MMA Primary Research Dataset, September 2026)
Market Definition
This report covers ultra high definition display panels at four thousand horizontal pixels and above, measured as panel and module shipments: microLED modular panels, mini-LED backlit liquid crystal panels, organic light emitting diode panels, quantum dot film enhanced panels, standard light emitting diode backlit panels, and open cell panel supply. It excludes finished television and monitor sets, display driver integrated circuits, glass substrate and materials manufacture, projection systems, and lower resolution panels of any construction.
Quantitative Units
USD millions, panel and module shipment revenue basis; shipped panel area in square metres; average shipped diagonal in inches; capacity utilisation as a percentage; annual price decline per square metre.
Segmentation Dimensions
Panel construction; end-use application; commercial supply channel; geography across seven regions by set assembly destination.
Regions Covered
North America, Western Europe, East Asia, South Asia and Pacific, Latin America, Middle East and Africa, Eastern Europe
Countries Covered
China, South Korea, Japan, Taiwan, Vietnam, India, Indonesia, United States, Canada, Mexico, Brazil, Argentina, Germany, France, United Kingdom, Poland, Slovakia, Hungary, Turkey, Egypt.
Key Companies Profiled
BOE Technology, TCL China Star, LG Display, Samsung Display, HKC, AUO, Innolux, Tianma Microelectronics, Sharp, Japan Display, Visionox, TPV Technology, Leyard Optoelectronic, Unilumin, Absen.
Quantitative Methodology
Primary survey, n=3,800 respondents, Q4 2025, six countries; demand-side model with trade association cross-validation
Qualitative Methodology
47 expert interviews, Q4 2025; applied to validate demand model assumptions, identify emerging dynamics, and assess competitive positioning
Report Format
PDF and XLSX data workbook (Word format preview document)
Publisher
Market Minds Advisory
Report Code
MMA-2026-TEC-421
Published
September 2026
Contact
sales@marketmindsadvisory.com | www.marketmindsadvisory.com

Purchase the full Ultra-High Definition (UHD) Panel (4K) Market Report (2026 to 2036).

This report sizes the global ultra high definition panel market from 2026 to 2036 across six panel constructions, six end-use applications and seven regions. It explains why a fab costing USD 7 billion cannot be idled and what that does to pricing, which falls about 6% a year regardless of demand. Cost composition is sourced to company annual reports, with fab depreciation at 34% of panel cost. Regional analysis measures shipments by set assembly destination and explains why Eastern Europe sits above its usual share. Competitive assessment covers 20 named manufacturers with four revenue lever analyses and an anonymised brand sourcing engagement.
Fab utilisation economics modelled against panel pricing
Six panel constructions sized through to 2036
Depreciation and substrate cost composition from filings
Twenty named manufacturers assessed on shipment revenue
Four revenue levers with quantified commercial impact
Anonymised television brand sourcing engagement included in full

Built For The People Who Decide

From boardroom strategy to bench-side execution, this report is read cover-to-cover by leaders shaping the next decade of their industry, turning demand scenarios, market dynamics and valuation benchmarks into decisions.
CXOs/ Presidents/ VPs/ Managers
M&A and Corporate Development
Strategy Teams and R&D Heads
Procurement and Product Directors
Regulatory and Compliance Leaders
Investor Relations and Equity Analysts