Market Minds Advisory
Trimer Acid Market

Trimer Acid Market: You Cannot Buy More by Paying More

Supply arrives as a fixed fraction of somebody else's product, so when demand for the main output falls this material becomes scarce no matter how badly anybody happens to want it.

Lead Analyst

Bilal Shaikh

Published

September 2026

Make Smarter Decisions with Customized Research Insights

Request a free sample report and evaluate market opportunities, growth trends, and competitive dynamics relevant to your business needs.

2025 MARKET VALUE$0.3BMarket Size 2025
2036 FORECAST VALUE$0.5BBase Case , 2026 to 2036
CAGR 2026 TO 20364.6 %Bull 5.8% / Bear 3.4%
INCREMENTAL OPPORTUNITY$0.2BNet 10- year value creation
EXPANSION MULTIPLE1.57x2036 value over 2026 base
Strategic Levers
M&A Pipeline
Regional Outlook
Country Rankings
Competitive Intelligence
Segmental Deep-dive
Call-Us : 91 93563 13602

Executive Snapshot and Market Trajectory

Nobody decides how much of this gets made. Trimer emerges as roughly 15% of dimerisation reactor output alongside the dimer acid that the plant was actually built to produce, in a ratio the chemistry fixes rather than the market. Nobody builds a plant for the minor fraction.
That inverts the usual supply logic completely. Strong trimer demand does not create trimer supply, and weak dimer demand removes it regardless of how much anybody wants the heavier fraction. Buyers accustomed to paying a premium to secure volume find that the premium changes nothing at all, because the reactor is not listening to them. The constraint is a stoichiometric ratio rather than any producer's willingness to sell into a better offer.
Feedstock sits behind a second co-product chain. Tall oil fatty acid comes from kraft pulping, and around 28% of crude tall oil is now burned for mill energy rather than sold onward. Distilled high-purity grades grow at 6.9%, half again the market rate of 4.6%, on formulations that cannot tolerate the standard material. Requalification takes around 14 months, which leaves formulators price takers during every tight period.
Market Definition
Trimerised fatty acid produced through catalytic oligomerisation of unsaturated fatty acids, covering standard trimer acid, distilled high-purity trimer, hydrogenated trimer acid, trimer acid esters, trimer acid salts and amine derivatives, and certified bio-based grades. Measured at producer selling value. Excludes dimer acid and monomer fractions, tall oil fatty acid and other feedstocks, polyamide resins and finished formulations, and unmodified vegetable oils.
Base Year Value
$0.3B in 2025 (MMA Primary Research Dataset, August 2026)
Forecast Period
2026 to 2036, eleven discrete annual values
CAGR
4.6% base case. Bull 5.8%. Bear 3.4%.
Fastest Growth Segment
Distilled High-Purity Trimer: 6.9% CAGR
Fastest Growth Country
India: 8.4% CAGR
Fastest Growth Region
South Asia and Pacific: 6.6% CAGR
Largest Region
East Asia: 30% of 2025 global value
Market Leaders
Kraton, Croda International, Oleon, Emery Oleochemicals, Florachem. Source: MMA Primary Research Dataset, July 2026.
Primary Survey
n=3,800 procurement and R&D decision-makers, Q4 2025, six countries
Methodology
Demand-side build-up, cross-validated against public data, 47 expert interviews

Trimer Acid Market Forecast Scenarios

trimer-acid-market-trends-size-forecast-scenario-1787640226186
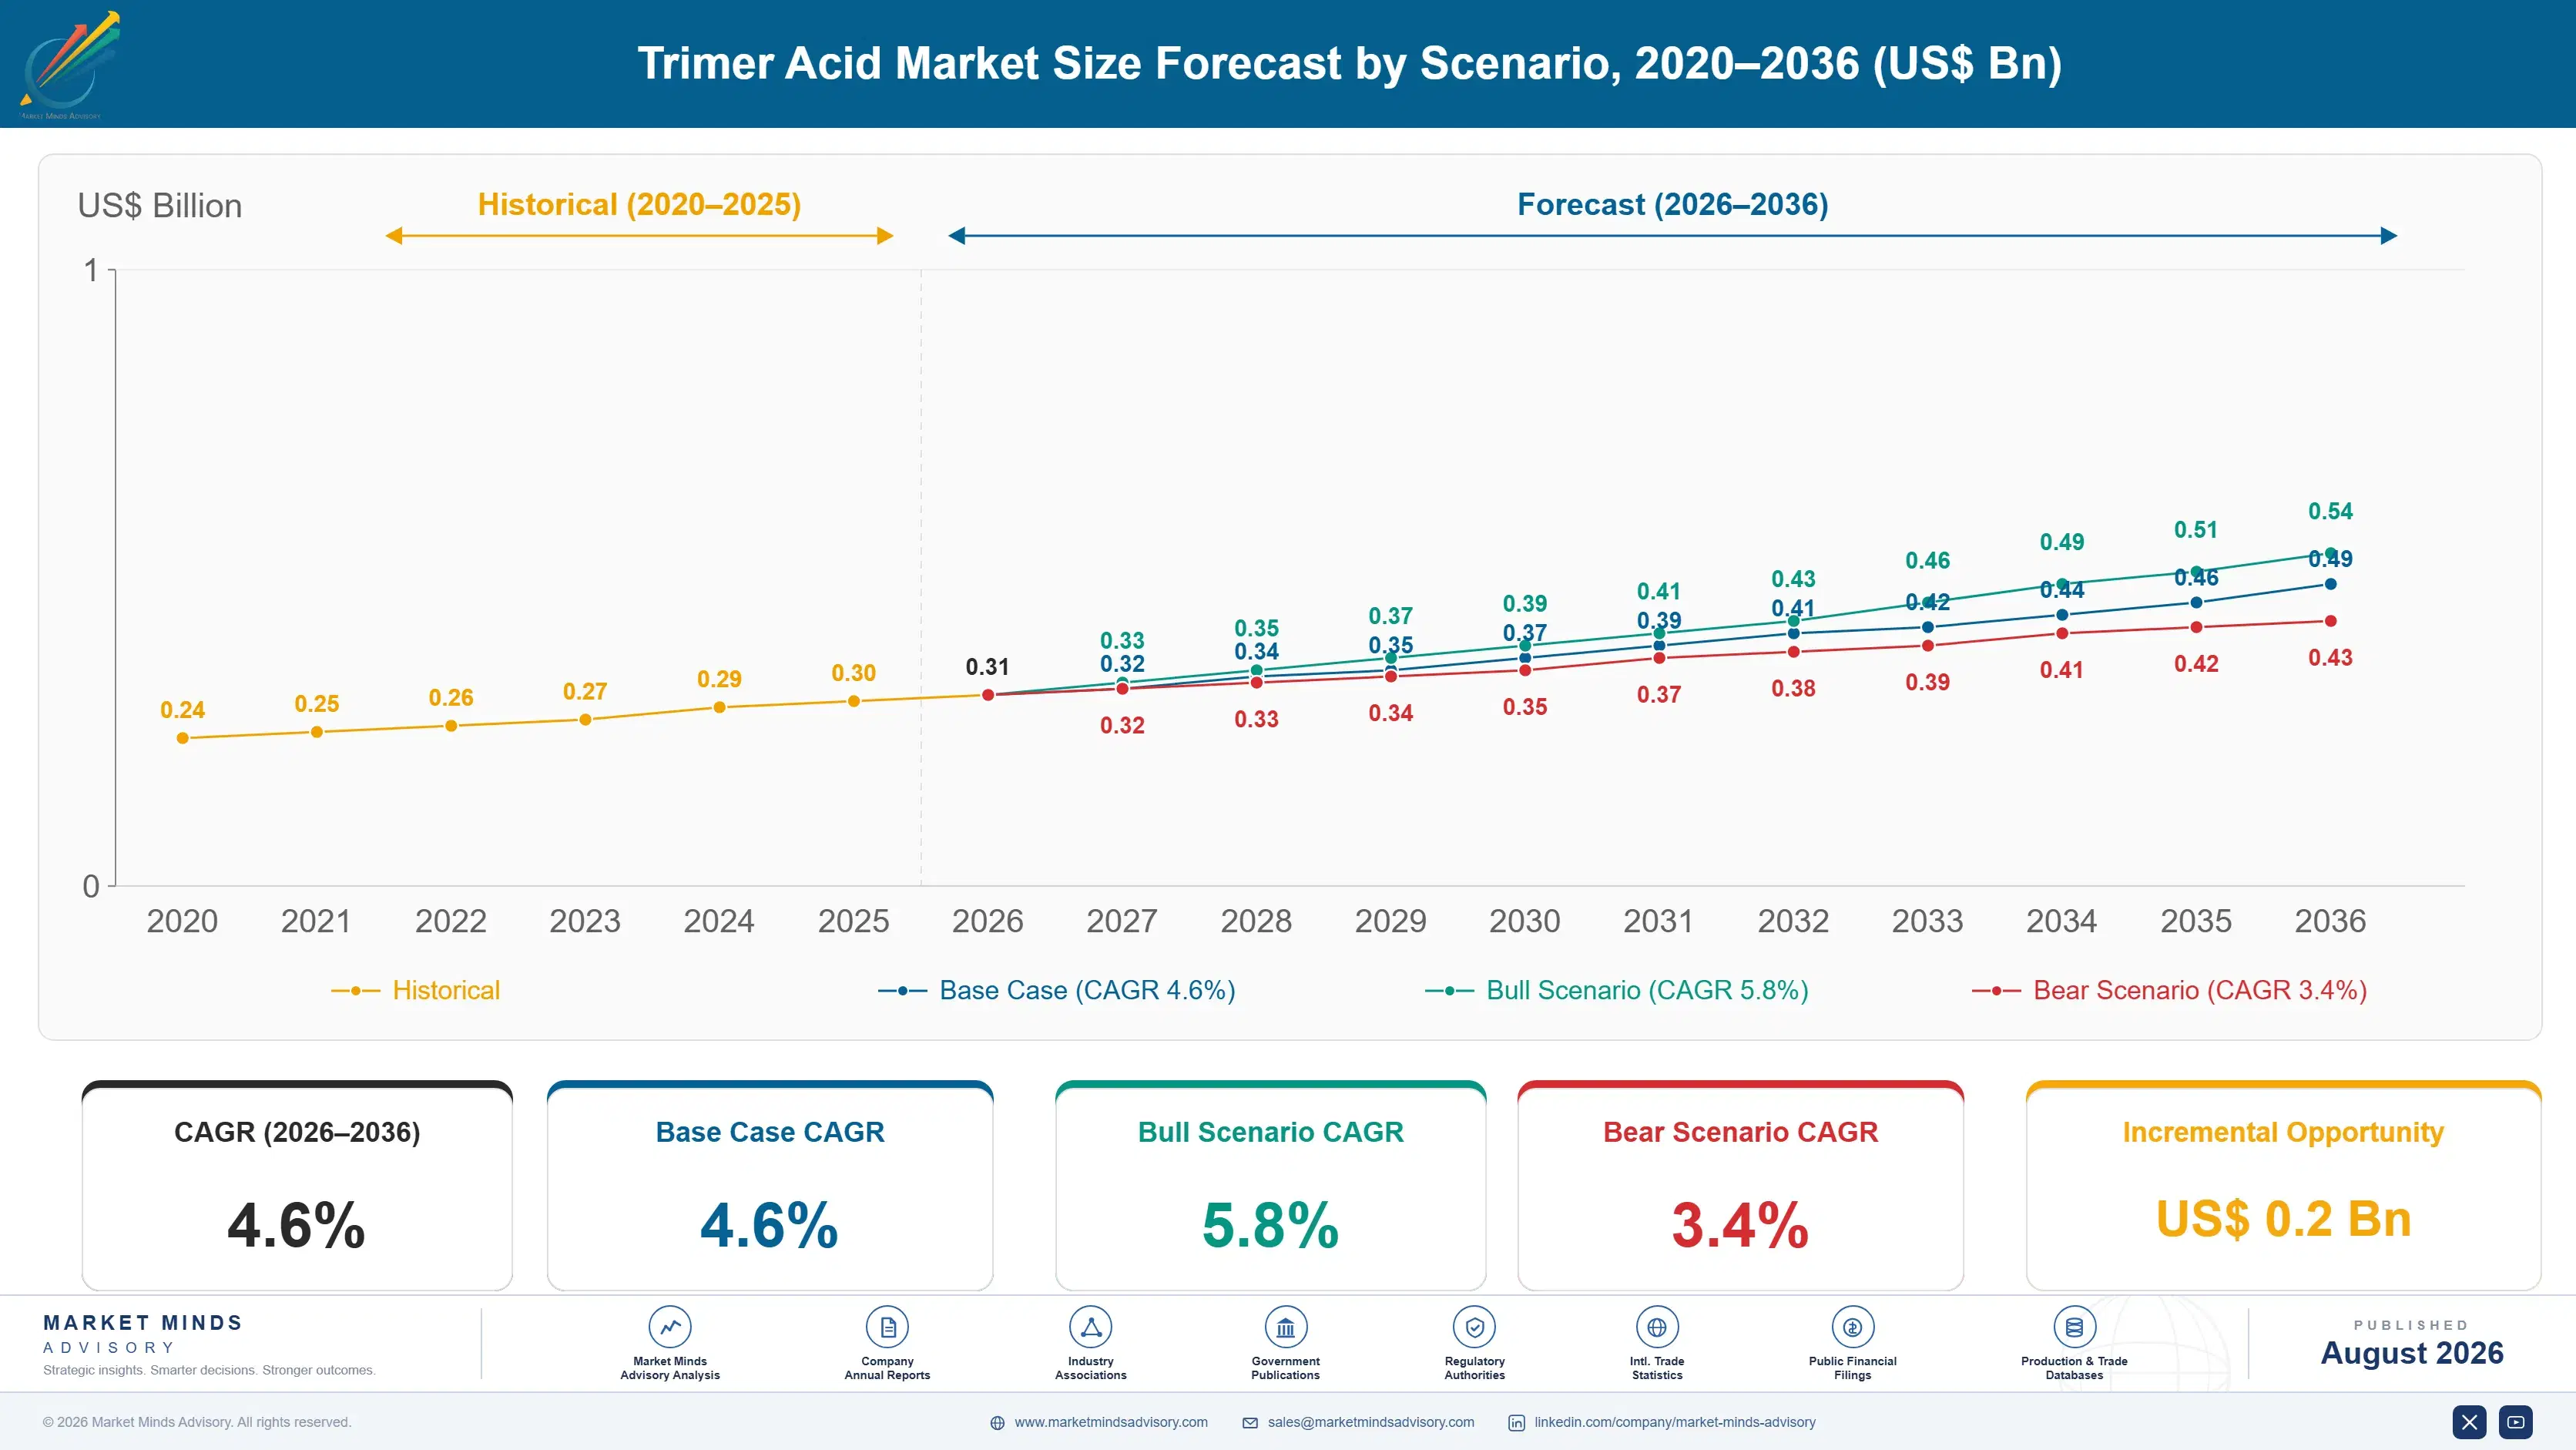
Growth ran near 3.6% between 2020 and 2025 and availability rather than demand set the pace throughout. Dimer acid demand from polyamide resins determined how much trimer reached the market, and periods of weak dimer offtake produced trimer scarcity that no amount of buyer interest resolved. Crude tall oil diversion into mill energy tightened feedstock steadily across the same period.
Base case 4.6% rests on three mechanisms. Distilled high-purity grades grow at 6.9% as ink and adhesive formulations demand tighter colour and viscosity control. Hydrogenated grades grow at 6.2% on oxidative stability in lubricant and oilfield applications. And India grows fastest of any country at 8.4% on packaging ink, adhesive and oilfield chemical manufacturing all expanding at the same time. None of the three depends on new dimerisation capacity, which nobody has built for decades.
The bull case at 5.8% assumes bio-based content certification becoming a purchasing requirement in coatings and adhesives, which would reprice a naturally renewable material against petrochemical alternatives on credentials rather than performance. The bear case at 3.4% is dimer acid demand weakening further, since trimer availability follows it directly and no producer runs a reactor to make the minor fraction alone.

A Fraction of Somebody Else's Reaction

The governing fact about trimer acid is that nobody makes it deliberately. Catalytic dimerisation of unsaturated fatty acids produces dimer as the intended output and trimer as roughly 15% of what comes out alongside it, in a ratio set by reaction chemistry rather than by any commercial decision. A producer cannot make more trimer without making more dimer, and dimer demand is what justifies running the plant at all.
TOP FIVE CONCENTRATION74%Very few producers operate dimerisation capacity at commercial scale
TRIMER SHARE OF OUTPUT15%Portion of dimerisation output emerging as the heavier fraction
FEEDSTOCK DIVERTED TO ENERGY28%Crude tall oil burned for mill fuel rather than sold
RESIN USE LEVEL6%Share of a resin formulation this material actually occupies
BIO-BASED CARBON CONTENT100%Portion of the molecule derived from renewable feedstock
REFORMULATION TIMELINE14 monthsWork required to remove it from a qualified resin
That relationship inverts everything buyers normally assume. Strong trimer demand produces no additional trimer, and weak dimer offtake removes trimer supply regardless of how much the polyamide resin industry wants it. Purchasing organisations accustomed to securing allocation through price find that the premium accomplishes nothing, because the constraint is a stoichiometric ratio rather than a producer's willingness to sell into a better offer.
Feedstock adds a second derived layer underneath. Tall oil fatty acid is itself a co-product of kraft pulping, and around 28% of crude tall oil is now burned for mill energy rather than sold to oleochemical processors. A specialty chemical used at roughly 6% of a resin formulation therefore depends on paper mill fuel decisions.
"Buyers keep offering more money and it does not produce a single extra tonne. The reactor makes what the chemistry says it makes, and the chemistry has never once read a purchase order."
Director, Oleochemicals and Specialty Intermediates Practice · MMA Chemicals and Materials Practice · August 2026

Market Trends

Co-product economics detaching supply from trimer demand

Trimer emerges as roughly 15% of dimerisation output in a ratio the chemistry fixes, so supply follows dimer acid demand rather than anything happening in trimer markets. Strong trimer interest produces no additional volume and weak dimer offtake removes it entirely. Buyers accustomed to securing allocation through price find the premium accomplishes nothing, which is an unusual and genuinely uncomfortable position for any purchasing organisation to occupy. Strategic inventory and multi-year allocation agreements are the only practical responses available to anybody buying it. Price signals reach nothing here. Nothing else works at all.
Market Impact: India growing fastest at 8.4%

Tall oil diversion into energy tightening feedstock availability

Crude tall oil is a co-product of kraft pulping and around 28% is now burned for mill energy rather than sold to oleochemical processors, which tightens the feedstock underneath an already derived supply chain. Pulp mills make that decision on their own energy economics without reference to downstream chemistry. The result is a specialty material whose availability depends on fuel balance decisions in an entirely separate industry. No downstream capability addresses a decision taken two industries upstream on entirely unrelated economics. The chain is doubly derived. Mills decide on their own economics entirely.
Market Impact: High-purity grades growing 6.9%

Market Opportunities and Growth Drivers

Packaging ink and adhesive manufacturing expanding in volume markets

India grows fastest of any country at 8.4% as packaging ink, hot melt adhesive and oilfield chemical manufacturing all expand at the same time, and polyamide resin demand follows each of them. Trimer content sits at roughly 6% of those formulations, so demand scales directly with resin production volume. Suppliers organised around established coatings geographies are covering markets where converting volume stopped growing years ago. Converting capacity announcements are published well ahead of production and predict demand considerably better than any economic indicator does. Resin plants are the indicator. Coverage rarely follows.
Market Impact: Fixed at 15% of output

Purity requirements rising in colour sensitive formulations

Distilled high-purity grades grow at 6.9% because printing ink and adhesive formulations increasingly specify colour, viscosity and residual monomer limits that standard material cannot meet consistently. Distillation adds cost and reduces yield from an already constrained supply, which makes the premium grade genuinely scarcer than the standard one. Formulators requiring it have very few qualified sources and correspondingly little negotiating room available to them. Distillation costs yield from a supply already fixed at the reactor ratio, which makes the premium grade scarcer rather than merely dearer. Sources are very few.
Market Impact: Reformulation takes 14 months

Market Restraints and Challenges

Reactor output ratio preventing any supply response

Trimer emerges as roughly 15% of dimerisation output and no producer runs a reactor to make the minor fraction alone, so supply cannot respond to trimer demand at any price. The root cause is reaction stoichiometry rather than any commercial choice. Commercially it leaves buyers exposed to a chemistry they cannot influence. Strategic inventory, multi-year allocation agreements and qualified second sourcing are the only practical responses available. Buyers offering more money discover it produces no additional tonnage whatsoever. Allocation agreements are the practical response, and buyers who lack one wait for the dimer cycle to turn.
Market Impact: Trimer is 15% of reactor output

Requalification cost locking formulators into scarce supply

Removing trimer from a qualified polyamide resin takes around 14 months of reformulation and customer requalification, which means a formulator facing scarcity cannot simply switch chemistry. The root cause is that the three carboxyl groups deliver crosslinking that dimer alone cannot replicate. Commercially it makes buyers price takers during tight periods. Inventory positions and long term agreements are what formulators actually use to manage it. The three carboxyl groups deliver crosslinking that nothing else in the formulation replicates. Inventory positions and long term agreements are what formulators actually use here.
Market Impact: Around 28% burned for energy
4 additional market trends, 3 additional growth drivers, and 2 additional restraints and challenges are covered in the full report. Contact sales@marketmindsadvisory.com to access the complete intelligence.

Segment CAGR and Growth Architecture

Six segments split by grade as supplied, because grade determines the purity delivered, the applications it can serve, the processing cost carried and the price it commands. Packaging and specification variants sit inside each grade. Application and channel dimensions are handled separately within the framework rather than mixed here. Grade decides the commercial position, since processing depth determines supply.
trimer-acid-market-trends-market-share-analysis-1787640226787

Distilled High-Purity Trimer

Growing at 6.9%, half again the market rate of 4.6%, distilled grades meet the colour, viscosity and residual monomer specifications that printing ink and adhesive formulations increasingly demand. Distillation costs yield from a supply already fixed at roughly 15% of reactor output, which makes the premium grade scarcer than the standard material rather than merely more expensive. Formulators requiring it hold very few qualified sources and correspondingly limited negotiating position during any tight period. Colour, viscosity and residual monomer limits are all tightening as packaging printing moves toward higher speed presses and thinner films, which narrows the qualified field further each year. Scarcity rather than price is the issue. Yield falls as purity rises.
CAGR 6.9%

Hydrogenated Trimer Acid

At 6.2% hydrogenated grades remove residual unsaturation that causes oxidative instability and colour drift, which matters in lubricant additives, oilfield chemicals and any application seeing elevated temperature over extended periods. Hydrogenation adds a processing step and cost to material that was already constrained by the reactor ratio upstream. Demand follows industrial and energy applications rather than the printing and packaging cycles that govern the standard grade entirely. Oxidative stability matters wherever material sees elevated temperature over long periods, and hydrogenation is the only route to it. Qualified capacity is narrower still than for distilled grades. Industrial and energy cycles govern demand here, not printing and packaging ones. Colour drift is the failure mode.
CAGR 6.2%
Full segment breakdown across 6 segments available in the complete report.

Regional Architecture and Country Demand Map

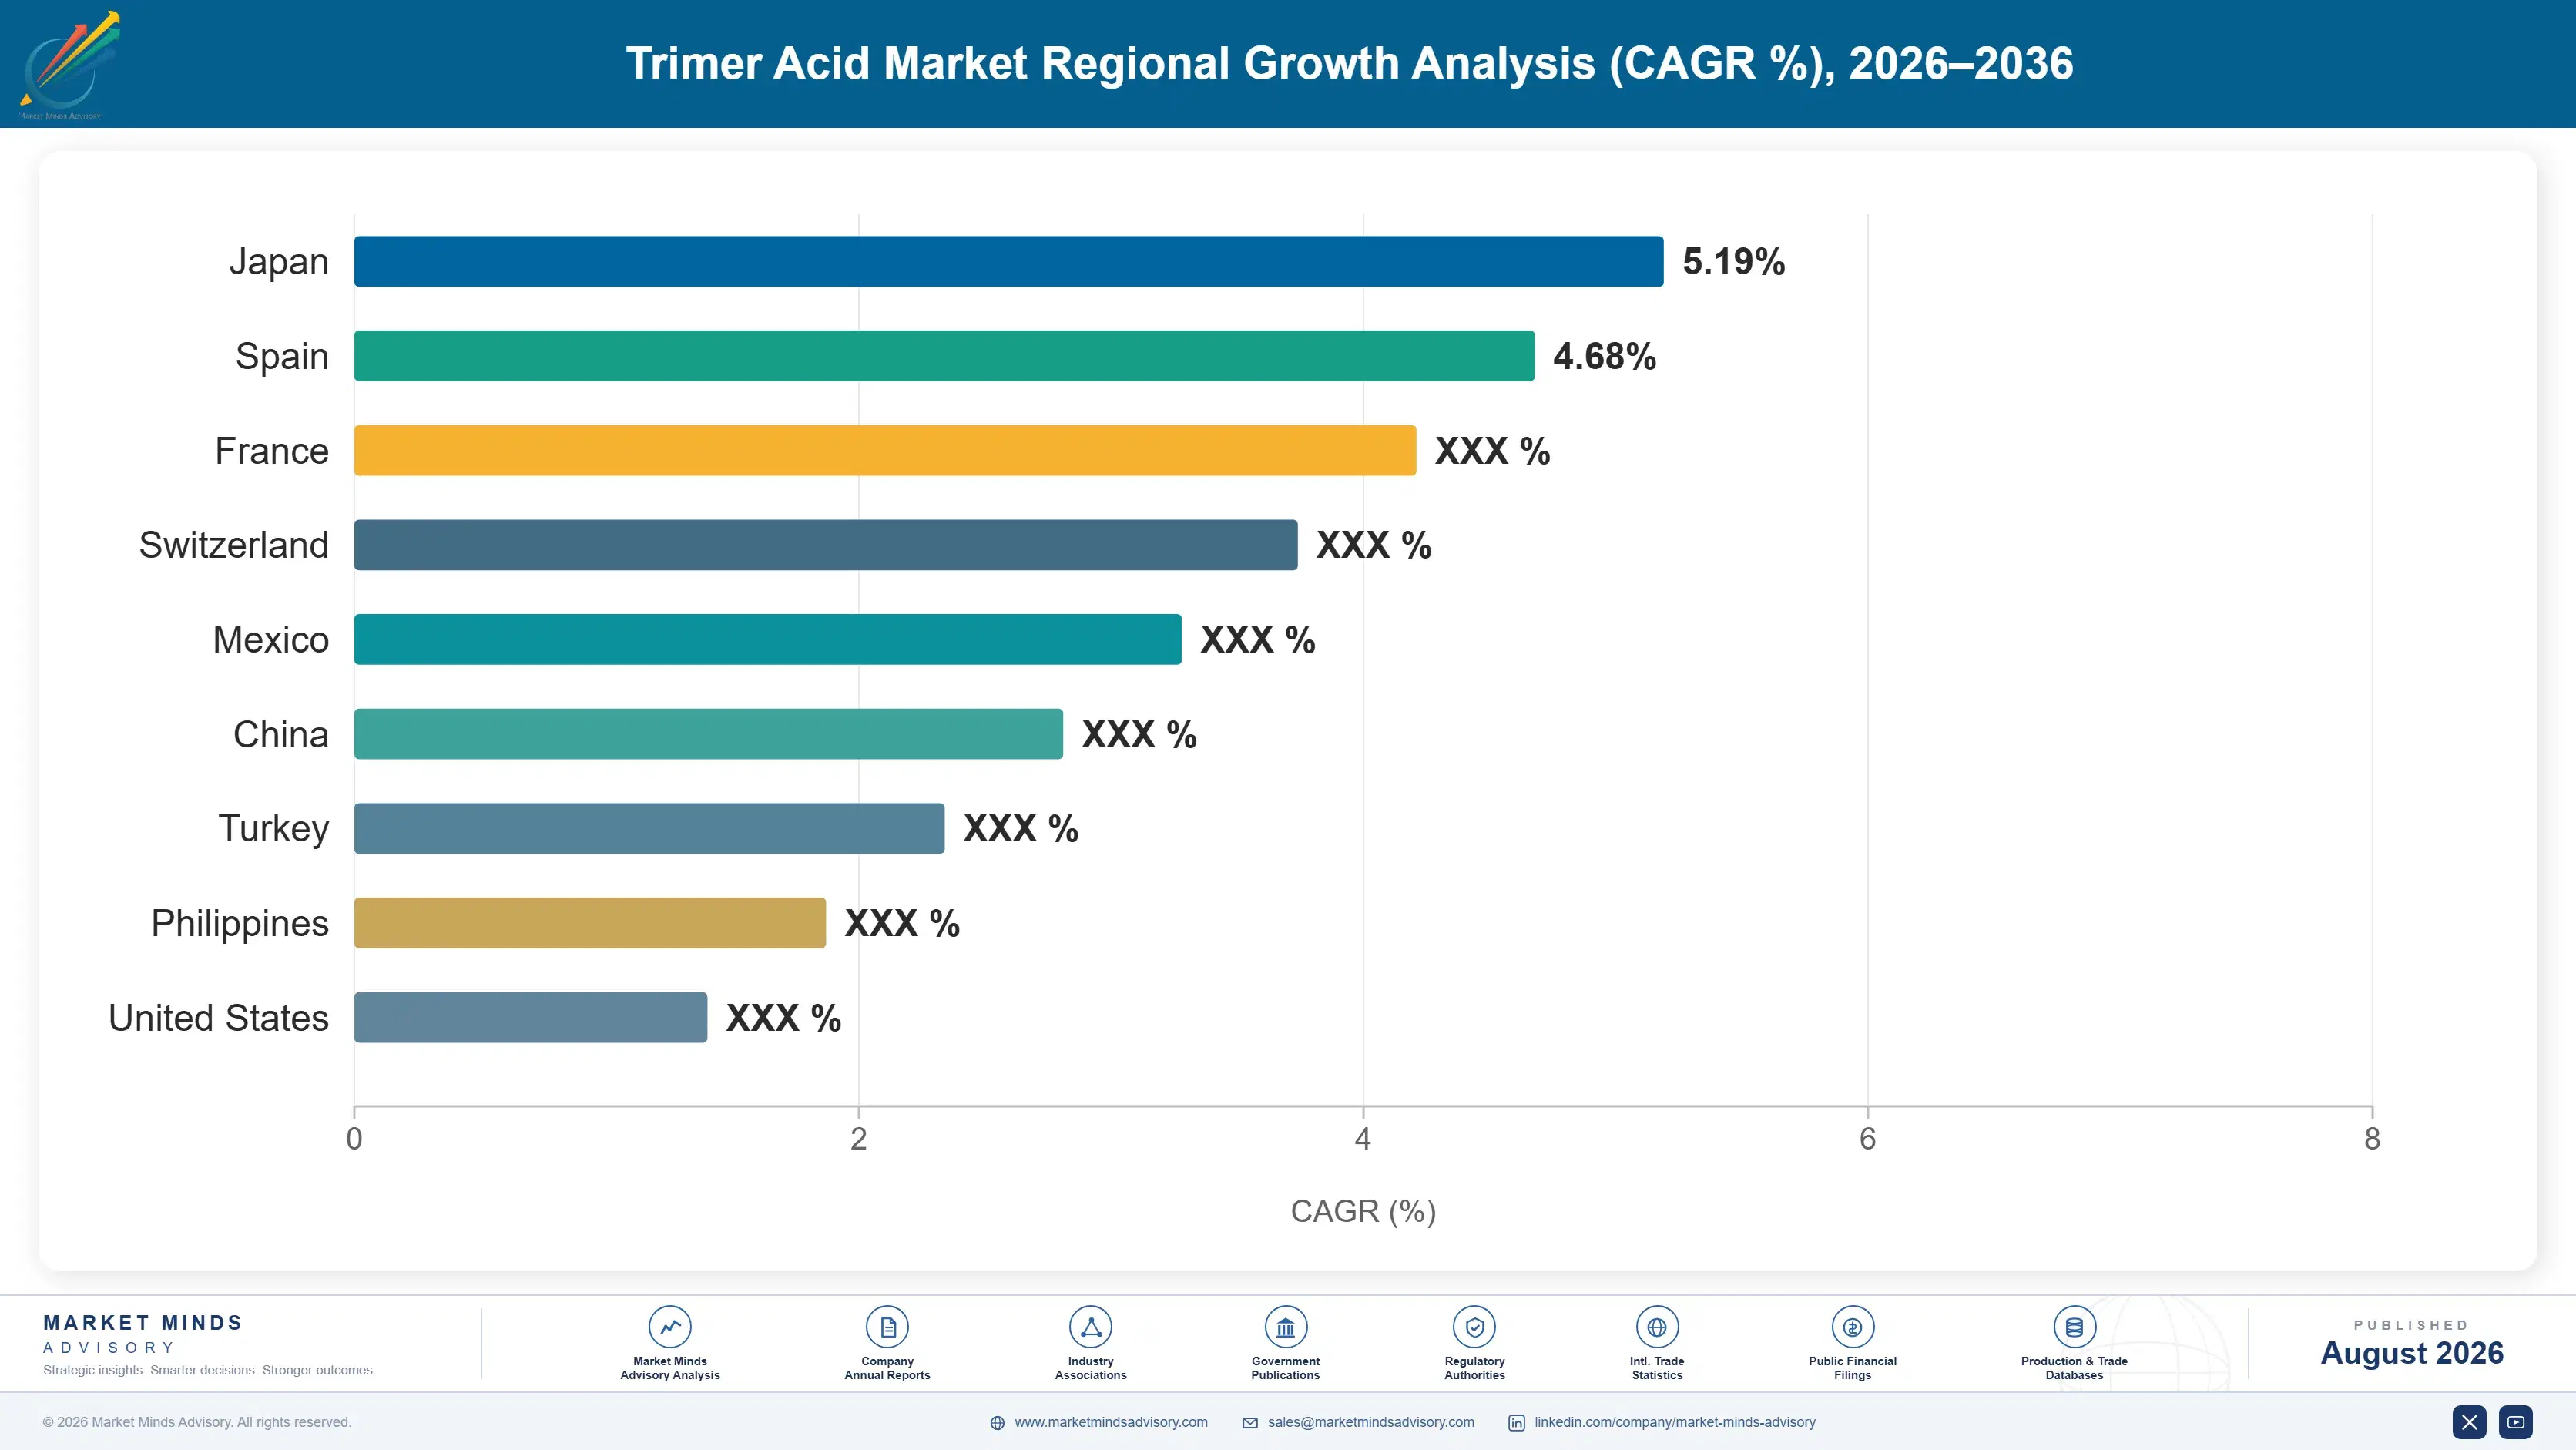
East Asia holds 30% of value on printing ink, adhesive and coatings manufacturing scale that no other region approaches. North America follows at 24% on tall oil feedstock access and established production capacity. South Asia and Pacific grows fastest of the seven regions covered here.

North America

Tall oil feedstock access from a substantial kraft pulping industry supports established dimerisation capacity here, and producers hold positions that feedstock proximity rather than scale created. Crude tall oil diversion into mill energy has tightened availability meaningfully across recent years. Printing ink and adhesive demand is mature with packaging carrying most of the volume. Growth at 4.0% reflects stable converting volumes and feedstock constraint rather than any demand weakness. Producers here hold positions that feedstock proximity created rather than any scale advantage, and that proximity is worth more each year as tall oil tightens. Printing ink and adhesive demand is mature with packaging carrying most of the volume across the region.
Share: 24% | CAGR: 4.0% (2026 to 2036)

Western Europe

Nordic kraft pulping provides tall oil feedstock and several producers operate close to it, though mill energy diversion is further advanced here than anywhere and has tightened supply considerably. Bio-based content requirements in coatings and adhesives are more explicit in this region, which favours a material that is naturally renewable. Regional growth of 3.0% is the slowest anywhere on mature converting volumes and constrained feedstock together. Bio-based content requirements arrive through customer specification rather than regulation, which rewards producers who have bothered to certify the credential formally. Mill energy diversion is further advanced here than anywhere, which has tightened regional supply considerably over recent years. Nordic pulping provides the feedstock several producers depend on.
Share: 22% | CAGR: 3.0% (2026 to 2036)
Regional intelligence for 5 additional markets available in the complete report: East Asia, South Asia and Pacific, Latin America, Middle East and Africa, Eastern Europe. Contact sales@marketmindsadvisory.com.
trimer-acid-market-trends-country-cagr-analysis-1787640227329

Four Moves in a Fixed Ratio

Nothing anybody does creates more of this material, because the reactor produces a fixed fraction of what the dimer market justifies making. What remains available is allocating scarcity deliberately, certifying credentials nobody has quantified, and following converting capacity rather than established geography. Allocation is the only genuine lever, and most treat it as administration.

Allocate scarcity toward grades that cannot be substituted

Trimer is fixed at roughly 15% of reactor output and no premium creates more of it, so a producer's real decision is where the constrained volume goes. Formulators facing about 14 months of requalification to remove it are structurally captive, while price sensitive applications are not. Directing distilled and hydrogenated volume toward captive positions and letting commodity uses go elsewhere is the only lever a producer genuinely controls. Order sequence is a poor allocation rule. Captivity varies enormously between customer positions, and allocating without measuring it directs constrained volume toward whoever happens to order first.
Market Impact: Directs the fixed 15% share of reactor output

Certify the bio-based credential nobody has quantified

The molecule is entirely derived from renewable feedstock and carries 100% bio-based carbon, which coatings and adhesive customers increasingly need to document for their own claims. Very few producers certify or communicate it. Formal certification costs modestly and converts an inherent property into a specification requirement that petrochemical alternatives cannot meet at all, which is unusually cheap differentiation for a constrained material. Coatings and adhesive customers are converting the property into a formal specification requirement regardless of whether producers communicate it, which means the credential will be demanded either way.
Market Impact: Documents the full 100% bio-based carbon content properly

Sell allocation certainty rather than delivered price

Weak dimer demand removes trimer supply regardless of what trimer buyers want, and formulators cannot reformulate inside 14 months. Multi-year allocation agreements with volume certainty are worth considerably more to those buyers than any discount, and they stabilise producer offtake through dimer cycles. Suppliers negotiating on price alone are trading the one thing customers genuinely value for the one thing they can live without. Certainty is what they actually want. Allocation agreements stabilise producer offtake through dimer cycles while giving the customer the certainty it cannot obtain any other way.
Market Impact: Covers the whole 14 month reformulation window entirely

Follow converting capacity rather than historic geography

India grows fastest at 8.4% as packaging ink, adhesive and oilfield chemical manufacturing expand together, and trimer demand follows polyamide resin production at roughly 6% of formulation. Suppliers organised around established coatings geographies are covering markets where converting volume stopped growing years ago. Converting capacity announcements are published well ahead of production and predict demand considerably better than any regional economic indicator. Established coatings geography stopped growing years ago, and coverage built around it is following historical rather than current demand. Resin plant announcements predict it. Historic coverage misleads. Announcements come early.
Market Impact: Follows the 8.4% Indian converting capacity growth rate

Who Controls the Margin Pool

Participation is measured on annual dimerisation production capacity, and the top five hold 74%. Concentration is unusually high because dimerisation capacity is expensive, feedstock access is limited and no producer builds a plant for the minor fraction, which keeps new entry effectively closed. The gap to challengers is feedstock access rather than any technical capability, and no amount of investment creates tall oil that pulp mills have decided to burn.
Competition runs on three fronts. Feedstock access decides who can operate at all, since tall oil availability is tightening. Downstream processing decides distilled and hydrogenated grade positions. And allocation practice decides which customers receive volume during the tight periods that recur regularly. Each front rewards a different capability, and very few participants hold all three of them properly.

Pressure ahead comes from feedstock diversion into mill energy and from bio-based certification becoming a specification requirement. Expect producers with secured feedstock and processing depth to gain. Rankings shift on whoever manages allocation as a commercial tool rather than an inconvenience. Concentration should hold, since entry is effectively closed. Merchant feedstock buyers without integration look most exposed as pulp mills keep diverting crude tall oil into their own energy recovery.
trimer-acid-market-trends-company-positioning-matrix-1787640227856

Competitive Moat and Risk Dimensions

KRATON

Moat: Tall oil integration depth

Integration into crude tall oil refining upstream of dimerisation secures feedstock in a chain where availability is tightening as mills burn more of it for energy. Downstream distillation and hydrogenation capability then converts constrained volume into the premium grades that command the strongest pricing, which a producer buying merchant feedstock cannot replicate on either side.
KRATON

Risk: Dimer demand determining trimer supply

Trimer emerges as roughly 15% of dimerisation output, so weak polyamide resin demand for dimer removes trimer volume regardless of how strong trimer interest happens to be. That exposure is inherent to the chemistry rather than to any commercial decision, and no producer resolves it without running a reactor uneconomically.
CRODA INTERNATIONAL

Moat: Specialty positioning and application depth

Application development capability across lubricants, coatings and personal care lets the business direct constrained volume toward the highest value uses rather than allocating on order sequence. That specialty positioning also supports pricing that reflects functional value in a formulation rather than the delivered cost of a chemical intermediate.
CRODA INTERNATIONAL

Risk: Feedstock availability outside control

Around 28% of crude tall oil is burned for mill energy rather than sold onward, and pulp mills make that decision on their own fuel economics without reference to downstream chemistry. No downstream capability addresses a feedstock decision taken two industries upstream, which leaves availability dependent on paper industry energy prices.

Players Tracked

Prominent Players

Kraton
Croda International
Oleon
Emery Oleochemicals
Florachem

Other Key Players

Ingevity
Forchem
Respol Resinas
Anqing Hongyu Chemical
Jiangsu Yonglin Oleochemical
Nissan Chemical
Chemical Associates
Vertellus
Georgia-Pacific Chemicals
Harima Chemicals
Eastman Chemical
Cargill
BASF
Nouryon
Wilmar International

Recent Developments

MARCH 2026

Resin producer secures multi-year allocation rather than price

A polyamide resin producer negotiated a multi-year allocation agreement guaranteeing volume through dimer demand cycles, accepting higher pricing in exchange for supply certainty it could not otherwise obtain at any price during tight periods. Order sequence allocation had left it short repeatedly before. Contribution improved for both parties.
Signal: Certainty proved worth considerably more than any discount at all to a buyer who cannot reformulate
SEPTEMBER 2025

Pulp mill diverts crude tall oil into energy recovery

A kraft pulp mill diverted its crude tall oil into internal energy recovery rather than selling it onward, responding to its own fuel economics and tightening feedstock for oleochemical processors several steps downstream. Merchant availability fell across the region. Oleochemical processors had no visibility of the decision at all.
Signal: Feedstock availability now depends entirely on the fuel decisions being taken two whole industries further upstream
DECEMBER 2025

Coatings customer requires documented bio-based carbon content

A coatings manufacturer began requiring documented bio-based carbon content across its raw material specifications, converting an inherent property of this material into a formal requirement that petrochemical alternatives could not satisfy. No petrochemical alternative could satisfy it. The material had always carried the credential uncertified.
Signal: An uncommunicated credential became a formal specification requirement without the molecule itself changing in any way

Tall Oil, Catalyst and Distillation

Tall oil fatty acid and other unsaturated fatty acid feedstocks carry around 61% of production cost, supplied from kraft pulping co-product streams and vegetable oil processing. Clay catalyst and process chemicals absorb roughly 8%. Distillation and hydrogenation energy account for about 14% across processed grades. Plant operation, quality release, regulatory documentation and freight take the balance.
Crude tall oil pricing moved sharply across recent years as pulp mills weighed energy recovery against merchant sales, per published forest products market reporting and Kraton annual reporting for 2025 on feedstock cost commentary. Producers passed movements through readily during tight periods, since buyers facing around 14 months of reformulation had no practical alternative to accepting them. That pass through capability is unusual and reflects captivity rather than any negotiating skill on the producer side.

Exposure divides on integration rather than on scale. A producer integrated into tall oil refining carries feedstock cost internally with genuine buffering during tight periods. A merchant feedstock buyer carries it fully against pricing set by pulp mill energy economics. A downstream processor buying finished trimer carries only purchase price, which moves violently but transparently and resets each contract cycle.
trimer-acid-market-trends-cost-volatility-analysis-1787640228051

Secure crude tall oil supply against multi-year agreements

Feedstock carries well over half of production cost and availability now depends on pulp mill fuel decisions rather than on any market signal. Multi-year agreements with mills secure both volume and price visibility, and mills value predictable offtake against the alternative of managing an energy balance around a volatile merchant market. Mills value predictable offtake.

Diversify feedstock beyond tall oil derived fatty acids

Vegetable oil derived oleic acid provides an alternative unsaturated feedstock with completely different supply drivers from kraft pulping economics. Qualification takes work and product properties differ slightly, and the diversification removes a dependence on decisions taken inside an industry that has no interest in downstream chemistry. Pulp economics are irrelevant to it. Properties differ slightly.

Price allocation certainty rather than delivered material cost

Buyers facing roughly 14 months of reformulation cannot walk away during tight periods, which makes supply certainty considerably more valuable to them than any discount on delivered price. Allocation agreements convert that reality into stable offtake for the producer and predictable availability for the customer at the same time. Both sides gain from the arrangement.

Portfolio Architecture for Margin Defence

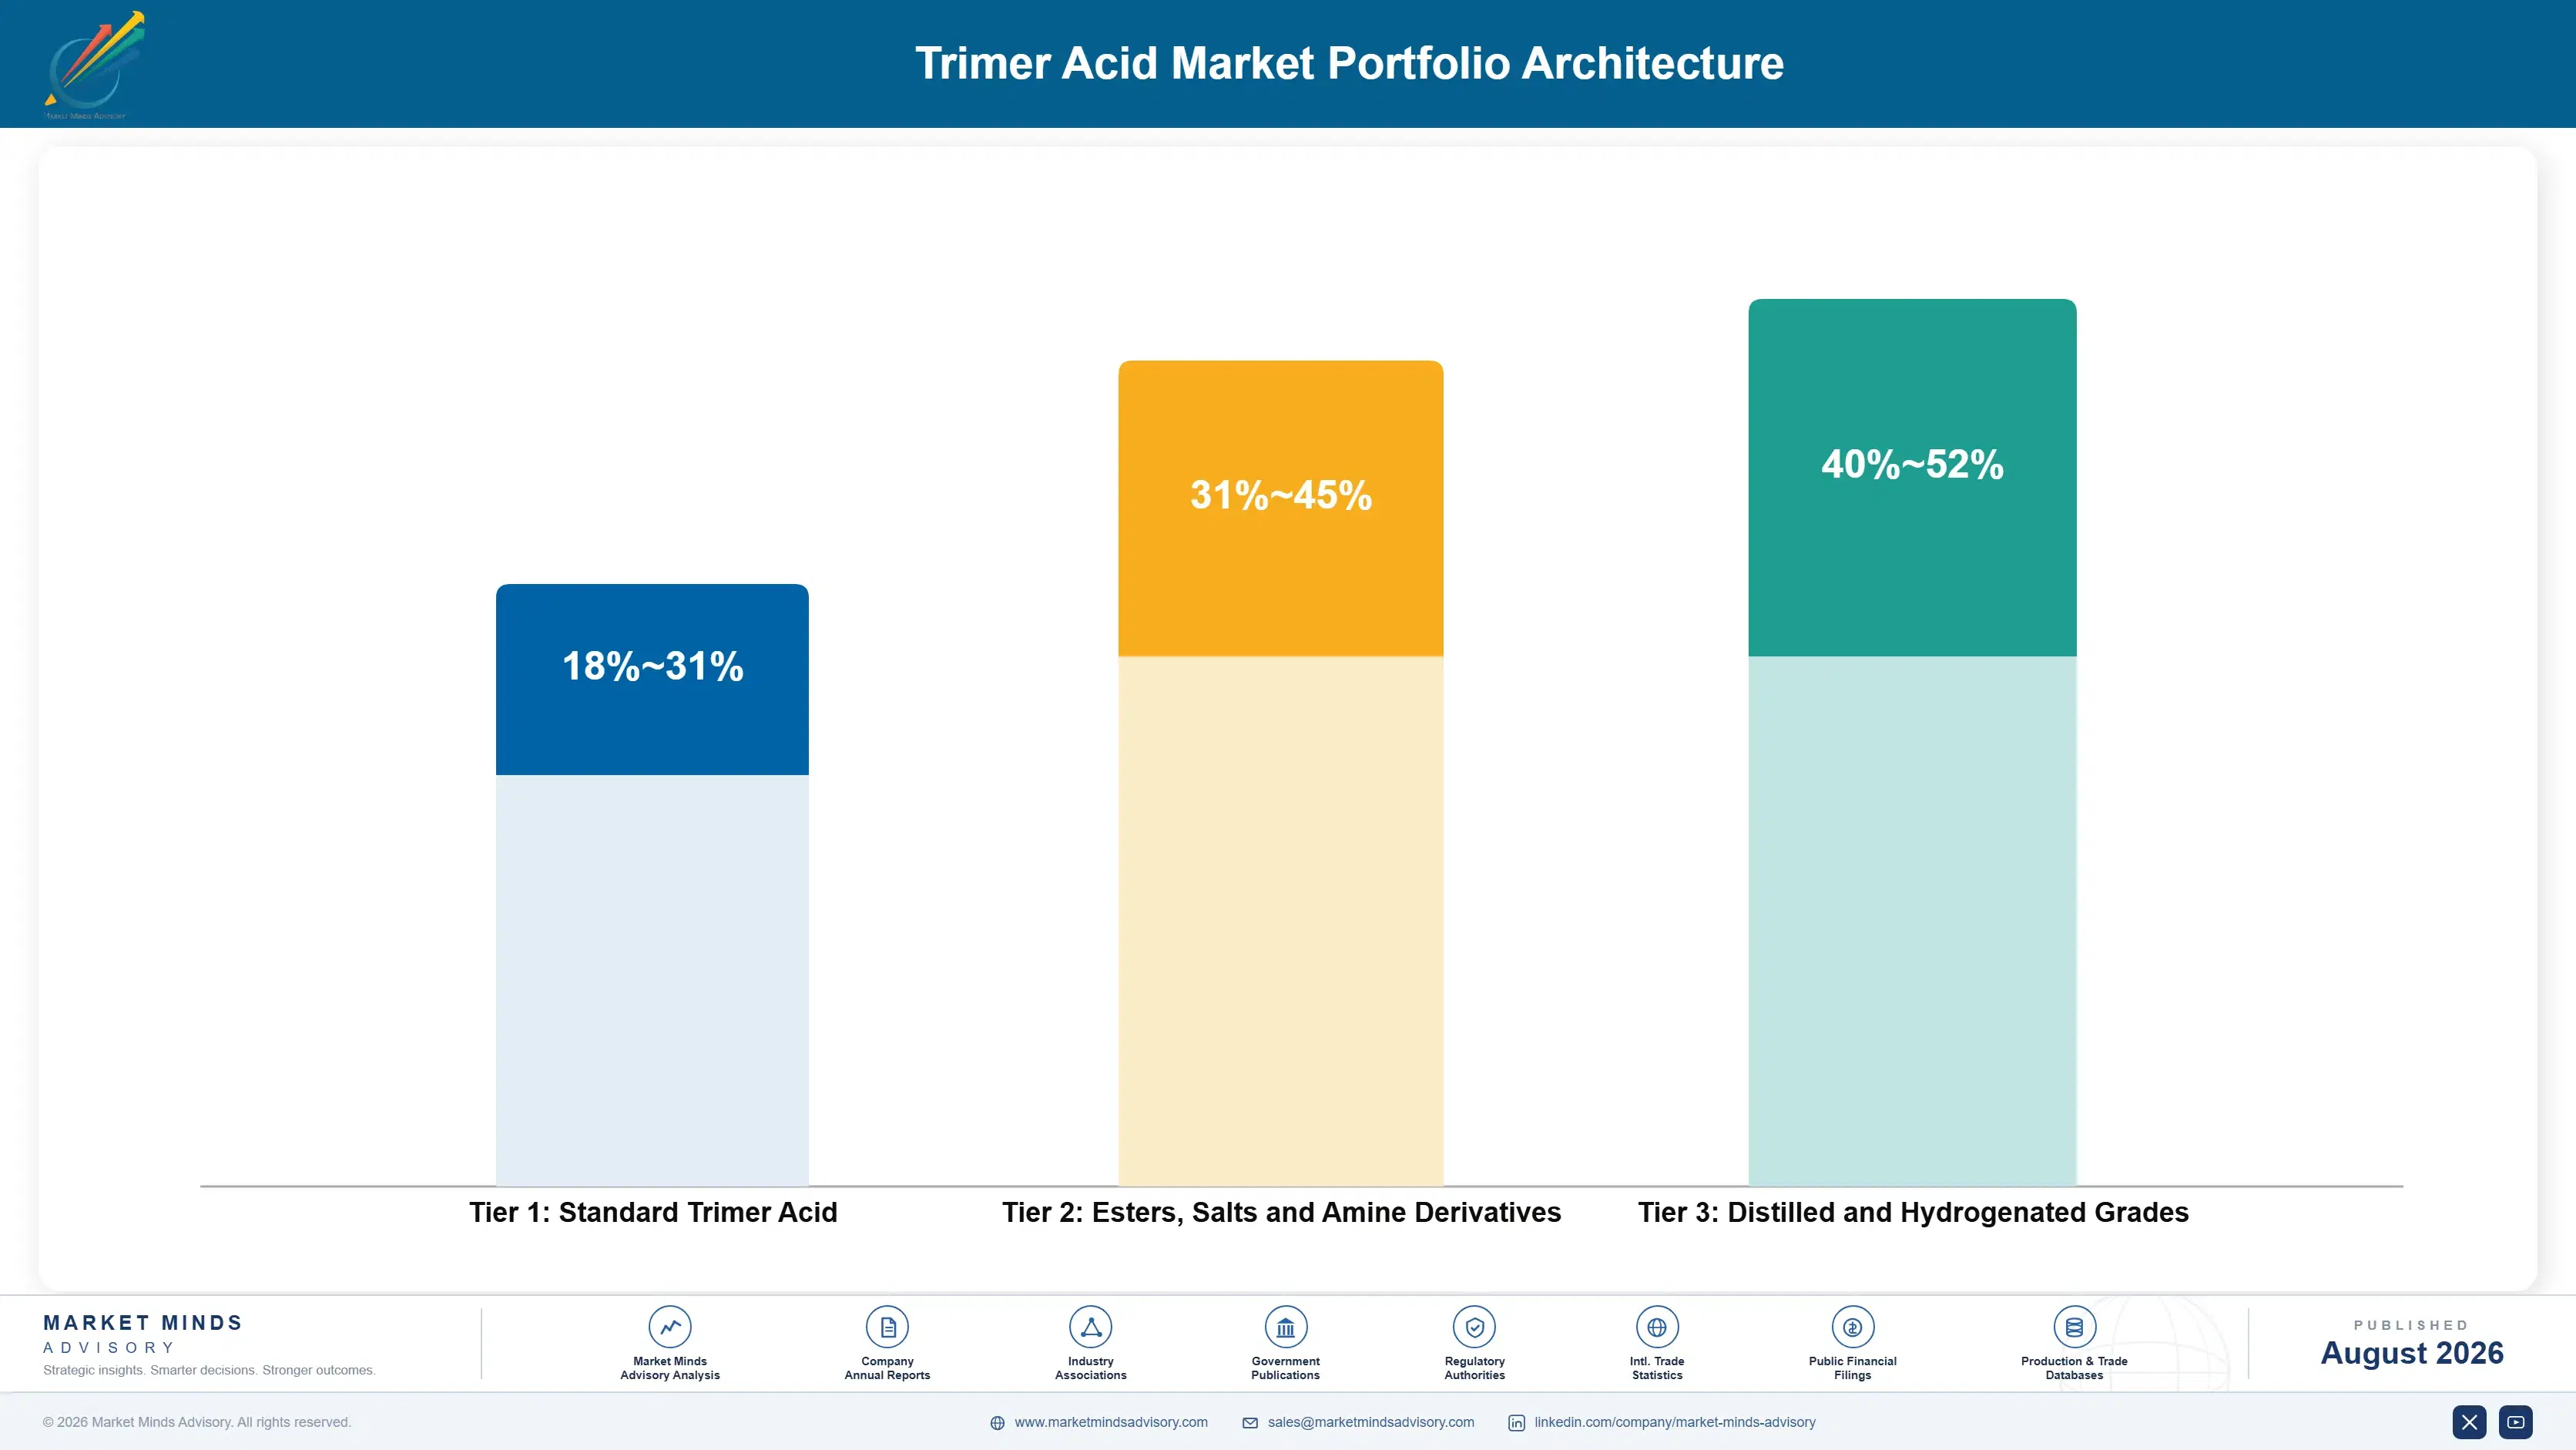
Margin here follows processing depth and allocation position rather than volume, because the base material is constrained and every producer sells everything it makes. Standard trimer earns margins in the high teens to low thirties, where the grade is interchangeable between the few qualified producers and buyers compare on delivered cost during comfortable periods. Every producer sells everything it makes, which is an unusual starting position for any pricing discussion.
Esters, salts and amine derivatives do better in the low thirties to mid forties, because derivatisation adds functionality and the qualified supplier field narrows to those with downstream processing capability. Application development capability decides where constrained volume is directed at this level.

Distilled and hydrogenated grades hold the strongest position, reaching into the low fifties, where purity and stability requirements exclude standard material entirely and processing costs yield from an already fixed supply. Those margins depend on maintaining feedstock access, since a producer without secured tall oil cannot run the distillation that creates the premium in the first place. A producer without secured tall oil cannot run the distillation that creates the premium in the first place, which makes feedstock the whole story.

Standard Trimer Acid

Base material interchangeable between the few qualified producers where buyers compare on delivered cost. The thirteen point range reflects feedstock integration position rather than any product difference between suppliers. Availability varies more than price.
Gross Margin: 18-31%

Esters, Salts and Amine Derivatives

Derivatised products where downstream processing narrows the qualified supplier field considerably. The fourteen point range reflects derivatisation capability and how specialised the application it serves happens to be. Processing capability narrows supply.
Gross Margin: 31-45%

Distilled and Hydrogenated Grades

Processed grades where purity and stability requirements exclude standard material entirely. The twelve point range reflects feedstock security, since distillation cannot run without secured tall oil supply behind it. Feedstock security enables it all.
Gross Margin: 40-52%
trimer-acid-market-trends-portfolio-architecture-1787640228552

High-value Sub-segments and Strategic Watch-out

Distilled High-Purity Trimer

High value and the fastest growth at 6.9%, meeting colour and viscosity specifications standard material cannot. Distillation costs yield from supply already fixed at a reactor ratio nobody controls. Formulators requiring it hold very few qualified sources and correspondingly little negotiating room during tight periods.
Gross Margin: 40-52%

Hydrogenated Trimer Acid

High value and growing at 6.2% on oxidative stability in lubricant and oilfield applications. Demand follows industrial and energy cycles rather than the printing and packaging cycles governing standard grades. Qualified hydrogenation capacity is narrower still, which concentrates the segment among very few producers indeed.
Gross Margin: 38-50%

Standard Trimer Acid

The volume core, interchangeable between the few qualified producers and priced on delivered cost when supply is comfortable. Availability rather than price is what actually varies for buyers here. Allocation practice rather than pricing decides who receives material when the dimer cycle turns downward. Certainty beats price.
Gross Margin: 18-31%

Co-Product Supply Exposure

The strategic watch-out. Trimer arrives as roughly 15% of dimerisation output, and the range reflects whether a participant holds feedstock integration or depends entirely on decisions taken upstream. Nothing downstream resolves an upstream stoichiometric ratio, whatever anybody is prepared to pay for it. Integration is the hedge.
Gross Margin: 0-45%

Small Percentage, Complete Dependence

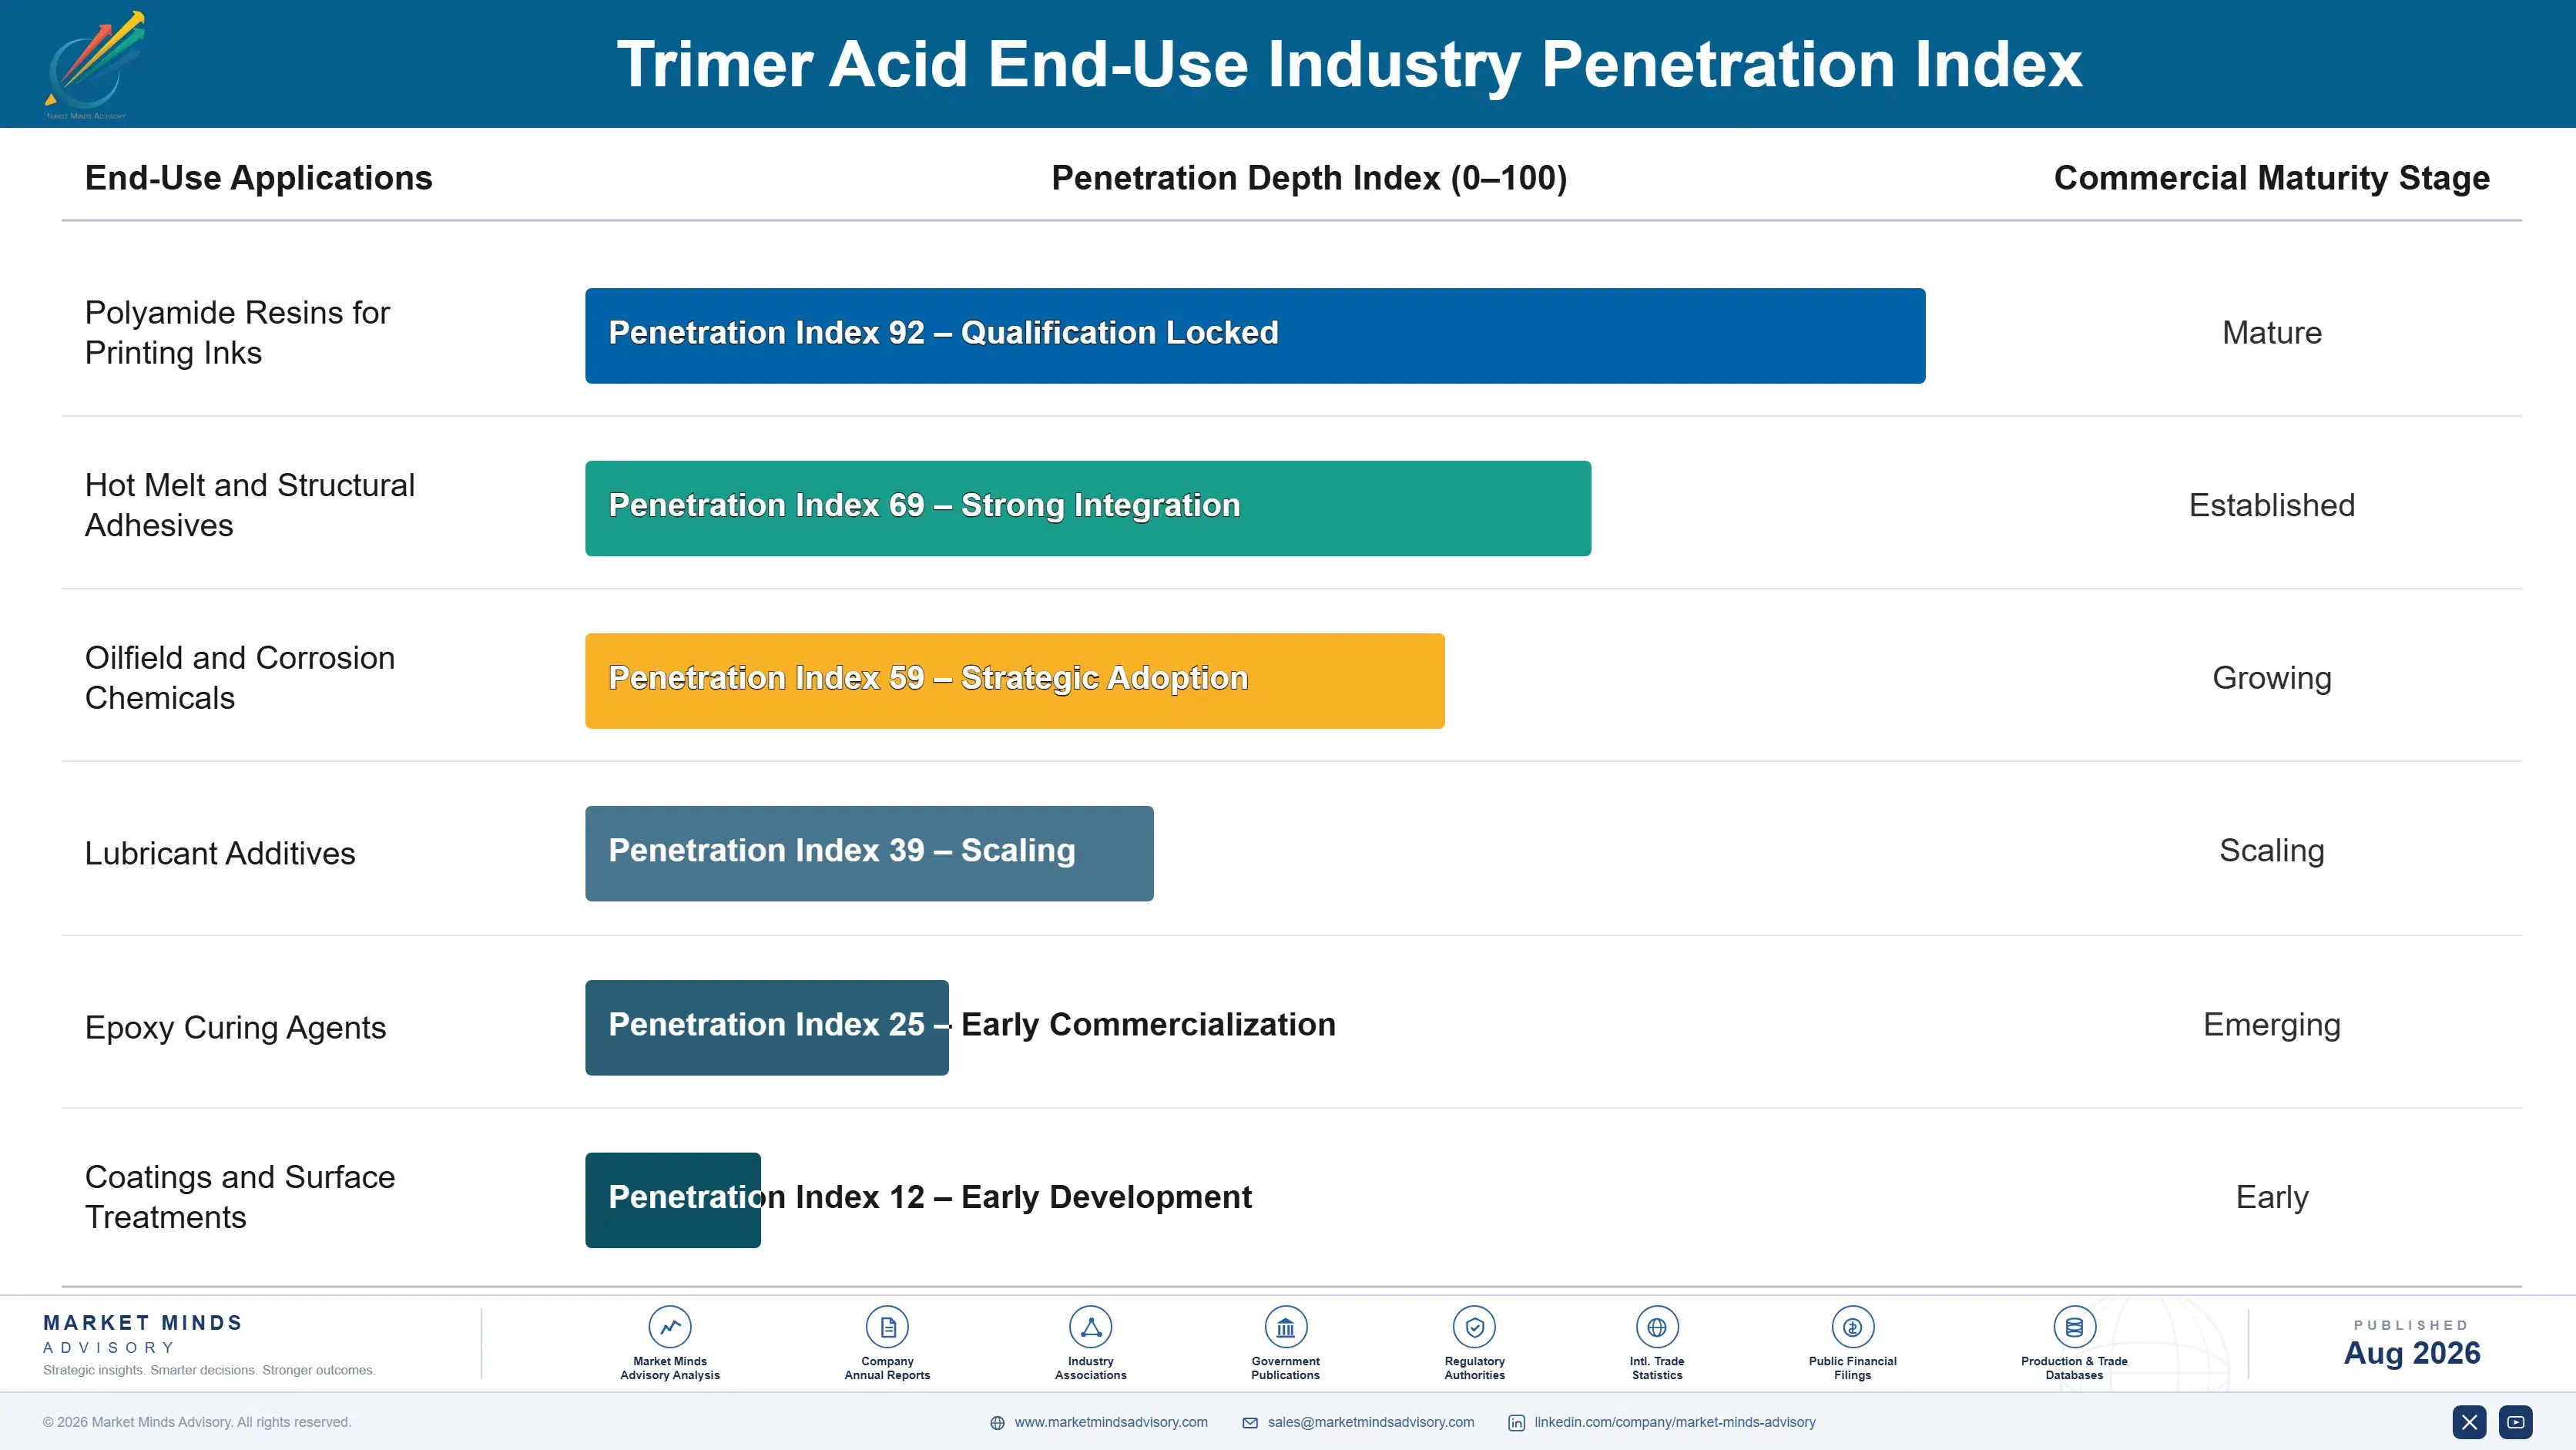
Demand here is small in volume and disproportionate in consequence, because trimer sits at roughly 6% of a polyamide resin formulation and controls properties the other 94% cannot deliver. A resin producer short of trimer cannot make the product at all, which is a very different exposure from being short of a bulk component. Consumption repeats with resin production and varies hardly at all. Being short of it stops production entirely.
Stickiness comes from requalification cost rather than from any commercial relationship. Removing trimer from a qualified resin takes around 14 months of reformulation and downstream customer approval, which nobody undertakes to save money on a component worth a few percent of the formulation. Grade changes between producers are similarly resisted, since properties differ enough to require testing.

The buying conversation has changed shape with repeated scarcity. A decade ago purchasing negotiated price on annual contracts. Increasingly the discussion is about allocation guarantees through dimer demand cycles, which is a conversation about certainty rather than cost. Producers still leading with delivered price are answering a question their customers stopped asking some years ago. Certainty replaced cost as the subject.
trimer-acid-market-trends-end-use-penetration-index-1787640229050

Where We Would Put Effort

These are among the four positions where our research anticipates prominent divergence between winners and laggards over the coming forecast period. Each is grounded in the demand model, the regulatory perimeter, and the announced capacity pipeline.
01 / SCARCITY ALLOCATION DISCIPLINE

Where the volume goes is the decision

Trimer acid arrives as roughly 15% of the dimerisation reactor output, and no premium that anybody offers creates a single additional tonne of the material. The only genuine commercial decision a producer actually holds is where that constrained volume gets directed. Formulators facing around 14 months of requalification work to remove it are entirely captive, and directing distilled and hydrogenated volume toward those captive positions, while letting the price sensitive uses go elsewhere, is the one lever that genuinely exists here.
02 / BIO-BASED CREDENTIAL CERTIFICATION

A free credential nobody has documented

The molecule derives entirely from renewable feedstock and carries 100% bio-based carbon content, which coatings and adhesive customers increasingly need formally documented in order to support their own product claims. Remarkably few producers currently certify it or even bother to communicate the property at all. Formal certification costs remarkably little and converts an inherent property into a specification requirement that no petrochemical alternative can satisfy, which is unusually cheap differentiation for a material that is already in short supply anyway.
03 / ALLOCATION CERTAINTY SELLING

They stopped asking about price

Weak dimer acid demand simply removes the trimer supply regardless of what trimer buyers happen to want, and formulators cannot reformulate inside about 14 months whatever the circumstances. Multi-year allocation agreements carrying volume certainty are worth considerably more to those buyers than any discount could be, and they stabilise producer offtake through dimer cycles. Suppliers still negotiating on delivered price alone are trading away the one thing customers genuinely value in exchange for the one thing they can comfortably live without.
04 / CONVERTING CAPACITY FOLLOWING

Demand follows resin plants, not economies

India grows fastest of any country covered at 8.4% as packaging ink, hot melt adhesive and oilfield chemical manufacturing all expand together at once, and trimer demand follows polyamide resin production directly at roughly 6% of each formulation. Suppliers still organised around the established coatings geographies are covering markets where converting volume stopped growing several years ago. Converting capacity announcements are published well ahead of any production and predict this particular demand considerably better than any general economic indicator does.

Engagement Snapshot From the Field

A live engagement with an industry participant carrying material or product regulatory and market exposure ahead of a defining policy shift, showing how our research translates into a defensible multi-year portfolio strategy.
MARKET MINDS ADVISORY · CLIENT ENGAGEMENT SUMMARY
Trimer Acid Producer Strategic Portfolio Review and Transition Roadmap 2026·Investment Scenario on Trimer Acid Exposure Evaluation 2025-26
CLIENT PROFILE
An oleochemical producer operating dimerisation capacity and supplying trimer acid to resin, lubricant and oilfield formulators across European and Asian markets, at annual revenue near 210 million dollars (client-reported, unverified by MMA). Allocation was managed by order sequence and bio-based certification was absent. Feedstock was purchased on the merchant market rather than integrated. Coverage was European.
STRATEGIC CHALLENGE
Recurring scarcity was damaging customer relationships while the client had no framework for deciding who received material during tight periods. Management wanted an allocation approach that reflected commercial value rather than whichever customer happened to order first. Scarcity periods were recurring more often than they once had. Something had to change.
MMA APPROACH
MMA quantified requalification cost across customer applications to establish which positions were genuinely captive, assessed bio-based certification requirements emerging in coatings specifications, modelled allocation scenarios against contribution margin, and mapped converting capacity growth against the client's commercial coverage. Interviews with 47 experts covered resin formulation, oleochemical production, coatings procurement and pulp industry economics.
KEY FINDINGS
  1. Customer positions differed enormously in captivity, with some facing more than a year of requalification and others able to substitute within a single quarter easily.
  2. Allocation by order sequence was systematically directing constrained volume toward the least captive and lowest contribution customers across every tight period examined.
  3. Bio-based certification was becoming a specification requirement among coatings customers and the client held the credential inherently without documenting or communicating it.
  4. Commercial coverage followed established European converting geography while the fastest growing resin production capacity sat in markets the client barely served at all.
CLIENT PROFILE
An oleochemical producer operating dimerisation capacity and supplying trimer acid to resin, lubricant and oilfield formulators across European and Asian markets, at annual revenue near 210 million dollars (client-reported, unverified by MMA). Allocation was managed by order sequence and bio-based certification was absent. Feedstock was purchased on the merchant market rather than integrated. Coverage was European.
STRATEGIC CHALLENGE
Recurring scarcity was damaging customer relationships while the client had no framework for deciding who received material during tight periods. Management wanted an allocation approach that reflected commercial value rather than whichever customer happened to order first. Scarcity periods were recurring more often than they once had. Something had to change.
MMA APPROACH
MMA quantified requalification cost across customer applications to establish which positions were genuinely captive, assessed bio-based certification requirements emerging in coatings specifications, modelled allocation scenarios against contribution margin, and mapped converting capacity growth against the client's commercial coverage. Interviews with 47 experts covered resin formulation, oleochemical production, coatings procurement and pulp industry economics.
KEY FINDINGS
  1. Customer positions differed enormously in captivity, with some facing more than a year of requalification and others able to substitute within a single quarter easily.
  2. Allocation by order sequence was systematically directing constrained volume toward the least captive and lowest contribution customers across every tight period examined.
  3. Bio-based certification was becoming a specification requirement among coatings customers and the client held the credential inherently without documenting or communicating it.
  4. Commercial coverage followed established European converting geography while the fastest growing resin production capacity sat in markets the client barely served at all.
RECOMMENDED STRATEGY
Phase 1: Phase one: build an allocation framework based on requalification captivity and contribution rather than on the sequence in which orders arrive. Phase 2: Phase two: obtain formal bio-based carbon certification, since coatings customers are converting it into a specification requirement regardless. The credential exists already. Phase 3: Phase three: reallocate commercial coverage toward markets where resin converting capacity is actually being built now. Historic geography stopped growing.
OUTCOME
The producer implemented a captivity based allocation framework during 2026 and contribution margin improved through the following scarcity period (client-reported, unverified by MMA). Bio-based certification was obtained, and coverage was reallocated toward expanding converting markets. Order sequence allocation was abandoned entirely across every territory served.

Frequently Asked Questions

Foundational context covering the market sizes, CAGR, scope, country, region and competition that inform every finding below. This section is provided to cover basics and most often pre-purchase conversations, answered from the MMA Primary Research Dataset.

What is the current size of the Trimer Acid Market?

MMA sizes it at USD 0.29 billion in 2025, rising to USD 0.30 billion in 2026. The figure covers trimerised fatty acid supplied as a chemical intermediate at producer selling value.

How large will the Trimer Acid Market be by 2036?

USD 0.47 billion by 2036, an incremental USD 0.17 billion over the 2026 base and an expansion multiple of 1.57 times. Processed grades carry most of that gain.

What is the CAGR for the Trimer Acid Market 2026 to 2036?

4.6% in the base case, with a bull case at 5.8% and a bear case at 3.4%. Dimer acid demand drives most of the spread, since it determines trimer availability.

Which segment is growing fastest?

Distilled high-purity trimer at 6.9%, half again the market rate of 4.6%. It meets colour and viscosity specifications that standard material cannot deliver consistently across production batches.

Who are the major companies in the Trimer Acid Market?

Kraton, Croda International, Oleon, Emery Oleochemicals and Florachem lead on dimerisation capacity. Fifteen further participants are profiled in the full report on the same basis.

Which country is growing fastest?

India at 8.4%, as packaging ink, hot melt adhesive and oilfield chemical manufacturing all expand at the same time and polyamide resin demand follows each.

Report Segmentation Architecture

The full report scope spans multiple orthogonal segmentation dimensions, with cross-tabulated demand data provided for each dimension pair. Coverage extends further to regional breakdowns, trend trajectories, and the competitive detail needed to support segment-level decision-making.

By Grade Supplied

  • Standard Trimer Acid
  • Distilled High-Purity Trimer
  • Hydrogenated Trimer Acid
  • Trimer Acid Esters
  • Trimer Acid Salts and Amine Derivatives
  • Certified Bio-Based Grades

By End-Use Industry

  • Polyamide Resins for Printing Inks
  • Hot Melt and Structural Adhesives
  • Oilfield and Corrosion Chemicals
  • Lubricant Additives
  • Epoxy Curing Agents
  • Coatings and Surface Treatments

By Commercial Dimension

  • Direct Formulator Supply
  • Multi-Year Allocation Agreements
  • Distributor and Trader Channels
  • Toll Processing Arrangements
  • Spot Market Purchase
  • Technical Development Partnerships

By Region

  • North America
  • Western Europe
  • East Asia
  • South Asia and Pacific
  • Latin America
  • Middle East and Africa
  • Eastern Europe

Scope, Methodology, and Coverage

Every figure in this report is reproducible from documented input assumptions. The scope below maps the historical period, the forecast horizon, the segmentation dimensions, and the countries covered, alongside the underlying primary and qualitative methodology.
Historical Period
2020 to 2025
Forecast Period
2026 to 2036
Base Year
2025 (USD billions; MMA Primary Research Dataset, August 2026)
Market Definition
Trimerised fatty acid produced through catalytic oligomerisation of unsaturated fatty acids, covering standard trimer acid, distilled high-purity trimer, hydrogenated trimer acid, trimer acid esters, trimer acid salts and amine derivatives, and certified bio-based grades. Measured at producer selling value. Dimer acid and monomer fractions, tall oil fatty acid and other feedstocks, polyamide resins and finished formulations, and unmodified vegetable oils are excluded from scope.
Quantitative Units
USD billions (current prices); metric tonnes shipped; USD per tonne by grade
Segmentation Dimensions
Grade supplied; end-use industry; commercial dimension; region
Regions Covered
North America, Western Europe, East Asia, South Asia and Pacific, Latin America, Middle East and Africa, Eastern Europe
Countries Covered
United States, Canada, Mexico, Finland, Sweden, Germany, Netherlands, Belgium, China, Japan, South Korea, Taiwan, India, Indonesia, Australia, Brazil, Argentina, Saudi Arabia, South Africa, Poland
Key Companies Profiled
Kraton, Croda International, Oleon, Emery Oleochemicals, Florachem, Ingevity, Forchem, Respol Resinas, Anqing Hongyu Chemical, Jiangsu Yonglin Oleochemical, Nissan Chemical, Chemical Associates, Vertellus, Georgia-Pacific Chemicals, Harima Chemicals, Eastman Chemical, Cargill, BASF, Nouryon, Wilmar International
Quantitative Methodology
Primary survey, n=3,800 respondents, Q4 2025, six countries; demand-side model with trade association cross-validation
Qualitative Methodology
47 expert interviews, Q4 2025; applied to validate demand model assumptions, identify emerging dynamics, and assess competitive positioning
Report Format
PDF and XLSX data workbook (Word format preview document)
Publisher
Market Minds Advisory
Report Code
MMA-2026-CHM-148
Published
August 2026
Contact
sales@marketmindsadvisory.com | www.marketmindsadvisory.com

Purchase the full Trimer Acid Market Report (2026 to 2036).

The full report treats trimer acid as a material whose supply nobody decides, because it emerges as a fixed fraction of a reaction run for something else entirely. It sizes all six grades independently through 2036, quantifies the reactor ratio against demand, and models feedstock availability against pulp mill energy economics. Regional chapters cover all seven regions with converting capacity tracked separately from general industrial activity. Competitive profiling covers 20 participants on one consistent production capacity basis. Allocation practice is benchmarked across producers throughout the analysis.
Six grades sized independently through 2036
Reactor output ratio quantified against downstream trimer demand
Feedstock availability modelled against pulp mill energy economics
Converting capacity tracked separately from general industrial activity regionally
Requalification cost measured across customer application types
Twenty participants profiled on one consistent capacity basis

Built For The People Who Decide

From boardroom strategy to bench-side execution, this report is read cover-to-cover by leaders shaping the next decade of their industry, turning demand scenarios, market dynamics and valuation benchmarks into decisions.
CXOs/ Presidents/ VPs/ Managers
M&A and Corporate Development
Strategy Teams and R&D Heads
Procurement and Product Directors
Regulatory and Compliance Leaders
Investor Relations and Equity Analysts