Market Minds Advisory
Transportation Composites Market

Transportation Composites Market: cycle time economics, precursor integration and end-of-life recovery

Composites win every engineering argument on mass and lose most commercial ones on cycle time, which is why a material proven in aerospace still struggles to reach the volume car lines that need it most.

Lead Analyst

Bilal Shaikh

Published

September 2026

Make Smarter Decisions with Customized Research Insights

Request a free sample report and evaluate market opportunities, growth trends, and competitive dynamics relevant to your business needs.

2025 MARKET VALUE$18.4BMarket Size 2025
2036 FORECAST VALUE$42.0BBase Case , 2026 to 2036
CAGR 2026 TO 20367.8 %Bull 9.1% / Bear 6.5%
INCREMENTAL OPPORTUNITY$22.2BNet 10- year value creation
EXPANSION MULTIPLE2.12x2036 value over 2026 base
Strategic Levers
M&A Pipeline
Regional Outlook
Country Rankings
Competitive Intelligence
Segmental Deep-dive
Call-Us : 91 93563 13602

Executive Snapshot and Market Trajectory

Composites keep winning the engineering argument and losing the manufacturing one. A carbon fibre component saves roughly a third of the mass of the metal part it replaces, which every vehicle programme wants, and then takes far longer to mould than any stamping line can reasonably tolerate at volume.
Growth concentrates in carbon fibre reinforced thermoplastics, expanding at 11.7%, where a melt-processable matrix cuts moulding cycles toward the three minutes that automotive series production actually requires and allows welding and reprocessing that thermosets never permitted. East Asia holds 32% of value, the largest regional share, because Chinese vehicle manufacture, Japanese carbon fibre capacity and Korean converting operations all sit together in a way that no other region comes close to matching.
The supplier base is fragmented across a wide range of material classes, with the top five holding 28% of composite supply volume, and it divides between integrated fibre producers, independent converters, and tier one automotive and aerospace suppliers with their own capability. Competition runs on process economics rather than on measured material properties. End-of-life recovery regulation is the force now reshaping how programmes specify these materials.
Market Definition
Transportation composites comprise fibre reinforced polymer materials supplied for vehicle, aircraft, rail and marine applications, spanning glass fibre reinforced thermoset and thermoplastic, carbon fibre reinforced thermoset and thermoplastic, natural fibre reinforced, and aramid and hybrid reinforced composite classes. Sizing covers composite material and prepreg sold to converters and manufacturers at realised delivered price. Reinforcement fibre and resin sold separately for non-transportation use, metallic and ceramic materials, moulding and curing equipment, adhesives and coatings, and finished vehicles or aircraft all fall outside scope.
Base Year Value
$18.4B in 2025 (MMA Primary Research Dataset, August 2026)
Forecast Period
2026 to 2036, eleven discrete annual values
CAGR
7.8% base case. Bull 9.1%. Bear 6.5%.
Fastest Growth Segment
Carbon Fibre Reinforced Thermoplastic: 11.7% CAGR
Fastest Growth Country
India: 10.6% CAGR
Fastest Growth Region
South Asia and Pacific: 10.1% CAGR
Largest Region
East Asia: 32% of 2025 global value
Market Leaders
Toray Industries, Hexcel, Teijin, Mitsubishi Chemical Group and Syensqo lead on composite supply volume across reinforcement and matrix classes. Source: MMA Primary Research Dataset, July 2026.
Primary Survey
n=3,800 procurement and R&D decision-makers, Q4 2025, six countries
Methodology
Demand-side build-up, cross-validated against public data, 47 expert interviews

Transportation Composites Market Forecast Scenarios

transportation-composites-market-trends-size-forecast-scenario-1787310892969
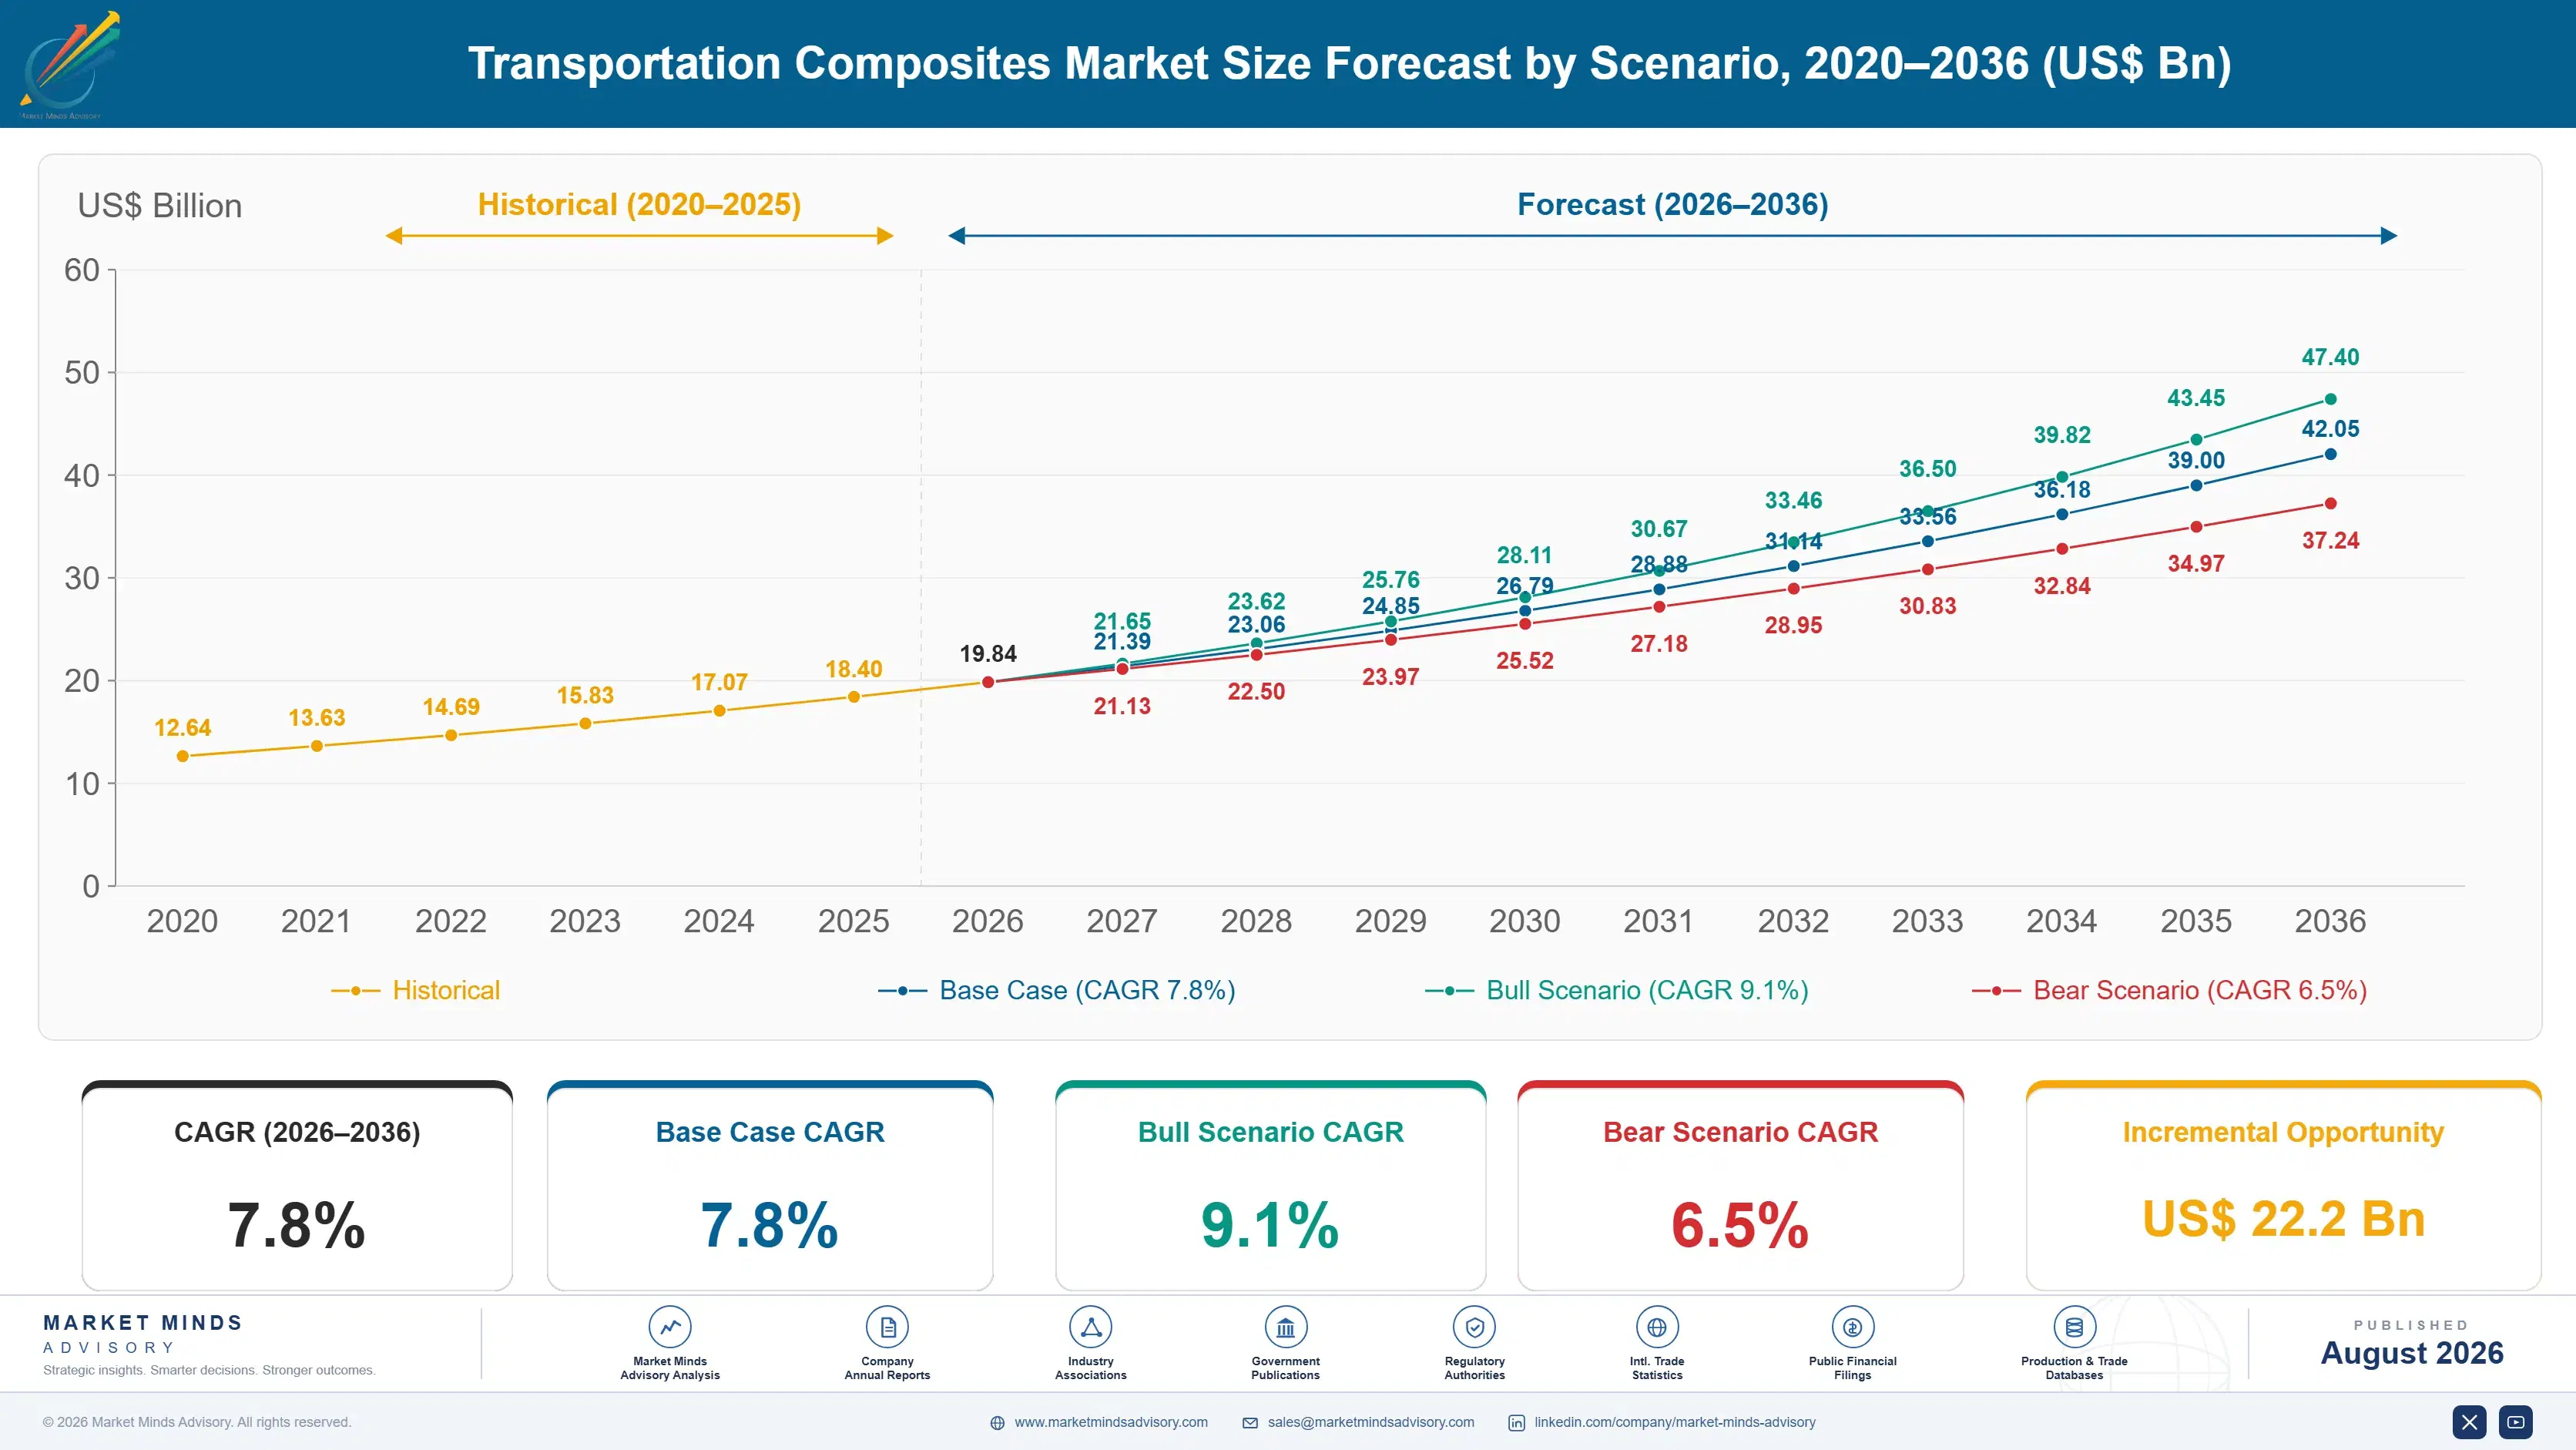
Growth of 6.6% across 2020 to 2025 hid two markets moving in opposite directions. Aerospace composite demand collapsed through 2020 as build rates fell and then recovered slowly against supply chain constraints rather than order books. Automotive composite volume rose steadily throughout, pulled by electric vehicle battery enclosures and by mass reduction requirements that grew more pressing as battery weight increased faster than energy density did.
The base case at 7.8% rests on three mechanisms. Battery electric vehicle mass penalties keep raising the value of every kilogram removed elsewhere in the structure, and composites remove more per unit cost than aluminium does. Aircraft build rates keep recovering toward and beyond pre-2020 levels on programmes already designed around composite primary structure. And thermoplastic matrix systems keep cutting cycle times, which opens vehicle volumes that thermoset chemistry could never reach.
The bull case at 9.1% turns on thermoplastic composite cycle times reaching parity with metal stamping on high-volume components, since that single development would open body and chassis applications currently closed on manufacturing grounds. The bear case at 6.5% turns on aluminium. Continued improvement in aluminium forming, joining and recycled content economics keeps a credible competitor in every mass reduction decision made.

Transportation composites: cycle time against fibre cost

Two numbers decide almost every composite application in transportation, and neither appears on a material datasheet. A carbon fibre component removes roughly 32% of the mass of the metal part it replaces, which is worth a great deal in an electric vehicle carrying several hundred kilograms of battery. And a thermoset moulding cycle runs far longer than the three minutes a volume vehicle line can allow, which is where most of these conversations quietly end.
TOP FIVE CONCENTRATION28%Share of global composite supply volume held collectively
REINFORCEMENT FIBRE SHARE48% of COGSPortion of delivered cost tied to reinforcement fibre
AUTOMOTIVE APPLICATION SHARE44% of volumeLargest single application by consumed composite tonnage globally
ACHIEVED MASS REDUCTION32%Mass saved against an equivalent metal component design
REQUIRED MOULDING CYCLE3 minutesCycle needed to reach automotive series production volumes
END-OF-LIFE RECOVERY RATE12%Portion of composite mass currently recovered after vehicle scrappage
Cost structure sits upstream in the fibre. Reinforcement accounts for roughly 48% of delivered composite cost, and carbon fibre carries an energy-intensive carbonisation step that no process improvement has yet made cheap. Resin, converting and quality release make up the remainder, and none of it scales down the way programme engineers assume when they build a business case at prototype volumes.
Applications divide according to whether cycle time or certification governs the decision. Automotive takes 44% of volume and is decided almost entirely on process economics. Aerospace, rail and marine pay considerably more per kilogram because qualification, damage tolerance and fire performance together limit the field of acceptable materials very sharply indeed.
"Every composite supplier arrives with property data showing their material beats aluminium, and every vehicle programme engineer already knows that. What decides the programme is whether the part comes out of the tool inside the cycle time, and remarkably few suppliers lead with that number."
Director, Advanced Materials and Mobility Practice · MMA Chemicals and Materials

Market Trends

Thermoplastic matrix systems opening volume automotive applications

Thermoplastic composites melt and reform rather than cure irreversibly, which cuts moulding cycles toward the three minutes a volume vehicle line demands and allows welding, reprocessing and scrap recovery that thermosets never permitted. Battery enclosures, load floors and front-end structures are converting first, since those parts carry mass penalties that matter most in electric platforms. Material cost remains higher than equivalent thermoset systems, so the case rests entirely on cycle time and end-of-life recovery. Suppliers who cannot demonstrate cycle performance on production tooling do not reach the shortlist at all.
Market Impact: Removes 32% of component mass
End-of-life regulation reshaping material selection in vehicle programmes

European end-of-life vehicle rules and recycled content proposals treat composites as a problem material, since only around 12% of composite mass is currently recovered after scrappage and thermoset chemistry cannot be reprocessed at all. That regulatory position is beginning to appear in programme material selection long before any rule takes effect, because vehicle manufacturers plan platforms a decade ahead. Thermoplastic and natural fibre systems benefit directly from being recoverable. Suppliers with recovered fibre streams and documented recycling routes are being asked for data that most composite producers simply cannot provide.
Market Impact: Commands 4 times automotive kilogra

Market Opportunities and Growth Drivers

Battery electric platforms raising the value of removed mass

An electric vehicle carries several hundred kilograms of battery, and every kilogram removed elsewhere in the structure either extends range or allows a smaller and cheaper pack. That arithmetic gives mass reduction a monetary value that combustion platforms never assigned to it, and composites remove roughly 32% of component mass against metal at a cost per kilogram saved that beats aluminium in several applications. Battery enclosures, load floors and closure panels are where most of the conversions are actually happening today. Automotive already accounts for 44% of transportation composite volume worldwide.
Market Impact: Exceeds 3 minute volume cycle limit

Aircraft build rates recovering on composite-intensive platform designs

Current generation single aisle and wide body aircraft were designed around composite primary structure, so every airframe delivered consumes composite whether or not anybody makes a new material decision. Build rate recovery toward and beyond pre-2020 levels therefore translates directly into composite demand, constrained by supply chain capability rather than by order books, which remain historically full. Qualification on these programmes was completed years ago and cannot be revisited, which makes the demand unusually predictable. Aerospace pays several times automotive pricing per kilogram for that certified position, and it does so without much argument.
Market Impact: Carries 48% of delivered composite

Market Restraints and Challenges

Moulding cycle times excluding composites from high volume production

Thermoset composite curing takes considerably longer than the three minute cycle a volume vehicle line allows, and no amount of tooling investment changes the chemistry of an exothermic cure. The root cause is that crosslinking takes time and generates heat that must be managed, so faster cure means either thinner sections or accepting residual stress. Commercially this confines thermoset composites to low volume and premium programmes. Participants are responding with thermoplastic matrix systems, fast-cure resin chemistries, compression moulding of preforms and hybrid designs that use composite only where mass matters most.
Market Impact: Reaches 3 minute moulding cycle tim

Carbon fibre cost holding applications back despite proven performance

Carbon fibre remains expensive because the acrylonitrile precursor is petrochemical and the carbonisation step is genuinely energy intensive, carrying roughly 48% of delivered composite cost between them. The root cause is thermodynamic rather than industrial: converting precursor to carbon requires sustained high temperature under controlled atmosphere, and decades of process work have trimmed rather than transformed that energy burden. Commercially this keeps carbon composites out of applications where the mass saving does not justify the price. Producers are responding with larger tow sizes, alternative precursors and recovered fibre streams into less demanding duty.
Market Impact: Recovers only 12% of composite mass
3 additional market trends, 4 additional growth drivers, and 2 additional restraints and challenges are covered in the full report. Contact sales@marketmindsadvisory.com to access the complete intelligence.

Segment CAGR and Growth Architecture

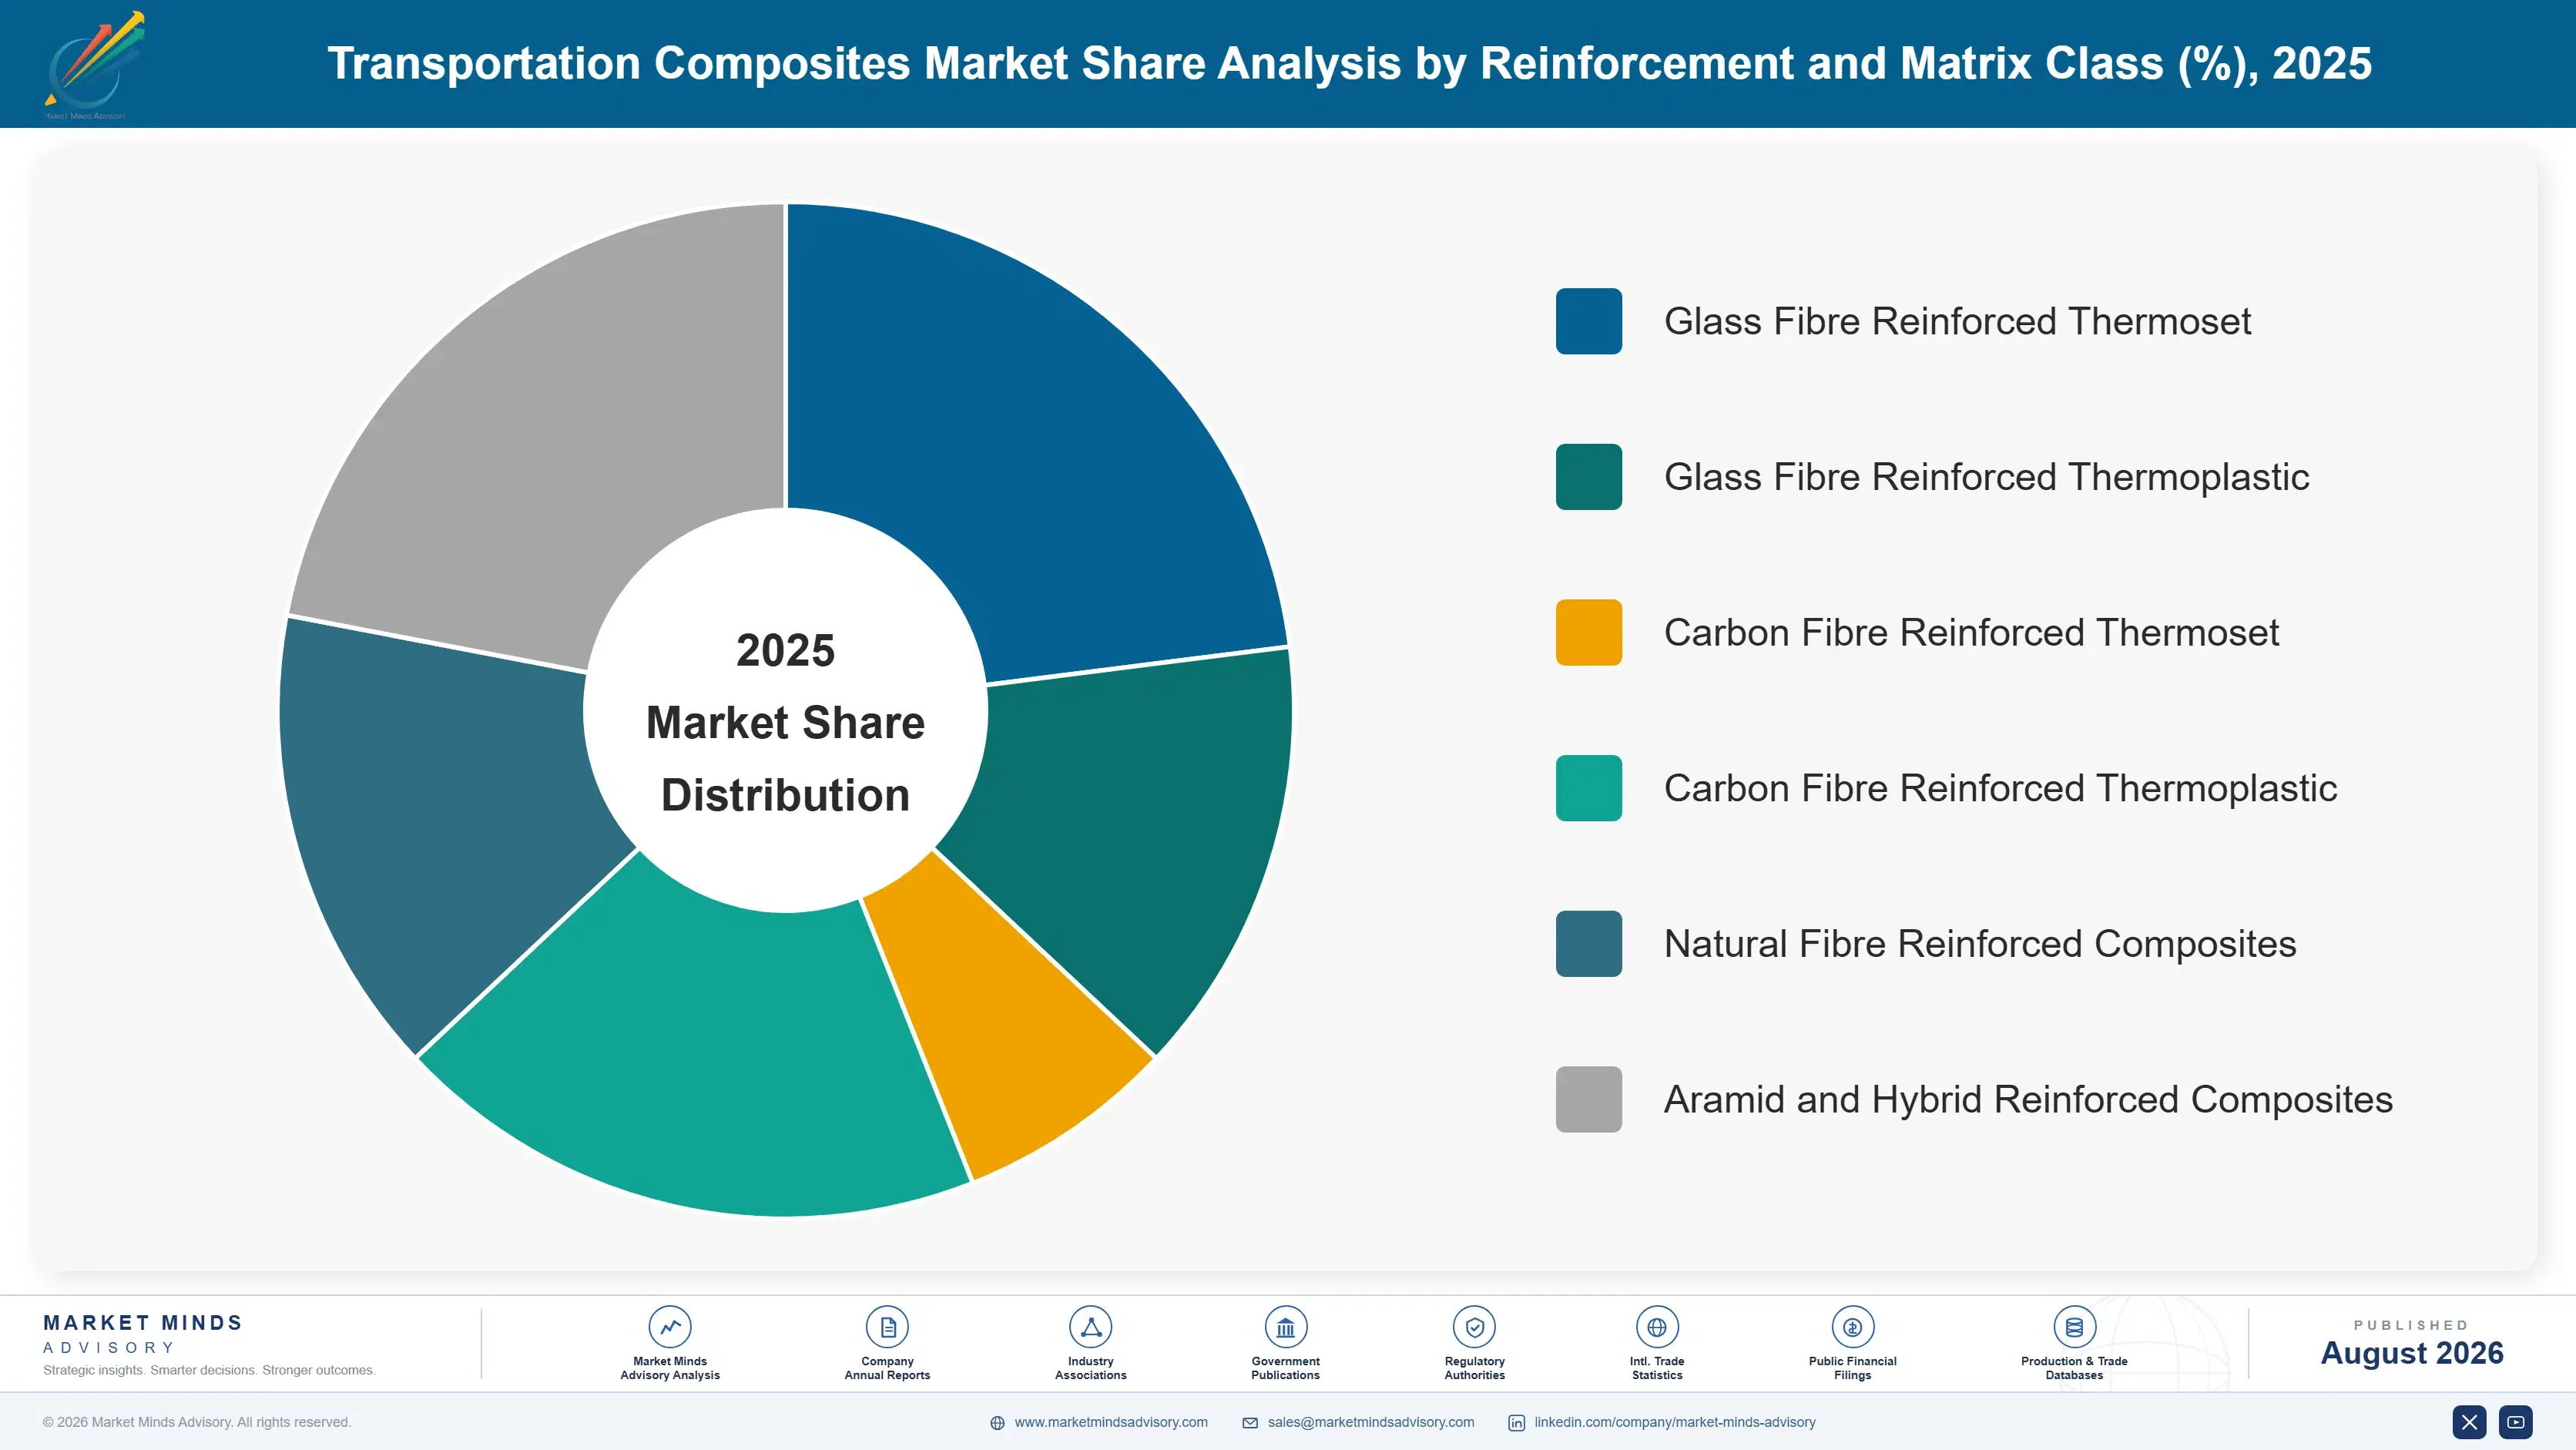
Segmentation follows the reinforcement and matrix combination, because that pairing alone determines mass performance, achievable cycle time, recyclability, qualification burden and delivered cost all at once. Six material classes cover the whole market, running from the established glass reinforced thermosets through both carbon systems to the natural fibre and hybrid classes now growing quickly.
transportation-composites-market-trends-market-share-analysis-1787310893537

Carbon Fibre Reinforced Thermoplastic

Expanding at 11.7%, a full 1.50 times the market rate, because a melt-processable matrix cuts moulding cycles toward the three minutes that volume vehicle lines demand while allowing welding, reforming and scrap recovery that thermoset chemistry never permitted. Battery enclosures, load floors and front-end assemblies convert first, since electric platforms assign a real monetary value to every single kilogram removed from the structure. Material cost sits above equivalent thermoset systems, so the commercial case rests entirely on cycle time and end-of-life recovery rather than on any property advantage. Suppliers unable to demonstrate cycle performance on production representative tooling do not reach the shortlist at all, whatever their property data shows.
CAGR 11.7%

Natural Fibre Reinforced Composites

Growing at 10.4% annually on flax, hemp, kenaf and cellulose reinforced systems used in vehicle interior panels, door trim, parcel shelves and increasingly in semi-load-bearing components too, wherever absolute stiffness is not the governing requirement. The commercial driver here is recycled content and end-of-life recovery rather than any performance advantage, since regulation currently treats bio-based reinforcement considerably more favourably than either glass or carbon. Mass reduction against filled thermoplastics is real though fairly modest, and the acoustic performance is genuinely better than either alternative. European vehicle programmes lead adoption here because the regulatory pressure originates there, and Asian interior suppliers have followed steadily in order to serve export production requirements.
CAGR 10.4%
Full segment breakdown across 6 segments available in the complete report.

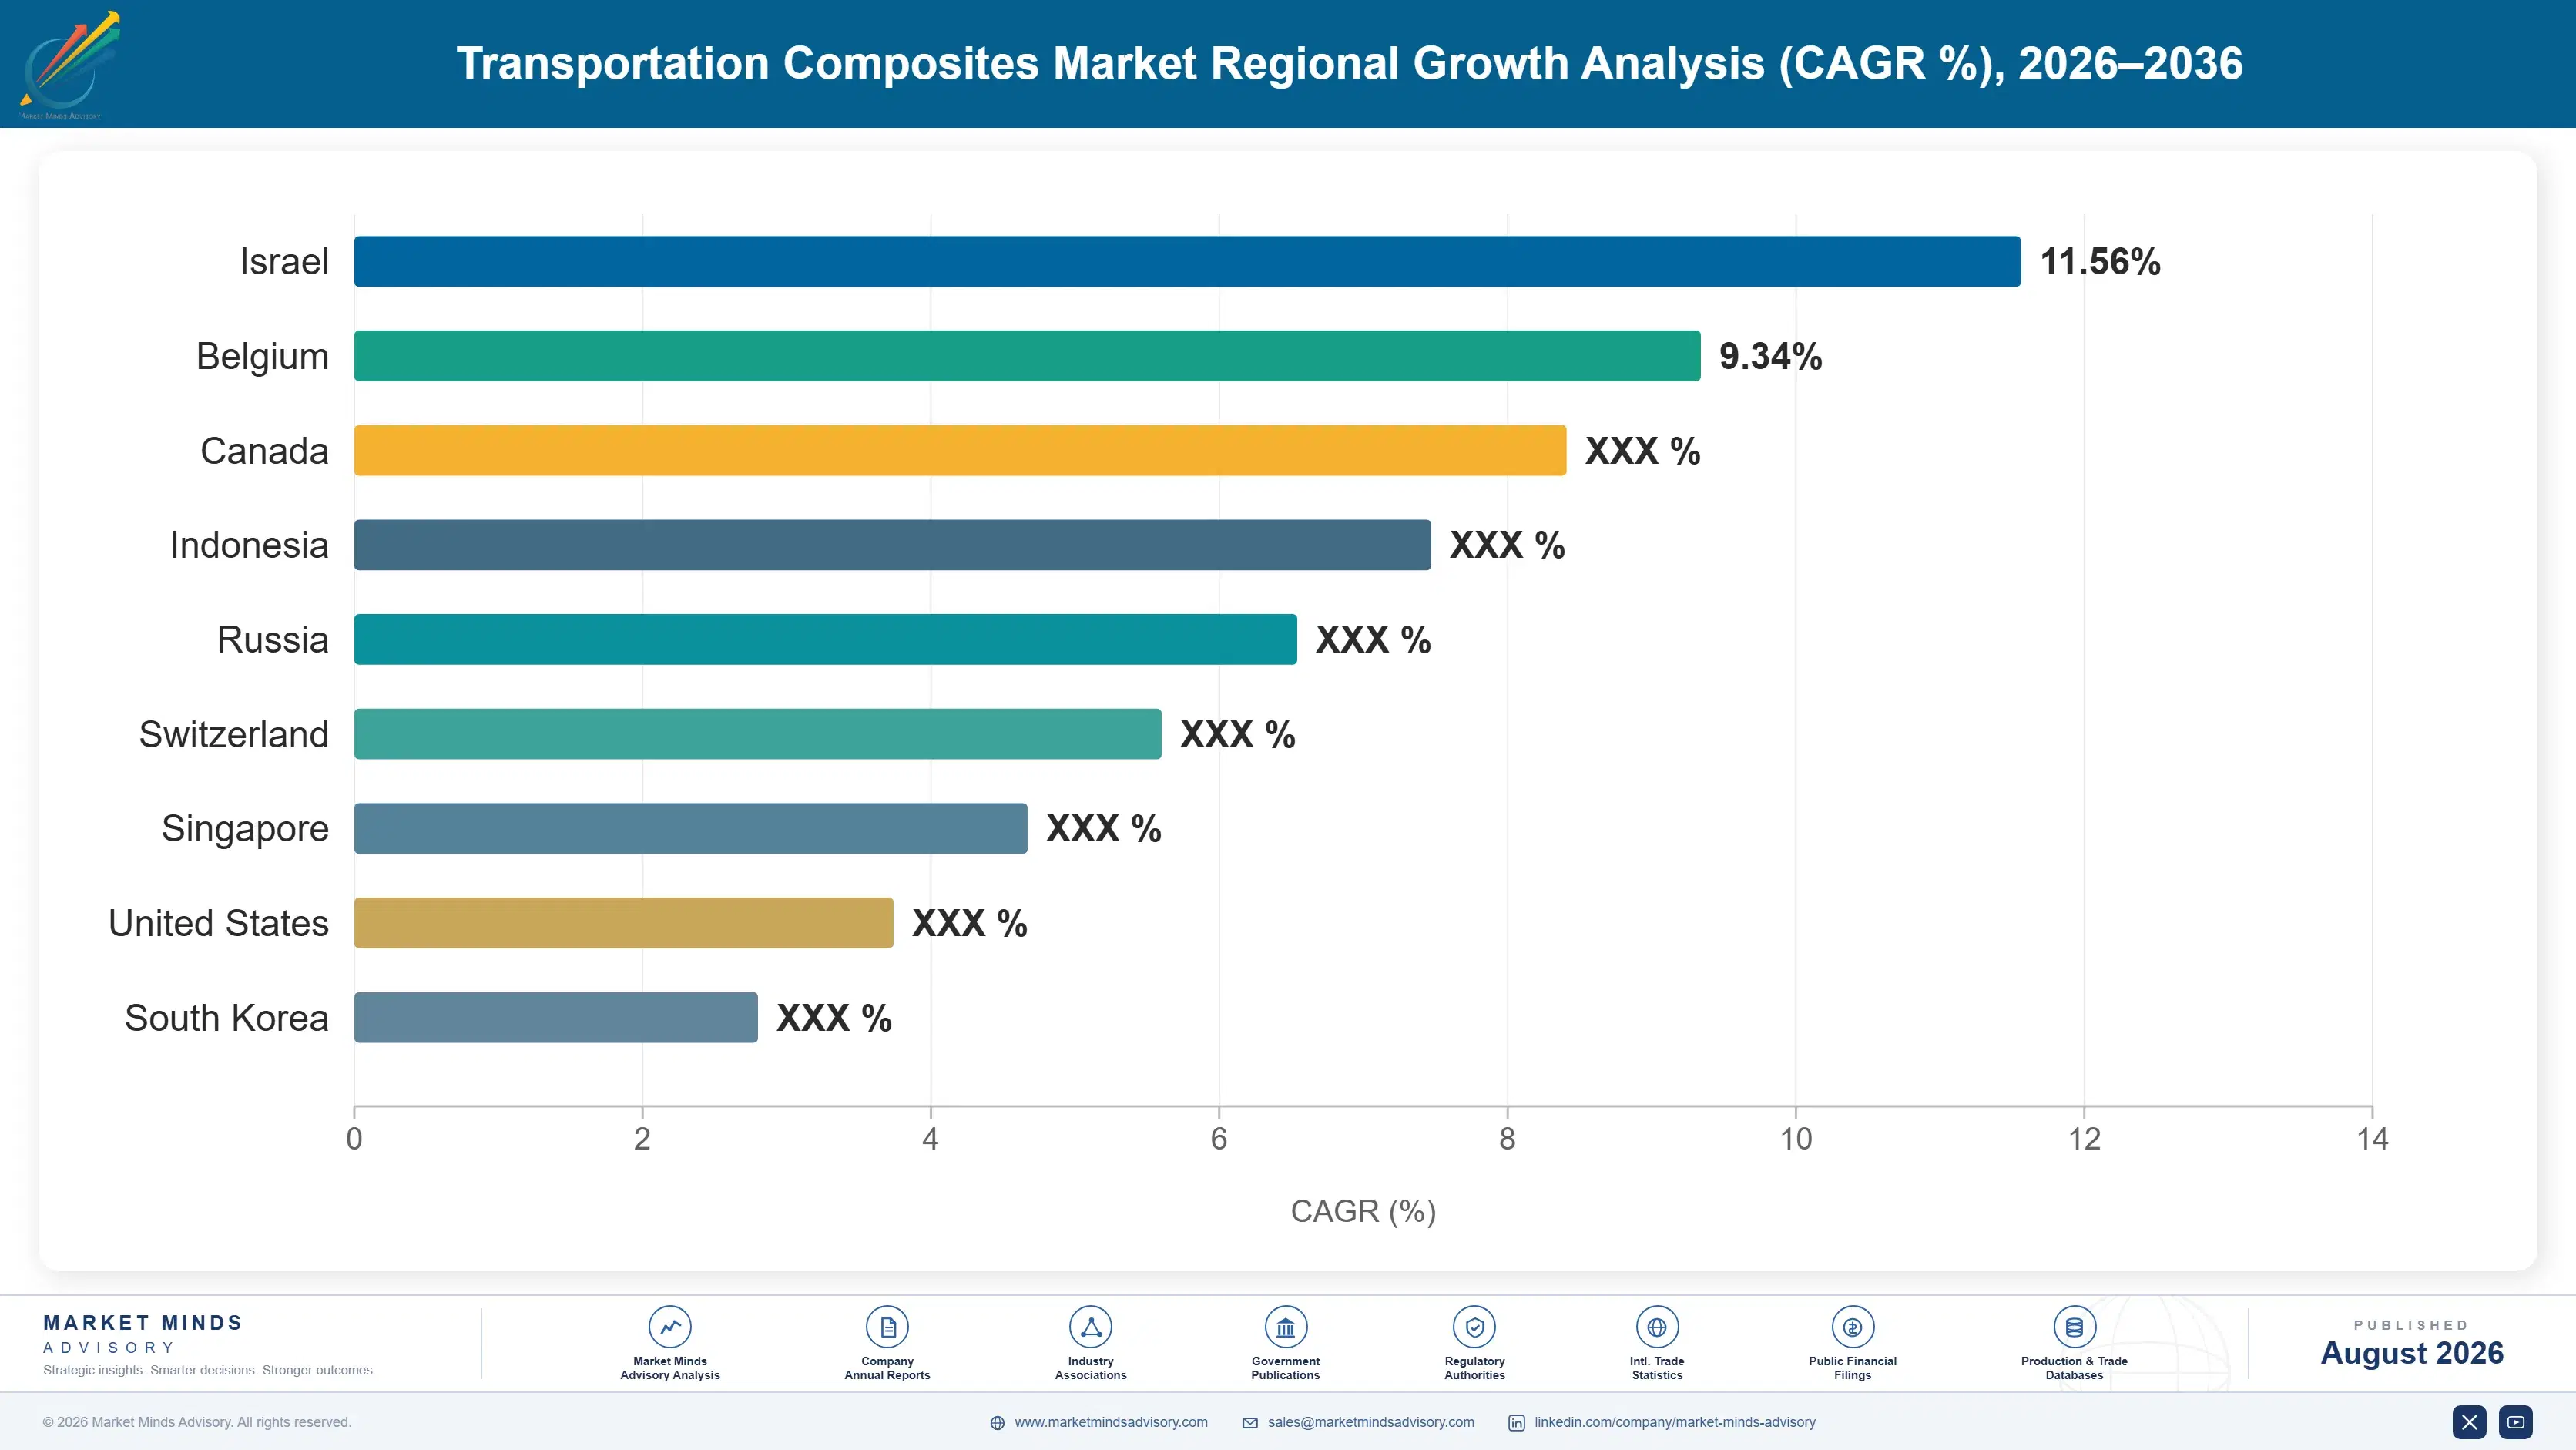
Regional Architecture and Country Demand Map

Composite demand tends to follow wherever the vehicles and aircraft are actually built rather than where they eventually get sold, so the geographic picture simply reflects assembly footprints and the reinforcement fibre capacity which has grown up alongside those footprints across several decades of steady investment.

East Asia

Thirty-two percent of global value here, comfortably the largest regional share, because Chinese vehicle manufacture, Japanese carbon fibre capacity and Korean converting operations all sit together in a way that no other region matches at any comparable scale. Note: this exceeds the standard regional band because both carbon fibre production and vehicle assembly are concentrated here to a degree that no demand-side measure of the market would properly capture. Toray, Teijin and Mitsubishi between them hold the principal technology positions in both carbon fibre precursor and carbonisation. Growth of 8.7% here runs above the global rate, supported by Chinese electric vehicle production and by regional aerospace supply chain development proceeding together.
Share: 32% | CAGR: 8.7% (2026 to 2036)

North America

Twenty-six percent of global value here, weighted heavily toward aerospace primary structure, where certified positions on current generation platforms generate genuinely predictable demand, and toward automotive programmes concentrated mainly in the light truck and premium vehicle segments. Domestic carbon fibre and glass fibre capacity is genuinely substantial, and the aerospace qualification depth found here is comfortably the strongest anywhere in the world. Wind and general industrial composite demand shares much the same converting base, which improves asset loading for regional suppliers considerably across the cycle. Growth of 7.2% here reflects aircraft build rate recovery alongside electric vehicle programmes now specifying composite battery enclosures and load floors at steadily rising volume.
Share: 26% | CAGR: 7.2% (2026 to 2036)
Regional intelligence for 5 additional markets available in the complete report: Western Europe, South Asia and Pacific, Latin America, Middle East and Africa, Eastern Europe. Contact sales@marketmindsadvisory.com.
transportation-composites-market-trends-country-cagr-analysis-1787310894059

Where transportation composite margin actually sits

Four commercial positions separate suppliers earning engineered material economics from those quoting kilograms of prepreg against a property datasheet. Each one of them rests on something a competitor cannot copy quickly: demonstrated cycle performance, a certified platform position, genuine precursor integration, or else a recovered fibre stream that nobody else has bothered to build.

Demonstrate cycle time on production tooling first

Every supplier arrives with property data proving the material beats aluminium, which programme engineers already accept and have accepted for twenty years. Suppliers demonstrating cycle performance on production representative tooling, with scrap rates and takt time measured rather than modelled, realise roughly 30% above competitors leading with property comparisons. The trial itself costs tooling time rather than any real capital outlay. Most suppliers avoid it because a production trial exposes exactly how far their cycle sits from what the line requires, which is precisely the information the customer actually needs to see.
Market Impact: Realises roughly 30% above property

Certify into aerospace platform programmes at design stage

Aerospace material qualification runs close to four years across coupon, element and component testing, and the material named in the type certificate then supplies that programme for its entire production life, which can comfortably exceed twenty years. Suppliers achieving certification capture roughly 8 times the lifetime revenue of those bidding into secondary structure afterwards. Engagement therefore has to begin during airframe design work rather than after first flight. Aerospace pays several times automotive pricing per kilogram precisely because that position cannot be competed away at all once the certificate is issued.
Market Impact: Captures roughly 8 times the lifeti

Integrate precursor supply for carbon fibre production

Acrylonitrile precursor and carbonisation energy together carry roughly 48% of delivered composite cost, and producers buying their precursor merchant pay a margin to somebody who may well also compete downstream against them. Integrated producers run roughly 22% below merchant precursor buyers on delivered fibre cost, and that gap widens whenever acrylonitrile tightens on petrochemical cycles unrelated to composite demand. Building carbonisation capacity without first securing the precursor position has been the recurring error right across this industry. Several announced capacity projects never reached economic operation for exactly that reason and nothing else.
Market Impact: Runs roughly 22% below merchant pre

Build recovered fibre streams before regulation demands them

Only around 12% of composite mass is currently recovered after vehicle scrappage, and European end-of-life rules are already appearing in programme material selection a decade before they take effect. Suppliers holding documented recovered fibre streams and recycling routes hold roughly 3 times the addressable position of those who cannot answer the question at all. Recovered fibre also serves less demanding interior and industrial duty at genuinely attractive cost. The capability is collection relationships and process development rather than heavy capital, and the good collection positions are being quietly established right now.
Market Impact: Holds roughly 3 times the addressab

Who Controls the Margin Pool

Concentration is moderate across a wide range of material classes, with the top five holding 28% of composite supply volume, the basis on which every participant here is assessed. Toray and Hexcel lead through integrated fibre production combined with aerospace certification depth, while the challenger group spans glass fibre majors, independent converters, tier one automotive suppliers with in-house composite capability and Chinese producers scaling carbon fibre capacity quickly.
Competition currently runs on process economics, certified platform positions and precursor integration rather than on measured material properties, which are comparable between credible suppliers. Cycle time demonstrated on production tooling decides automotive awards, while type certificate positions decide aerospace ones and cannot be revisited afterwards. Recovered fibre capability has become a live commercial dimension rather than a sustainability report item.

Emerging pressure comes from two directions at once. Chinese carbon fibre capacity has scaled quickly and competes hard in industrial and automotive grades even while aerospace qualification remains out of reach. And thermoplastic matrix systems favour suppliers with polymer compounding depth rather than prepreg heritage, which means rankings in the fastest growing segment may shift toward companies whose origins lie in plastics rather than in composites.
transportation-composites-market-trends-company-positioning-matrix-1787310894582

Competitive Moat and Risk Dimensions

TORAY INDUSTRIES

Moat: Precursor integration and aerospace certification

Integration from acrylonitrile precursor through carbonisation to prepreg, combined with certified positions on current generation aircraft programmes, gives Toray a position that competitors cannot assemble at any speed. Certification cannot be bought, and precursor integration removes roughly a fifth of delivered fibre cost against merchant buyers who must accept whatever the market charges.
TORAY INDUSTRIES

Risk: Thermoset heritage against thermoplastics

Deep capability in thermoset prepreg does not transfer automatically to thermoplastic matrix systems, where polymer compounding and melt processing knowledge govern instead and where the fastest growth is now happening. Companies arriving from the plastics side hold capability Toray would need to build or buy, and automotive volumes are exactly where thermoplastics are winning.
HEXCEL

Moat: Aerospace qualification depth and breadth

Certified material positions across a very wide range of aircraft programmes give Hexcel demand that arrives regardless of any new commercial decision, since every airframe built consumes what its type certificate specifies. That position generates predictable revenue through cycles that damage suppliers dependent on winning fresh business, and it took decades of qualification work to assemble.
HEXCEL

Risk: Aerospace cycle concentration exposure

Revenue weighted heavily toward aerospace leaves Hexcel exposed to build rate cycles it does not influence, as 2020 demonstrated when composite demand fell far faster than any material decision would suggest. Automotive and industrial diversification requires cycle time economics and cost positions quite different from those aerospace qualification rewards, which is an awkward capability shift.

Players Tracked

Prominent Players

Toray Industries
Hexcel
Teijin
Mitsubishi Chemical Group
Syensqo

Other Key Players

SGL Carbon
Owens Corning
Johns Manville
Nippon Electric Glass
China Jushi
Chongqing Polycomp International
Gurit
Plasan Carbon Composites
Continental Structural Plastics
Hengshen
Zoltek
Kordsa
Porcher Industries
Exel Composites
Avient

Recent Developments

MARCH 2025

Thermoplastic composite battery enclosure reaches series production

A vehicle manufacturer moved a thermoplastic composite battery enclosure design into full series production, citing measured moulding cycle times fully compatible with existing production line takt and end-of-life recovery characteristics that the thermoset alternative then under evaluation could not offer at any price whatsoever anywhere.
Signal: Cycle time and recoverability rather than
JULY 2025

Carbon fibre producer commissions integrated precursor capacity

A carbon fibre producer commissioned its own acrylonitrile precursor capacity alongside its existing carbonisation lines at the same manufacturing site, thereby removing a merchant precursor purchase that had exposed its delivered fibre cost to petrochemical cycles entirely unrelated to any movement in composite demand itself.
Signal: Precursor integration is now becoming the
NOVEMBER 2025

End-of-life rules pull recovered fibre requirements into programmes

Vehicle manufacturers began formally requesting documented recovered fibre content and end-of-life recovery routes during material selection for platforms launching after 2030, well ahead of any actual regulation taking effect anywhere, and several established composite suppliers proved entirely unable to answer the question in any form at all.
Signal: Recovery documentation is now entering pro

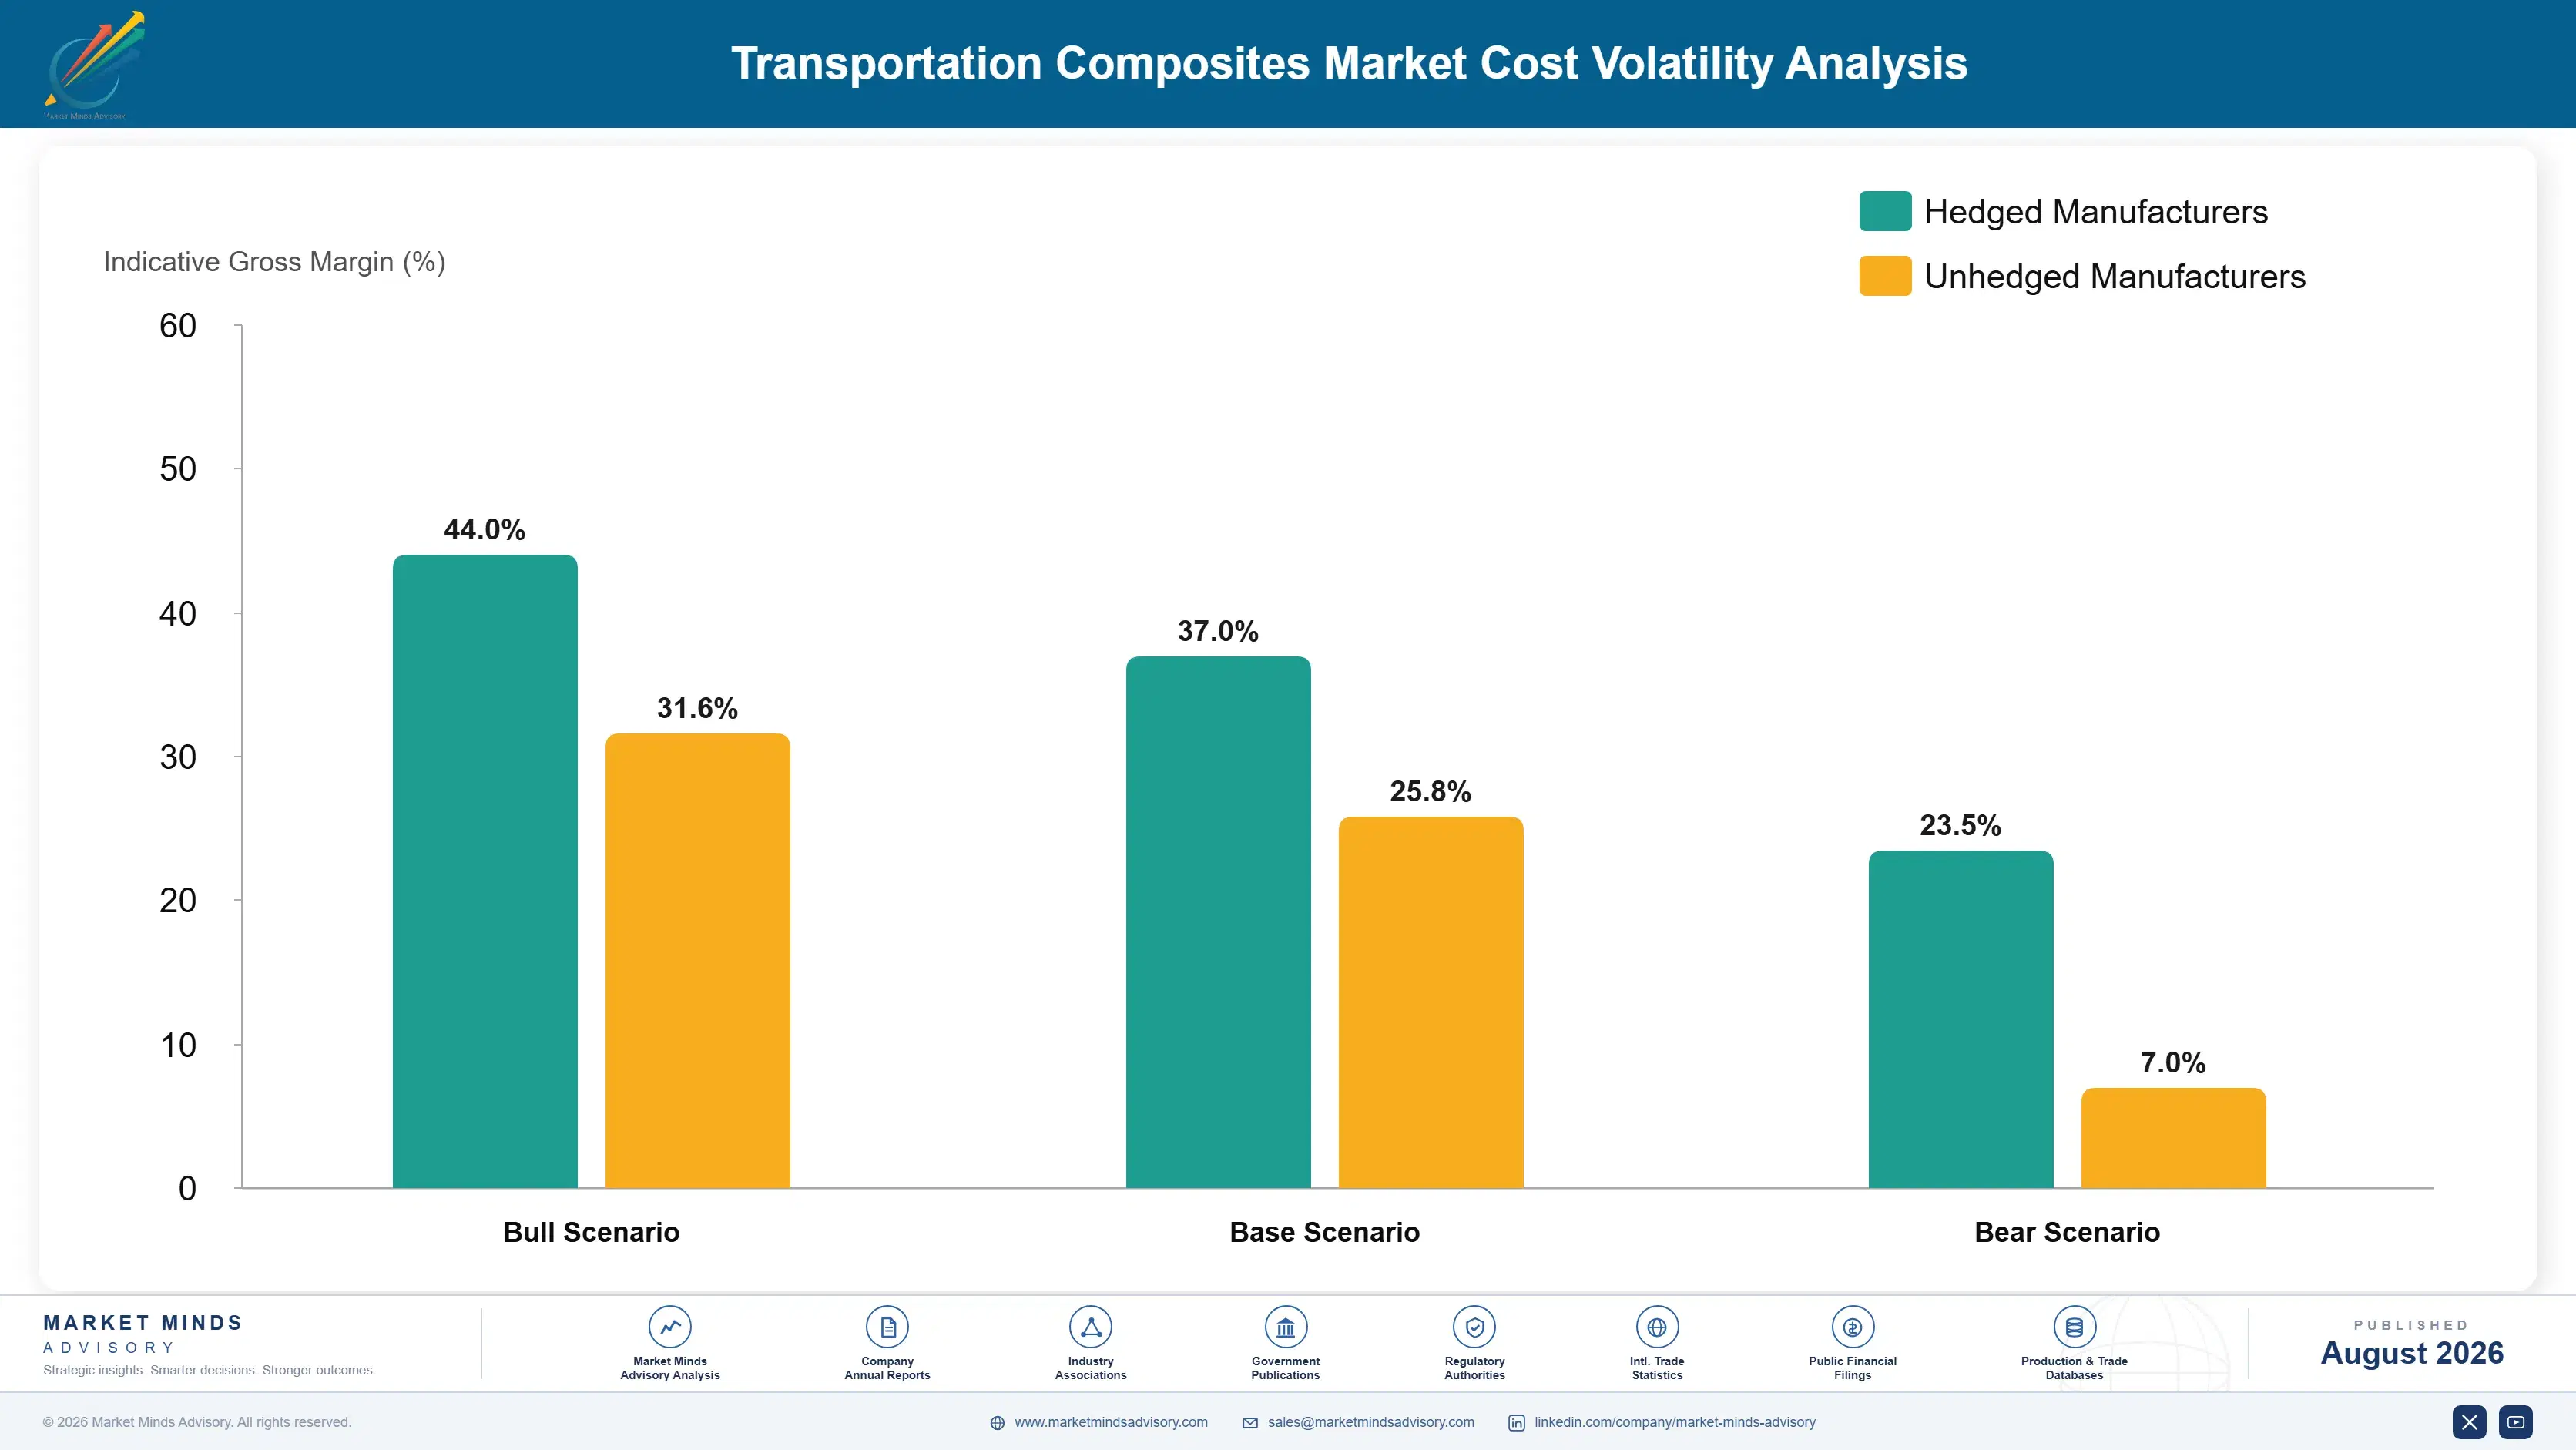
Precursor and carbonisation energy exposure

Reinforcement fibre accounts for roughly 48% of delivered composite cost, split between carbon fibre carrying acrylonitrile precursor and carbonisation energy, and glass fibre carrying batch materials and furnace energy. Resin and matrix polymer contribute about 21%, converting and prepreg operations around 13%, quality release and testing 7%, with tooling amortisation, packaging and freight carrying the remaining 11%.
Energy rather than material was the defining exposure through the forecast history. European industrial power and gas prices through 2022 reached levels the IEA documented as unprecedented for the sector, which hit both glass furnaces and carbonisation lines directly and closed several European glass fibre units permanently. Toray Annual Report 2023 recorded raw material and energy cost pressure across its carbon fibre composite materials business, and Hexcel Annual Report 2022 noted input cost recovery lagging contractual pricing.

The competitive disadvantage mechanism runs through precursor and energy position rather than through converting efficiency. Producers buying acrylonitrile merchant pay a margin to suppliers who sometimes compete downstream and carry full exposure to petrochemical cycles. Those operating carbonisation on expensive grid power cannot close the gap through yield improvement. European producers typically carry both disadvantages, which is why capacity additions have concentrated elsewhere.
transportation-composites-market-trends-cost-volatility-analysis-1787310894777

Secure precursor supply before adding carbonisation capacity

Announced carbon fibre projects have repeatedly failed to reach economic operation because precursor supply was assumed rather than contracted, leaving the new line exposed to merchant pricing set by companies competing downstream. Negotiating precursor before the capacity commitment costs nothing beyond commercial discipline and it decides whether the new investment ever earns anything at all.

Site carbonisation and glass melting on advantaged power

Carbonisation and glass melting are both genuinely energy intensive, and the difference between advantaged industrial power and European grid pricing can exceed the entire converting margin on a tonne of fibre. Siting decisions made on labour or logistics grounds rather than power cost have closed more capacity in this industry than any demand shortfall ever did.

Develop recovered fibre streams into less demanding applications

Recovered carbon fibre serves interior, semi-load-bearing and general industrial duty perfectly adequately at a fraction of virgin cost, and building those streams hedges precursor exposure while answering the end-of-life questions that programmes now ask. The capability involved rests on collection relationships and steady process development rather than on any heavy capital investment at all.

Portfolio Architecture for Margin Defence

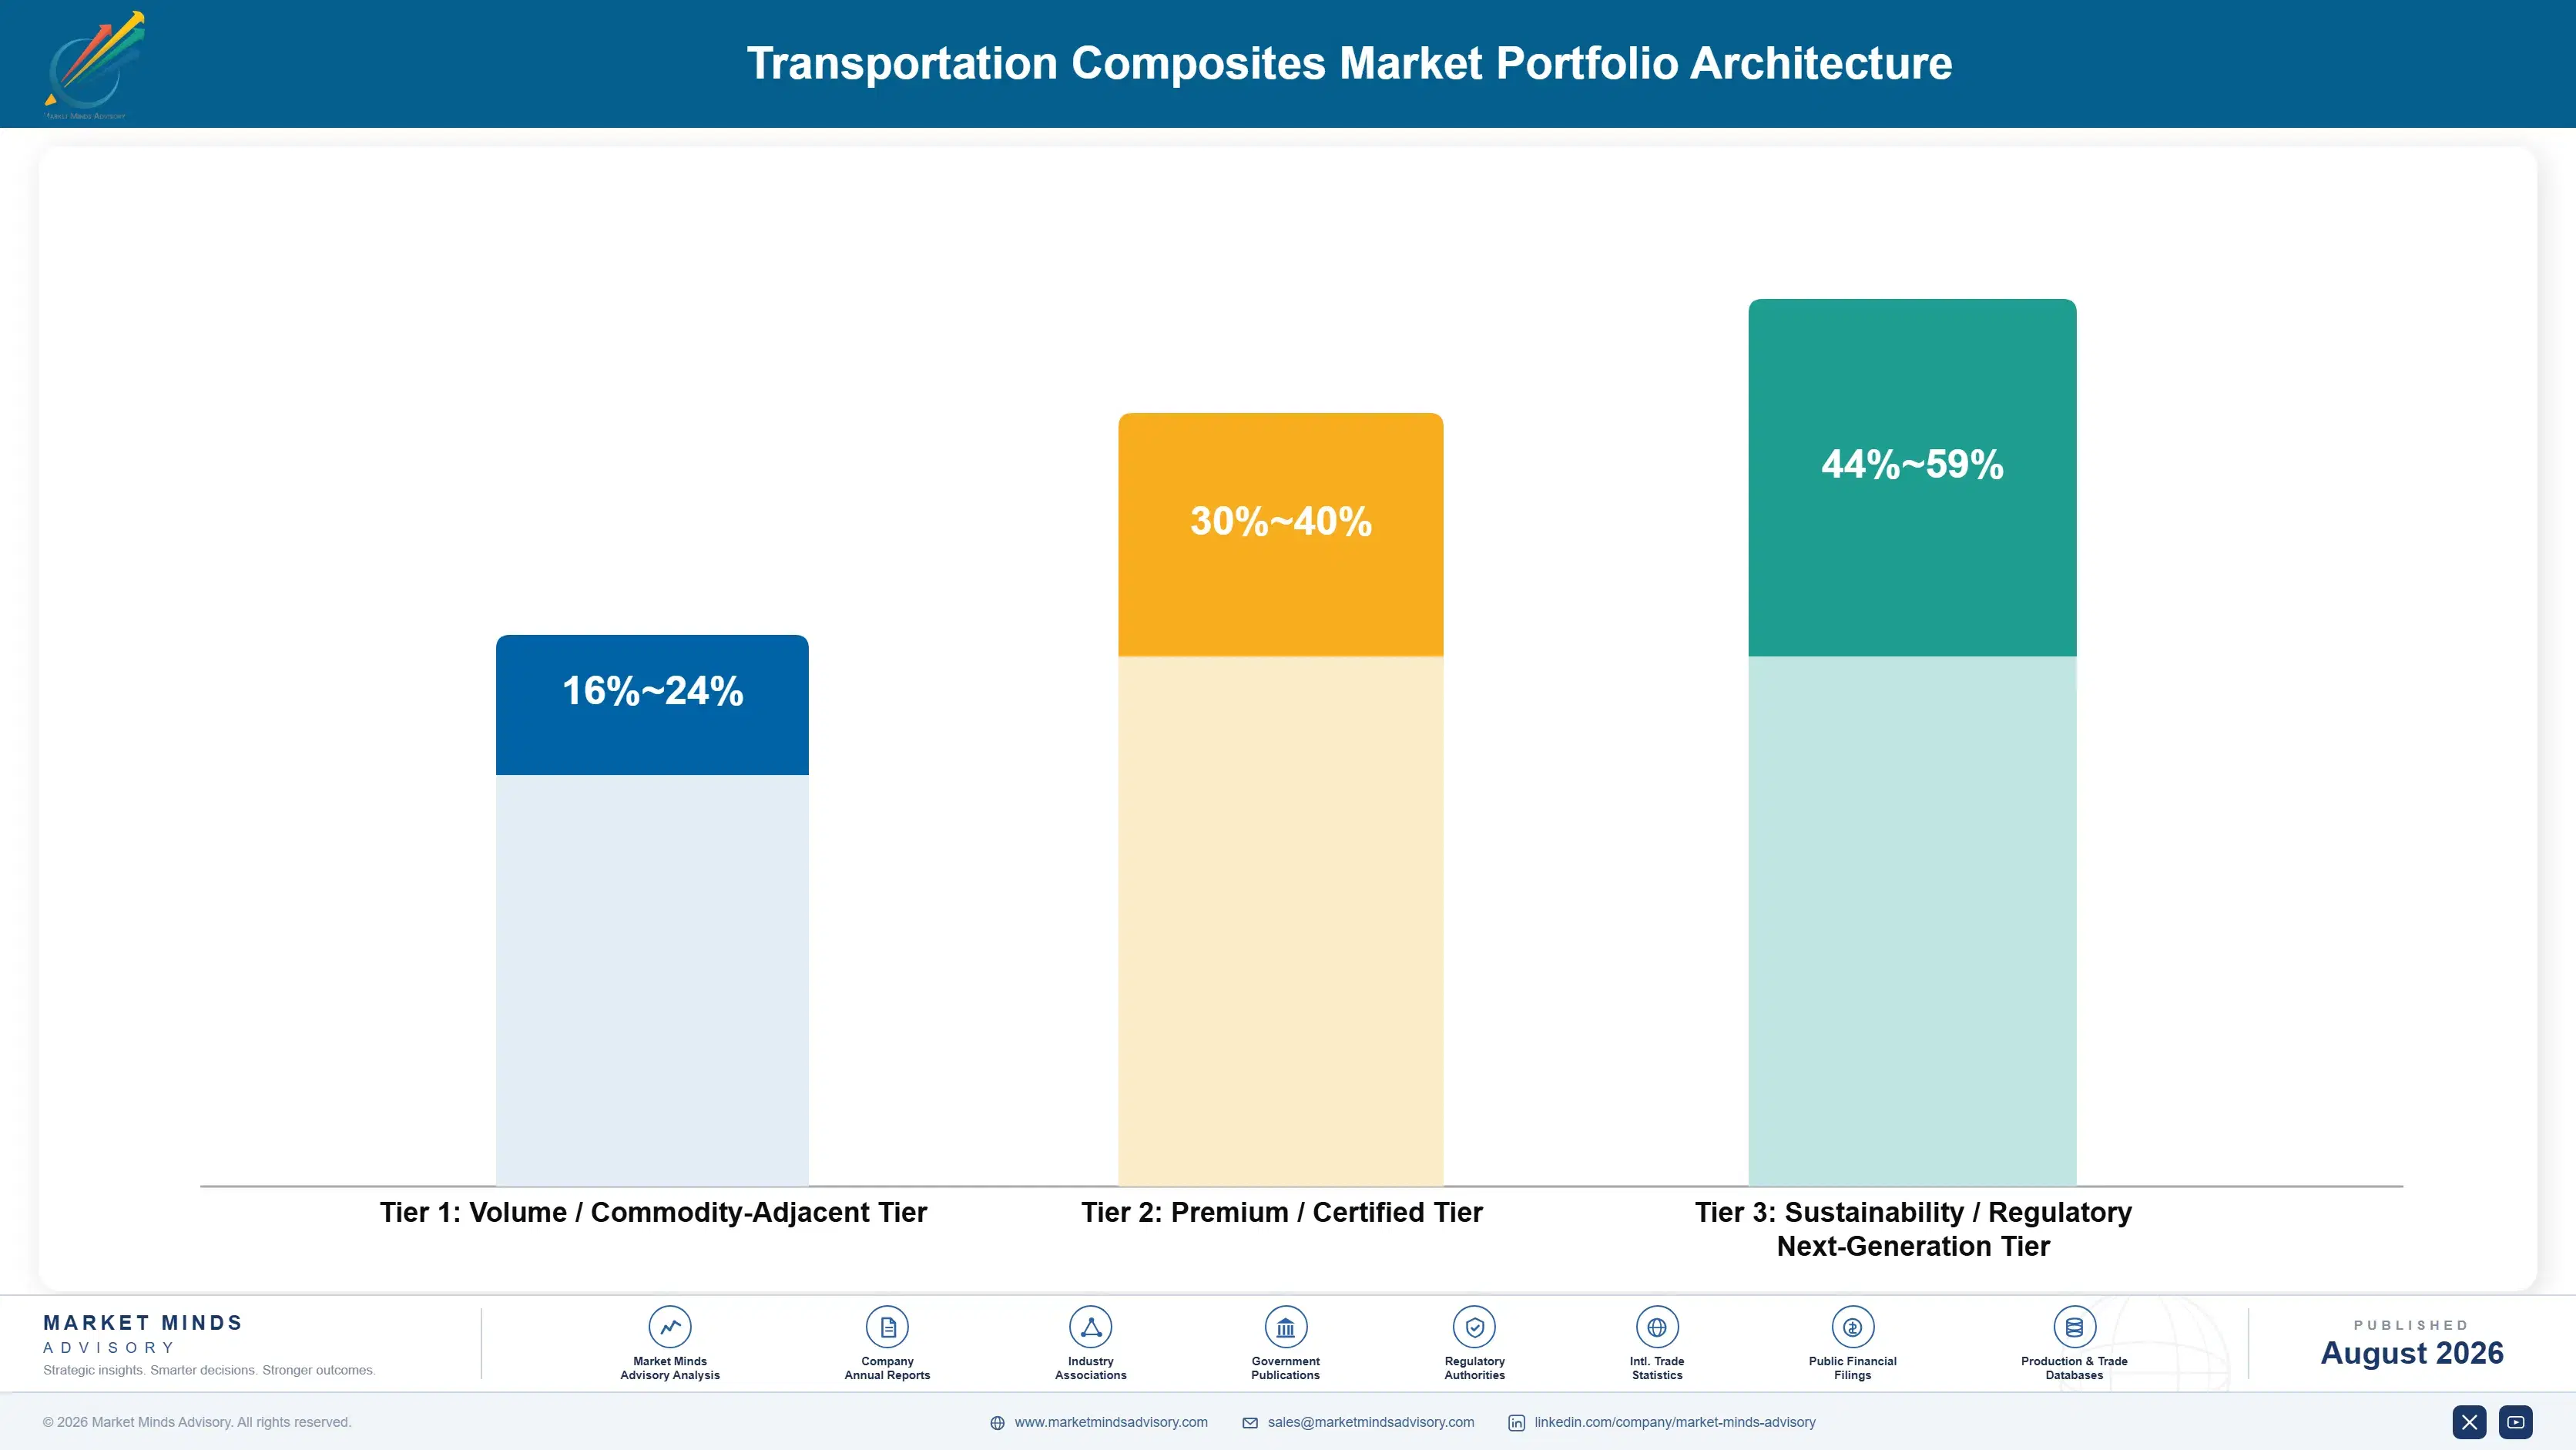
Margin architecture separates by qualification barrier and process capability rather than by fibre type, which is not at all how most suppliers organise their internal reporting today. Glass reinforced thermoset material supplied against a property specification earns whatever regional converting competition allows, because a great many suppliers meet the requirement and delivered price then decides the award every time.
Value climbs wherever certification or demonstrated cycle performance limits the field of acceptable suppliers sharply. Carbon thermoset prepreg qualified into aerospace secondary structure defends pricing through documentation nobody can assemble quickly. Certified primary structure positions sit far higher again, since a type certificate cannot be revisited, and the material named inside it therefore supplies for the whole programme production life.

The highest value pools now concentrate where aerospace certification meets thermoplastic cycle capability, and where recovered fibre answers questions programmes are beginning to ask. Those pools are modest measured in tonnage and quite disproportionate in realised margin terms. The commercial tension is that glass reinforced volume keeps converting lines loaded while contributing almost nothing at all toward the qualification and process development that actually opens anything above it.

Volume / Commodity-Adjacent Tier

Glass fibre reinforced thermoset material supplied against property specifications into vehicle interior, panel and general transportation duty, where many regional converters satisfy the requirement and delivered price decides almost every award.
Gross Margin: 16-24%

Premium / Certified Tier

Carbon and glass reinforced systems qualified into aerospace secondary structure, rail interiors and premium automotive programmes. Qualification documentation and process consistency defend pricing here. The ten-point range reflects catalogue supply against qualified programme positions.
Gross Margin: 30-40%

Sustainability / Regulatory / Next-Generation Tier

Certified aerospace primary structure material, thermoplastic systems meeting volume cycle times and recovered fibre grades answering end-of-life requirements. Type certificates and process capability defend pricing very strongly. The fifteen-point range reflects established certification against emerging thermoplastic economics.
Gross Margin: 44-59%
transportation-composites-market-trends-portfolio-architecture-1787310895286

High-value Sub-segments and Strategic Watch-out

Certified aerospace primary structure material

High value and genuinely durable growth together here, because a type certificate cannot be revisited and the material named in it supplies that programme for a production life frequently exceeding twenty years without any renegotiation at all. Realised margin reflects that permanence very directly indeed.
Gross Margin: 44-59%

Thermoplastic systems meeting volume cycle times

Strong realised value on the fastest growth found anywhere here, because achieving cycle parity with metal forming opens applications currently closed entirely on manufacturing grounds, and remarkably few suppliers can actually demonstrate that parity on production representative tooling today. Realised margin reflects that scarcity directly.
Gross Margin: 40-52%

Glass reinforced thermoset panel material

The volume core of this whole market, keeping converting lines properly loaded while earning whatever regional competition permits against a property specification that a great many suppliers can already meet. Necessary for basic operating scale, but this tier funds nothing whatsoever above itself and never will.
Gross Margin: 16-24%

End-of-life recovery exposure across the portfolio

The strategic watch-out running across this portfolio, given that only 12% of composite mass is currently recovered anywhere and that thermoset chemistry cannot be reprocessed in any way at all, which regulation is already beginning to penalise well before it formally takes effect in any market.
Gross Margin: 12-44%

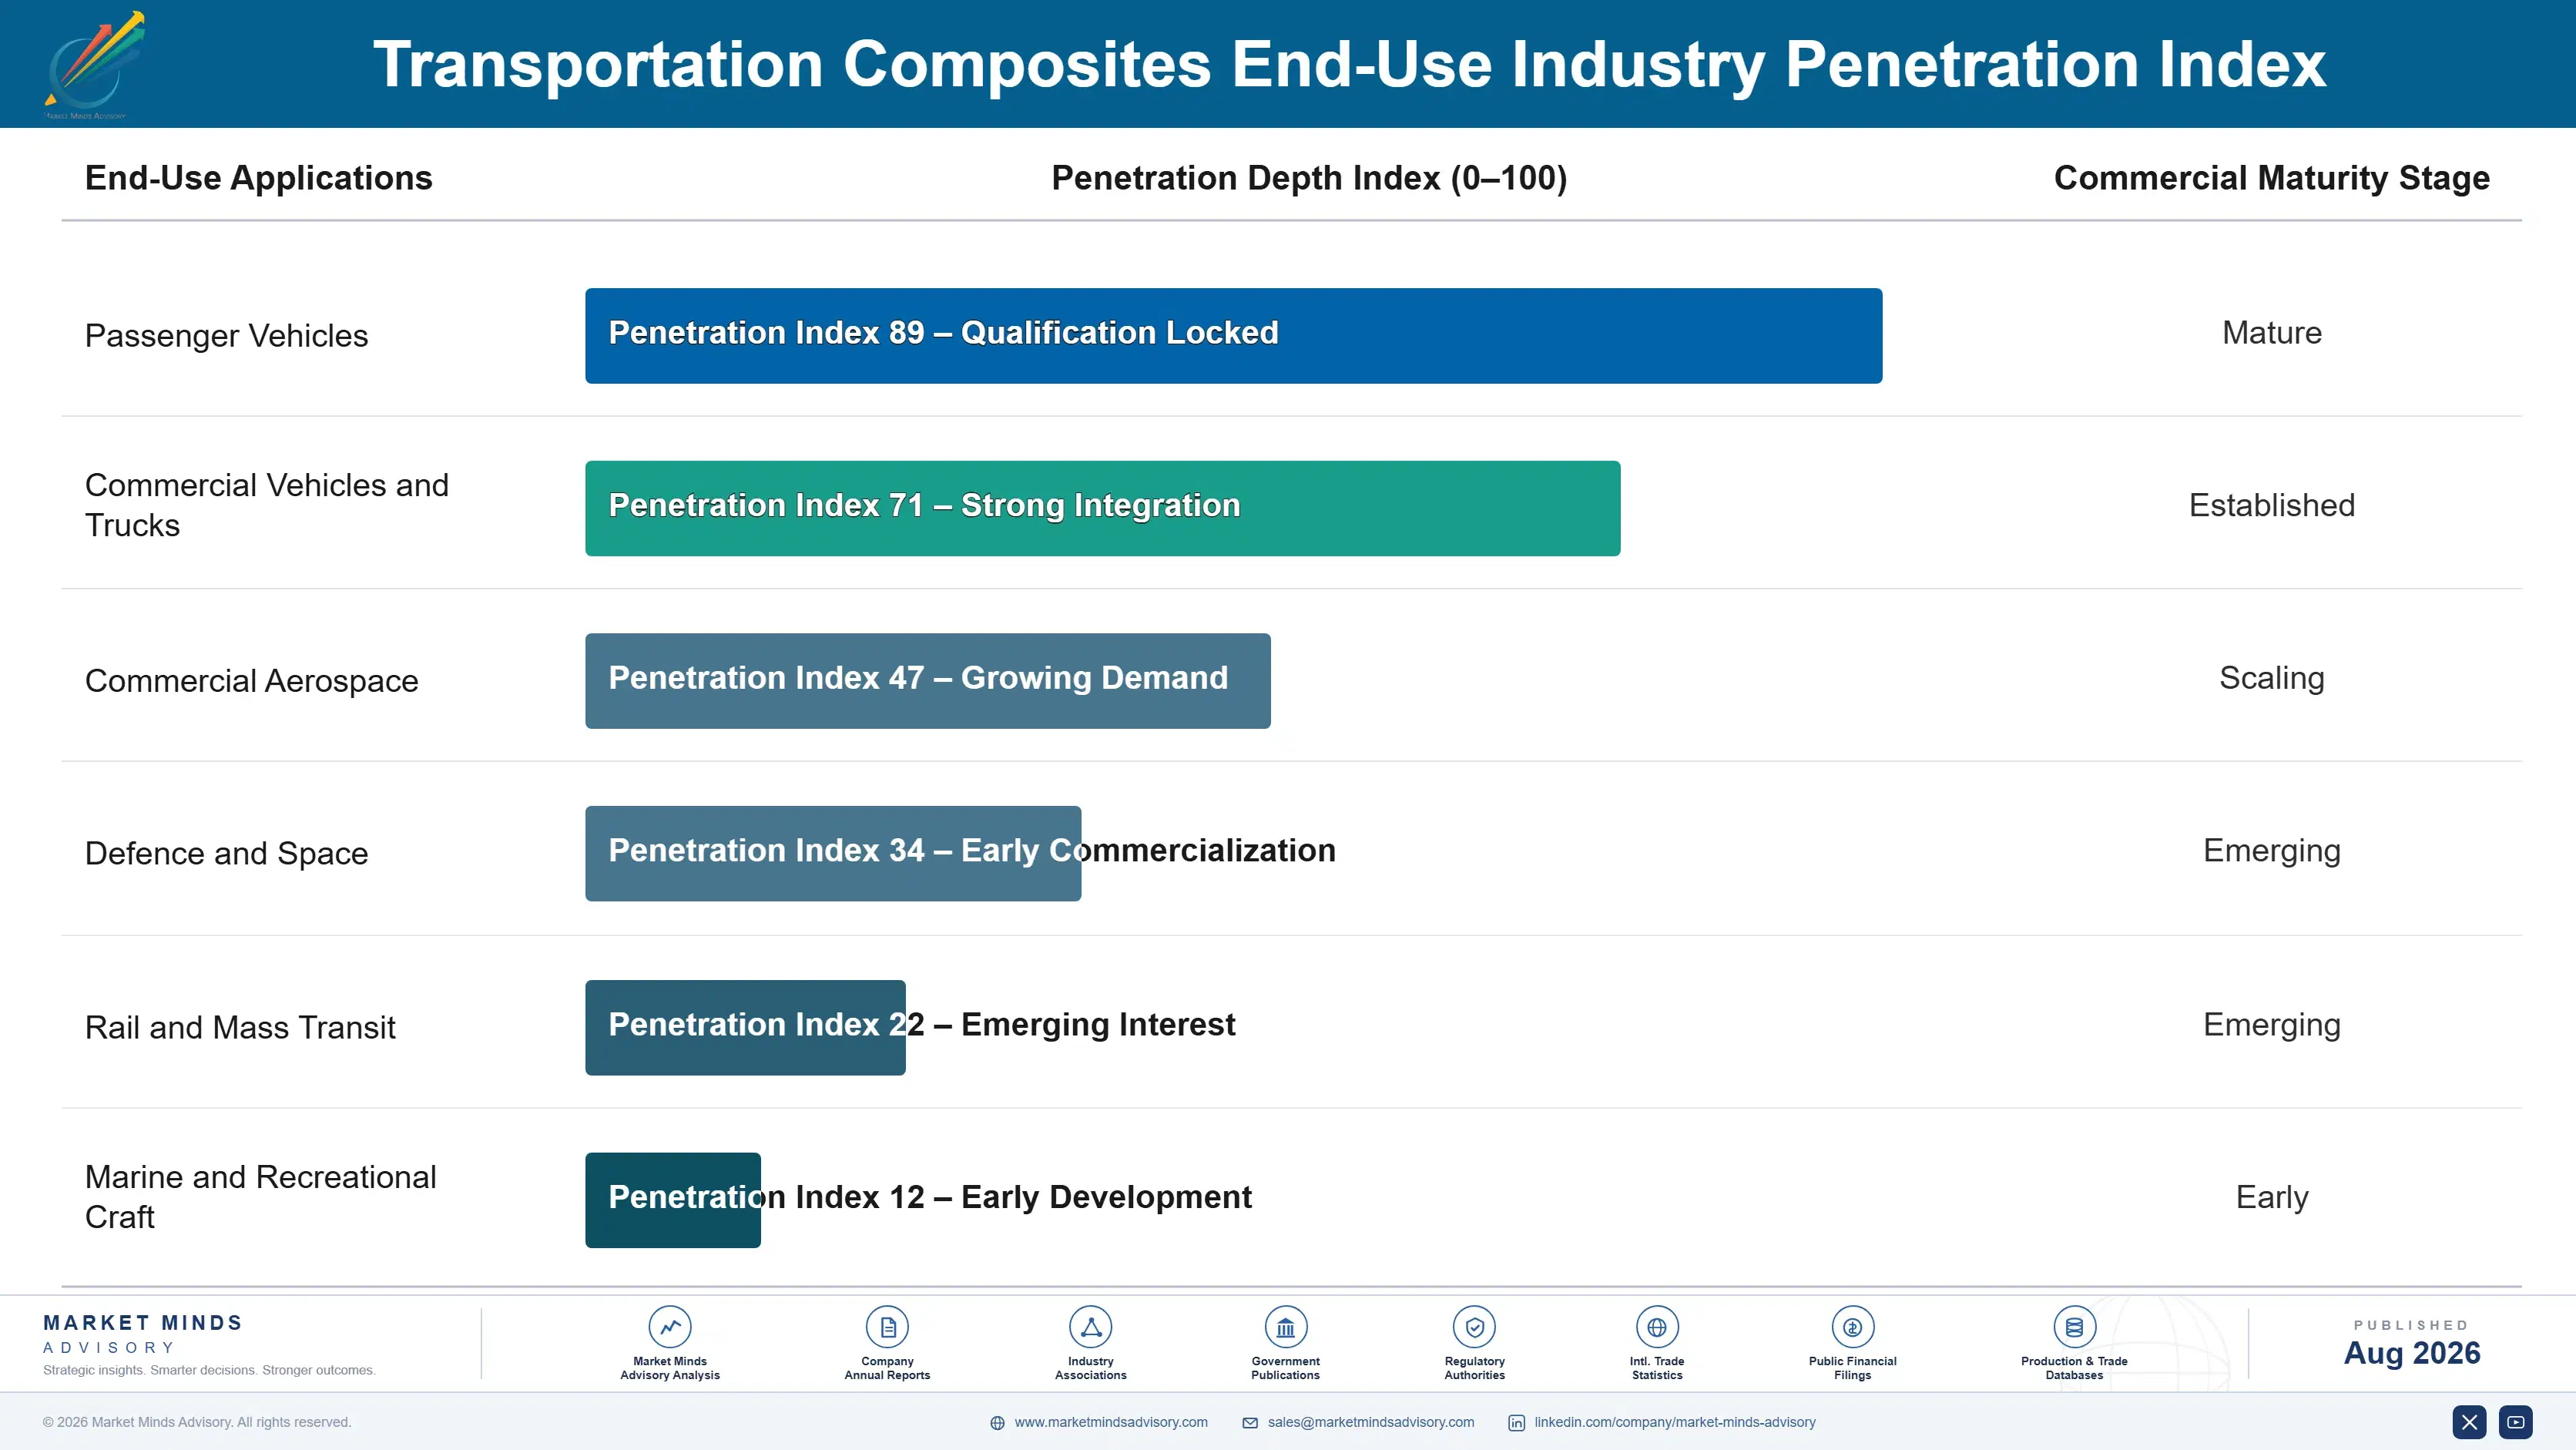
How composite demand actually behaves

Demand is programme-locked with an unusually long tail, and the tail length differs enormously between transportation modes. An aerospace material named in a type certificate supplies that programme for a production life frequently exceeding twenty years, with no prospect of substitution. An automotive material sits inside a platform running perhaps seven years, and a converter can requalify an alternative between model years if the case justifies the validation.
Stickiness tracks the certification burden rather than the technical difficulty. Glass reinforced interior and panel material is loosest, substituted between model years on price. Automotive load-bearing components sit tighter, because crash validation is expensive and nobody repeats it casually. Aerospace primary structure is effectively immovable, since changing material means reopening a type certificate that took years and considerable expense to obtain.

The buyer profile splits by mode in ways that defeat a single commercial model. Aerospace material is selected by airframe engineering during design, evaluated on allowables and damage tolerance, then bought by procurement for decades afterwards. Automotive material is selected jointly by programme engineering and manufacturing, where cycle time and scrap rate carry as much weight as any property does, and reaching those people needs process engineers rather than material specialists.
transportation-composites-market-trends-end-use-penetration-index-1787310895773

What we would actually do here

These are among the four positions where our research anticipates prominent divergence between winners and laggards over the coming forecast period. Each is grounded in the demand model, the regulatory perimeter, and the announced capacity pipeline.
01 / CYCLE TIME DEMONSTRATION

Lead with the takt time, not the property table

Every supplier arrives with data proving the material beats aluminium on mass, which programme engineers accepted twenty years ago and no longer need convincing about. Suppliers demonstrating cycle performance on production representative tooling, with scrap rate and takt time measured rather than modelled, realise roughly 30% above competitors leading with property comparisons. The trial costs tooling time rather than capital, and most suppliers avoid running it precisely because a trial exposes how far their cycle actually sits from what the line needs.
02 / AEROSPACE PLATFORM CERTIFICATION

Get into the type certificate during airframe design

Aerospace material qualification runs close to four years across coupon, element and full component testing, and the material named in the type certificate then supplies that programme for a production life that frequently exceeds twenty years. Suppliers achieving certification capture roughly 8 times the lifetime revenue of those bidding into secondary structure afterwards. Engagement must begin during airframe design rather than after first flight, because the position cannot be competed away at all once the certificate has finally been issued.
03 / PRECURSOR INTEGRATION POSITION

Contract the acrylonitrile before building the line

Acrylonitrile precursor and carbonisation energy together carry roughly 48% of delivered composite cost, and merchant buyers pay a margin to companies that quite often compete downstream against them as well. Integrated producers run roughly 22% below merchant precursor buyers, and that gap widens further whenever acrylonitrile tightens on petrochemical cycles entirely unrelated to composites. Several announced capacity projects never reached economic operation at all, simply because precursor supply had been assumed rather than properly contracted before the commitment was made.
04 / RECOVERED FIBRE CAPABILITY

Answer the recovery question before it is compulsory

Only around 12% of composite mass is currently recovered anywhere after vehicle scrappage, and European end-of-life rules are already appearing in programme material selection a decade before they take effect. Suppliers holding documented recovered fibre streams and proven recycling routes hold roughly 3 times the addressable position of those unable to answer the question at all. The capability rests on collection relationships and steady process development rather than heavy capital, and the good positions are being quietly established right now.

Engagement Snapshot From the Field

A live engagement with an industry participant carrying material or product regulatory and market exposure ahead of a defining policy shift, showing how our research translates into a defensible multi-year portfolio strategy.
MARKET MINDS ADVISORY · CLIENT ENGAGEMENT SUMMARY
Transportation Composites Producer Strategic Portfolio Review and Transition Roadmap 2026·Investment Scenario on Transportation Composites Exposure Evaluation 2025-26
CLIENT PROFILE
A composite materials supplier operating prepreg and compounding capacity in Western Europe and North America, serving aerospace secondary structure, premium automotive and rail customers alongside a general industrial composite business. Transportation composite revenue approached EUR 240 million annually (client-reported, unverified by MMA), roughly sixty percent of it glass and carbon thermoset prepreg sold against property specifications.
STRATEGIC CHALLENGE
Automotive programme awards had been lost consistently for three years and management attributed this to Asian material pricing, proposing a cost reduction programme across converting operations. Thermoplastic opportunities were being lost without anybody establishing why. No recovered fibre capability existed anywhere in the business despite several customers already beginning to ask for recovery documentation during material selection.
MMA APPROACH
We assessed the portfolio by qualification barrier and process capability rather than by fibre type, quantified the gap between achieved and required cycle times on representative tooling, and reconstructed twelve lost automotive awards through interviews with customer manufacturing engineering rather than the purchasing contacts the client normally dealt with. Cycle performance was benchmarked independently against three competitor materials.
KEY FINDINGS
  1. Ten of twelve lost awards failed on demonstrated moulding cycle time rather than on material price, property performance or delivered reliability in any respect.
  2. The converting cost reduction programme addressed roughly a tenth of delivered cost while leaving the precursor and energy position, carrying half of it, entirely untouched.
  3. No production tooling cycle trial had ever been run, so every automotive proposal relied on modelled cycle estimates that customers had learned to discount heavily.
  4. Three customers had already requested recovered fibre documentation during material selection, and the client had recorded none of those requests as commercially significant.
CLIENT PROFILE
A composite materials supplier operating prepreg and compounding capacity in Western Europe and North America, serving aerospace secondary structure, premium automotive and rail customers alongside a general industrial composite business. Transportation composite revenue approached EUR 240 million annually (client-reported, unverified by MMA), roughly sixty percent of it glass and carbon thermoset prepreg sold against property specifications.
STRATEGIC CHALLENGE
Automotive programme awards had been lost consistently for three years and management attributed this to Asian material pricing, proposing a cost reduction programme across converting operations. Thermoplastic opportunities were being lost without anybody establishing why. No recovered fibre capability existed anywhere in the business despite several customers already beginning to ask for recovery documentation during material selection.
MMA APPROACH
We assessed the portfolio by qualification barrier and process capability rather than by fibre type, quantified the gap between achieved and required cycle times on representative tooling, and reconstructed twelve lost automotive awards through interviews with customer manufacturing engineering rather than the purchasing contacts the client normally dealt with. Cycle performance was benchmarked independently against three competitor materials.
KEY FINDINGS
  1. Ten of twelve lost awards failed on demonstrated moulding cycle time rather than on material price, property performance or delivered reliability in any respect.
  2. The converting cost reduction programme addressed roughly a tenth of delivered cost while leaving the precursor and energy position, carrying half of it, entirely untouched.
  3. No production tooling cycle trial had ever been run, so every automotive proposal relied on modelled cycle estimates that customers had learned to discount heavily.
  4. Three customers had already requested recovered fibre documentation during material selection, and the client had recorded none of those requests as commercially significant.
RECOMMENDED STRATEGY
Phase 1: Phase one: run production representative cycle trials on the four largest automotive prospects and publish measured takt and scrap performance. Phase 2: Phase two: redirect the converting cost programme toward thermoplastic compounding capability and toward securing a genuinely advantaged precursor supply arrangement. Phase 3: Phase three: establish recovered fibre collection relationships with aerospace and automotive scrap sources well ahead of end-of-life documentation requirements actually arriving.
OUTCOME
The client ran cycle trials on production tooling and won two automotive awards it had previously lost while relying on modelled cycle data. Realised margin on thermoplastic and qualified automotive volume improved by 19% (client-reported, unverified by MMA) against the prior year on broadly comparable tonnage shipped.

Frequently Asked Questions

Foundational context covering the market sizes, CAGR, scope, country, region and competition that inform every finding below. This section is provided to cover basics and most often pre-purchase conversations, answered from the MMA Primary Research Dataset.

What is the current size of the Transportation Composites Market?

The market is valued at USD 18.4 billion in 2025, rising to USD 19.84 billion in 2026. Sizing covers composite material and prepreg sold to converters and manufacturers at realised delivered price.

How large will the Transportation Composites Market be by 2036?

The market reaches USD 42.05 billion by 2036, an increase of USD 22.21 billion across the forecast period. That represents an expansion multiple of 2.12 times the 2026 base.

What is the CAGR for the Transportation Composites Market 2026 to 2036?

The base case CAGR is 7.8% across 2026 to 2036. The bull case reaches 9.1% on thermoplastic cycle parity, while the bear case sits at 6.5% under continued aluminium improvement.

Which segment is growing fastest?

Carbon fibre reinforced thermoplastics grow fastest at 11.7%, a full 1.50 times the market rate. A melt-processable matrix cuts moulding cycles toward what volume vehicle lines actually require.

Who are the major companies in the Transportation Composites Market?

Toray Industries, Hexcel, Teijin, Mitsubishi Chemical Group and Syensqo lead on supply volume, holding 28% collectively. The remaining field spans glass fibre majors, converters and tier one suppliers.

Which country is growing fastest?

India grows fastest at 10.6%, driven by vehicle manufacture expanding faster than anywhere else alongside aerospace component supply chains developing under offset arrangements and rail modernisation.

Report Segmentation Architecture

The full report scope spans multiple orthogonal segmentation dimensions, with cross-tabulated demand data provided for each dimension pair. Coverage extends further to regional breakdowns, trend trajectories, and the competitive detail needed to support segment-level decision-making.

By Reinforcement and Matrix Class

  • Glass Fibre Reinforced Thermoset
  • Glass Fibre Reinforced Thermoplastic
  • Carbon Fibre Reinforced Thermoset
  • Carbon Fibre Reinforced Thermoplastic
  • Natural Fibre Reinforced Composites
  • Aramid and Hybrid Reinforced Composites

By End-Use Industry

  • Passenger Vehicles
  • Commercial Vehicles and Trucks
  • Commercial Aerospace
  • Defence and Space
  • Rail and Mass Transit
  • Marine and Recreational Craft

By Customer Type and Channel

  • Vehicle Manufacturers Direct
  • Automotive Tier One Suppliers
  • Airframe Manufacturers
  • Aerospace Component Suppliers
  • Independent Composite Converters
  • Distribution and Trade Supply

By Region

  • North America
  • Western Europe
  • East Asia
  • South Asia and Pacific
  • Latin America
  • Middle East and Africa
  • Eastern Europe

Scope, Methodology, and Coverage

Every figure in this report is reproducible from documented input assumptions. The scope below maps the historical period, the forecast horizon, the segmentation dimensions, and the countries covered, alongside the underlying primary and qualitative methodology.
Historical Period
2020 to 2025
Forecast Period
2026 to 2036
Base Year
2025 (USD billions; MMA Primary Research Dataset, August 2026)
Market Definition
The market comprises fibre reinforced polymer composite materials supplied for transportation applications, spanning glass fibre reinforced thermoset and thermoplastic, carbon fibre reinforced thermoset and thermoplastic, natural fibre reinforced, and aramid and hybrid reinforced material classes. Sizing captures composite material and prepreg revenue at realised delivered price across passenger vehicles, commercial vehicles and trucks, commercial aerospace, defence and space, rail and mass transit, and marine and recreational craft applications. Reinforcement fibre and resin sold separately into non-transportation use, metallic and ceramic materials, moulding and curing equipment, adhesives and coatings, and finished vehicles, aircraft or vessels all fall outside scope.
Quantitative Units
USD billions (current prices); composite material shipped annually in thousands of tonnes; USD per kilogram at realised delivered price
Segmentation Dimensions
By Reinforcement and Matrix Class; By End-Use Industry; By Customer Type and Channel; By Region
Regions Covered
North America, Western Europe, East Asia, South Asia and Pacific, Latin America, Middle East and Africa, Eastern Europe
Countries Covered
USA, Canada, Mexico, UK, Germany, France, Italy, Spain, Netherlands, Sweden, Poland, Czech Republic, Slovakia, Romania, Turkey, China, Japan, South Korea, Taiwan, India, Singapore, Malaysia, Thailand, Vietnam, Australia, Brazil, Argentina, Morocco, Saudi Arabia, UAE, South Africa, and additional markets relevant to this sector
Key Companies Profiled
Toray Industries, Hexcel, Teijin, Mitsubishi Chemical Group, Syensqo, SGL Carbon, Owens Corning, Johns Manville, Nippon Electric Glass, China Jushi, Chongqing Polycomp International, Gurit, Plasan Carbon Composites, Continental Structural Plastics, Hengshen, Zoltek, Kordsa, Porcher Industries, Exel Composites, Avient.
Quantitative Methodology
Primary survey, n=3,800 respondents, Q4 2025, six countries; demand-side model with trade association cross-validation
Qualitative Methodology
47 expert interviews, Q4 2025; applied to validate demand model assumptions, identify emerging dynamics, and assess competitive positioning
Report Format
PDF and XLSX data workbook (Word format preview document)
Publisher
Market Minds Advisory
Report Code
MMA-2026-CHM-585
Published
August 2026
Contact
sales@marketmindsadvisory.com | www.marketmindsadvisory.com

Purchase the full Transportation Composites Market Report (2026 to 2036).

The full report sizes the transportation composites market across six reinforcement and matrix classes, six end-use industries, six customer channels and seven regions, with annual forecasts to 2036 in revenue and tonnage shipped. It benchmarks achieved moulding cycle times against production line requirements by application, which is the analysis that establishes why so many composite proposals fail on manufacturing rather than material grounds. Twenty participants are assessed on a consistent composite supply volume basis, with certified platform positions mapped separately from installed converting capacity. Precursor integration and recovered fibre capability are quantified supplier by supplier.
Six reinforcement and matrix classes sized and forecast annually
Achieved cycle times benchmarked against production line requirements
Twenty participants assessed on consistent supply volume basis
Certified platform positions mapped separately from converting capacity
Precursor integration and energy positions quantified supplier by supplier
Recovered fibre capability and recovery routes tracked throughout

Built For The People Who Decide

From boardroom strategy to bench-side execution, this report is read cover-to-cover by leaders shaping the next decade of their industry, turning demand scenarios, market dynamics and valuation benchmarks into decisions.
CXOs/ Presidents/ VPs/ Managers
M&A and Corporate Development
Strategy Teams and R&D Heads
Procurement and Product Directors
Regulatory and Compliance Leaders
Investor Relations and Equity Analysts