Market Minds Advisory
Transportation Biofuel Market

Transportation Biofuel Market: Transportation Biofuel Market. Policy Mandates and Feedstock Economics Drive the Road Fuel Transition

Blending mandates, low-carbon fuel credits, and feedstock cost swings are colliding as refiners race to convert existing capacity fast enough to capture renewable diesel margins before current policy support windows narrow considerably worldwide.

Lead Analyst

Published

September 2026

Make Smarter Decisions with Customized Research Insights

Request a free sample report and evaluate market opportunities, growth trends, and competitive dynamics relevant to your business needs.

2025 MARKET VALUE$145.0BMarket Size 2025
2036 FORECAST VALUE$345.0BBase Case , 2026 to 2036
CAGR 2026 TO 20368.2 %Bull 9.5% / Bear 6.9%
INCREMENTAL OPPORTUNITY$188.2BNet 10- year value creation
EXPANSION MULTIPLE2.20x2036 value over 2026 base
Strategic Levers
M&A Pipeline
Regional Outlook
Country Rankings
Competitive Intelligence
Segmental Deep-dive
Call-Us : 91 93563 13602

Executive Snapshot and Market Trajectory.

Renewable diesel capacity additions are outpacing biodiesel expansion for the first time in the market's history, as refiners retool existing hydrotreating units to capture premium low-carbon fuel credits across multiple jurisdictions right now, reshaping investment priorities considerably across the entire refining sector this year and well into next.
Corn and soybean feedstock costs remain the dominant swing factor in producer margins, while used cooking oil and animal fat imports face growing scrutiny over origin verification and fraud risk across major consuming markets, prompting new customs enforcement measures in several importing countries this year and further regulatory tightening widely expected across the coming ten-year forecast period stretching well ahead through most of the decade.
Competitive intensity is rising as integrated oil majors enter renewable diesel production alongside traditional agricultural processors, while blending mandate expansions in India, Indonesia, and Brazil open substantial new demand pools that established exporters are racing to capture through long-term supply contracts, joint ventures, and dedicated feedstock sourcing partnerships spanning several continents worldwide and increasingly extending well beyond their traditional home markets, legacy customer bases, and prior geographic footprint entirely and permanently as well.
Market Definition
This report covers liquid transportation biofuels including ethanol, biodiesel, renewable diesel, and biomethane used to fuel road vehicles, measured on a global production-volume basis. It excludes sustainable aviation fuel, marine biofuels, and biomass power generation feedstocks sold for non-transport end uses.
Base Year Value
$145.0B in 2025 (MMA Primary Research Dataset, September 2026)
Forecast Period
2026 to 2036, eleven discrete annual values
CAGR
8.2% base case. Bull 9.5%. Bear 6.9%.
Fastest Growth Segment
Renewable Diesel (HVO/HEFA): 14.0% CAGR
Fastest Growth Country
India: 15.5% CAGR
Fastest Growth Region
South Asia and Pacific: 10.2% CAGR
Largest Region
North America: 32% of 2025 global value
Market Leaders
Archer-Daniels-Midland, POET, Neste, Renewable Energy Group, Valero Renewable Diesel
Primary Survey
n=3,800 procurement and R&D decision-makers, Q4 2025, six countries
Methodology
Demand-side build-up, cross-validated against public data, 47 expert interviews

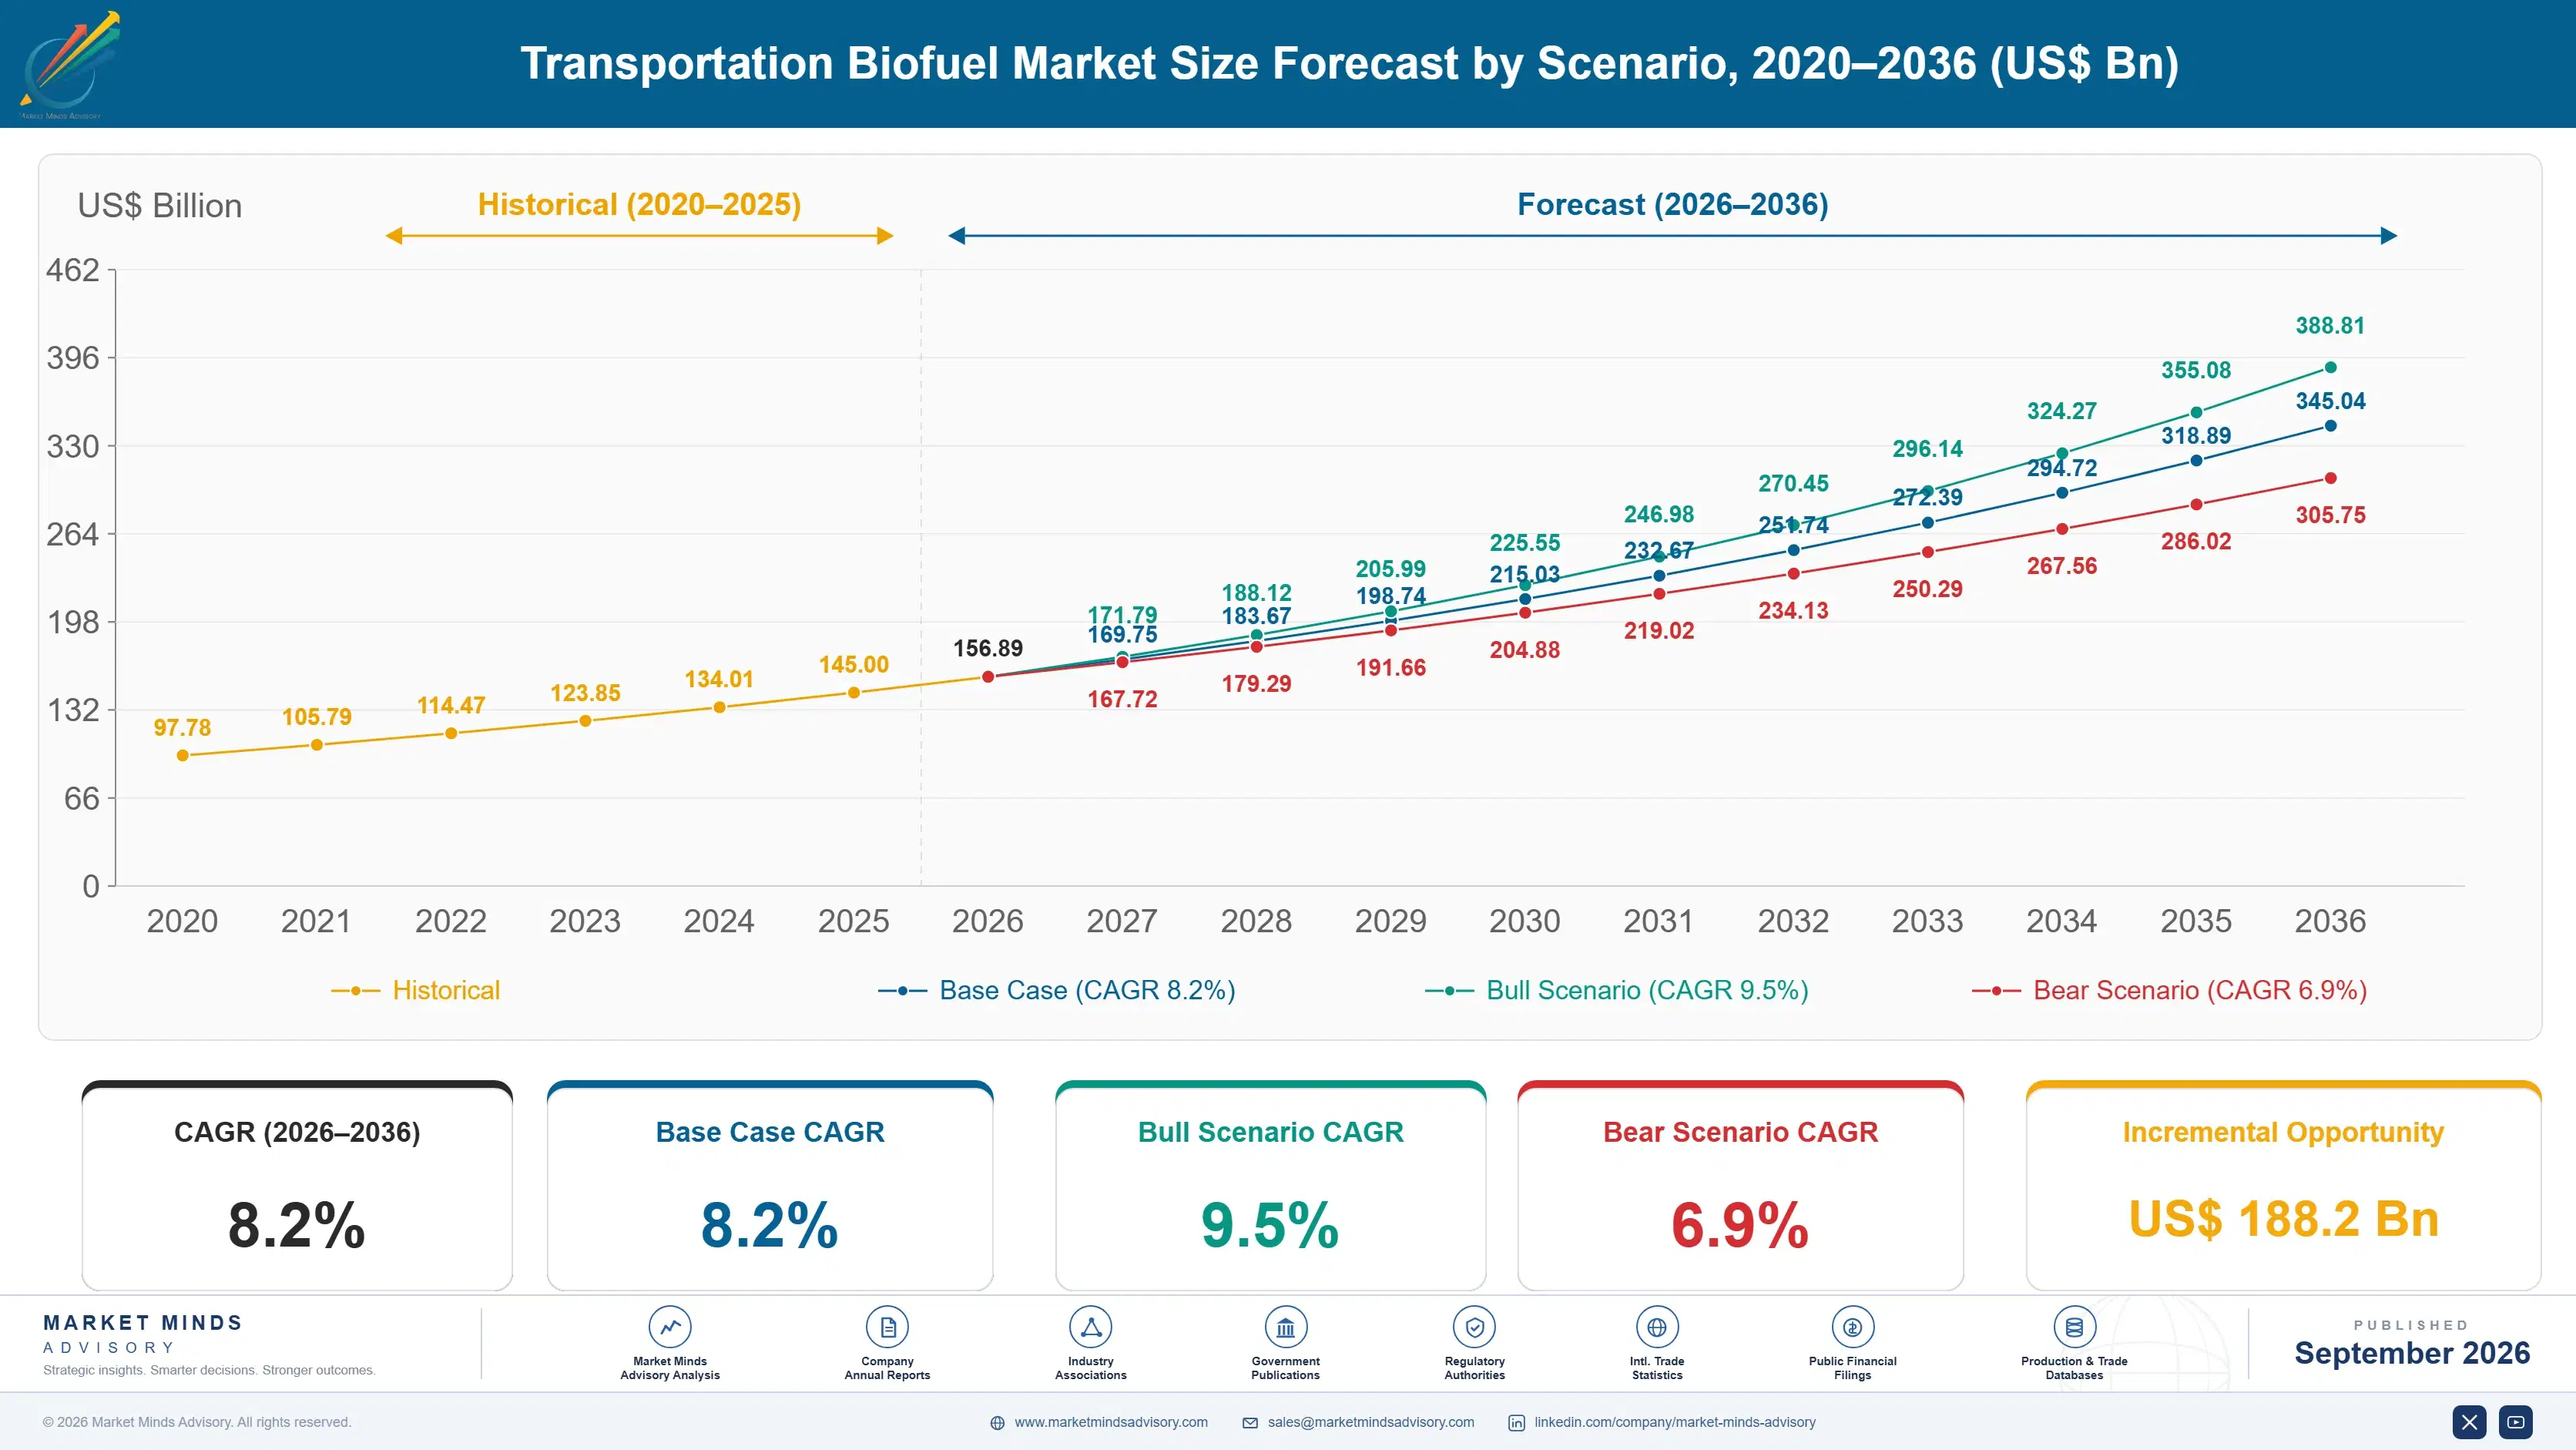
Transportation Biofuel Market Forecast Scenarios

transportation-biofuel-market-size-forecast-scenario-1788256639115
Between 2020 and 2025, transportation biofuel production grew steadily as blending mandates expanded across major consuming economies and renewable diesel capacity came online faster than legacy biodiesel plants could match, lifting the historical growth rate to roughly seven percent annually across the entire period and setting the stage for accelerated expansion through the coming forecast decade ahead.
The base case rests on three commercial mechanisms holding steady through the entire forecast window: continued blending mandate escalation in South and Southeast Asia, sustained low-carbon fuel credit values supporting renewable diesel margins, and gradual feedstock diversification toward waste oils and non-food crops reducing exposure to grain price volatility across major producing regions, all reinforcing steady double-digit expansion in the fastest-growing fuel categories through 2036 and well beyond that horizon.
A bull scenario emerges if aviation-adjacent feedstock competition eases and credit values hold near current levels, allowing renewable diesel margins to widen further across most producing regions worldwide, while a bear risk centers on a sudden feedstock price spike from a poor harvest year that squeezes producer margins across multiple regions simultaneously and delays planned capacity additions considerably.

Feedstock Economics Reshape the Road Fuel Transition

Feedstock economics dominate producer profitability more than any other variable in this market, with corn, soybean oil, used cooking oil, and animal fat prices moving margins far more than blending mandate changes ever do in a given quarter, forcing producers to hedge input costs aggressively across multiple harvest cycles each year while diversifying supply contracts across several countries and continents simultaneously.
FEEDSTOCK COST SHARE62%Portion of total production cost from feedstock inputs alone
RENEWABLE DIESEL CAPACITY GROWTH34%Annual hydrotreating capacity expansion rate across major markets globally
TOP PRODUCER SHARE26%United States share of total global production output volume
AVERAGE BLEND MANDATE12%Typical mandated ethanol or biodiesel blend ratio nationally
CAPACITY UTILIZATION81%Average operating rate across producing facilities worldwide currently
TRADE INTENSITY38%Share of total production volume moving across international borders
Renewable diesel has emerged as the clearest growth vector, drawing conventional refiners into hydrotreating conversions that repurpose idle capacity rather than building new plants from scratch, a capital-efficient pathway that shortens payback periods considerably compared with greenfield construction across most producing regions and accelerates the broader shift away from conventional biodiesel production entirely across the next several years of forecast activity.
Trade flows are shifting as used cooking oil imports from Asia into North America and Europe face rising scrutiny over origin fraud, pushing some buyers toward domestically sourced waste streams and non-food energy crops even at a modest cost premium over imported alternatives, a trend regulators are reinforcing through tighter customs documentation requirements across several major consuming markets this year and well into next.
"The plants winning today aren't the newest ones, they're the ones that converted fastest. Feedstock flexibility now matters more than nameplate capacity."
Practice Lead, Renewable Fuels and Energy Transition · MMA Alternative Transportation Fuels and Renewable Energy Practice · September 2026

Market Trends

Renewable Diesel Conversion Wave Accelerates Across Existing Refineries

Refiners across North America and Europe are converting idle hydrotreating units to renewable diesel service rather than building greenfield plants, cutting capital costs by roughly 40 percent versus new construction. This retrofit-first approach let producers reach 18 billion liters of combined renewable diesel and hydrotreated vegetable oil capacity by 2025, up sharply from just a handful of dedicated facilities five years earlier, as major oil companies including Chevron, Phillips 66, and Marathon Petroleum entered the segment through joint ventures and standalone conversions across multiple refining hubs nationwide and internationally as well.
Market Impact: Adds $80 to $120 per ton
India's Ethanol Blending Mandate Reaches E20 Milestone Early

India achieved its 20 percent ethanol blending target roughly five years ahead of the original 2030 schedule, driven by aggressive sugarcane and grain-based distillery expansion supported by government purchase price guarantees nationwide. The rapid scale-up has made India the fastest-growing single-country ethanol market globally, with distillery capacity additions exceeding 5 billion liters over the past three years alone, prompting several international ethanol technology licensors to expand local engineering and equipment supply partnerships considerably across the country's rapidly growing distillery base and its steadily broadening export ambitions into several neighboring markets.
Market Impact: Covers 60+ countries with mandates

Market Opportunities and Growth Drivers

Low-Carbon Fuel Credit Programs Widen Renewable Diesel Margins

California's Low Carbon Fuel Standard and similar programs in Oregon, Washington, and Canada generate tradable credits worth $80 to $120 per ton of avoided carbon emissions, directly subsidizing renewable diesel and biomethane production economics across multiple overlapping jurisdictions and compliance periods. These credit markets have grown to represent roughly 25 percent of total renewable diesel producer margin in credit-eligible jurisdictions, making program continuity and credit price stability a dominant strategic concern for capacity planning decisions across every major North American producer currently operating hydrotreating capacity at meaningful commercial scale today.
Market Impact: Swings margins by 20 to 40%

Global Blending Mandate Escalation Locks In Baseline Demand

Over 60 countries now maintain mandatory ethanol or biodiesel blending requirements, with several including Indonesia, Brazil, and India raising mandated blend ratios by 2 to 5 percentage points over the past three years alone across their respective national fuel distribution systems entirely. This regulatory floor guarantees baseline demand regardless of oil price cycles, insulating biofuel producers from the demand volatility that periodically hits other renewable energy categories tied more directly to wholesale power price movements across various regional electricity markets worldwide, providing producers a considerably more predictable multi-year planning horizon.
Market Impact: Affects up to 30% of imports

Market Restraints and Challenges

Feedstock Price Volatility Erodes Producer Margin Predictability

Corn, soybean oil, and used cooking oil prices swing 20 to 40 percent year over year depending on harvest conditions and competing food-sector demand, the single largest source of margin unpredictability for biofuel producers. The root cause is a fundamental land-use and crop-cycle constraint that biofuel producers cannot influence directly, since they compete with food, feed, and industrial oleochemical buyers for the same limited agricultural output. Producers are increasingly hedging through multi-year forward purchase contracts and pursuing non-food waste feedstocks such as used cooking oil and animal fat to reduce this exposure meaningfully.
Market Impact: Adds 18 billion liters annual capacity

Feedstock Fraud Concerns Threaten Import Credibility

Regulators in the European Union and United States have flagged suspected mislabeling of virgin palm oil as used cooking oil to qualify fraudulently for lower-carbon credit categories, a practice estimated to affect a meaningful share of Asian import volumes entering Western markets each year. The root cause is weak chain-of-custody verification infrastructure in several exporting countries, where certification systems lag well behind the pace of export volume growth over the past decade. Importers are responding by requiring third-party isotopic testing and blockchain-based traceability documentation before accepting shipments from higher-risk origin countries.
Market Impact: Reached 20% blend five years early
3 additional market trends, 4 additional growth drivers, and 3 additional restraints and challenges are covered in the full report. Contact sales@marketmindsadvisory.com to access the complete intelligence.

Segment CAGR and Growth Architecture

The transportation biofuel market splits into six fuel-technology segments defined by feedstock and conversion pathway, from mature grain ethanol through fast-growing renewable diesel and biomethane pathways. Growth rates diverge sharply across segments, reflecting differing capital intensity, feedstock availability, and policy support levels across major producing and consuming regions worldwide today and into the coming decade.
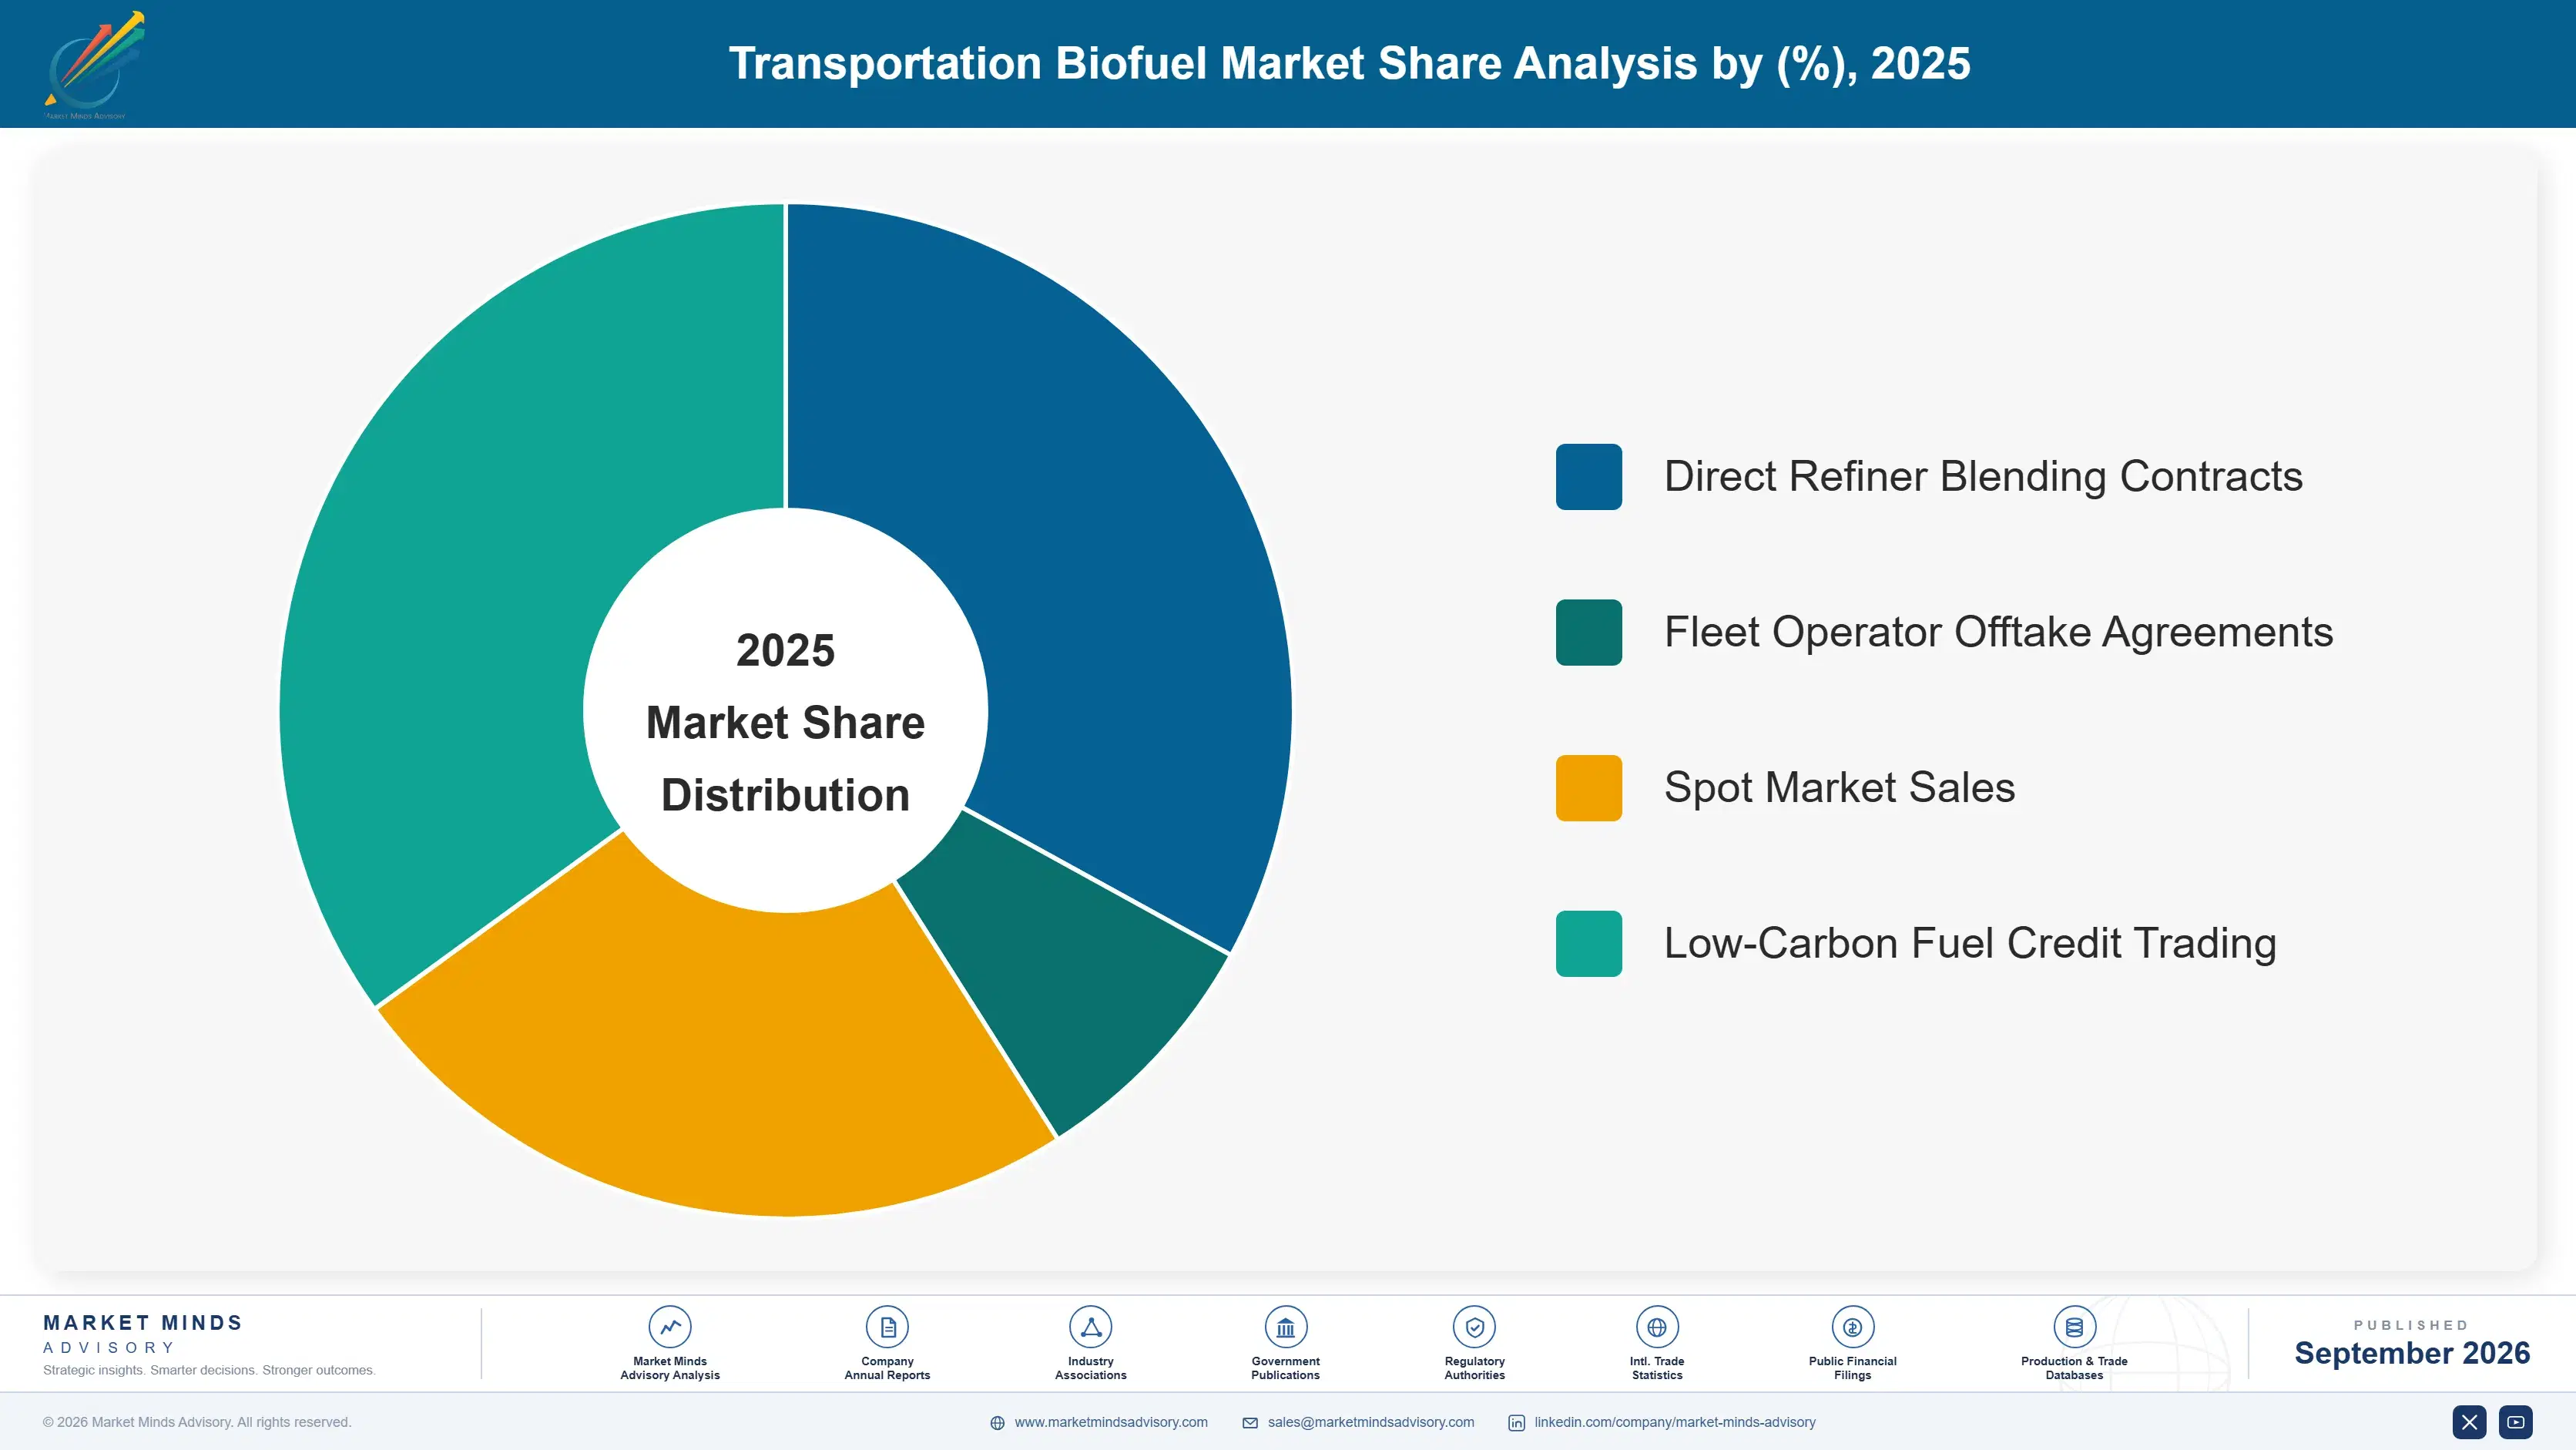
transportation-biofuel-market-market-share-analysis-1788256639699

Renewable Diesel (HVO/HEFA)

Renewable diesel produced through hydrotreating of vegetable oils, waste fats, and used cooking oil is the fastest-growing segment, favored for its chemical equivalence to petroleum diesel that allows drop-in use without blending limits or engine modifications required at all. Refiners are converting existing hydrotreating capacity rather than building new plants, cutting capital costs substantially and shortening project timelines from several years to under two in favorable regulatory jurisdictions across multiple continents. Feedstock flexibility, spanning soybean oil, used cooking oil, and animal fat, gives producers a meaningful cost advantage over rigid single-feedstock competitors as prices fluctuate across each harvest cycle and import market, reinforcing renewable diesel's lead over conventional biodiesel production pathways.
CAGR 14.0%

Biomethane and Bio-CNG for Transport

Biomethane produced from agricultural waste, landfill gas, and wastewater treatment is gaining traction as a transport fuel for heavy trucking and municipal fleets, particularly in Europe where renewable gas injection into existing pipeline networks lowers distribution costs considerably for participating operators nationwide. Fleet operators value its compatibility with existing compressed natural gas vehicle platforms, avoiding the capital cost of dedicated electric vehicle charging infrastructure build-outs entirely across their operating regions. Policy support through renewable gas certificates and heavy-vehicle decarbonization mandates is accelerating investment in anaerobic digestion capacity across several European and North American markets simultaneously, with additional momentum building steadily across parts of East Asia and South Asia as well.
CAGR 12.0%
Full segment breakdown across 7 segments available in the complete report.

Regional Architecture and Country Demand Map

North America leads global transportation biofuel production, anchored by decades-deep corn ethanol infrastructure and a fast-expanding renewable diesel base drawing on low-carbon fuel credit economics unmatched anywhere else in the world, while South Asia and East Asia post the fastest regional growth rates through 2036.

North America

Corn ethanol built America's biofuel industry, but renewable diesel is where new capital is flowing now. The Renewable Fuel Standard mandates roughly 20 billion gallons of conventional and advanced biofuel annually, while California's Low Carbon Fuel Standard and comparable programs in Oregon and Washington layer additional credit revenue onto renewable diesel producers converting former petroleum refineries. The United States exported over 1.5 billion gallons of ethanol in 2025, and Canada's clean fuel regulations are opening a parallel demand pool worth tracking closely. Feedstock access, from Midwest corn and soybean belts to Gulf Coast used cooking oil imports, keeps North America cost-advantaged relative to most other producing regions worldwide. Investment continues accelerating.
Share: 32% | CAGR: 8.6% (2026 to 2036)

Western Europe

Biodiesel from rapeseed and used cooking oil built Western Europe's biofuel base, and the Renewable Energy Directive's revised targets now push blenders toward advanced, non-food feedstocks across most member states. Germany, France, and the Netherlands host the region's largest biodiesel and hydrotreated vegetable oil capacity, with Neste's Rotterdam facility among the world's largest renewable diesel plants. Sustainability certification requirements under RED III are tightening supply chain traceability considerably, raising compliance costs for smaller producers while advantaging integrated majors with in-house feedstock verification systems already in place. Aviation fuel competition for the same waste-oil feedstock pool is a growing constraint unique to this region's tight regulatory environment overall. Compliance costs keep climbing steadily.
Share: 19% | CAGR: 6.8% (2026 to 2036)
Regional intelligence for 5 additional markets available in the complete report: East Asia, South Asia and Pacific, Latin America, Middle East and Africa, Eastern Europe. Contact sales@marketmindsadvisory.com.
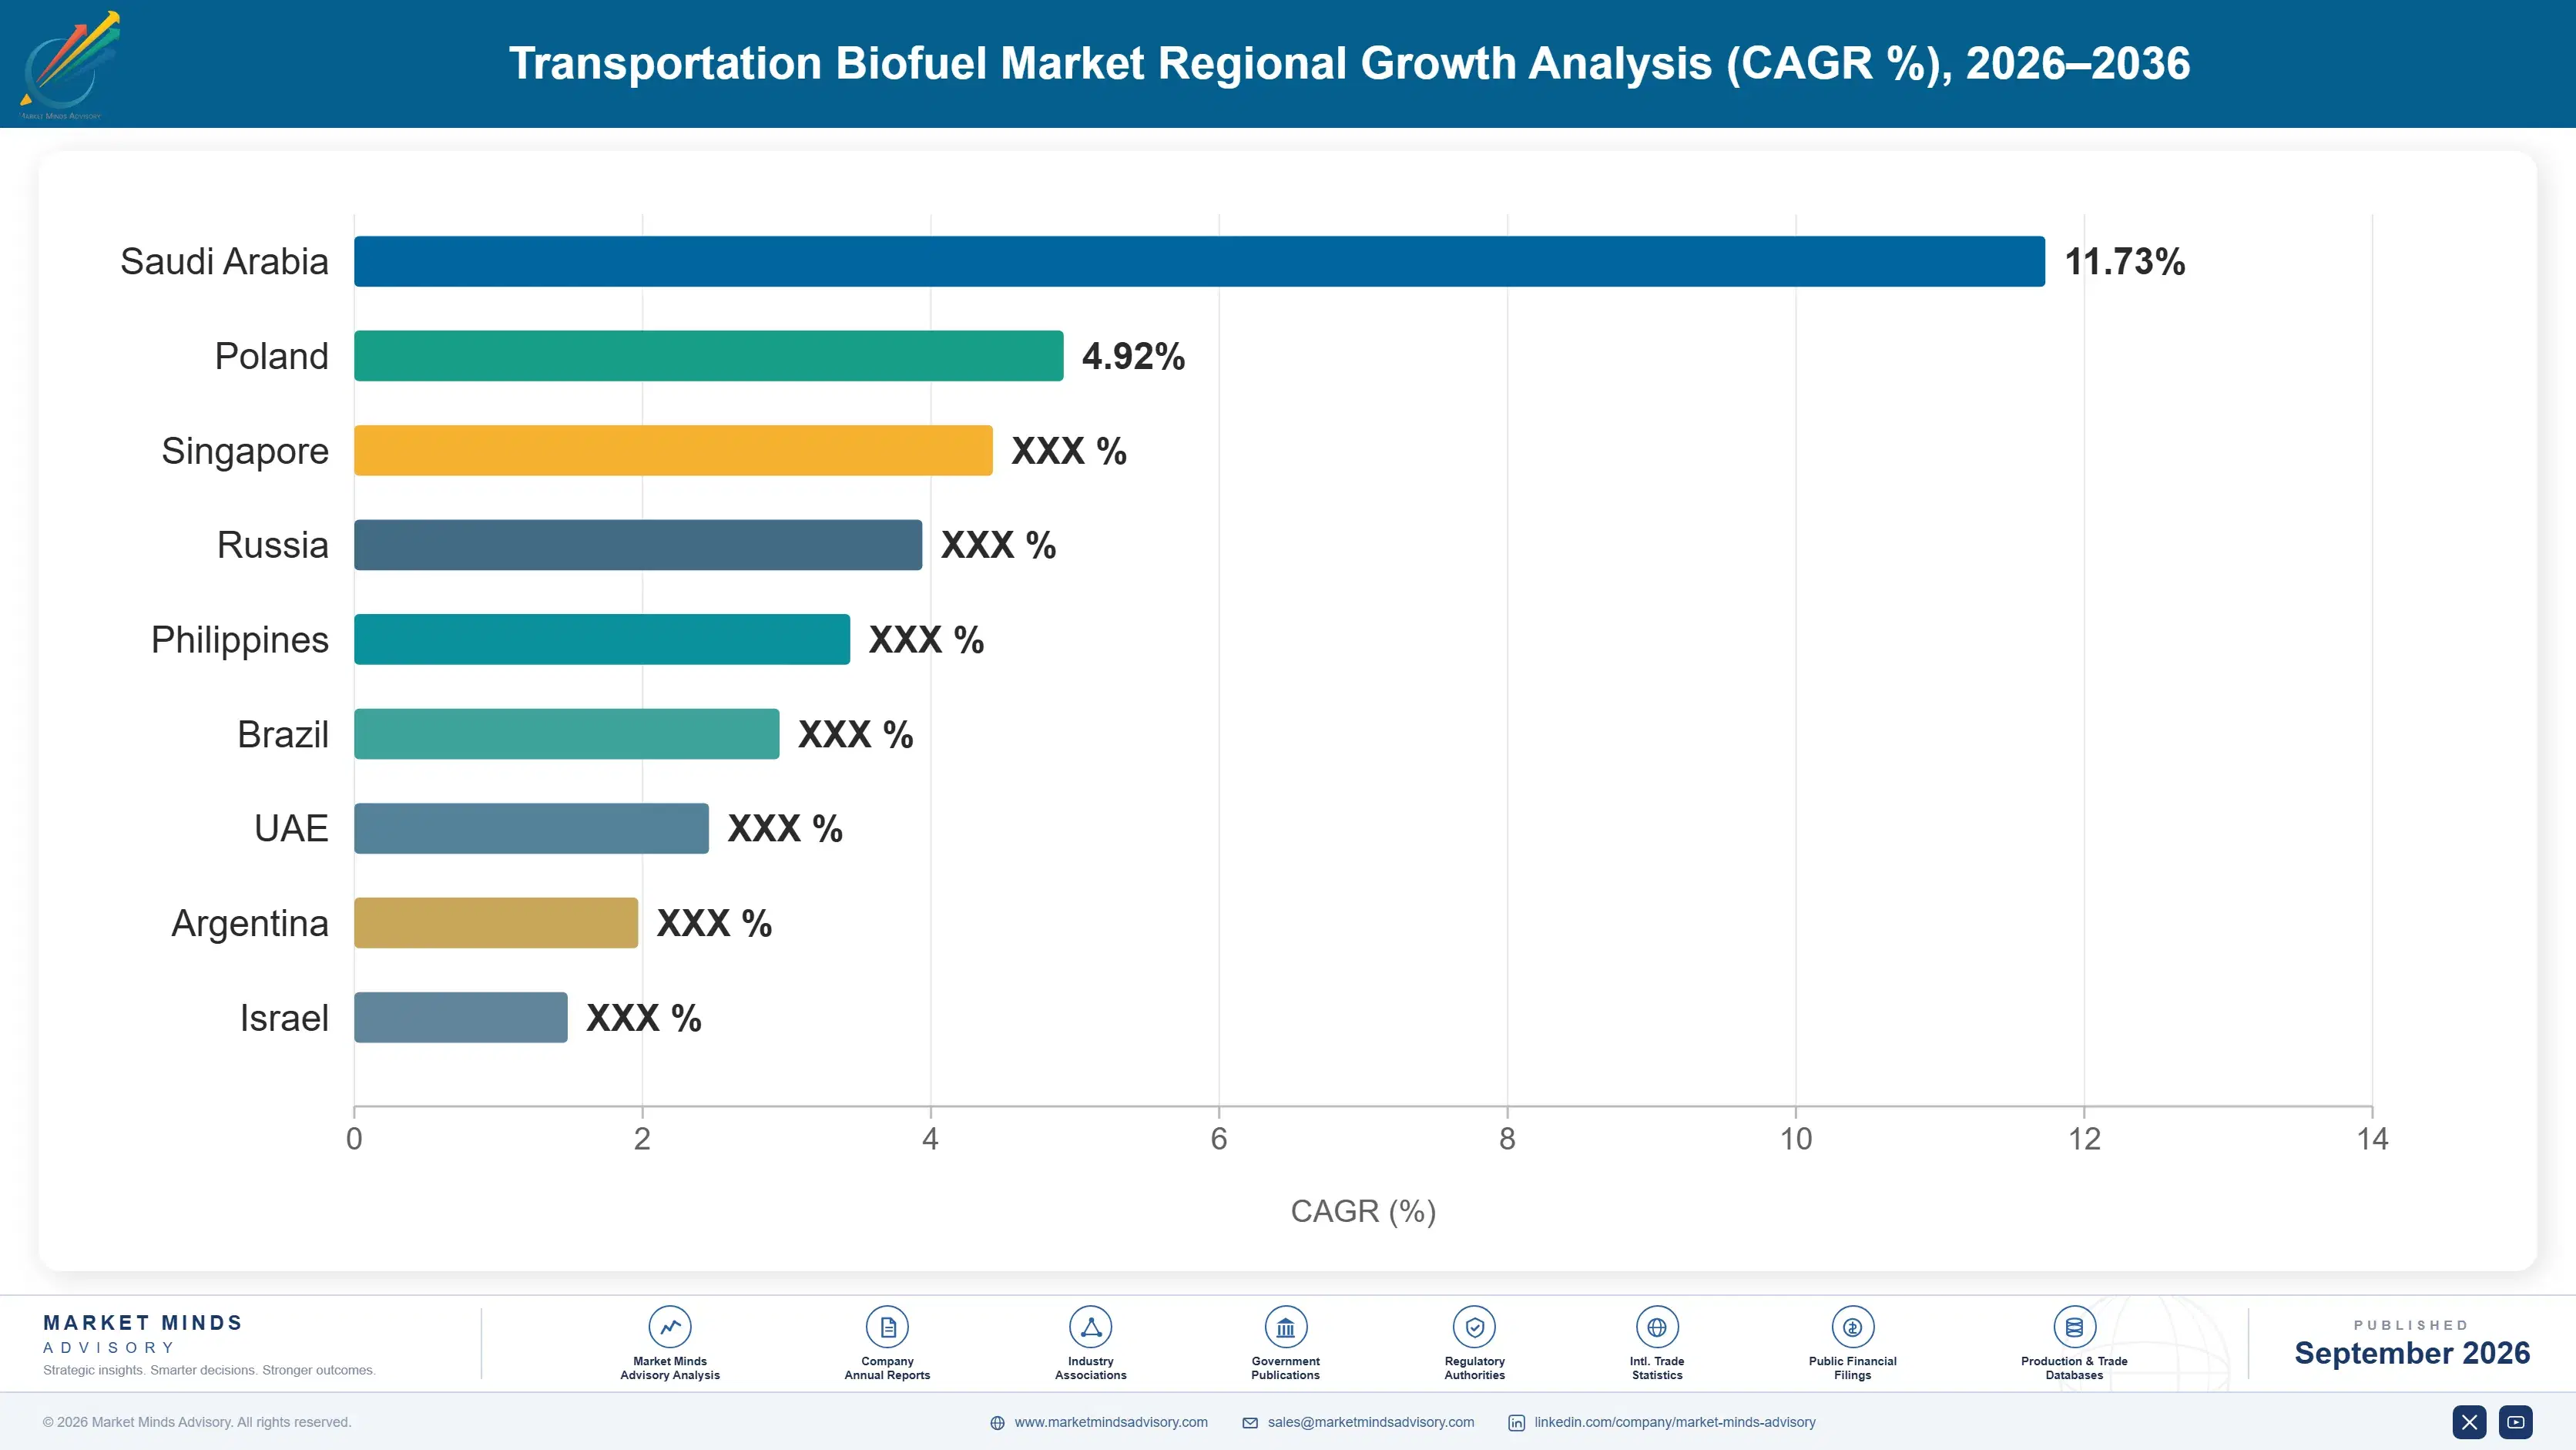
transportation-biofuel-market-country-cagr-analysis-1788256640215

Feedstock Flexibility and Credit Capture Priorities

Producers generate outsized returns not from blending volume alone but from feedstock optimization, low-carbon credit capture, and diversification into higher-value fuel categories. Four levers stand out as the clearest paths to margin expansion across the entire forecast period, each requiring distinct capital and operational commitments from producers pursuing them seriously across multiple production sites nationwide.

Convert Existing Biodiesel Capacity to Renewable Diesel

Retrofitting conventional biodiesel esterification units into renewable diesel hydrotreating facilities captures a 15 to 25 percent price premium per gallon due to renewable diesel's chemical equivalence to petroleum diesel and eligibility for stacked low-carbon fuel credits across multiple overlapping jurisdictions and compliance periods. This conversion pathway costs roughly 40 percent less than greenfield construction and cuts project timelines by a comparable margin, making it the fastest route to renewable diesel exposure for existing biodiesel producers with underutilized processing infrastructure sitting idle across most legacy production sites nationwide and internationally as well.
Market Impact: Captures a 15 to 25% price premium per gallon

Diversify Feedstock Sourcing Beyond Food-Grade Crops

Shifting feedstock mix toward used cooking oil, animal fat, and non-food energy crops reduces exposure to the 20 to 40 percent annual price swings that characterize corn and soybean oil markets, while often qualifying for higher carbon-intensity credit values under most low-carbon fuel standard frameworks currently in force across major producing and consuming jurisdictions worldwide today. Producers with diversified sourcing capability sustained roughly 8 percentage points higher gross margin than single-feedstock competitors during the last major grain price spike cycle across the broader industry and its wider global supply base overall.
Market Impact: Adds roughly 8 percentage points of gross margin

Secure Long-Term Offtake Agreements With Fleet Operators

Multi-year supply contracts with municipal transit agencies, freight fleets, and airlines exploring sustainable aviation fuel adjacencies lock in volume and pricing certainty that spot-market sales cannot match, typically commanding 10 to 15 percent premium pricing over uncommitted spot volumes across most contract categories and buyer segments nationwide and considerably further abroad. These agreements also support project financing for capacity expansion, since lenders view contracted offtake as meaningfully lower credit risk than speculative production ramp-ups without secured buyers already under long-term contract commitments spanning multiple years, contract types, buyer classes, and geographies.
Market Impact: Secures 10 to 15% premium pricing broadly overall

Build Blockchain-Based Feedstock Traceability Systems Broadly

Investing in third-party isotopic testing and blockchain traceability documentation protects premium credit eligibility from fraud-related regulatory disqualification, a risk that has already stripped credit eligibility from an estimated 10 to 15 percent of flagged import volumes in recent enforcement actions across multiple jurisdictions and customs authorities worldwide today and going forward. Producers with verified supply chains increasingly command buyer preference and premium pricing from risk-averse purchasers seeking to avoid reputational exposure tied to fraudulent feedstock documentation entirely across their procurement networks worldwide and considerably beyond their core home markets entirely.
Market Impact: Protects against 10 to 15% credit loss annually

Who Controls the Margin Pool

The transportation biofuel market remains moderately fragmented, with the top five producers holding an estimated 40 percent combined production volume share globally today. Archer-Daniels-Midland and POET lead US ethanol output by a wide margin over mid-tier processors, while Neste's early renewable diesel scale gives it a similar gap over conventional biodiesel challengers still converting capacity across multiple continents and production sites worldwide.
Current competitive activity centers on hydrotreating capacity conversions, feedstock supply agreements, and low-carbon fuel credit optimization rather than pure volume expansion alone across most producer strategies. Integrated oil majors including Chevron and Phillips 66 have entered renewable diesel through joint ventures and standalone builds, intensifying competition for used cooking oil and animal fat feedstock against established agricultural processors across nearly every major producing region worldwide.

Rankings could shift meaningfully as feedstock fraud enforcement tightens and traceability requirements raise compliance costs unevenly across the field. Producers with vertically integrated feedstock sourcing and established credit certification infrastructure are best positioned, while smaller biodiesel-only players risk losing ground to renewable diesel converters with deeper capital access and considerably stronger regulatory relationships across most major consuming markets globally.
transportation-biofuel-market-company-positioning-matrix-1788256640735

Competitive Moat and Risk Dimensions

ARCHER-DANIELS-MIDLAND

Moat: Integrated Feedstock Origination Scale

ADM's global grain origination and processing network gives it feedstock cost and reliability advantages that smaller ethanol and biodiesel producers cannot match, spanning both domestic corn belt sourcing and international soybean oil trade flows across multiple continents and sourcing regions, reinforced by decades of accumulated logistics and storage infrastructure investment across its extensive terminal network.
ARCHER-DANIELS-MIDLAND

Risk: Food Versus Fuel Exposure

ADM's dual role as a major food ingredient supplier and biofuel feedstock processor exposes it to political and regulatory scrutiny whenever grain prices spike, since food security advocates periodically pressure policymakers to cap biofuel-driven agricultural demand, creating recurring headline risk that smaller pure-play biofuel producers rarely face at comparable intensity.
NESTE

Moat: Renewable Diesel First-Mover Scale

Neste's early and sustained investment in renewable diesel hydrotreating technology gives it the industry's largest dedicated capacity base and deepest technical expertise in processing diverse waste-oil feedstocks, reinforcing a durable cost and reliability advantage over later entrants still scaling up their own conversion projects and feedstock sourcing relationships across multiple continents and supplier networks.
NESTE

Risk: Feedstock Sourcing Concentration Risk

Neste's reliance on imported used cooking oil and animal fat from a concentrated set of Asian and European suppliers leaves it exposed to the same fraud-related traceability scrutiny reshaping import verification requirements across the entire renewable diesel industry, a vulnerability that could raise compliance costs meaningfully if enforcement actions accelerate further in coming years.

Players Tracked

Prominent Players

Archer-Daniels-Midland
POET
Neste
Renewable Energy Group
Valero Renewable Diesel

Other Key Players

Cargill
Louis Dreyfus Company
Wilmar International
Raizen
Green Plains
CHS Inc
Darling Ingredients
Marathon Petroleum
Phillips 66
Chevron
BP
Bunge Limited
Diamond Green Diesel
World Energy
Gevo

Recent Developments

MARCH 2026

Chevron completed a joint venture renewable diesel facility expansion in Louisiana, adding significant hydrotreating capacity to serve growing West Coast low-carbon fuel credit demand and diversify its feedstock intake beyond soybean oil into used cooking oil and animal fat streams sourced from multiple domestic and international suppliers.
Signal: Signals integrated oil majors are committing serious long-term capital to renewable diesel production capacity broadly nationwide
NOVEMBER 2025

POET acquired several ethanol production facilities from a competitor exiting the Midwest market, consolidating regional distillery capacity and strengthening its position as the largest dedicated ethanol producer well ahead of Archer-Daniels-Midland in several key corn belt states across the wider region and its distribution network.
Signal: Signals continued consolidation among mid-tier ethanol producers facing sustained margin pressure nationwide today and well beyond
JUNE 2025

Neste signed a multi-year feedstock supply agreement with a major Southeast Asian used cooking oil aggregator, securing traceable volume ahead of tightening European Union sustainability certification requirements taking effect under the newly revised Renewable Energy Directive framework across all member states and associated trading partners.
Signal: Signals traceability and verified sourcing are becoming decisive competitive differentiators across the entire global industry now

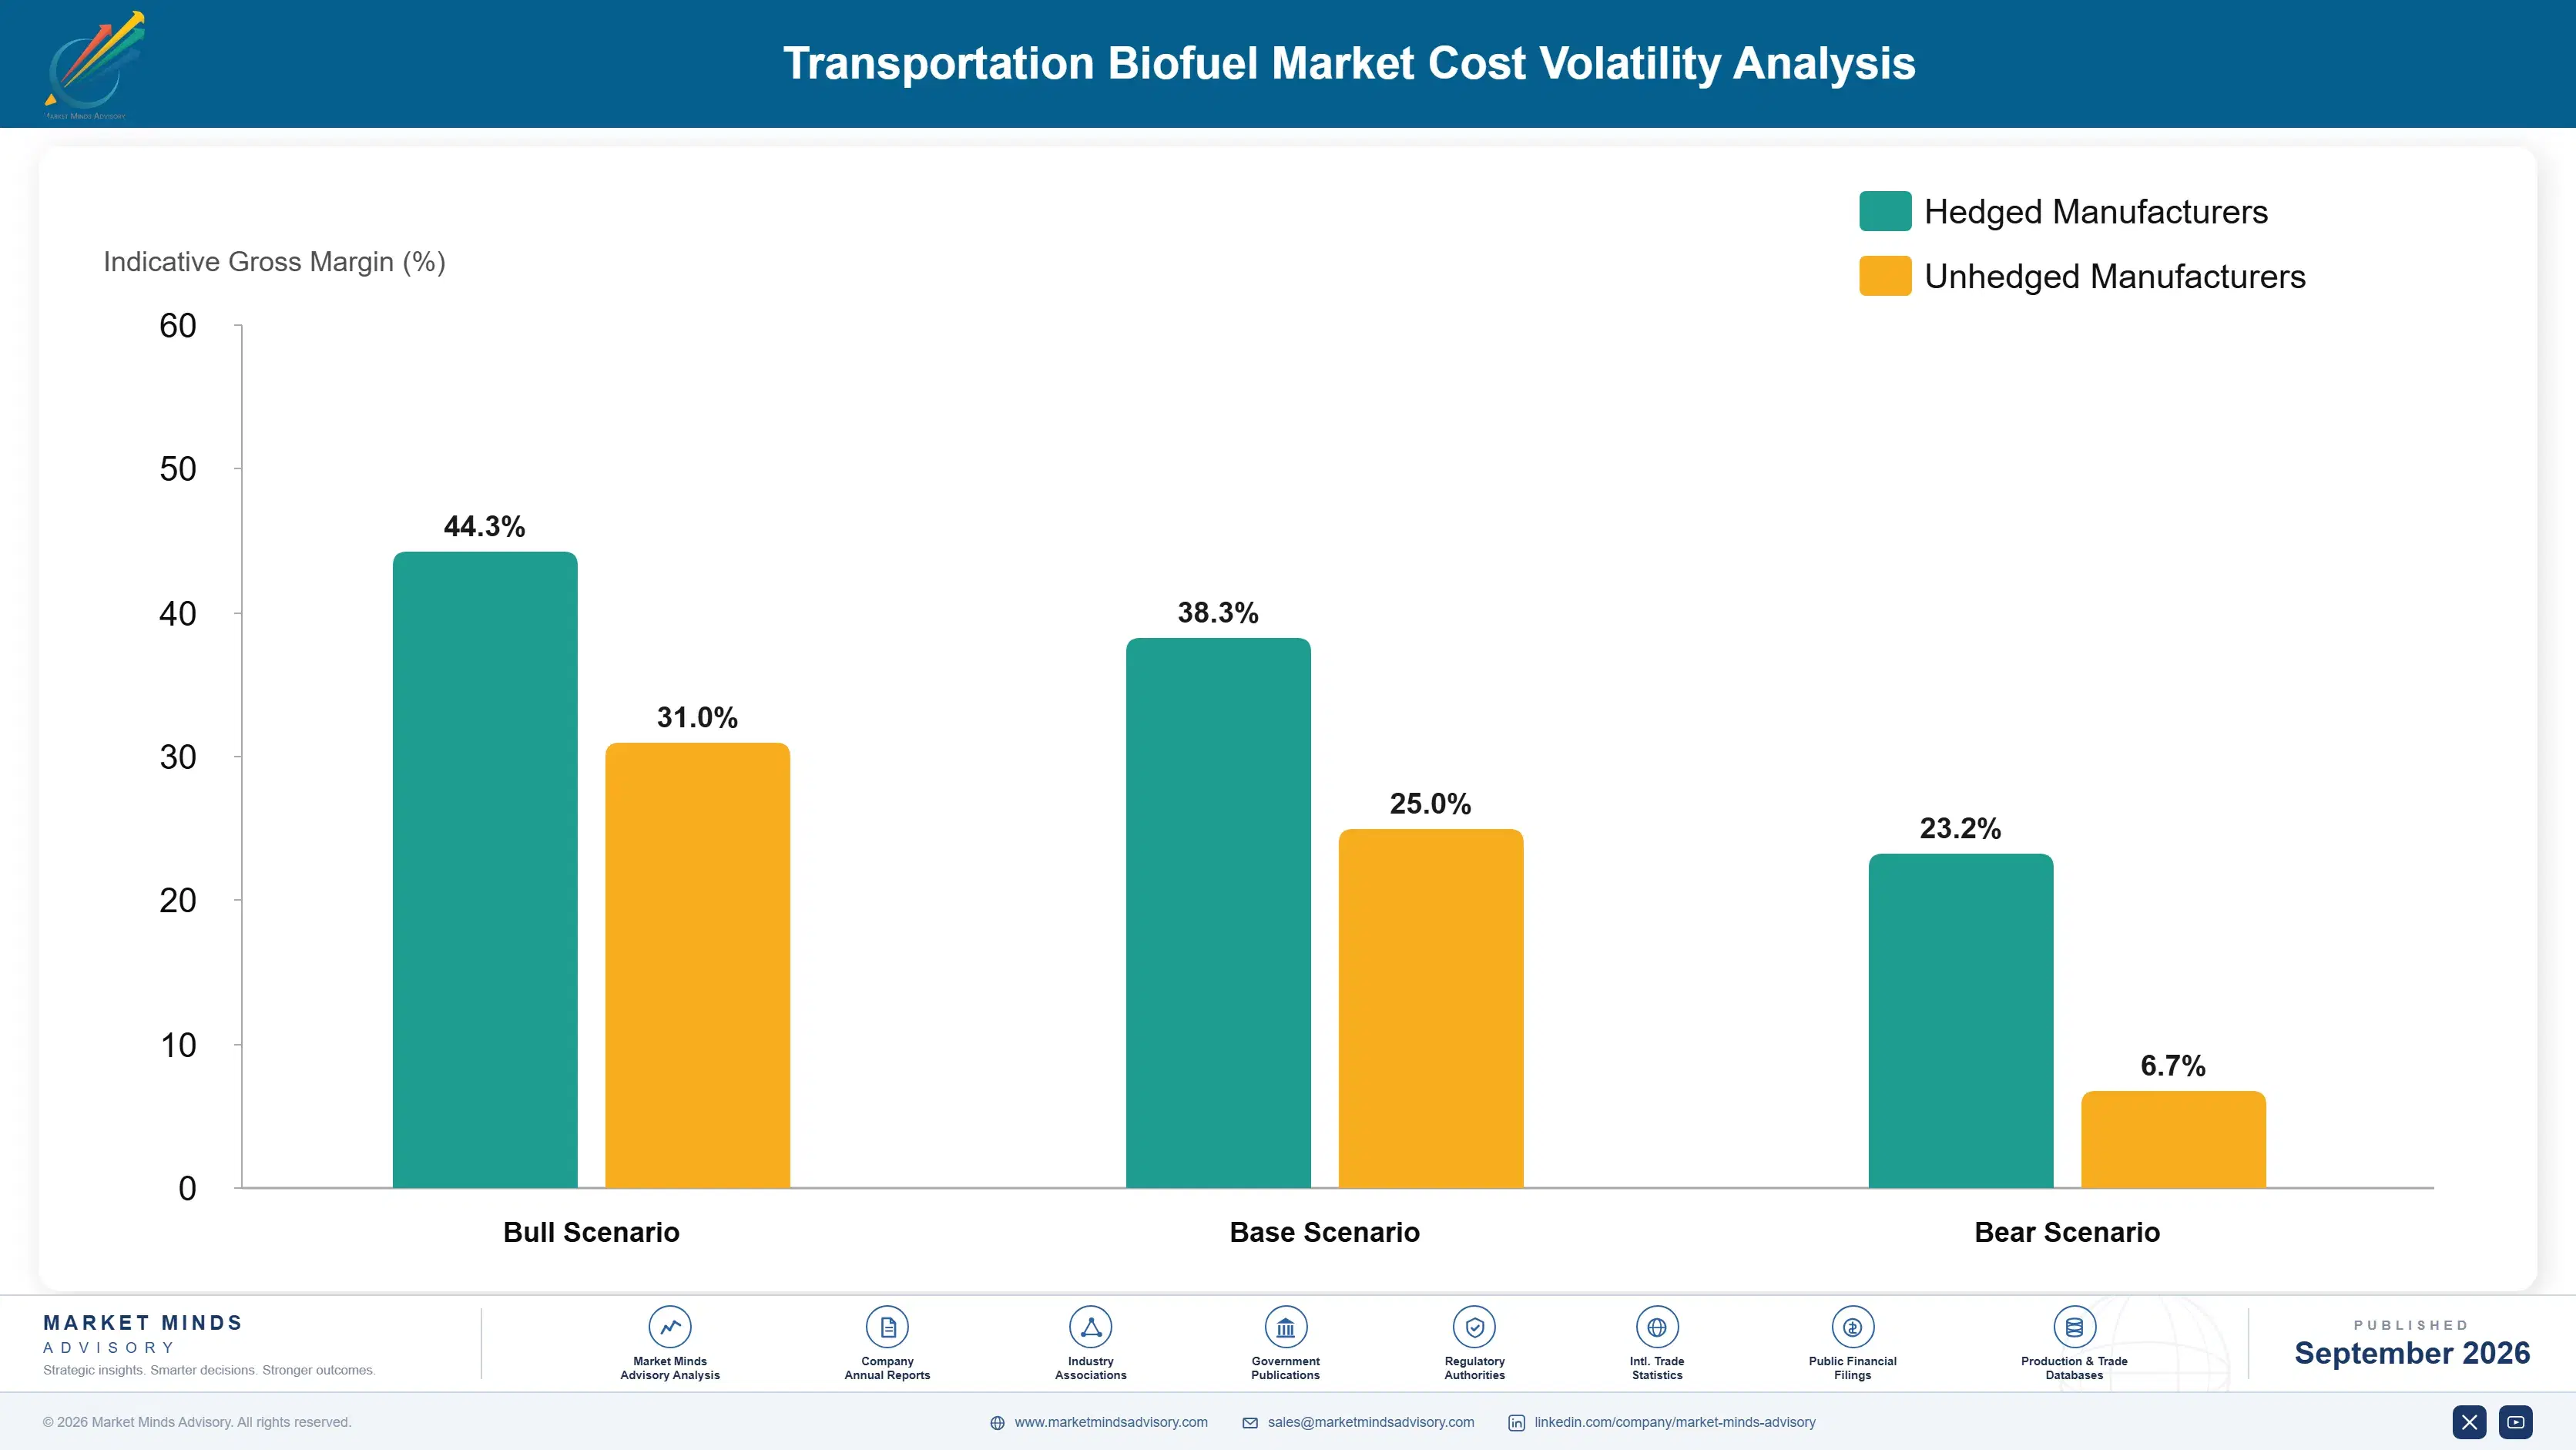
Feedstock Volatility Sets Producer Margins

Feedstock inputs represent 65 to 75 percent of total production cost for most biofuel producers, spanning corn, soybean oil, palm oil, used cooking oil, and animal fat depending on process and geography. Corn originates almost entirely from domestic Midwest supply for US ethanol producers, while soybean oil and used cooking oil increasingly flow through international trade channels spanning Asia, South America, and Europe.
The 2024 to 2025 harvest cycle saw soybean oil prices swing more than 30 percent within a single year, according to USDA data, squeezing biodiesel producer margins across North America and prompting several smaller processors to idle capacity temporarily rather than operate at a loss during the worst months of the price spike, a pattern that recurred to a lesser degree in the European rapeseed market during the same period.

Producers without diversified feedstock access face a lasting cost disadvantage against integrated players who can shift between corn, soybean oil, used cooking oil, and animal fat as relative prices move. This dynamic increasingly favors large agricultural processors and integrated oil majors with global sourcing networks over smaller regional biodiesel producers tied to a single feedstock source.
transportation-biofuel-market-cost-volatility-analysis-1788256640930

Diversify Across Multiple Feedstock Categories

Producers capable of switching between corn, soybean oil, used cooking oil, and animal fat as relative prices shift avoid the worst margin compression during single-feedstock price spikes, preserving profitability across volatile harvest cycles and import disruptions that periodically hit less flexible single-source competitors particularly hard each year across most producing regions worldwide and beyond.

Lock In Multi-Year Feedstock Supply Contracts

Forward contracts with agricultural cooperatives and waste-oil aggregators smooth input cost volatility, trading some upside during favorable price periods for protection against the sharp spikes that have repeatedly disrupted smaller producers' margins in recent years, while also providing lenders considerably greater confidence when evaluating capacity expansion financing requests submitted by growth-oriented producers nationwide and abroad.

Expand Non-Food Waste Feedstock Sourcing

Investing in used cooking oil collection networks and animal fat rendering partnerships reduces exposure to food-crop price cycles entirely, while often qualifying for higher carbon-intensity credit values that partially offset the added logistics cost of waste-stream collection efforts across dispersed and often heavily fragmented regional supply networks nationwide and considerably further abroad as well.

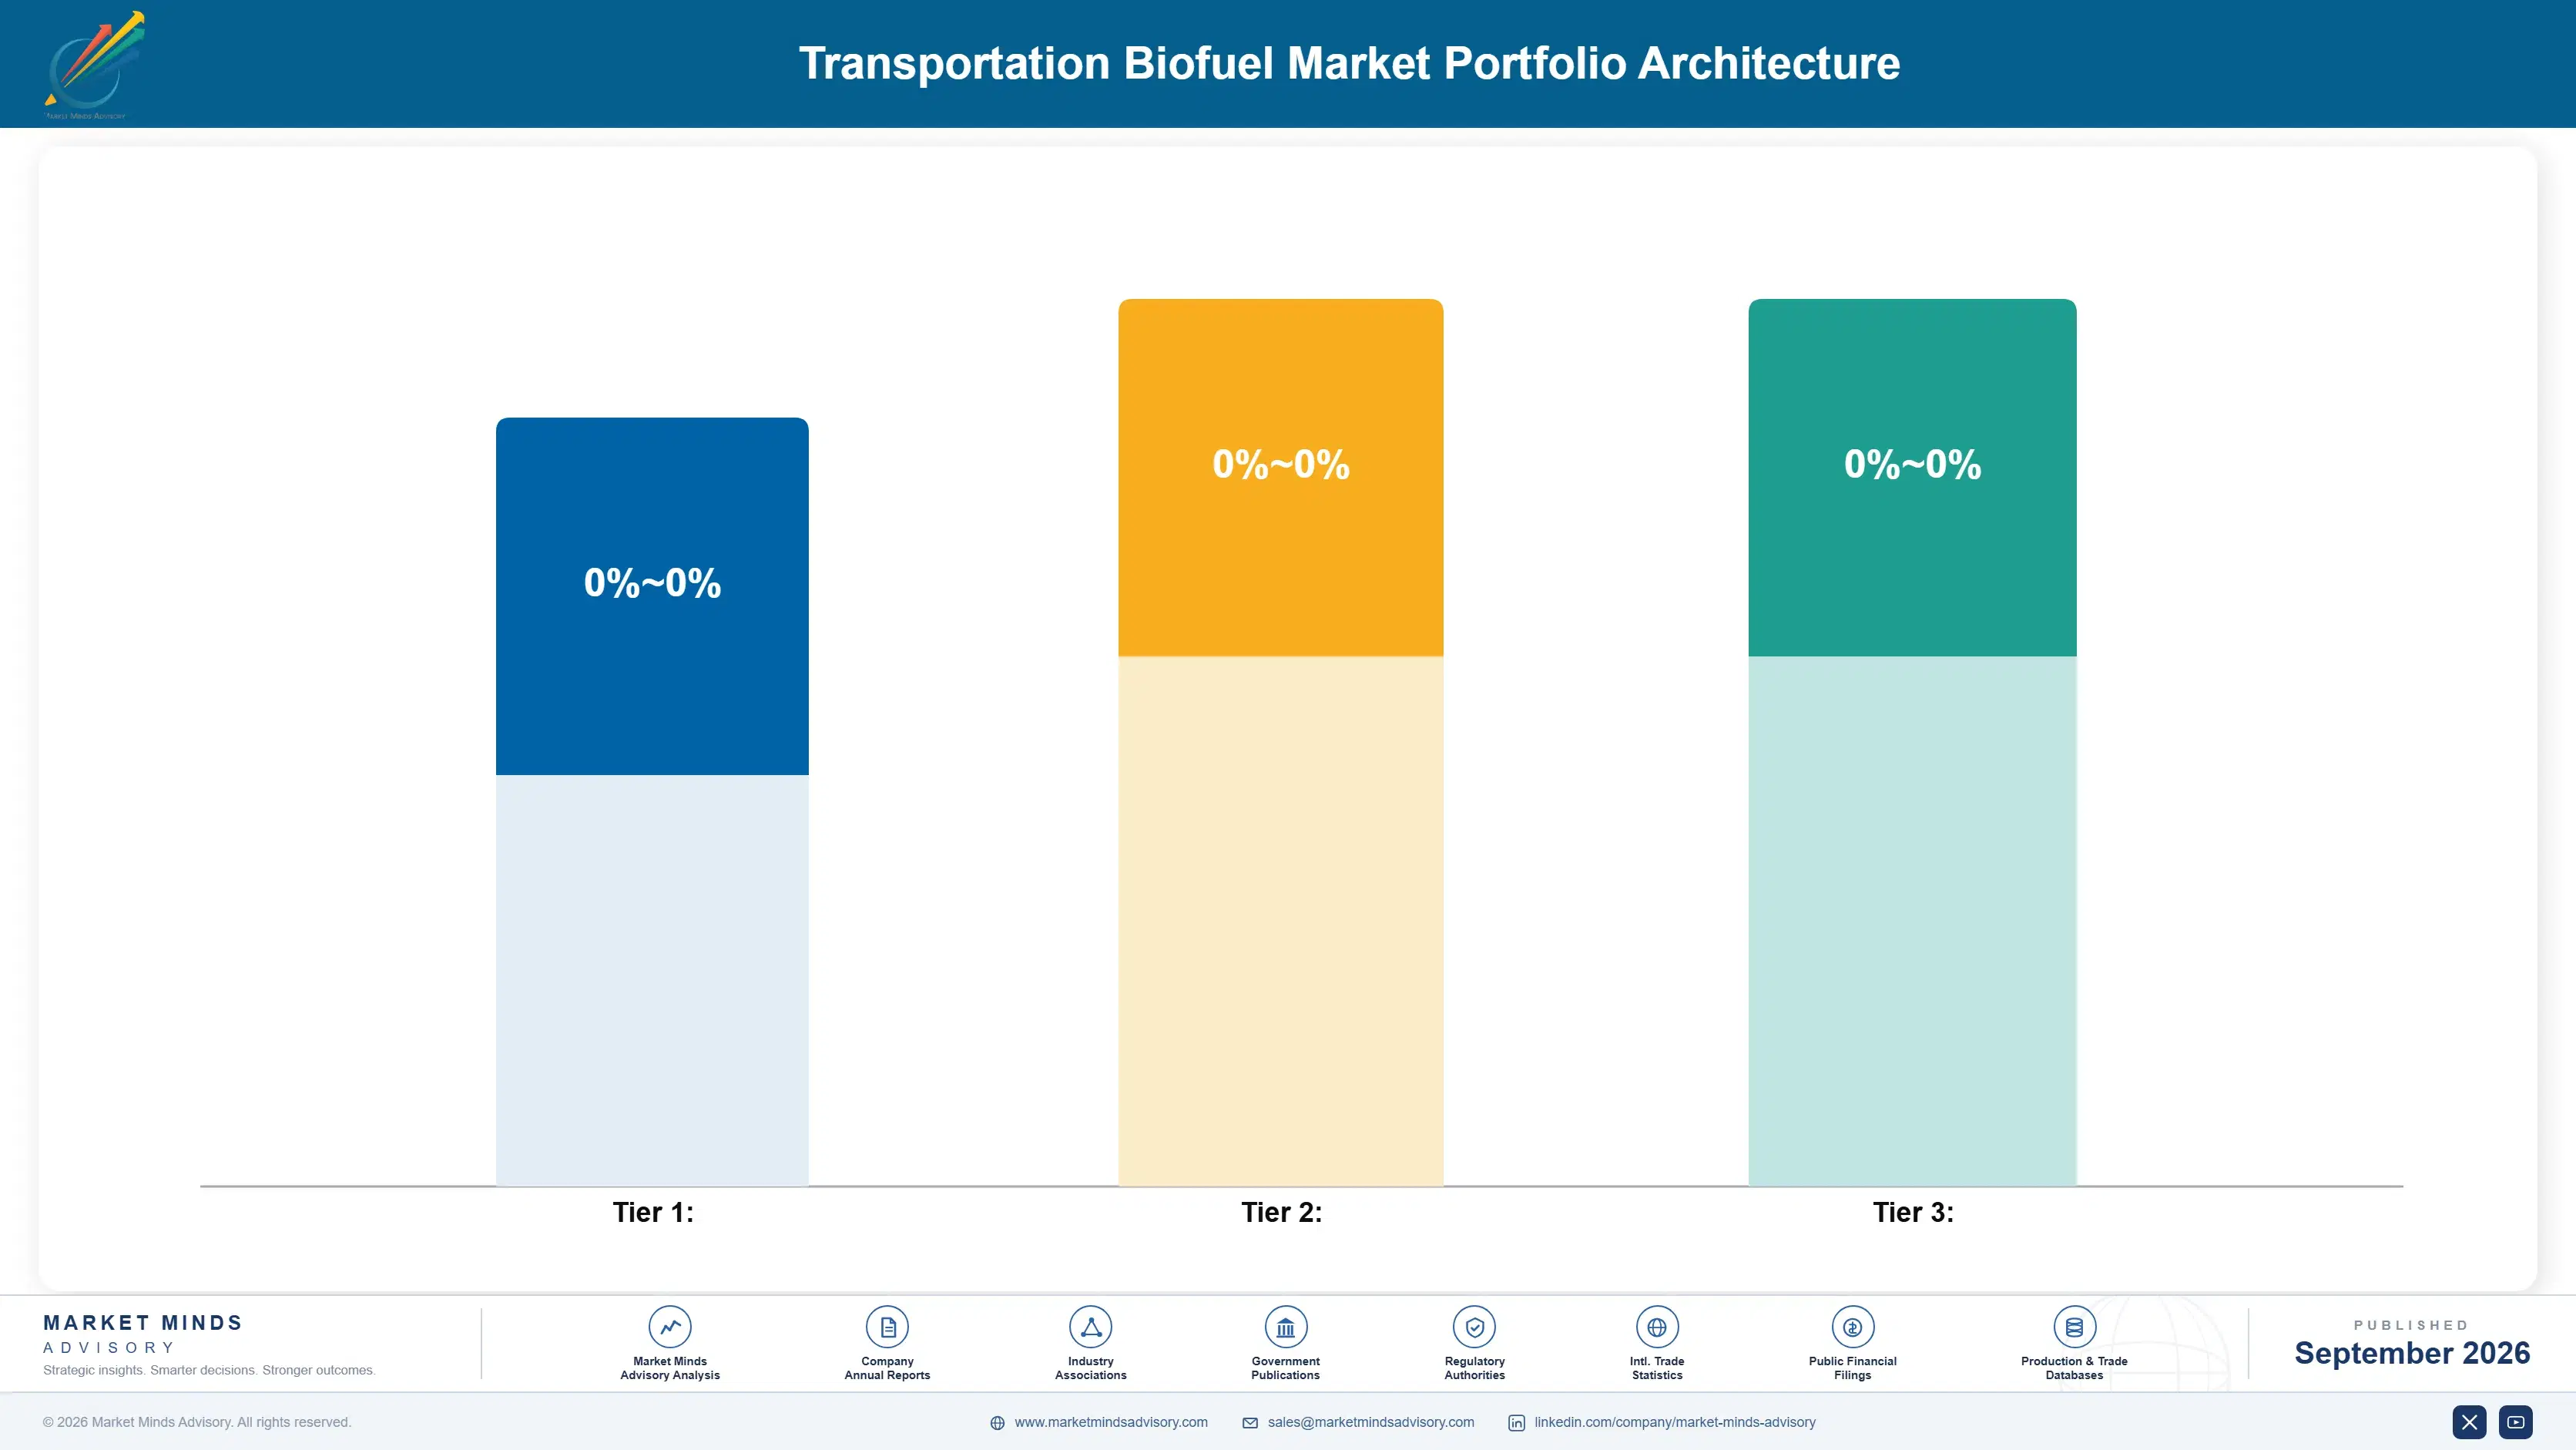
Portfolio Architecture for Margin Defence

Producer portfolios split across three tiers: commodity ethanol and biodiesel selling on volume and price, certified low-carbon fuels commanding credit-driven premiums, and next-generation pathways still scaling toward commercial maturity across most producing regions worldwide. Margin economics diverge sharply between tiers, and the gap has widened considerably over the past several years as credit programs matured and expanded.
Volume producers compete almost entirely on feedstock cost and operating efficiency, with thin margins that leave little room for differentiation beyond scale and logistics advantages built up over many years of accumulated investment. Premium renewable diesel and biomethane producers capture meaningfully wider margins through low-carbon fuel credit stacking, insulating them from the pure commodity price competition that defines the volume tier across most producing regions worldwide.

High-value pools concentrate in renewable diesel, sustainable aviation fuel feedstock supply, and biomethane, where credit stacking and feedstock traceability premiums reward producers willing to invest in certification and supply chain verification infrastructure fully. Conventional grain ethanol remains the volume anchor but offers limited margin upside absent a fundamental shift in credit program structure or blending mandate escalation across major consuming markets worldwide.

Conventional corn and grain ethanol competing primarily on feedstock cost and production scale efficiency, with margins largely set by commodity grain and gasoline blend pricing rather than genuine product differentiation across most producer portfolios.
Gross Margin

Renewable diesel and certified biodiesel capturing low-carbon fuel credit premiums on top of base fuel pricing, supported by chemical equivalence to petroleum diesel that removes blending constraints entirely for most fleet and refinery customers.
Gross Margin

Biomethane, advanced cellulosic feedstocks, and sustainable aviation fuel adjacent pathways still scaling commercially, offering the strongest theoretical margins but carrying meaningfully higher technology and commercialization risk for early-stage capital investors.
Gross Margin
transportation-biofuel-market-portfolio-architecture-1788256641437

High-value Sub-segments and Strategic Watch-out

Renewable Diesel (HVO/HEFA)

The clearest high-value, high-growth pool, combining strong credit-driven margins with a 14 percent CAGR as refiners convert existing capacity rapidly and integrated oil majors continue entering the segment through joint ventures and standalone hydrotreating facility conversions across multiple continents, feedstock categories, and regulatory jurisdictions worldwide.

Biomethane and Bio-CNG for Transport

Strong margins and steady growth from European pipeline injection economics and heavy-vehicle decarbonization mandate support across the region, with anaerobic digestion capacity expanding steadily as fleet operators seek compressed natural gas compatible fuel alternatives that avoid dedicated electric vehicle charging infrastructure investment entirely across their fleets.

Corn and Grain Ethanol

The volume core, generating most industry revenue despite thinner margins, anchored by mature blending mandate infrastructure across North America, Brazil, and increasingly India, where flex-fuel vehicle penetration and guaranteed distillery purchase pricing sustain steady baseline demand regardless of broader commodity price cycles and harvest conditions.

Cellulosic and Advanced Biofuels

A strategic watch-out given persistent commercialization delays despite substantial policy support and years of pilot-scale investment across several countries, since cellulosic conversion technology has repeatedly missed cost-reduction targets that would make it competitive with conventional grain-based ethanol production at meaningful commercial scale and total volume.

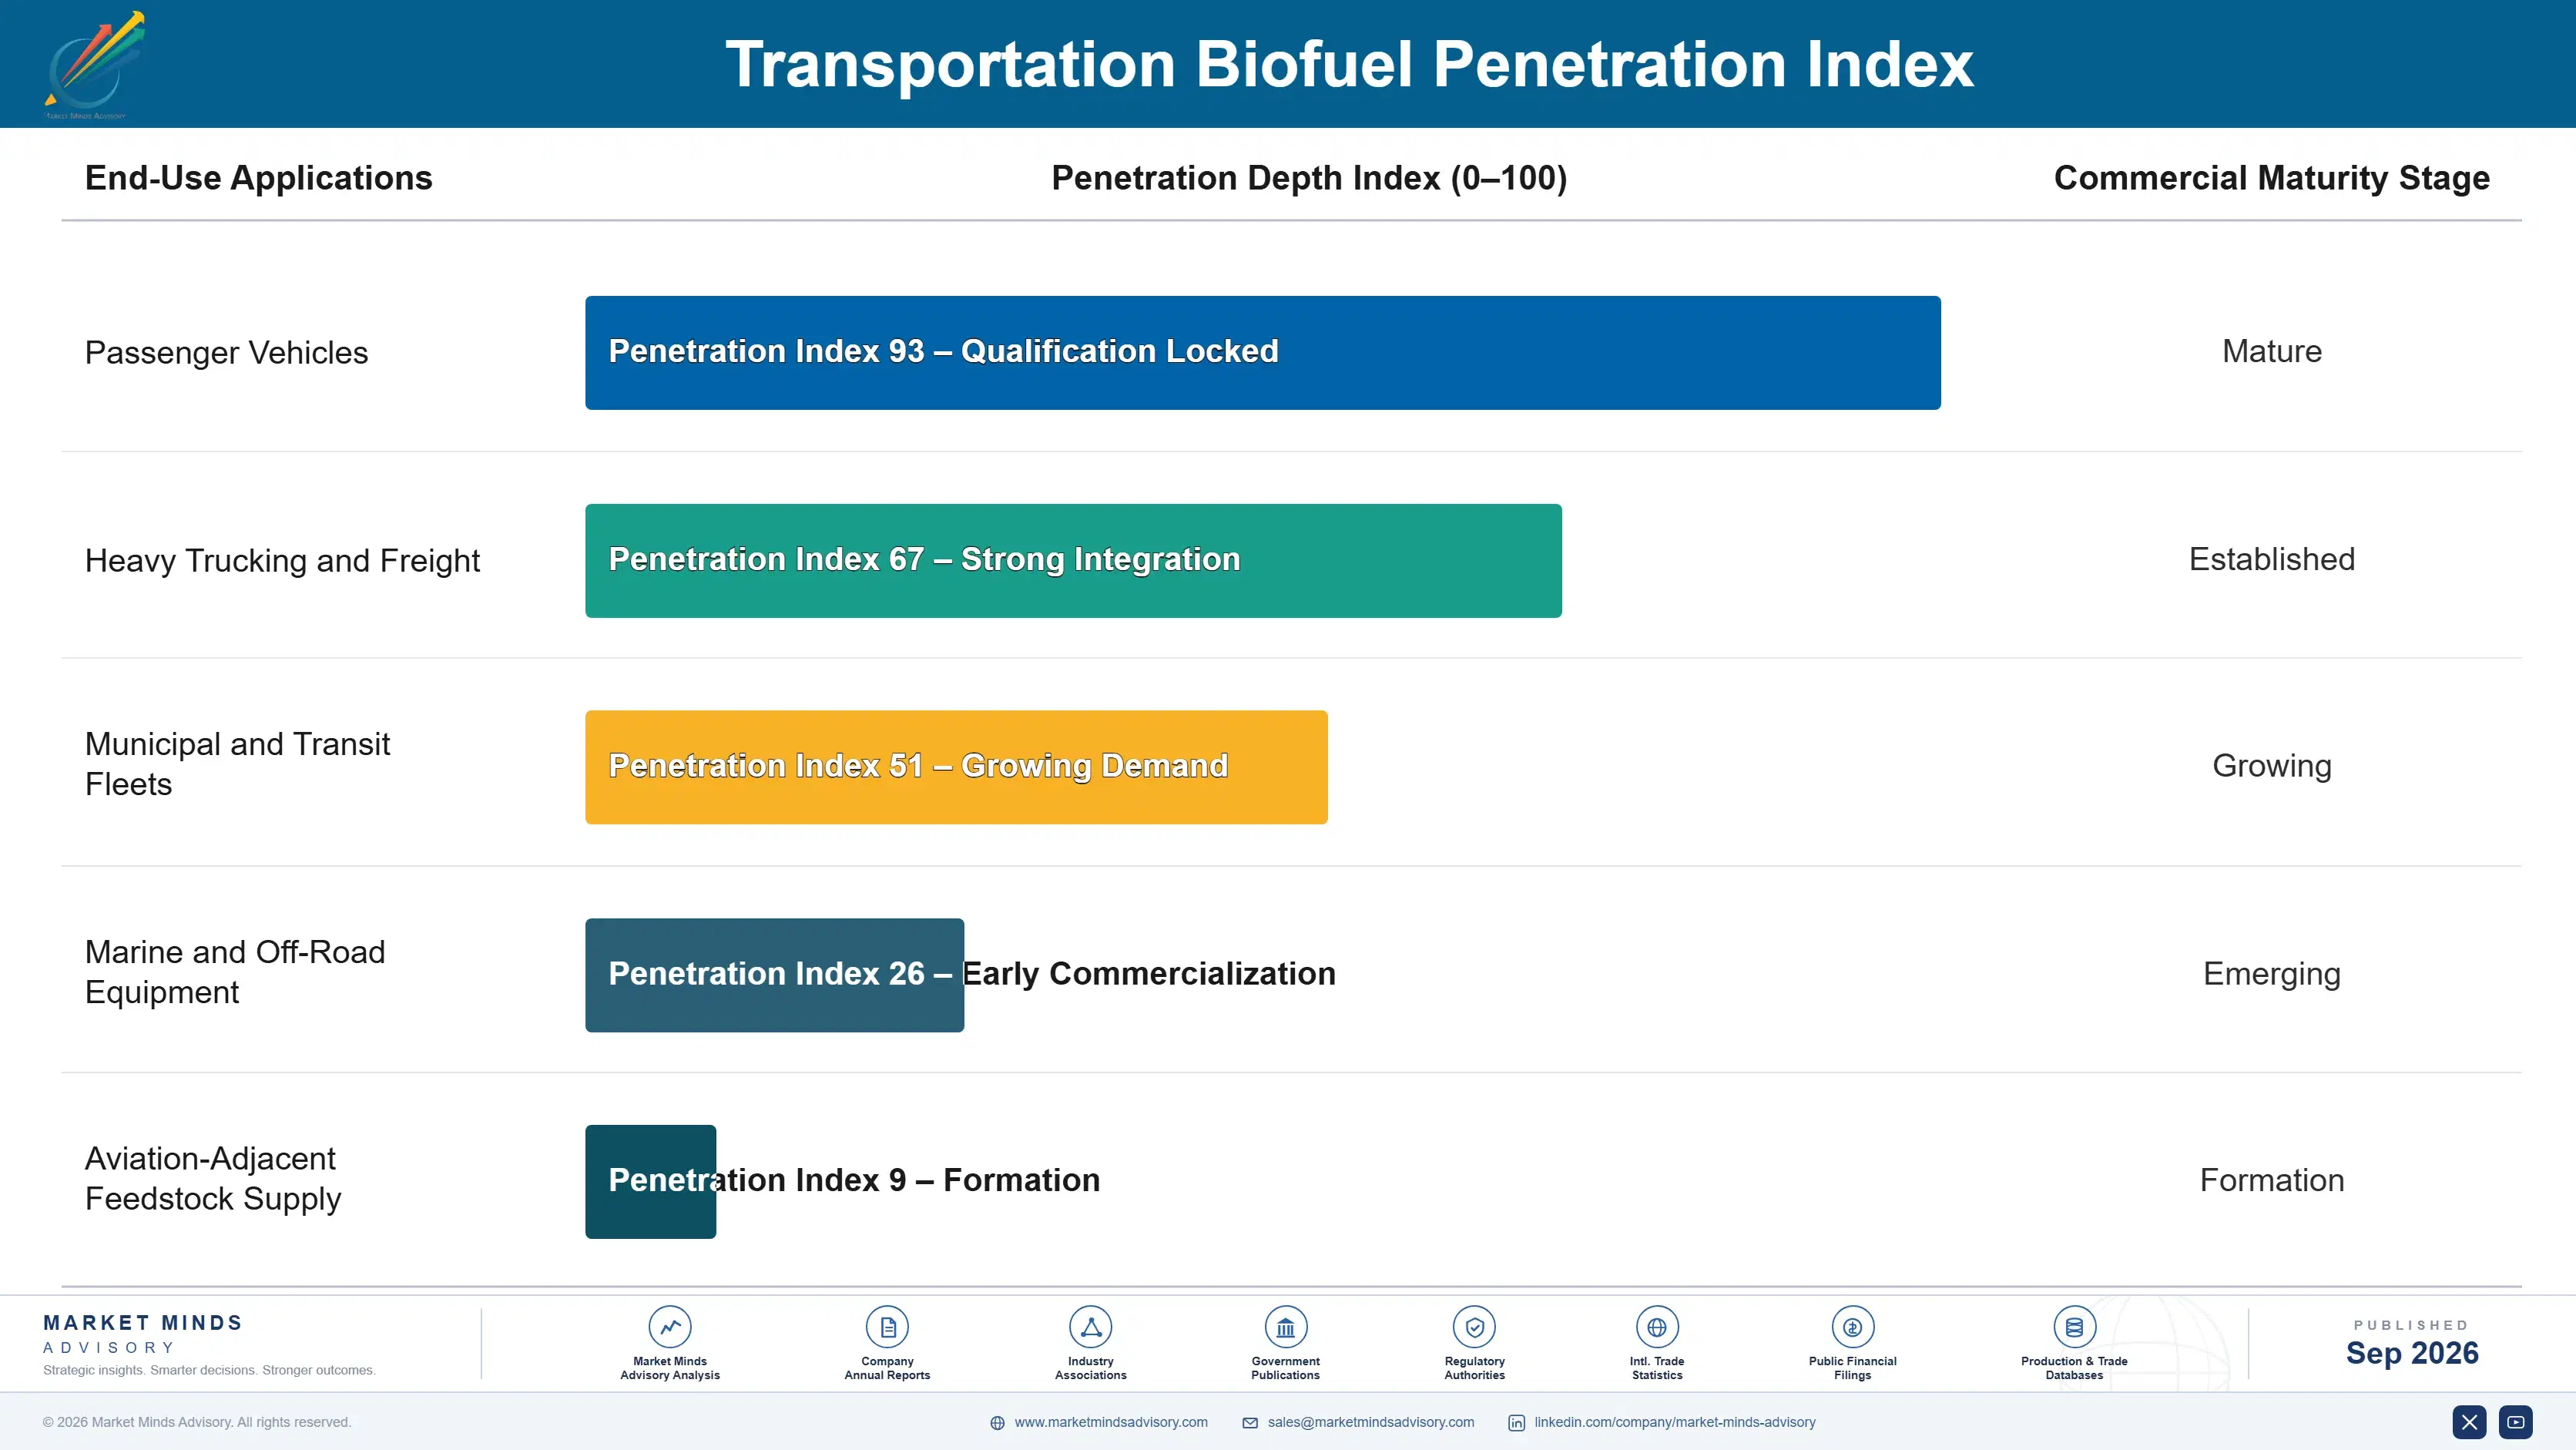
Mandate-Anchored Demand Meets Credit Cycles

Blending mandates create annuity-like baseline demand that persists regardless of oil price cycles, since fuel blenders must meet regulatory volume obligations or purchase compliance credits, giving biofuel producers a demand floor most other commodity categories never achieve across an entire economic cycle. This mandate-anchored structure means producers can plan capacity investment against a known demand trajectory rather than speculative growth assumptions.
Adoption depth varies considerably by end-use vertical: road transport blending is essentially universal across mandate jurisdictions, while heavy trucking and marine applications remain earlier in adoption, constrained by engine compatibility and fuel availability infrastructure that lags passenger vehicle blending networks by several years in most regions. Aviation-adjacent sustainable fuel demand is earliest still, dependent on dedicated supply agreements rather than blanket mandate coverage across most jurisdictions worldwide.

Buyer profiles are shifting generationally as integrated oil majors and airlines exploring sustainable aviation fuel adjacencies enter procurement conversations once dominated entirely by agricultural cooperatives and independent fuel blenders, bringing considerably larger balance sheets and longer contract horizons to negotiations. Younger sustainability-focused corporate buyers are also entering directly through voluntary low-carbon fuel procurement programs that extend beyond regulatory compliance requirements alone.
transportation-biofuel-market-end-use-penetration-index-1788256641919

Feedstock and Credit Positioning Priorities

These are among the four positions where our research anticipates prominent divergence between winners and laggards over the coming forecast period. Each is grounded in the demand model, the regulatory perimeter, and the announced capacity pipeline.
01 / CAPACITY CONVERSION STRATEGY

Convert biodiesel capacity to renewable diesel now

Producers still operating conventional biodiesel esterification units face a widening margin gap against renewable diesel converters already capturing stacked low-carbon fuel credits worth 15 to 25 percent price premiums per gallon across most eligible jurisdictions today and expanding tomorrow. Conversion projects take roughly two years from planning to commissioning, meaning producers starting now will reach the market as credit demand continues climbing through the forecast decade ahead. Delaying conversion further risks permanent share loss to faster-moving competitors with considerably better capital access and technical expertise.
02 / FEEDSTOCK DIVERSIFICATION PRIORITY

Build multi-source feedstock sourcing capability broadly

Single-feedstock producers face considerably higher margin volatility than diversified competitors during harvest price spikes that can swing input costs by 20 to 40 percent within a single year across most producing regions worldwide today. Building sourcing relationships across corn, soybean oil, used cooking oil, and animal fat takes years of relationship development with agricultural cooperatives and waste aggregators spanning multiple countries. Producers that diversify now will weather the next inevitable price spike considerably better than rigid single-source competitors still exposed entirely.
03 / TRACEABILITY INVESTMENT STRATEGY

Invest in feedstock traceability systems immediately

Regulators are tightening origin verification requirements following widespread fraud concerns around mislabeled palm oil entering the used cooking oil import stream from several major Asian exporting countries over recent enforcement cycles. Producers without credible chain-of-custody documentation risk losing premium credit eligibility entirely as enforcement actions accelerate across the European Union and United States over the coming several years ahead. Early investment in blockchain-based traceability and isotopic testing protects both current revenue and future market access considerably against emerging regulatory risk.
04 / REGIONAL EXPANSION PRIORITY

Prioritize South Asia and Southeast Asia expansion

India's ethanol blending program and Indonesia's biodiesel mandate are driving the fastest demand growth of any region globally, creating substantial opportunity for technology licensors and equipment suppliers with proven distillery expertise and track records. Producers with existing relationships in slower-growing Western markets should evaluate technology licensing and joint venture structures rather than direct capacity investment given local ownership requirements common across the region entirely. This approach captures meaningful growth upside while limiting capital exposure to unfamiliar regulatory environments and currency risk.

Engagement Snapshot From the Field

A live engagement with an industry participant carrying material or product regulatory and market exposure ahead of a defining policy shift, showing how our research translates into a defensible multi-year portfolio strategy.
MARKET MINDS ADVISORY · CLIENT ENGAGEMENT SUMMARY
Transportation Biofuel Producer Strategic Portfolio Review and Transition Roadmap 2026·Investment Scenario on Transportation Biofuel Exposure Evaluation 2025-26
CLIENT PROFILE
A mid-sized biodiesel producer operating a single esterification facility in the Midwest United States sought to evaluate whether converting existing capacity to renewable diesel hydrotreating made financial sense given rising low-carbon fuel credit values and slowing conventional biodiesel demand growth across its traditional regional customer base and long-standing distribution network spanning several nearby Midwestern states.
STRATEGIC CHALLENGE
The client's conventional biodiesel margins had compressed steadily over several years as larger integrated competitors captured growing renewable diesel credit revenue, while the capital cost and technical complexity of a full hydrotreating conversion remained uncertain relative to simply continuing conventional operations at reduced but still positive margin levels for the near term.
MMA APPROACH
MMA benchmarked conversion economics against three completed industry conversions, modeled credit revenue under multiple low-carbon fuel standard price scenarios, and interviewed engineering firms specializing in hydrotreating retrofits to develop a realistic capital cost and timeline estimate for the client's specific facility configuration, feedstock access, and regional logistics constraints very carefully.
KEY FINDINGS
  1. Conversion capital cost estimates ranged from $180 to $240 million depending on existing equipment reuse potential and site conditions (client-reported, unverified by MMA).
  2. Renewable diesel credit revenue could offset conversion capital cost within four to six years under most modeled price scenarios (client-reported, unverified by MMA).
  3. Competing biodiesel producers who delayed conversion decisions saw margin compression accelerate meaningfully within roughly eighteen months of delay (client-reported, unverified by MMA).
  4. Existing feedstock supply relationships transferred cleanly to renewable diesel operations with minimal additional sourcing investment or renegotiation required (client-reported, unverified by MMA).
CLIENT PROFILE
A mid-sized biodiesel producer operating a single esterification facility in the Midwest United States sought to evaluate whether converting existing capacity to renewable diesel hydrotreating made financial sense given rising low-carbon fuel credit values and slowing conventional biodiesel demand growth across its traditional regional customer base and long-standing distribution network spanning several nearby Midwestern states.
STRATEGIC CHALLENGE
The client's conventional biodiesel margins had compressed steadily over several years as larger integrated competitors captured growing renewable diesel credit revenue, while the capital cost and technical complexity of a full hydrotreating conversion remained uncertain relative to simply continuing conventional operations at reduced but still positive margin levels for the near term.
MMA APPROACH
MMA benchmarked conversion economics against three completed industry conversions, modeled credit revenue under multiple low-carbon fuel standard price scenarios, and interviewed engineering firms specializing in hydrotreating retrofits to develop a realistic capital cost and timeline estimate for the client's specific facility configuration, feedstock access, and regional logistics constraints very carefully.
KEY FINDINGS
  1. Conversion capital cost estimates ranged from $180 to $240 million depending on existing equipment reuse potential and site conditions (client-reported, unverified by MMA).
  2. Renewable diesel credit revenue could offset conversion capital cost within four to six years under most modeled price scenarios (client-reported, unverified by MMA).
  3. Competing biodiesel producers who delayed conversion decisions saw margin compression accelerate meaningfully within roughly eighteen months of delay (client-reported, unverified by MMA).
  4. Existing feedstock supply relationships transferred cleanly to renewable diesel operations with minimal additional sourcing investment or renegotiation required (client-reported, unverified by MMA).
RECOMMENDED STRATEGY
Phase 1: Phase one: commission a detailed engineering study to finalize conversion capital cost and technical feasibility estimates precisely and thoroughly before proceeding further. Phase 2: Phase two: secure renewable diesel offtake commitments from regional fleet buyers before beginning any major capital expenditure commitments broadly across the facility. Phase 3: Phase three: execute phased conversion construction while maintaining partial conventional biodiesel output to preserve near-term operating cash flow entirely throughout.
OUTCOME
The client approved a phased conversion plan projected to restore double-digit gross margins within three years, with the first hydrotreating train reaching commercial operation eighteen months after the engagement concluded, ahead of the original twenty-four-month internal projection timeline and under the initially budgeted capital figure (client-reported, unverified by MMA).

Frequently Asked Questions

Foundational context covering the market sizes, CAGR, scope, country, region and competition that inform every finding below. This section is provided to cover basics and most often pre-purchase conversations, answered from the MMA Primary Research Dataset.

What is the current size of the Transportation Biofuel Market?

The global transportation biofuel market reached an estimated $145.0 billion in 2025, driven by blending mandate escalation and renewable diesel capacity conversions across major refining regions. North America remains the single largest producing region.

How large will the Transportation Biofuel Market be by 2036?

MMA projects the market will reach approximately $345.04 billion by 2036, up from $156.89 billion in 2026. That represents roughly a 2.2x expansion across the ten-year forecast window.

What is the CAGR for the Transportation Biofuel Market 2026 to 2036?

The base case forecast CAGR is 8.2% across 2026 to 2036, with a bull scenario of 9.5% and a bear scenario of 6.9% depending on feedstock costs and credit program continuity.

Which segment is growing fastest?

Renewable Diesel (HVO/HEFA) leads at a 14.0% CAGR, roughly 1.71 times the overall market rate, as refiners convert existing hydrotreating capacity to capture stacked low-carbon fuel credits.

Who are the major companies in the Transportation Biofuel Market?

Archer-Daniels-Midland, POET, Neste, Renewable Energy Group, and Valero Renewable Diesel lead the market, together holding an estimated combined production volume share of 40% measured globally.

Which country is growing fastest?

India leads growth at a 15.5% CAGR, driven by its accelerated ethanol blending mandate program and rapid grain and sugarcane distillery capacity expansion nationwide today.

Report Segmentation Architecture

The full report scope spans multiple orthogonal segmentation dimensions, with cross-tabulated demand data provided for each dimension pair. Coverage extends further to regional breakdowns, trend trajectories, and the competitive detail needed to support segment-level decision-making.
  • Corn and Grain Ethanol
  • Sugarcane Ethanol
  • Biodiesel (FAME)
  • Renewable Diesel (HVO/HEFA)
  • Biomethane and Bio-CNG for Transport
  • Cellulosic and Advanced Biofuels
  • Passenger Vehicles
  • Heavy Trucking and Freight
  • Municipal and Transit Fleets
  • Marine and Off-Road Equipment
  • Aviation-Adjacent Feedstock Supply
  • Direct Refiner Blending Contracts
  • Fleet Operator Offtake Agreements
  • Spot Market Sales
  • Low-Carbon Fuel Credit Trading

By Region

  • North America
  • Western Europe
  • East Asia
  • South Asia and Pacific
  • Latin America
  • Middle East and Africa
  • Eastern Europe

Scope, Methodology, and Coverage

Every figure in this report is reproducible from documented input assumptions. The scope below maps the historical period, the forecast horizon, the segmentation dimensions, and the countries covered, alongside the underlying primary and qualitative methodology.
Historical Period
2020 to 2025
Forecast Period
2026 to 2036
Base Year
2025 (USD billions; MMA Primary Research Dataset, September 2026)
Market Definition
This report covers liquid transportation biofuels including ethanol, biodiesel, renewable diesel, and biomethane used to fuel road vehicles, measured on a global production-volume basis. It excludes sustainable aviation fuel, marine biofuels, and biomass power generation feedstocks sold for non-transport end uses.
Quantitative Units
USD billions, billion liters/gallons produced, and percentage CAGR
Segmentation Dimensions
Fuel technology (corn ethanol, sugarcane ethanol, biodiesel, renewable diesel, biomethane, cellulosic/advanced), end-use vertical, commercial channel, and geography
Regions Covered
North America, Western Europe, East Asia, South Asia and Pacific, Latin America, Middle East and Africa, Eastern Europe
Countries Covered
United States, Brazil, India, Indonesia, Germany, China, and 20+ additional countries across seven global regions
Key Companies Profiled
Archer-Daniels-Midland, POET, Neste, Renewable Energy Group, Valero Renewable Diesel, and 15 additional producers across the global competitive set
Quantitative Methodology
Primary survey, n=3,800 respondents, Q4 2025, six countries; demand-side model with trade association cross-validation
Qualitative Methodology
47 expert interviews, Q4 2025; applied to validate demand model assumptions, identify emerging dynamics, and assess competitive positioning
Report Format
PDF and XLSX data workbook (Word format preview document)
Publisher
Market Minds Advisory
Report Code
MMA-2026-ENE-124
Published
September 2026
Contact
sales@marketmindsadvisory.com | www.marketmindsadvisory.com

Purchase the full Transportation Biofuel Market Report (2026 to 2036).

This report delivers a complete assessment of the global transportation biofuel market across the full 2026 to 2036 forecast period ahead. It combines primary survey data from 3,800 respondents with 47 expert interviews to quantify segment, regional, and competitive dynamics in careful detail. Coverage spans ethanol, biodiesel, renewable diesel, and biomethane pathways, alongside detailed producer benchmarking across twenty companies. Analysts translate raw data into actionable feedstock sourcing, capacity conversion, and market entry guidance for producers, investors, and fleet buyers evaluating this rapidly evolving fuel category.
Ten-year global market sizing and forecast model
Seven-region demand, pricing, and share breakdown
Twenty-company competitive benchmarking and positioning analysis
Segment-level growth, margin, and pricing analysis
Feedstock cost exposure and supply risk assessment
Strategic verdict and prioritized investment guidance

Built For The People Who Decide

From boardroom strategy to bench-side execution, this report is read cover-to-cover by leaders shaping the next decade of their industry, turning demand scenarios, market dynamics and valuation benchmarks into decisions.
CXOs/ Presidents/ VPs/ Managers
M&A and Corporate Development
Strategy Teams and R&D Heads
Procurement and Product Directors
Regulatory and Compliance Leaders
Investor Relations and Equity Analysts