Market Minds Advisory
Transplant Monitoring Kits Market

Transplant Monitoring Kits Market: Validated Against an Unreliable Reference

Every new rejection assay is judged against biopsy, and two pathologists reading the same sample agree only about two thirds of the time, which caps how good anything can look on paper.

Lead Analyst

Alice Ballenger

Published

September 2026

Make Smarter Decisions with Customized Research Insights

Request a free sample report and evaluate market opportunities, growth trends, and competitive dynamics relevant to your business needs.

2025 MARKET VALUE$1.1BMarket Size 2025
2036 FORECAST VALUE$4.6BBase Case , 2026 to 2036
CAGR 2026 TO 203613.4 %Bull 14.6% / Bear 12.2%
INCREMENTAL OPPORTUNITY$3.3BNet 10- year value creation
EXPANSION MULTIPLE3.52x2036 value over 2026 base
Strategic Levers
M&A Pipeline
Regional Outlook
Country Rankings
Competitive Intelligence
Segmental Deep-dive
Call-Us : 91 93563 13602

Executive Snapshot and Market Trajectory

This field has a validation problem it rarely states plainly. Every molecular rejection assay is measured against biopsy, and two pathologists grading the same sample agree only around 65% of the time, so a better test cannot look better than its own reference standard.
The clinical case rests on cadence rather than on any single result. Rejection develops silently and roughly 30% of graft function is lost before serum creatinine moves at all, so a blood assay run monthly finds injury a biopsy scheduled annually never sees. Donor-derived cell-free DNA grows at 20.1%, half again the market rate of 13.4%. Protocol biopsies find rejection in roughly 22% of patients showing no clinical signs whatsoever. Cadence is the whole mechanism.
Reimbursement works against exactly that mechanism. Around eight surveillance tests are funded per patient in the first year, which is enough for episodic checking and not enough for the frequency that creates the value. Payers ration the cadence and then assess the test on results generated at a frequency they themselves restricted. Heart and lung recipients face around 3% biopsy complication risk and have the strongest case with the smallest numbers.
Market Definition
Assays monitoring transplanted graft health and rejection risk after transplantation, covering donor-derived cell-free DNA assays, gene expression profiling assays, donor-specific antibody testing, tissue-based molecular classifiers, viral load and infection surveillance, and immune function and cellular assays. Measured at test and kit selling value. Excludes immunosuppressant drug level monitoring, pre-transplant HLA typing and crossmatching, organ preservation systems, and transplant surgery procedures.
Base Year Value
$1.1B in 2025 (MMA Primary Research Dataset, August 2026)
Forecast Period
2026 to 2036, eleven discrete annual values
CAGR
13.4% base case. Bull 14.6%. Bear 12.2%.
Fastest Growth Segment
Donor-Derived Cell-Free DNA Assays: 20.1% CAGR
Fastest Growth Country
Spain: 17.4% CAGR
Fastest Growth Region
South Asia and Pacific: 15.6% CAGR
Largest Region
North America: 32% of 2025 global value
Market Leaders
CareDx, Natera, Eurofins Transplant Genomics, Thermo Fisher Scientific, Immucor. Source: MMA Primary Research Dataset, July 2026.
Primary Survey
n=3,800 procurement and R&D decision-makers, Q4 2025, six countries
Methodology
Demand-side build-up, cross-validated against public data, 47 expert interviews

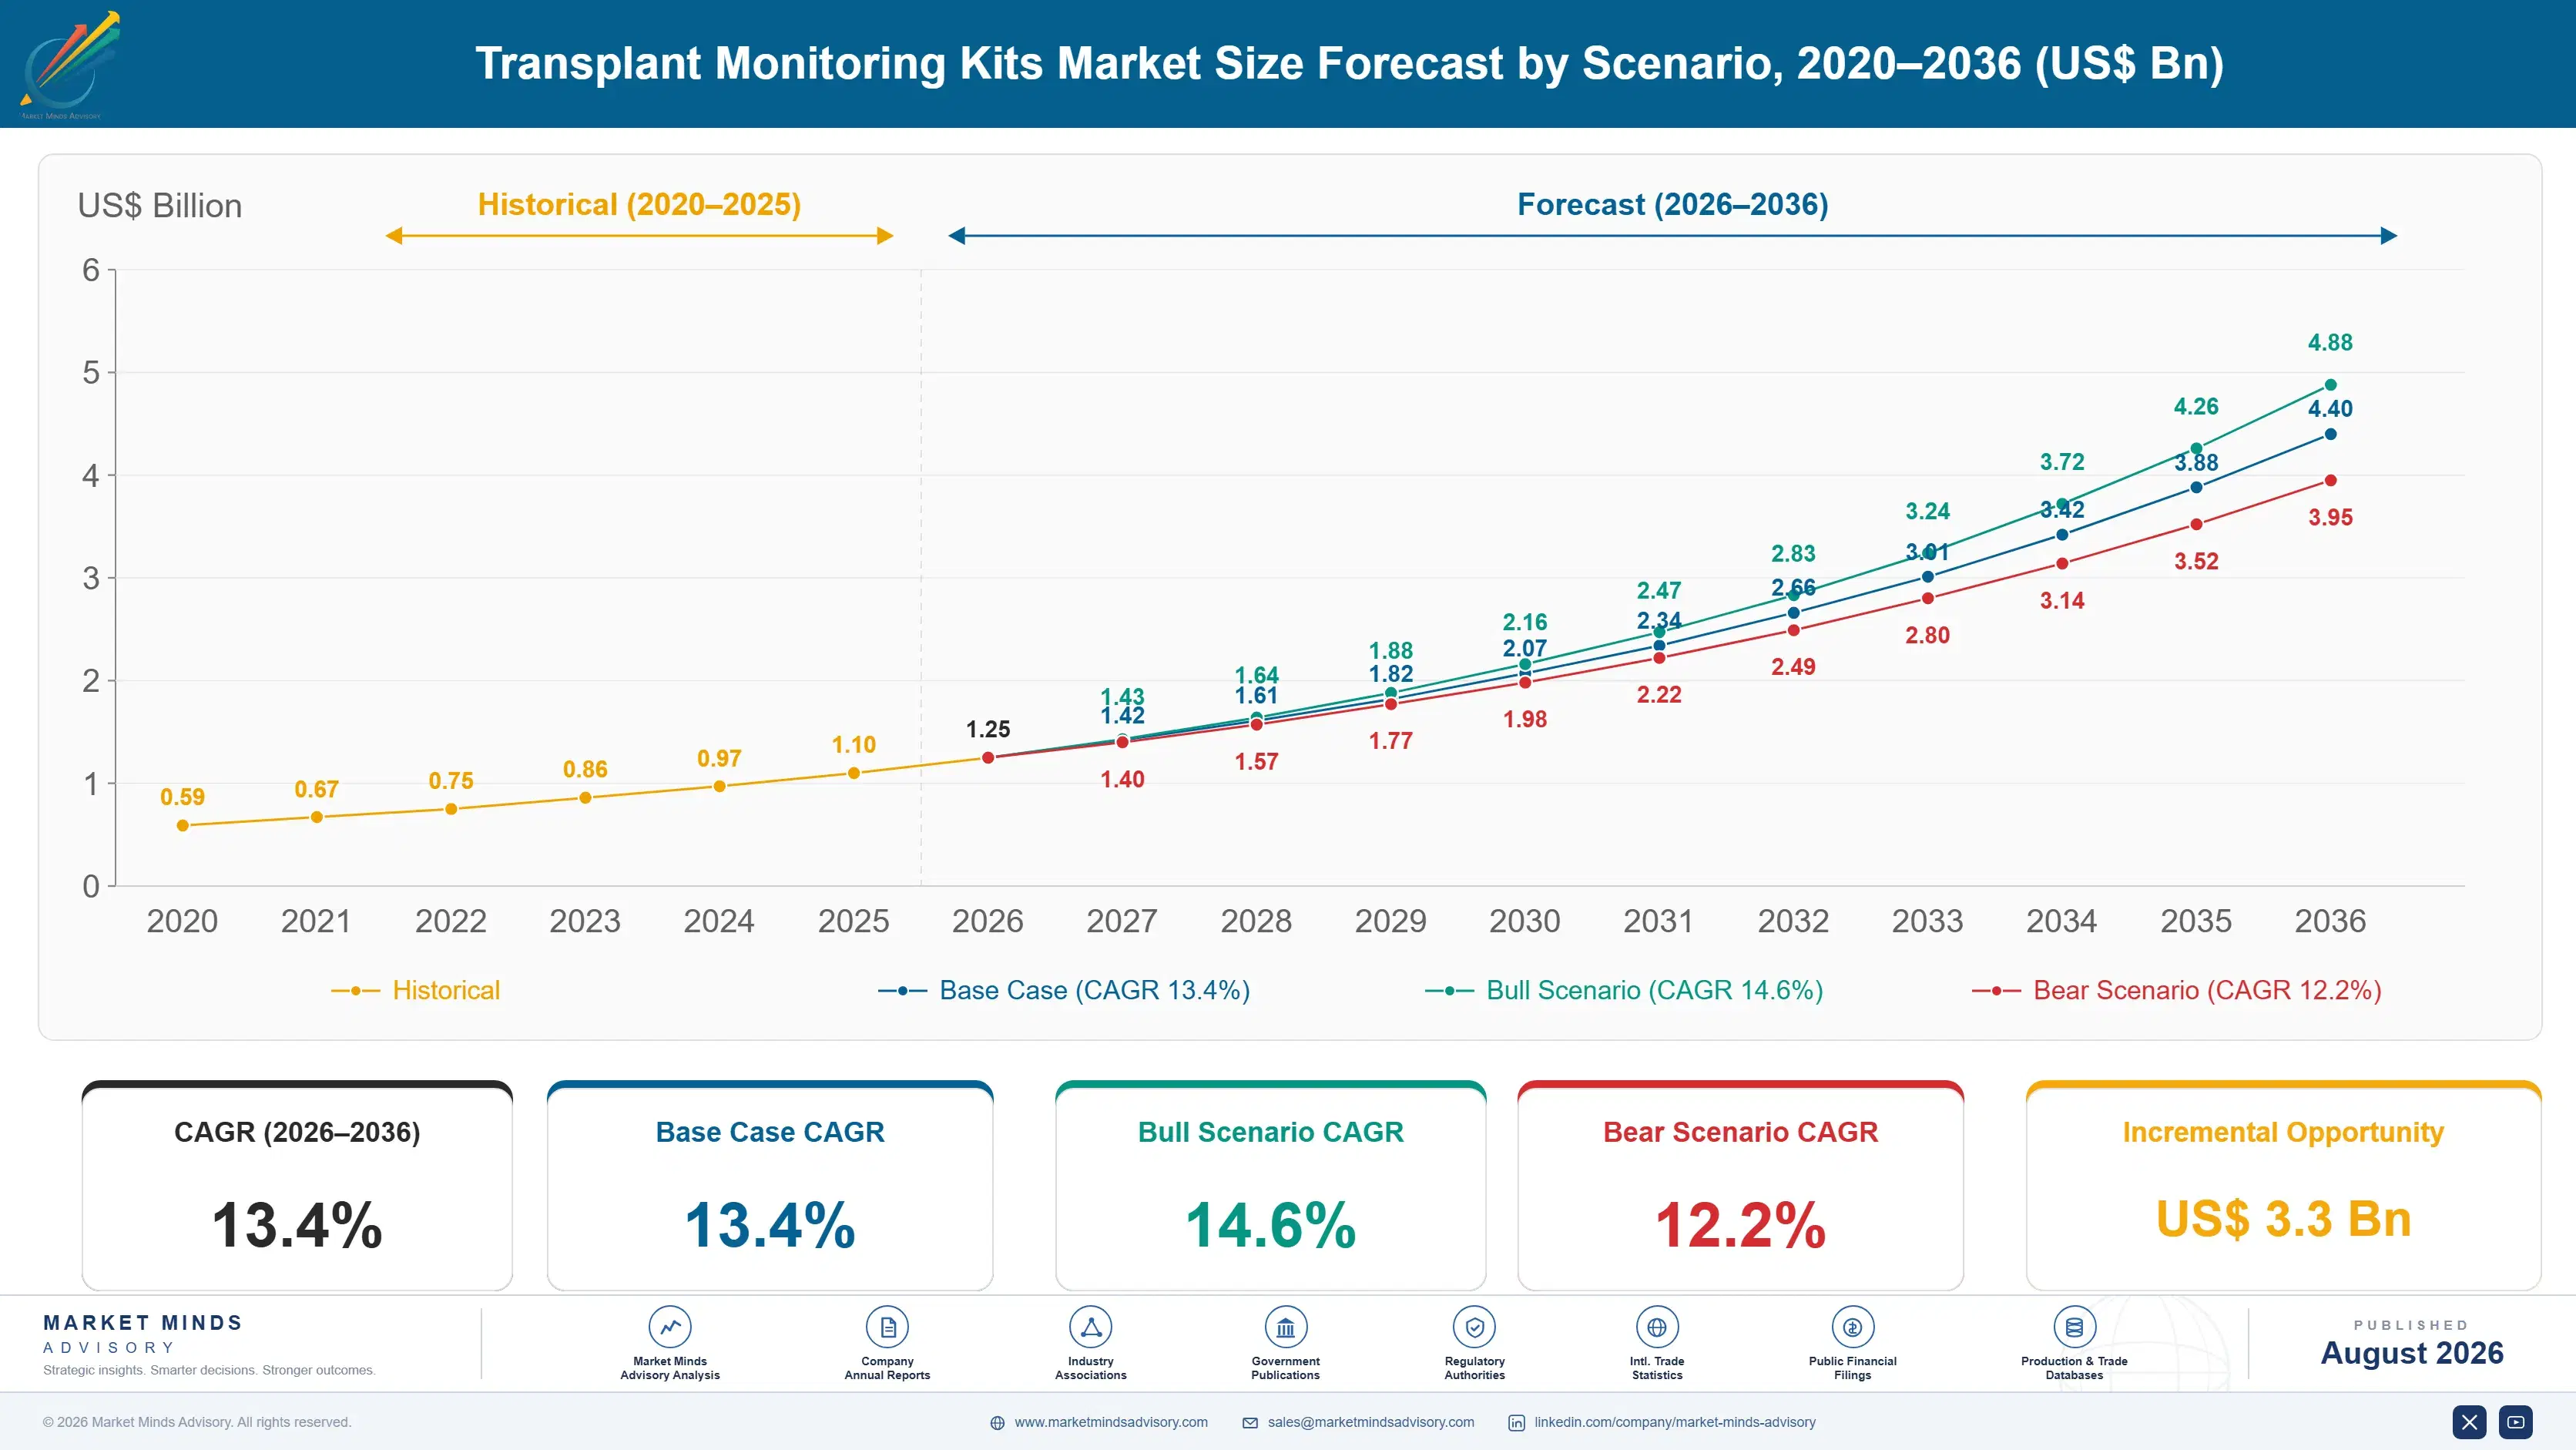
Transplant Monitoring Kits Market Forecast Scenarios

transplant-monitoring-kits-market-size-forecast-scenario-1787640168950
Growth ran near 11.6% between 2020 and 2025 as donor-derived cell-free DNA moved from investigational into reimbursed surveillance across kidney transplantation. Coverage decisions rather than clinical evidence set the pace, and they arrived unevenly between markets and organ types. Gene expression profiling established in heart transplantation where repeated endomyocardial biopsy carries genuine procedural risk that clinicians were glad to reduce.
Base case 13.4% rests on three mechanisms. Donor-derived cell-free DNA grows at 20.1% as surveillance protocols widen beyond kidney into heart, lung and liver. Gene expression profiling grows at 15.8% where biopsy is impractical or dangerous. And Spain grows fastest of any country at 17.4%, with the highest deceased donation rate anywhere producing transplant volume that surveillance demand follows directly. None of the three depends on transplant numbers rising sharply, which donation systems constrain far more tightly than clinical demand does.
The bull case at 14.6% assumes surveillance frequency gaining reimbursement at the cadence clinical value requires, which would multiply tests per patient rather than adding patients. The bear case at 12.2% is payers restricting molecular surveillance on comparative effectiveness grounds, since assessment against biopsy concordance of roughly 65% makes any superiority claim genuinely difficult to demonstrate convincingly.

Measured Against a Moving Ruler

Nothing in this field can be evaluated properly because the reference standard is unstable. Biopsy remains the arbiter of rejection, yet two pathologists grading the same sample agree only around 65% of the time, and the needle may miss focal rejection entirely through simple sampling error. A molecular assay disagreeing with biopsy is therefore recorded as a false result even when the assay was right, which caps measured performance below the truth.
TOP FIVE CONCENTRATION66%Specialist laboratories hold positions coverage decisions made durable
BIOPSY GRADING CONCORDANCE65%Agreement between pathologists reading the same rejection sample
SUBCLINICAL REJECTION PREVALENCE22%Protocol biopsies revealing rejection with no clinical signs
CREATININE DETECTION LAG30%Graft function lost before serum markers move at all
REIMBURSED SURVEILLANCE TESTS8 testsAssays funded per patient during the first transplant year
HEART BIOPSY COMPLICATION RATE3%Adverse events from endomyocardial sampling used for routine surveillance
The clinical argument sits in surveillance frequency rather than in any individual test. Rejection develops silently, protocol biopsies find it in roughly 22% of patients showing no clinical signs, and around 30% of graft function is lost before serum creatinine moves at all. A monthly blood assay finds injury while intervention still helps. Donor-derived cell-free DNA grows at 20.1% on that logic where reimbursement permits it.
Payment structure then works directly against the mechanism. Around eight surveillance tests are funded per patient in the first year, which supports episodic checking rather than the cadence that generates the clinical benefit. Payers restrict the frequency, then assess effectiveness using results produced at the frequency they restricted. Heart and lung recipients have the strongest case and the smallest volume.
"You are asked to prove a blood test beats biopsy, using biopsy as the answer key, when the answer key disagrees with itself a third of the time. Nobody in the field thinks that is a fair examination, and everybody keeps sitting it."
Director, Transplantation and Immune Diagnostics Practice · MMA Healthcare and Life Sciences Practice · August 2026

Market Trends

Molecular surveillance displacing protocol biopsy where risk allows

Endomyocardial biopsy for heart surveillance carries around 3% complication risk and requires repeated vascular access, which makes a blood assay clinically attractive well before any cost argument arises. Gene expression profiling established there first for exactly that reason. Donor-derived cell-free DNA grows at 20.1% as the same logic spreads into kidney, lung and liver surveillance where protocol biopsy was tolerated rather than genuinely welcomed by anybody involved. Patients themselves increasingly decline repeated procedures once a blood alternative exists, which shifts the conversation away from cost entirely. Cost arguments arrive later.
Market Impact: Spain growing fastest at 17.4%
Reimbursement rationing the frequency that creates the value

Around eight surveillance tests are funded per patient during the first year, which supports episodic checking rather than the monthly cadence that detects subclinical rejection before function falls. Payers then evaluate effectiveness using results generated at the frequency they themselves restricted. That circularity caps demonstrated benefit and slows coverage expansion, and it is the single largest commercial constraint in the whole category. No single company resolves that circularity alone, since the evidence required must be generated at frequencies nobody currently funds. Coverage expansion stalls accordingly. That circularity is the single largest commercial constraint here.
Market Impact: Rejection found in 22% silently

Market Opportunities and Growth Drivers

Transplant volume expanding where donation systems perform

Spain grows fastest of any country at 17.4% because its deceased donation rate is the highest anywhere and surveillance demand follows transplant volume directly. Donation system performance rather than population size determines how many grafts require monitoring. Suppliers organised around large populations are covering markets where donation rates limit transplant numbers, while smaller countries with effective systems generate considerably more monitoring volume per head. National donation statistics are published annually and predict monitoring volume directly, which remarkably few commercial teams use for planning. Population is the wrong indicator. Volume follows grafts.
Market Impact: Pathologists agree only 65% of time

Subclinical rejection detection changing surveillance rationale

Protocol biopsies find rejection in roughly 22% of patients showing no clinical signs at all, and around 30% of graft function is lost before serum creatinine moves. That combination makes surveillance a detection problem rather than a confirmation one, which favours assays that can be repeated frequently over procedures that cannot. Clinicians increasingly frame monitoring as continuous rather than episodic, and the assays follow that framing. A blood assay that can be repeated monthly detects injury while intervention still helps, and biopsy scheduled annually simply cannot. Surveillance became continuous. Detection beats confirmation.
Market Impact: Heart biopsy risks 3% complications

Market Restraints and Challenges

Reference standard disagreeing with itself during validation

Two pathologists grading the same biopsy agree only around 65% of the time, and sampling error means the needle may miss focal rejection entirely. The root cause is that histological classification depends on judgement applied to a fragment. Commercially it caps measured assay performance below actual performance and weakens every regulatory and reimbursement submission. Composite endpoints, outcome based validation and central pathology review are the working responses. Outcome based endpoints escape the problem entirely, at considerably higher cost and a longer read-out. Central pathology review helps somewhat. Nothing fully resolves it.
Market Impact: Biopsy carries 3% complication risk

Organ need running inverse to organ volume

Kidney transplantation provides most of the volume and also has the safest biopsy access, while heart and lung recipients face around 3% complication risk from surveillance biopsy and represent far fewer patients. The root cause is transplant epidemiology rather than anything commercial. Commercially it means the strongest clinical case sits in the smallest market. Cross-organ evidence generation and platform approaches spanning organs are the practical responses. Evidence generated in heart and lung transfers usefully into kidney submissions where the volume actually sits. Platform approaches spanning organs are the other route.
Market Impact: Only 8 tests funded yearly
4 additional market trends, 3 additional growth drivers, and 2 additional restraints and challenges are covered in the full report. Contact sales@marketmindsadvisory.com to access the complete intelligence.

Segment CAGR and Growth Architecture

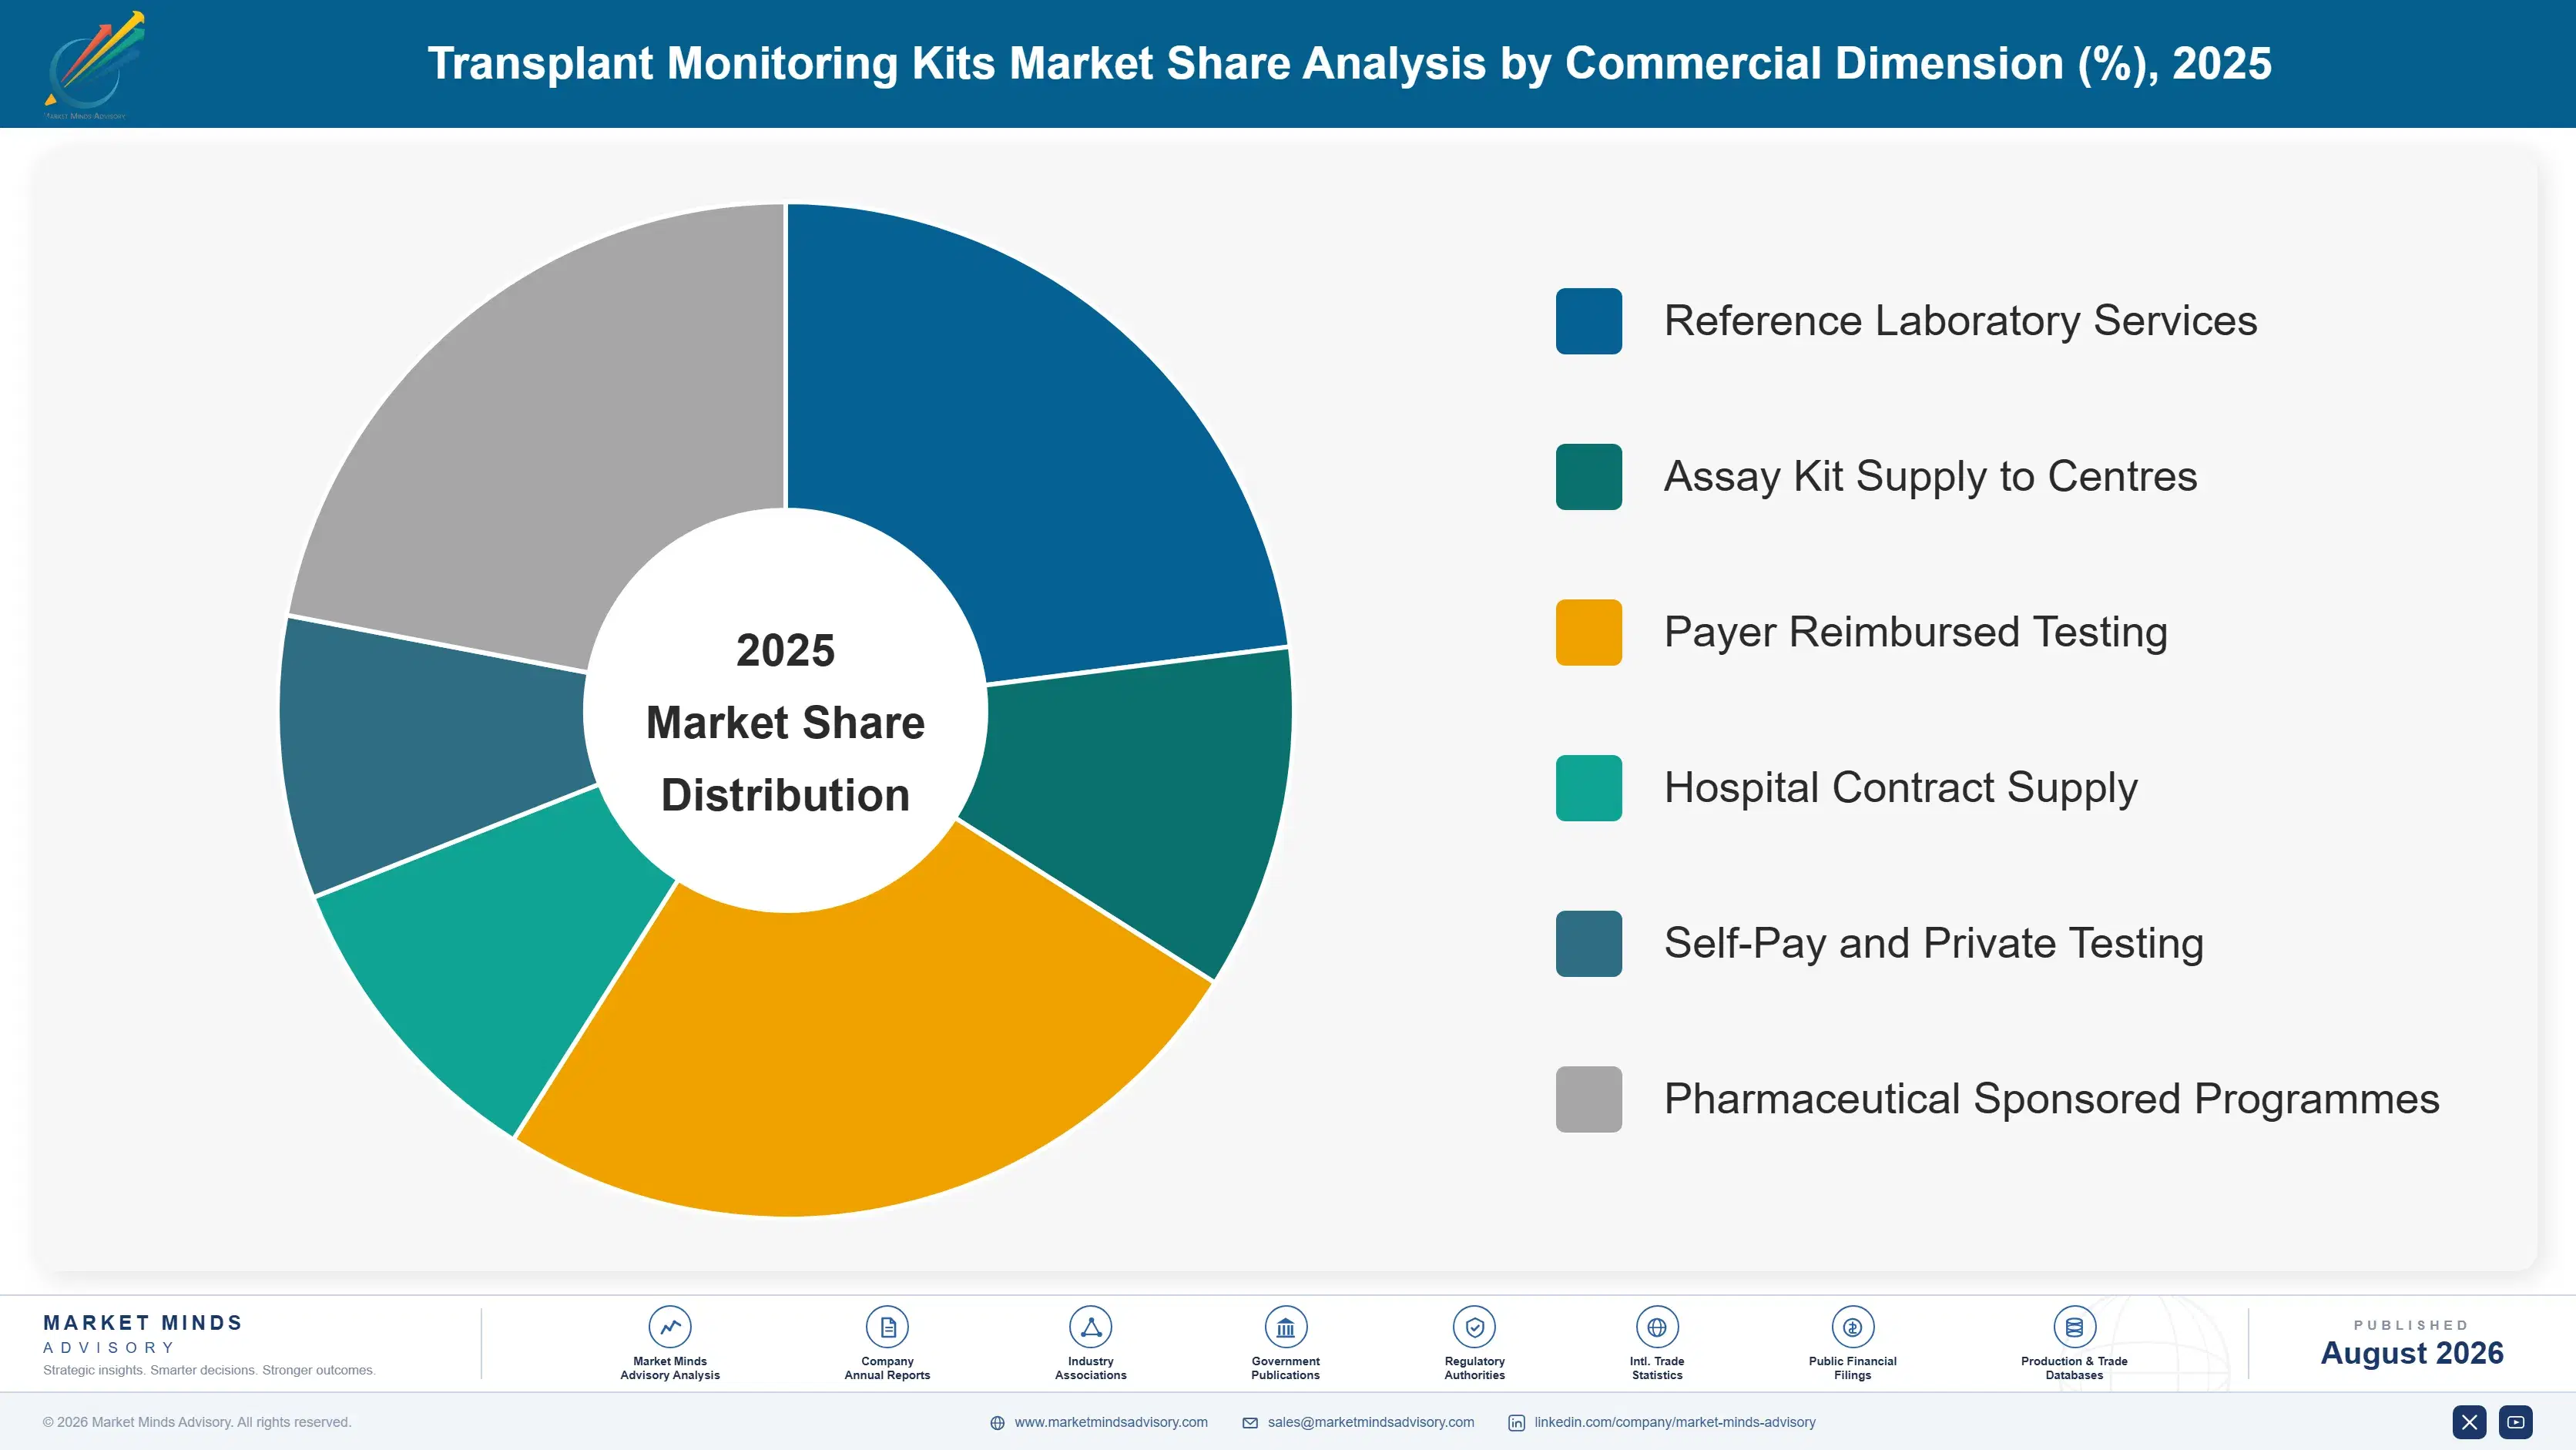
Six segments split by assay type, because assay determines what biological signal is measured, how frequently it can be repeated, the specimen required and the reimbursement pathway available. Organ and platform variants sit inside each assay type. Care setting and channel dimensions are handled separately within the framework. Assay type decides the commercial position, since coverage attaches to specific tests.
transplant-monitoring-kits-market-market-share-analysis-1787640169503

Donor-Derived Cell-Free DNA Assays

Growing at 20.1%, half again the market rate of 13.4%, these assays measure graft derived DNA released into blood during injury, which rises before serum creatinine moves and requires only a blood draw. That makes frequent surveillance practical in a way biopsy never can be. Reimbursement rather than clinical evidence limits how often the test is actually run, since around eight assays are funded per patient in the first year against a cadence clinicians would prefer monthly. Coverage attaches to specific validated assays rather than to the category, which makes an established reimbursed position genuinely difficult for any challenger to displace on price alone. Frequency is the constraint. Clinicians would prefer monthly testing.
CAGR 20.1%

Gene Expression Profiling Assays

At 15.8% expression profiling reads the recipient immune response rather than graft injury directly, and it established first in heart transplantation where endomyocardial biopsy carries around 3% complication risk. That clinical need is strongest exactly where patient numbers are smallest, which is the awkward economics of the whole category. Expansion into other organs depends on evidence generated against a biopsy comparator that agrees with itself only about two thirds of the time. Interpretation depends on recipient immune state rather than on graft injury, which makes the two assay classes complementary rather than competing, though procurement frequently treats them as alternatives. Complementary rather than competing. Procurement treats them as alternatives anyway.
CAGR 15.8%
Full segment breakdown across 6 segments available in the complete report.

Regional Architecture and Country Demand Map

North America holds 32% of value on coverage decisions that funded molecular surveillance earlier than anywhere else. Western Europe follows at 26% on transplant volume and donation system performance across several countries. South Asia and Pacific grows fastest of the seven regions covered here. Donation performance drives both.

North America

Coverage for donor-derived cell-free DNA arrived here before anywhere else and set the commercial template the rest of the field has followed since. Test frequency remains restricted well below what clinicians request, which caps the evidence any subsequent submission can generate. Transplant volume is substantial across all organ types with well developed surveillance protocols. Growth at 12.0% reflects an early adoption base rather than any limit on clinical demand. Coverage attaching to specific validated assays rather than to categories has made established positions unusually durable across this market. Transplant volume is substantial across every organ type, and surveillance protocols are more fully developed here than in any other region covered.
Share: 32% | CAGR: 12.0% (2026 to 2036)

Western Europe

Spain grows fastest of any country at 17.4% with the highest deceased donation rate anywhere, and several other national systems perform strongly enough to generate transplant volume well above what population size alone would predict. Reimbursement for molecular surveillance is assessed nationally and varies considerably. Central pathology review structures are better developed here. Regional growth of 11.8% is the slowest anywhere on cautious national coverage assessment. Outcome based validation is viewed more favourably by national assessment bodies here, which rewards sponsors designing trials that way from the outset. Reimbursement is assessed nationally and varies considerably between systems, which fragments what is otherwise the second largest regional market. Assessment bodies vary considerably.
Share: 26% | CAGR: 11.8% (2026 to 2036)
Regional intelligence for 5 additional markets available in the complete report: East Asia, South Asia and Pacific, Latin America, Middle East and Africa, Eastern Europe. Contact sales@marketmindsadvisory.com.
transplant-monitoring-kits-market-country-cagr-analysis-1787640170046

Four Moves Around a Bad Comparator

The field is asked to prove itself against a reference standard that disagrees with itself a third of the time, and then rationed on frequency that generates the benefit. What remains available is changing the endpoint, selling cadence, and following donation systems rather than populations. Three of the four are evidence problems rather than commercial ones.

Validate against outcomes, not against biopsy agreement

Two pathologists grading the same sample agree only around 65% of the time, so an assay disagreeing with biopsy is scored wrong even when it was right. Validation designed against graft survival and function at twelve months escapes that trap entirely. It costs more and takes longer, and it produces evidence a payer cannot dismiss on comparator reliability grounds, which is precisely where current submissions keep failing. Analytical improvement changes nothing while the comparator remains the yardstick. Outcome endpoints are the only genuine escape available to anybody here. Everything else is wasted effort.
Market Impact: Escapes the whole 65% biopsy concordance performance ceiling

Sell surveillance cadence rather than individual tests

Around 30% of graft function is lost before creatinine moves and protocol biopsies find rejection in roughly 22% of patients with no clinical signs, which makes frequency the mechanism rather than any single result. Around eight tests are funded yearly against a cadence clinicians would run monthly. Submissions framed around a surveillance programme rather than a per-test claim address what payers are actually buying. Payers are buying a surveillance outcome rather than a series of individual measurements, and submissions framed the other way keep missing what is being purchased. Cadence is the mechanism.
Market Impact: Detects the 22% of silent subclinical rejection cases

Build the case in organs where biopsy is dangerous

Endomyocardial biopsy for heart surveillance carries around 3% complication risk, which makes the clinical argument there considerably stronger than in kidney where access is straightforward. Patient numbers are small, so the commercial return is modest, but evidence generated in heart and lung transfers into kidney submissions where volume actually sits. The smallest market is the best place to build the argument for the largest one. Patient reluctance to repeat the procedure supports the argument independently. Kidney access is straightforward and routine, which is exactly why the argument is weaker there despite the volume sitting in it.
Market Impact: Addresses the 3% endomyocardial biopsy complication risk directly

Follow donation systems rather than population size

Spain grows fastest at 17.4% because its deceased donation rate is the highest anywhere, and surveillance volume follows transplants rather than people. Suppliers organised around large populations are covering markets where donation performance limits transplant numbers severely. National donation statistics are published annually and predict monitoring volume directly, which remarkably few commercial teams use for territory planning at all. Donation performance rather than population determines how many grafts need monitoring, and the two diverge sharply across several European markets in particular. Territory planning rarely reflects it. Statistics are published annually and freely.
Market Impact: Follows the 17.4% Spanish transplant volume growth rate

Who Controls the Margin Pool

Participation is measured on annual revenue from post-transplant monitoring assays and kits, and the top five hold 66%. Concentration is high because coverage decisions attach to specific validated assays rather than to test categories, which makes an established reimbursed position genuinely difficult to challenge. The gap to challengers is coverage rather than analytical performance, which is durable in a way technical advantage rarely is.
Competition runs on three fronts. Coverage position decides whether an assay can be billed at all, which precedes every other consideration. Evidence depth decides guideline inclusion and clinician confidence. And organ breadth decides whether a supplier serves a transplant centre or only part of one. Each front rewards a different capability, and very few participants hold all three of them properly.

Pressure ahead comes from validation design shifting toward outcome endpoints and from surveillance frequency arguments reaching payers. Expect suppliers generating outcome evidence to gain against those validated on biopsy concordance. Rankings shift on whoever escapes the comparator problem first. Concentration should hold while coverage stays assay specific. Suppliers validated only on biopsy concordance look most exposed as payers increasingly ask for outcome evidence instead.
transplant-monitoring-kits-market-company-positioning-matrix-1787640170574

Competitive Moat and Risk Dimensions

CAREDX

Moat: Coverage position and clinical evidence

Reimbursed coverage attached to specific validated assays rather than to categories makes an established position durable, since a challenger must generate its own evidence and secure its own coverage rather than competing on price against an existing one. Accumulated registry data across transplant centres also supports guideline positions that newer entrants cannot match for years.
CAREDX

Risk: Frequency restriction capping volume

Around eight surveillance tests are funded per patient annually against a cadence clinicians would prefer considerably higher, which caps volume regardless of clinical demand or assay performance. Lifting that restriction requires evidence generated at frequencies payers do not currently fund, which is a circular problem no single company resolves alone.
NATERA

Moat: Cell-free DNA platform breadth

Cell-free DNA capability developed across oncology and prenatal applications transfers directly into transplant surveillance, spreading development cost across markets that a transplant specialist cannot access. That platform breadth also supports analytical improvements funded by adjacent volumes rather than by transplant revenue alone. Analytical improvements can therefore be funded by adjacent volumes rather than by transplant revenue alone.
NATERA

Risk: Comparator based validation ceiling

Assay performance is measured against biopsy concordance running around 65%, which caps demonstrated accuracy below actual accuracy and weakens submissions to payers assessing comparative effectiveness. Escaping it requires outcome based trials that cost considerably more and take years to read out, which delays coverage expansion into new organs.

Players Tracked

Prominent Players

CareDx
Natera
Eurofins Transplant Genomics
Thermo Fisher Scientific
Immucor

Other Key Players

Qiagen
Bio-Rad Laboratories
Werfen
Hologic
Roche Diagnostics
Illumina
Verici Dx
Oncocyte
Devyser
GenDx
Omixon
Cerba Research
Labcorp
Quest Diagnostics
Sysmex

Recent Developments

FEBRUARY 2026

Trial validates rejection assay against graft outcomes

A surveillance trial validated a molecular rejection assay against graft function and survival at twelve months rather than against biopsy concordance, producing evidence that payers could not dismiss on comparator reliability grounds at all. Coverage submissions followed within two quarters. Comparator objections disappeared from the assessment entirely.
Signal: Changing the endpoint escaped a comparator that disagrees with itself roughly a third of the time
SEPTEMBER 2025

Payer restricts surveillance frequency below clinical request

A payer set surveillance testing frequency well below what transplant programmes requested, then assessed clinical benefit using results generated at that restricted cadence, which produced exactly the ambiguous evidence clinicians had predicted. Programmes had requested considerably more frequent surveillance. The restriction stood unchanged afterwards. Nothing changed afterwards.
Signal: Rationing the testing frequency and then judging the results generated at it is entirely circular reasoning
DECEMBER 2025

Heart programme replaces routine biopsy with blood surveillance

A heart transplant programme replaced routine endomyocardial biopsy with blood based molecular surveillance for stable patients, citing procedural complication risk and patient reluctance rather than any cost consideration at all. Patients had increasingly been declining repeat procedures. Blood surveillance removed the objection completely. Cost played no part at all.
Signal: Where a biopsy carries genuine procedural risk the clinical argument needs no economic support at all

Sequencing, Antibodies and Evidence

Sequencing reagents and consumables carry around 29% of cell-free DNA assay cost, purchased from platform vendors whose instruments lock the consumable choice. HLA antibody reagents and beads absorb roughly 34% of antibody testing cost from a narrow supplier field. Bioinformatics compute and interpretation take about 13%. Laboratory operations, accreditation, clinical evidence generation and billing account for the balance.
Sequencing consumable pricing fell steadily while clinical evidence generation costs rose, per Illumina annual reporting for 2025 on consumable pricing and published clinical trial cost analyses. That moved the cost base away from analysis and toward evidence, which favours participants able to spread trial cost across organs and adjacent diagnostic markets rather than transplant alone. Specialists carrying the whole evidence burden against transplant revenue alone face economics that adjacent market participants simply do not.

Exposure divides on evidence burden rather than on assay chemistry. A specialist transplant laboratory carries trial cost against transplant revenue only. A diagnostics company with adjacent cell-free DNA markets spreads platform development across considerably larger volumes. An antibody reagent supplier carries a narrower cost base with established coverage, which is stable but offers far less growth than the molecular segments do.
transplant-monitoring-kits-market-cost-volatility-analysis-1787640170768

Design trials against outcomes rather than biopsy agreement

Validation against a comparator agreeing with itself around 65% of the time caps demonstrated performance and weakens every payer submission that follows. Outcome based designs measuring graft survival and function cost more and take longer, and they produce evidence that cannot be dismissed on comparator reliability, which is where current submissions repeatedly fail. Payers cannot dismiss it.

Spread platform development across adjacent applications

Cell-free DNA capability transfers between transplant, oncology and prenatal applications, which lets development cost sit across markets rather than on transplant volume alone. A specialist carrying the whole burden against a small patient population faces economics that an adjacent market participant simply does not. A transplant specialist carrying the whole burden faces a harder problem entirely.

Generate evidence where the clinical need is strongest

Heart and lung surveillance carries around 3% biopsy complication risk, which makes the clinical argument there far stronger despite small patient numbers. Evidence generated in those organs transfers usefully into kidney submissions where the volume actually sits, which is a cheaper route to the large market than attacking it directly. Evidence travels between organs.

Portfolio Architecture for Margin Defence

Margin here follows coverage position rather than assay sophistication, because a test without reimbursement generates no volume however well it performs. Viral load surveillance and established antibody testing earn margins in the high twenties to low forties, with long standing coverage and several capable suppliers competing on price and turnaround. Coverage rather than performance decides whether an assay has a business at all.
Tissue-based molecular classifiers and immune function assays do better in the high thirties to mid fifties, because interpretation complexity and specialist positioning both narrow the field considerably. Specialist positioning rather than analytical difference sustains those margins in practice. Turnaround matters less here than in acute diagnostics.

Donor-derived cell-free DNA and gene expression profiling hold the strongest position, reaching into the high sixties, where coverage attaches to specific validated assays and a challenger must generate its own evidence rather than competing on price. Those margins depend on frequency restrictions not tightening further, and payers have already shown willingness to ration cadence on comparative effectiveness grounds. Payers have already shown willingness to ration cadence on comparative effectiveness grounds, which makes the margin position considerably less secure than it looks.

Viral Load and Antibody Testing

Established assays with long standing coverage where several suppliers compete capably. The fourteen point range reflects laboratory scale and turnaround performance rather than any analytical difference between them. Coverage is long established here.
Gross Margin: 28-42%

Tissue Classifiers and Immune Function Assays

Specialist assays where interpretation complexity narrows the practical supplier field considerably. The seventeen point range reflects clinical positioning depth and how specialised the interpretation support provided is. Interpretation support carries the value.
Gross Margin: 38-55%

Cell-Free DNA and Expression Profiling

Assays holding coverage attached to specific validated tests rather than categories. The sixteen point range reflects coverage breadth across organs and how restrictive the funded testing frequency currently is. Frequency restriction caps the volume.
Gross Margin: 52-68%
transplant-monitoring-kits-market-portfolio-architecture-1787640171270

High-value Sub-segments and Strategic Watch-out

Donor-Derived Cell-Free DNA Assays

High value and the fastest growth at 20.1%, rising before creatinine moves and needing only a blood draw. Funded frequency rather than clinical demand caps how much of that potential is realised. Coverage attaching to specific validated assays makes an established position genuinely hard for any challenger to displace.
Gross Margin: 52-68%

Gene Expression Profiling Assays

High value and growing at 15.8%, established first where endomyocardial biopsy carries genuine procedural risk. Clinical need is strongest exactly where patient numbers are smallest, which shapes the economics awkwardly. Evidence generated there nonetheless transfers into kidney submissions, which makes the small market a cheap route into the large one.
Gross Margin: 50-66%

Donor-Specific Antibody Testing

The volume core, with established coverage and routine use across transplant programmes worldwide. Several suppliers compete capably, which limits pricing latitude despite the clinical importance of the testing. Coverage has been established for years and turnaround rather than analytical performance decides most competitive outcomes. Pricing latitude is limited.
Gross Margin: 28-42%

Validation Comparator Exposure

The strategic watch-out. Biopsy concordance around 65% caps measured performance below actual performance, and the range reflects whether a participant has moved to outcome based validation or remains trapped. Outcome based validation is the escape, and it costs considerably more while reading out years later.
Gross Margin: 0-60%

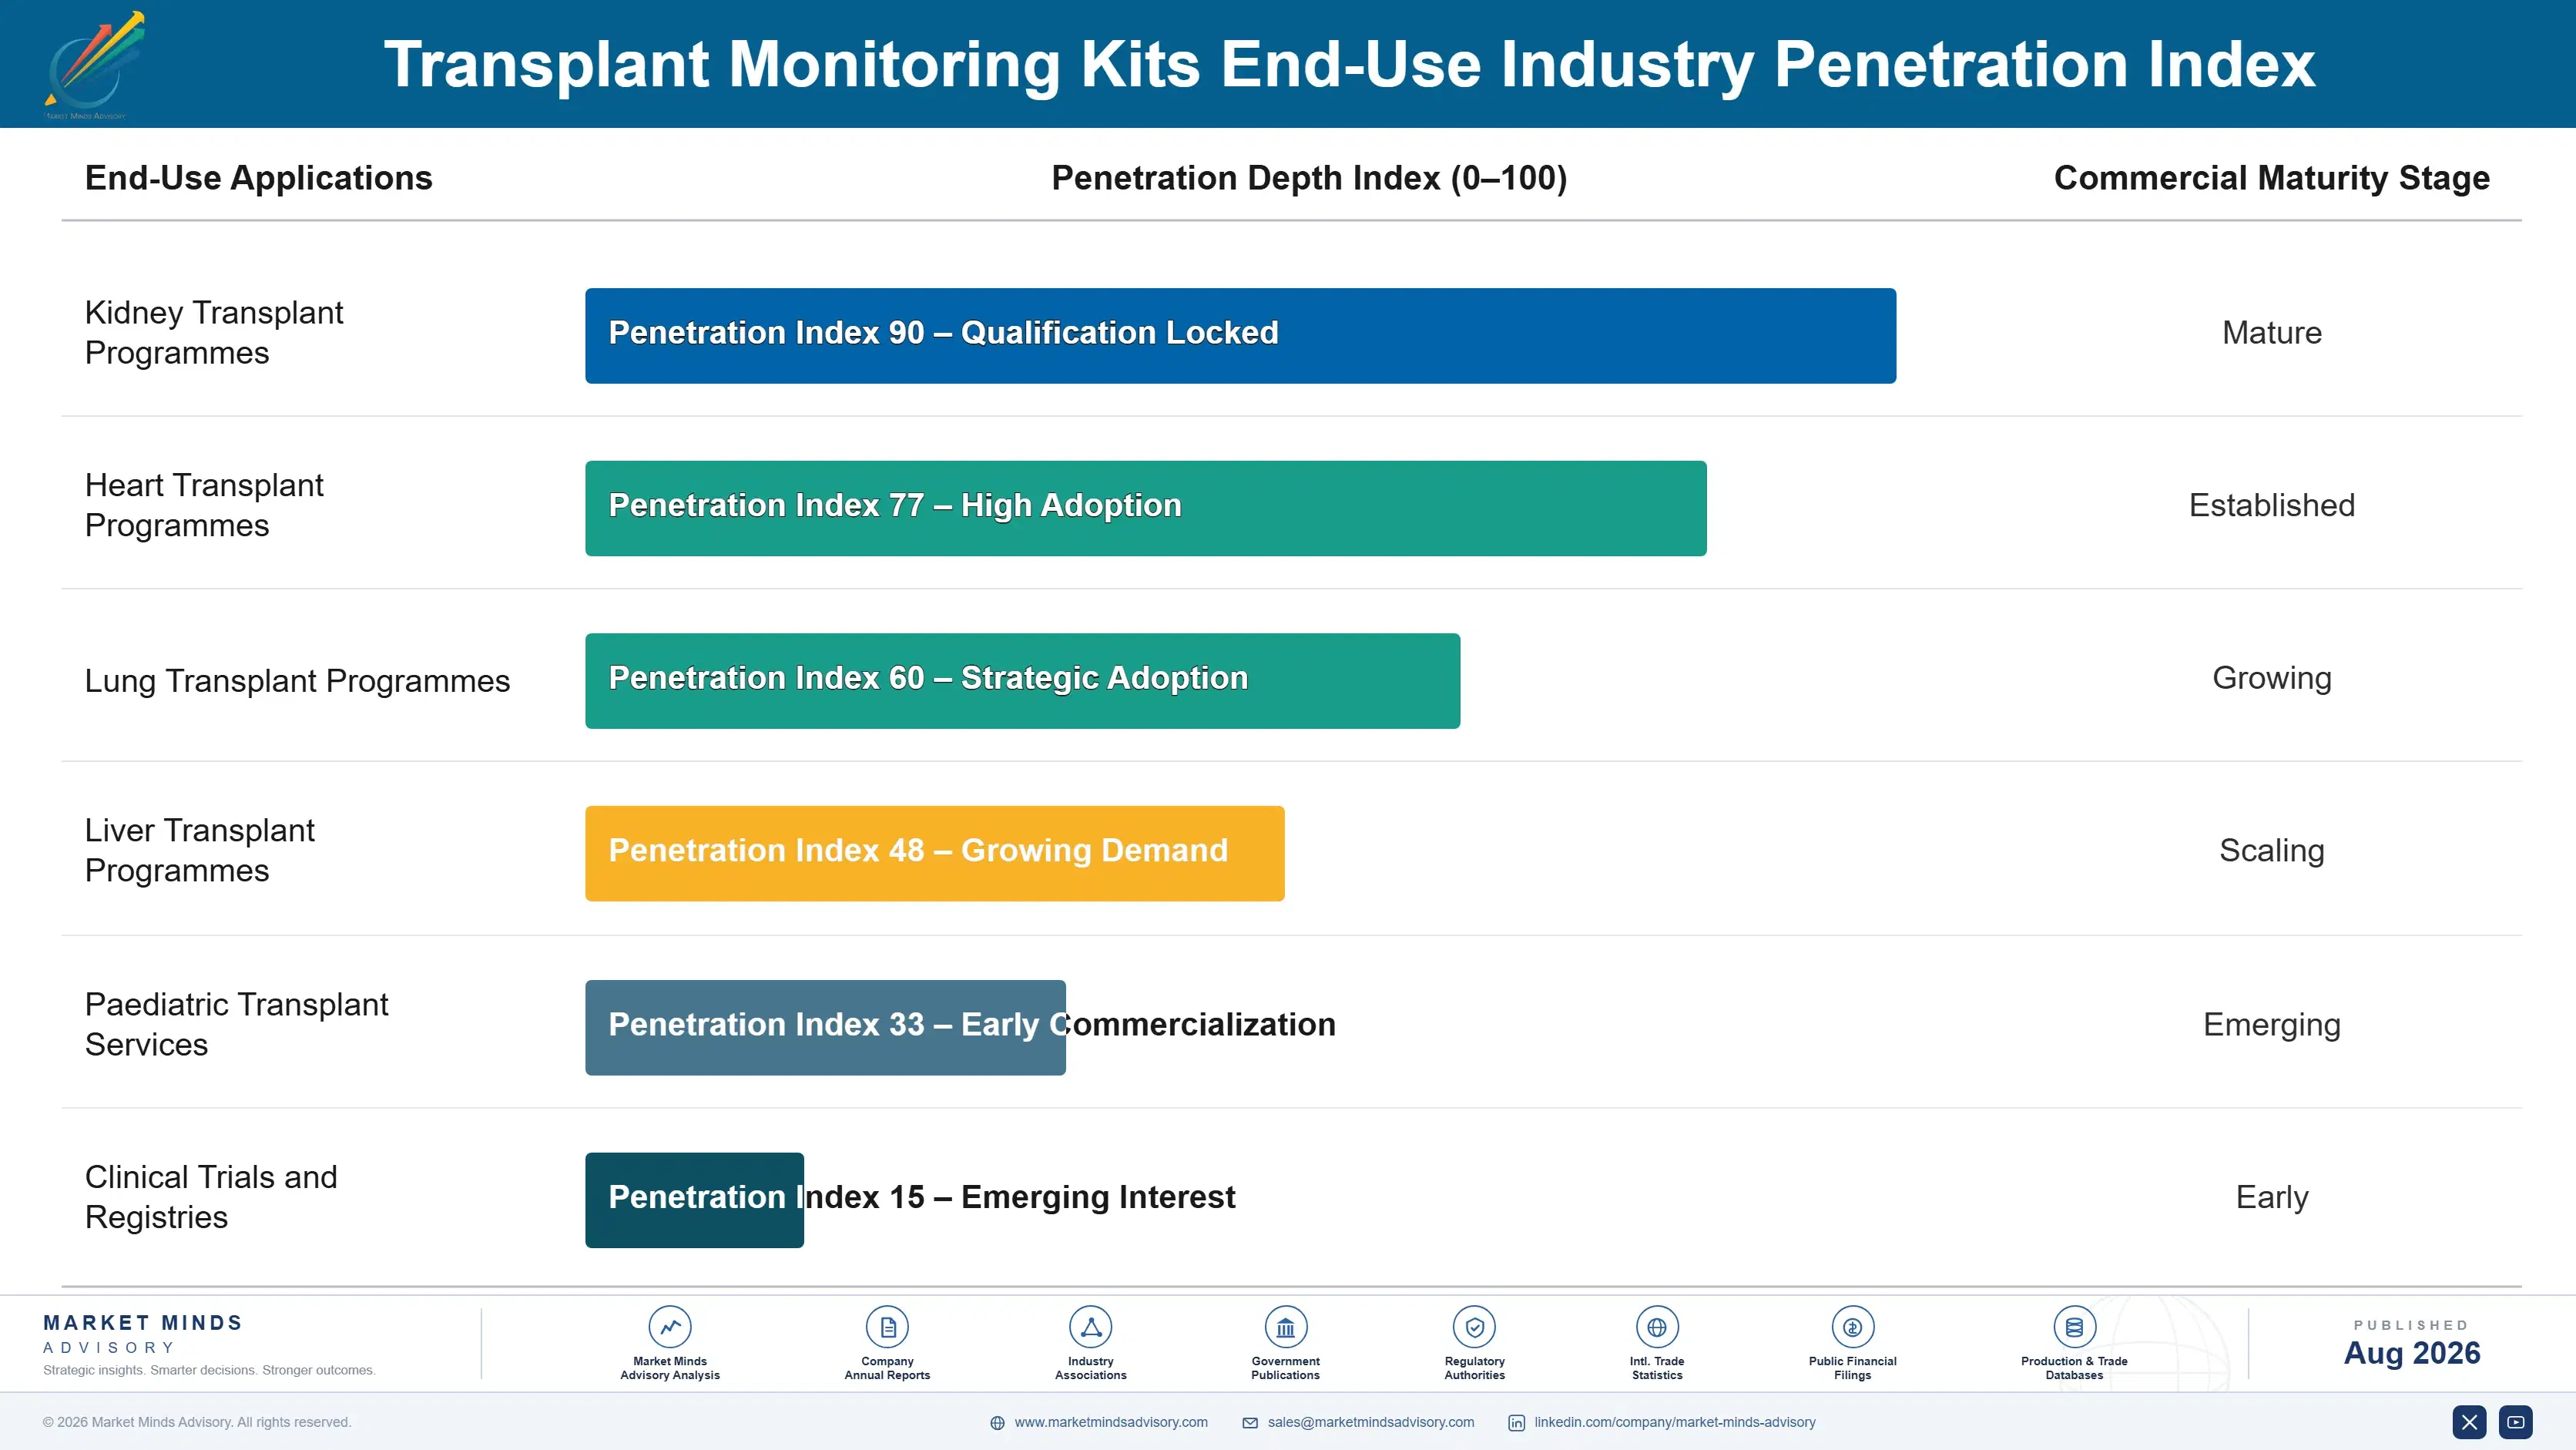
Lifelong Once It Starts

Demand here is the closest thing to a genuine annuity in diagnostics, because a transplanted graft requires surveillance for as long as it functions and functioning grafts last decades. A patient entering a surveillance programme generates testing indefinitely, which makes each new transplant worth far more than the first year of testing suggests to anybody modelling it. Each transplant is worth decades of testing.
Stickiness follows programme protocol rather than individual clinician preference. A transplant centre adopting an assay into its surveillance protocol continues with it because changing means losing comparability across a patient's own longitudinal results. That comparability requirement is stronger here than in almost any other diagnostic setting, since the clinical value comes from trend rather than from any single measurement. Trend beats any single measurement.

The deciding party sits with programme directors and protocol committees rather than with individual transplant physicians. Protocols are written centrally, reviewed periodically and followed closely, which makes protocol inclusion the commercial event and everything afterwards execution. Suppliers calling on individual clinicians are reaching people who follow a document somebody else wrote and reviews infrequently. Protocol inclusion is the commercial event.
transplant-monitoring-kits-market-end-use-penetration-index-1787640171763

Where We Would Put Effort

These are among the four positions where our research anticipates prominent divergence between winners and laggards over the coming forecast period. Each is grounded in the demand model, the regulatory perimeter, and the announced capacity pipeline.
01 / ENDPOINT DESIGN ESCAPE

Stop grading against a broken key

Two pathologists grading the same biopsy agree only around 65% of the time, so a molecular assay disagreeing with biopsy is scored as wrong even when it was demonstrably right about the patient. Validation designed against graft survival and function at twelve months escapes that trap completely. It costs considerably more and reads out several years later, and it produces evidence a payer cannot dismiss on comparator reliability grounds, which is precisely where current payer submissions keep failing across this whole field.
02 / CADENCE BASED SUBMISSION

Sell the programme, not the test

Around 30% of graft function is already lost before serum creatinine moves at all, and protocol biopsies find rejection in roughly 22% of patients showing no clinical signs, which makes surveillance frequency itself the mechanism rather than any single result in isolation. Around eight surveillance tests are funded yearly against a cadence that clinicians would prefer to run monthly instead. Submissions framed around a whole surveillance programme rather than a per-test performance claim address what a payer is genuinely buying here.
03 / HIGH RISK ORGAN EVIDENCE

Build the case in the small market

Endomyocardial biopsy for heart surveillance carries around 3% complication risk, which makes the clinical argument considerably stronger there than in kidney where biopsy access is straightforward and routine. Patient numbers are small there, so the direct commercial return on that evidence is modest at best. Evidence generated in heart and lung nonetheless transfers directly into kidney submissions where the commercial volume actually sits, which makes the smallest market by some distance the cheapest available route into the largest one of all.
04 / DONATION SYSTEM TARGETING

Transplants follow donation, not population

Spain grows fastest of any country at 17.4% because its deceased donation rate is the highest anywhere, and surveillance volume follows the number of transplants actually performed rather than the number of people living in a market. Suppliers still organised around large populations are covering countries where donation system performance severely limits how many transplants actually happen. National donation statistics are published annually and predict monitoring volume directly, and remarkably few commercial teams use them for territory planning at all.

Engagement Snapshot From the Field

A live engagement with an industry participant carrying material or product regulatory and market exposure ahead of a defining policy shift, showing how our research translates into a defensible multi-year portfolio strategy.
MARKET MINDS ADVISORY · CLIENT ENGAGEMENT SUMMARY
Transplant Monitoring Kits Producer Strategic Portfolio Review and Transition Roadmap 2026·Investment Scenario on Transplant Monitoring Kits Exposure Evaluation 2025-26
CLIENT PROFILE
A transplant diagnostics company supplying molecular rejection surveillance assays to transplant programmes across European and North American markets, at annual revenue near 140 million dollars (client-reported, unverified by MMA). Coverage was limited to kidney and validation rested on biopsy concordance throughout. Commercial territories were allocated against population size rather than against transplant volume. Coverage was kidney only.
STRATEGIC CHALLENGE
Payer submissions for expanded coverage were being rejected on comparative effectiveness grounds despite strong analytical performance, and testing frequency restrictions were capping volume from programmes that wanted considerably more surveillance. Management wanted both blockages addressed. Analytical improvement had been the default response and had achieved nothing. Time was being lost.
MMA APPROACH
MMA reviewed rejected payer submissions to establish the basis of refusal, quantified biopsy concordance against the client's assay performance claims, modelled outcome based trial designs against comparator based ones, and mapped transplant volume against donation system performance by market. Interviews with 47 experts covered transplant medicine, pathology, payer assessment and trial design.
KEY FINDINGS
  1. Payer rejections consistently cited comparator reliability rather than assay performance, which meant no amount of analytical improvement would have changed the outcome at all.
  2. Frequency restrictions capped volume at roughly a third of what participating transplant programmes were requesting, and the restriction was itself justified by ambiguous evidence.
  3. Heart and lung programmes wanted the assay urgently on procedural risk grounds, and the client had no evidence in those organs despite the argument being strongest there.
  4. Commercial territory allocation followed population size while transplant volume followed donation system performance, which diverged sharply across several European markets. Nobody had checked the statistics.
CLIENT PROFILE
A transplant diagnostics company supplying molecular rejection surveillance assays to transplant programmes across European and North American markets, at annual revenue near 140 million dollars (client-reported, unverified by MMA). Coverage was limited to kidney and validation rested on biopsy concordance throughout. Commercial territories were allocated against population size rather than against transplant volume. Coverage was kidney only.
STRATEGIC CHALLENGE
Payer submissions for expanded coverage were being rejected on comparative effectiveness grounds despite strong analytical performance, and testing frequency restrictions were capping volume from programmes that wanted considerably more surveillance. Management wanted both blockages addressed. Analytical improvement had been the default response and had achieved nothing. Time was being lost.
MMA APPROACH
MMA reviewed rejected payer submissions to establish the basis of refusal, quantified biopsy concordance against the client's assay performance claims, modelled outcome based trial designs against comparator based ones, and mapped transplant volume against donation system performance by market. Interviews with 47 experts covered transplant medicine, pathology, payer assessment and trial design.
KEY FINDINGS
  1. Payer rejections consistently cited comparator reliability rather than assay performance, which meant no amount of analytical improvement would have changed the outcome at all.
  2. Frequency restrictions capped volume at roughly a third of what participating transplant programmes were requesting, and the restriction was itself justified by ambiguous evidence.
  3. Heart and lung programmes wanted the assay urgently on procedural risk grounds, and the client had no evidence in those organs despite the argument being strongest there.
  4. Commercial territory allocation followed population size while transplant volume followed donation system performance, which diverged sharply across several European markets. Nobody had checked the statistics.
RECOMMENDED STRATEGY
Phase 1: Phase one: redesign the pivotal trial around graft outcomes rather than biopsy concordance, since comparator reliability is what payers keep citing. Phase 2: Phase two: generate evidence in heart and lung where procedural risk makes the clinical case strongest, then transfer it into kidney submissions. Phase 3: Phase three: reallocate commercial territories against published national donation statistics rather than against population size. Donation performance predicts volume directly.
OUTCOME
The company redesigned its pivotal study around graft outcome endpoints during 2026 and began enrolment in heart transplantation (client-reported, unverified by MMA). Territories were reallocated against donation performance, and coverage submissions were paused pending outcome data. Analytical improvement work was deprioritised in favour of evidence generation entirely.

Frequently Asked Questions

Foundational context covering the market sizes, CAGR, scope, country, region and competition that inform every finding below. This section is provided to cover basics and most often pre-purchase conversations, answered from the MMA Primary Research Dataset.

What is the current size of the Transplant Monitoring Kits Market?

MMA sizes it at USD 1.15 billion in 2025, rising to USD 1.30 billion in 2026. The figure covers post-transplant graft surveillance assays at test and kit selling value.

How large will the Transplant Monitoring Kits Market be by 2036?

USD 4.57 billion by 2036, an incremental USD 3.27 billion over the 2026 base and an expansion multiple of 3.52 times. Cell-free DNA assays carry most of that.

What is the CAGR for the Transplant Monitoring Kits Market 2026 to 2036?

13.4% in the base case, with a bull case at 14.6% and a bear case at 12.2%. Reimbursed surveillance frequency drives most of the spread between them.

Which segment is growing fastest?

Donor-derived cell-free DNA assays at 20.1%, half again the market rate of 13.4%. They rise before creatinine moves and need only a routine blood draw.

Who are the major companies in the Transplant Monitoring Kits Market?

CareDx, Natera, Eurofins Transplant Genomics, Thermo Fisher Scientific and Immucor lead on surveillance assay revenue. Fifteen further participants are profiled in the full report on the same consistent basis.

Which country is growing fastest?

Spain at 17.4%, where the highest deceased donation rate anywhere generates transplant volume that surveillance demand follows directly, well above what population size alone would predict.

Report Segmentation Architecture

The full report scope spans multiple orthogonal segmentation dimensions, with cross-tabulated demand data provided for each dimension pair. Coverage extends further to regional breakdowns, trend trajectories, and the competitive detail needed to support segment-level decision-making.

By Assay Type

  • Donor-Derived Cell-Free DNA Assays
  • Gene Expression Profiling Assays
  • Donor-Specific Antibody Testing
  • Tissue-Based Molecular Classifiers
  • Viral Load and Infection Surveillance
  • Immune Function and Cellular Assays

By End-Use Industry

  • Kidney Transplant Programmes
  • Heart Transplant Programmes
  • Lung Transplant Programmes
  • Liver Transplant Programmes
  • Paediatric Transplant Services
  • Clinical Trials and Registries

By Commercial Dimension

  • Reference Laboratory Services
  • Assay Kit Supply to Centres
  • Payer Reimbursed Testing
  • Hospital Contract Supply
  • Self-Pay and Private Testing
  • Pharmaceutical Sponsored Programmes

By Region

  • North America
  • Western Europe
  • East Asia
  • South Asia and Pacific
  • Latin America
  • Middle East and Africa
  • Eastern Europe

Scope, Methodology, and Coverage

Every figure in this report is reproducible from documented input assumptions. The scope below maps the historical period, the forecast horizon, the segmentation dimensions, and the countries covered, alongside the underlying primary and qualitative methodology.
Historical Period
2020 to 2025
Forecast Period
2026 to 2036
Base Year
2025 (USD billions; MMA Primary Research Dataset, August 2026)
Market Definition
Assays monitoring transplanted graft health and rejection risk after transplantation, covering donor-derived cell-free DNA assays, gene expression profiling assays, donor-specific antibody testing, tissue-based molecular classifiers, viral load and infection surveillance, and immune function and cellular assays. Measured at test and kit selling value. Immunosuppressant drug level monitoring, pre-transplant HLA typing and crossmatching, organ preservation systems, and transplant surgery procedures are excluded from scope.
Quantitative Units
USD billions (current prices); tests performed; USD per test by assay type
Segmentation Dimensions
Assay type; end-use industry; commercial dimension; region
Regions Covered
North America, Western Europe, East Asia, South Asia and Pacific, Latin America, Middle East and Africa, Eastern Europe
Countries Covered
United States, Canada, Mexico, Spain, Germany, France, United Kingdom, Italy, Japan, South Korea, China, Taiwan, India, Australia, Singapore, Brazil, Argentina, Saudi Arabia, South Africa, Poland
Key Companies Profiled
CareDx, Natera, Eurofins Transplant Genomics, Thermo Fisher Scientific, Immucor, Qiagen, Bio-Rad Laboratories, Werfen, Hologic, Roche Diagnostics, Illumina, Verici Dx, Oncocyte, Devyser, GenDx, Omixon, Cerba Research, Labcorp, Quest Diagnostics, Sysmex
Quantitative Methodology
Primary survey, n=3,800 respondents, Q4 2025, six countries; demand-side model with trade association cross-validation
Qualitative Methodology
47 expert interviews, Q4 2025; applied to validate demand model assumptions, identify emerging dynamics, and assess competitive positioning
Report Format
PDF and XLSX data workbook (Word format preview document)
Publisher
Market Minds Advisory
Report Code
MMA-2026-HLT-136
Published
August 2026
Contact
sales@marketmindsadvisory.com | www.marketmindsadvisory.com

Purchase the full Transplant Monitoring Kits Market Report (2026 to 2036).

The full report treats transplant surveillance as a field held back by a reference standard that disagrees with itself, and by reimbursement that rations the frequency generating the clinical benefit. It sizes all six assay types independently through 2036, quantifies biopsy concordance against assay performance claims, and models funded testing frequency against clinical requirement. Regional chapters cover all seven regions with donation system performance tracked separately from population size. Competitive profiling covers 20 participants on one consistent revenue basis. Funded frequency is tracked against clinical requirement throughout the analysis.
Six assay types sized independently through 2036
Biopsy concordance quantified against molecular assay performance claims
Funded testing frequency modelled against clinical surveillance requirement
Donation system performance tracked separately from population size regionally
Coverage decisions mapped by organ type and by market
Twenty participants profiled on one consistent revenue basis

Built For The People Who Decide

From boardroom strategy to bench-side execution, this report is read cover-to-cover by leaders shaping the next decade of their industry, turning demand scenarios, market dynamics and valuation benchmarks into decisions.
CXOs/ Presidents/ VPs/ Managers
M&A and Corporate Development
Strategy Teams and R&D Heads
Procurement and Product Directors
Regulatory and Compliance Leaders
Investor Relations and Equity Analysts