Market Minds Advisory
Transmission Substation Market

Transmission Substation Market: Transmission Substation Market. Renewable Interconnection Reshapes Substation Investment Priorities

Renewable interconnection queues and aging transformer fleets are colliding with decades of conventional substation replacement cycles, forcing equipment manufacturers to qualify digital protection capacity fast enough to defend utility capital procurement contracts.

Lead Analyst

Published

September 2026

Make Smarter Decisions with Customized Research Insights

Request a free sample report and evaluate market opportunities, growth trends, and competitive dynamics relevant to your business needs.

2025 MARKET VALUE$14.0BMarket Size 2025
2036 FORECAST VALUE$27.1BBase Case , 2026 to 2036
CAGR 2026 TO 20366.2 %Bull 7.4% / Bear 5.0%
INCREMENTAL OPPORTUNITY$12.3BNet 10- year value creation
EXPANSION MULTIPLE1.83x2036 value over 2026 base
Strategic Levers
M&A Pipeline
Regional Outlook
Country Rankings
Competitive Intelligence
Segmental Deep-dive
Call-Us : 91 93563 13602

Executive Snapshot and Market Trajectory.

Transmission substation manufacturers face genuine pressure to qualify digital protection and monitoring capacity while still serving established conventional switchgear demand that built the category's earliest utility base, a tension reshaping production investment across nearly every major substation equipment supplier and systems integrator this coming year.
Digital and smart substation systems are growing fastest of six equipment categories as utilities pursue renewable interconnection capacity beyond simple conventional protection relay operation, while gas-insulated switchgear formats follow closely on space-constrained urban demand. East Asia concentrates the bulk of manufacturing and installation given China's dense ultra-high-voltage transmission buildout and domestic equipment production base. China's continued grid expansion is also shaping which manufacturers can scale digital substation production fast enough to matter commercially worldwide.
Five manufacturers hold roughly forty-eight percent of market revenue, a moderately concentrated structure reflecting how utility procurement remains regionally concentrated rather than globally consolidated across most equipment categories served. China's grid expansion scale-up is driving the fastest national growth as domestic manufacturers export substation equipment internationally at rising volume each year. Smaller regional manufacturers without comparable digital protection expertise increasingly struggle to compete on smart-grid specification.
Market Definition
This report covers revenue from power transformers, gas-insulated switchgear, air-insulated switchgear, digital protection and control systems, substation automation software, and structural and civil works equipment used in high-voltage transmission substations worldwide. It excludes distribution-level substations and generation step-up transformers sold separately.
Base Year Value
$14.0B in 2025 (MMA Primary Research Dataset, September 2026)
Forecast Period
2026 to 2036, eleven discrete annual values
CAGR
6.2% base case. Bull 7.4%. Bear 5.0%.
Fastest Growth Segment
Digital and Smart Substation Systems: 10.5% CAGR
Fastest Growth Country
China: 9.2% CAGR
Fastest Growth Region
South Asia and Pacific: 8.2% CAGR
Largest Region
East Asia: 30% of 2025 global value
Market Leaders
Siemens Energy, Hitachi Energy, ABB, Schneider Electric, GE Vernova. Source: MMA Analysis based on company disclosures and power transmission equipment industry data.
Primary Survey
n=3,800 procurement and R&D decision-makers, Q4 2025, six countries
Methodology
Demand-side build-up, cross-validated against public data, 47 expert interviews

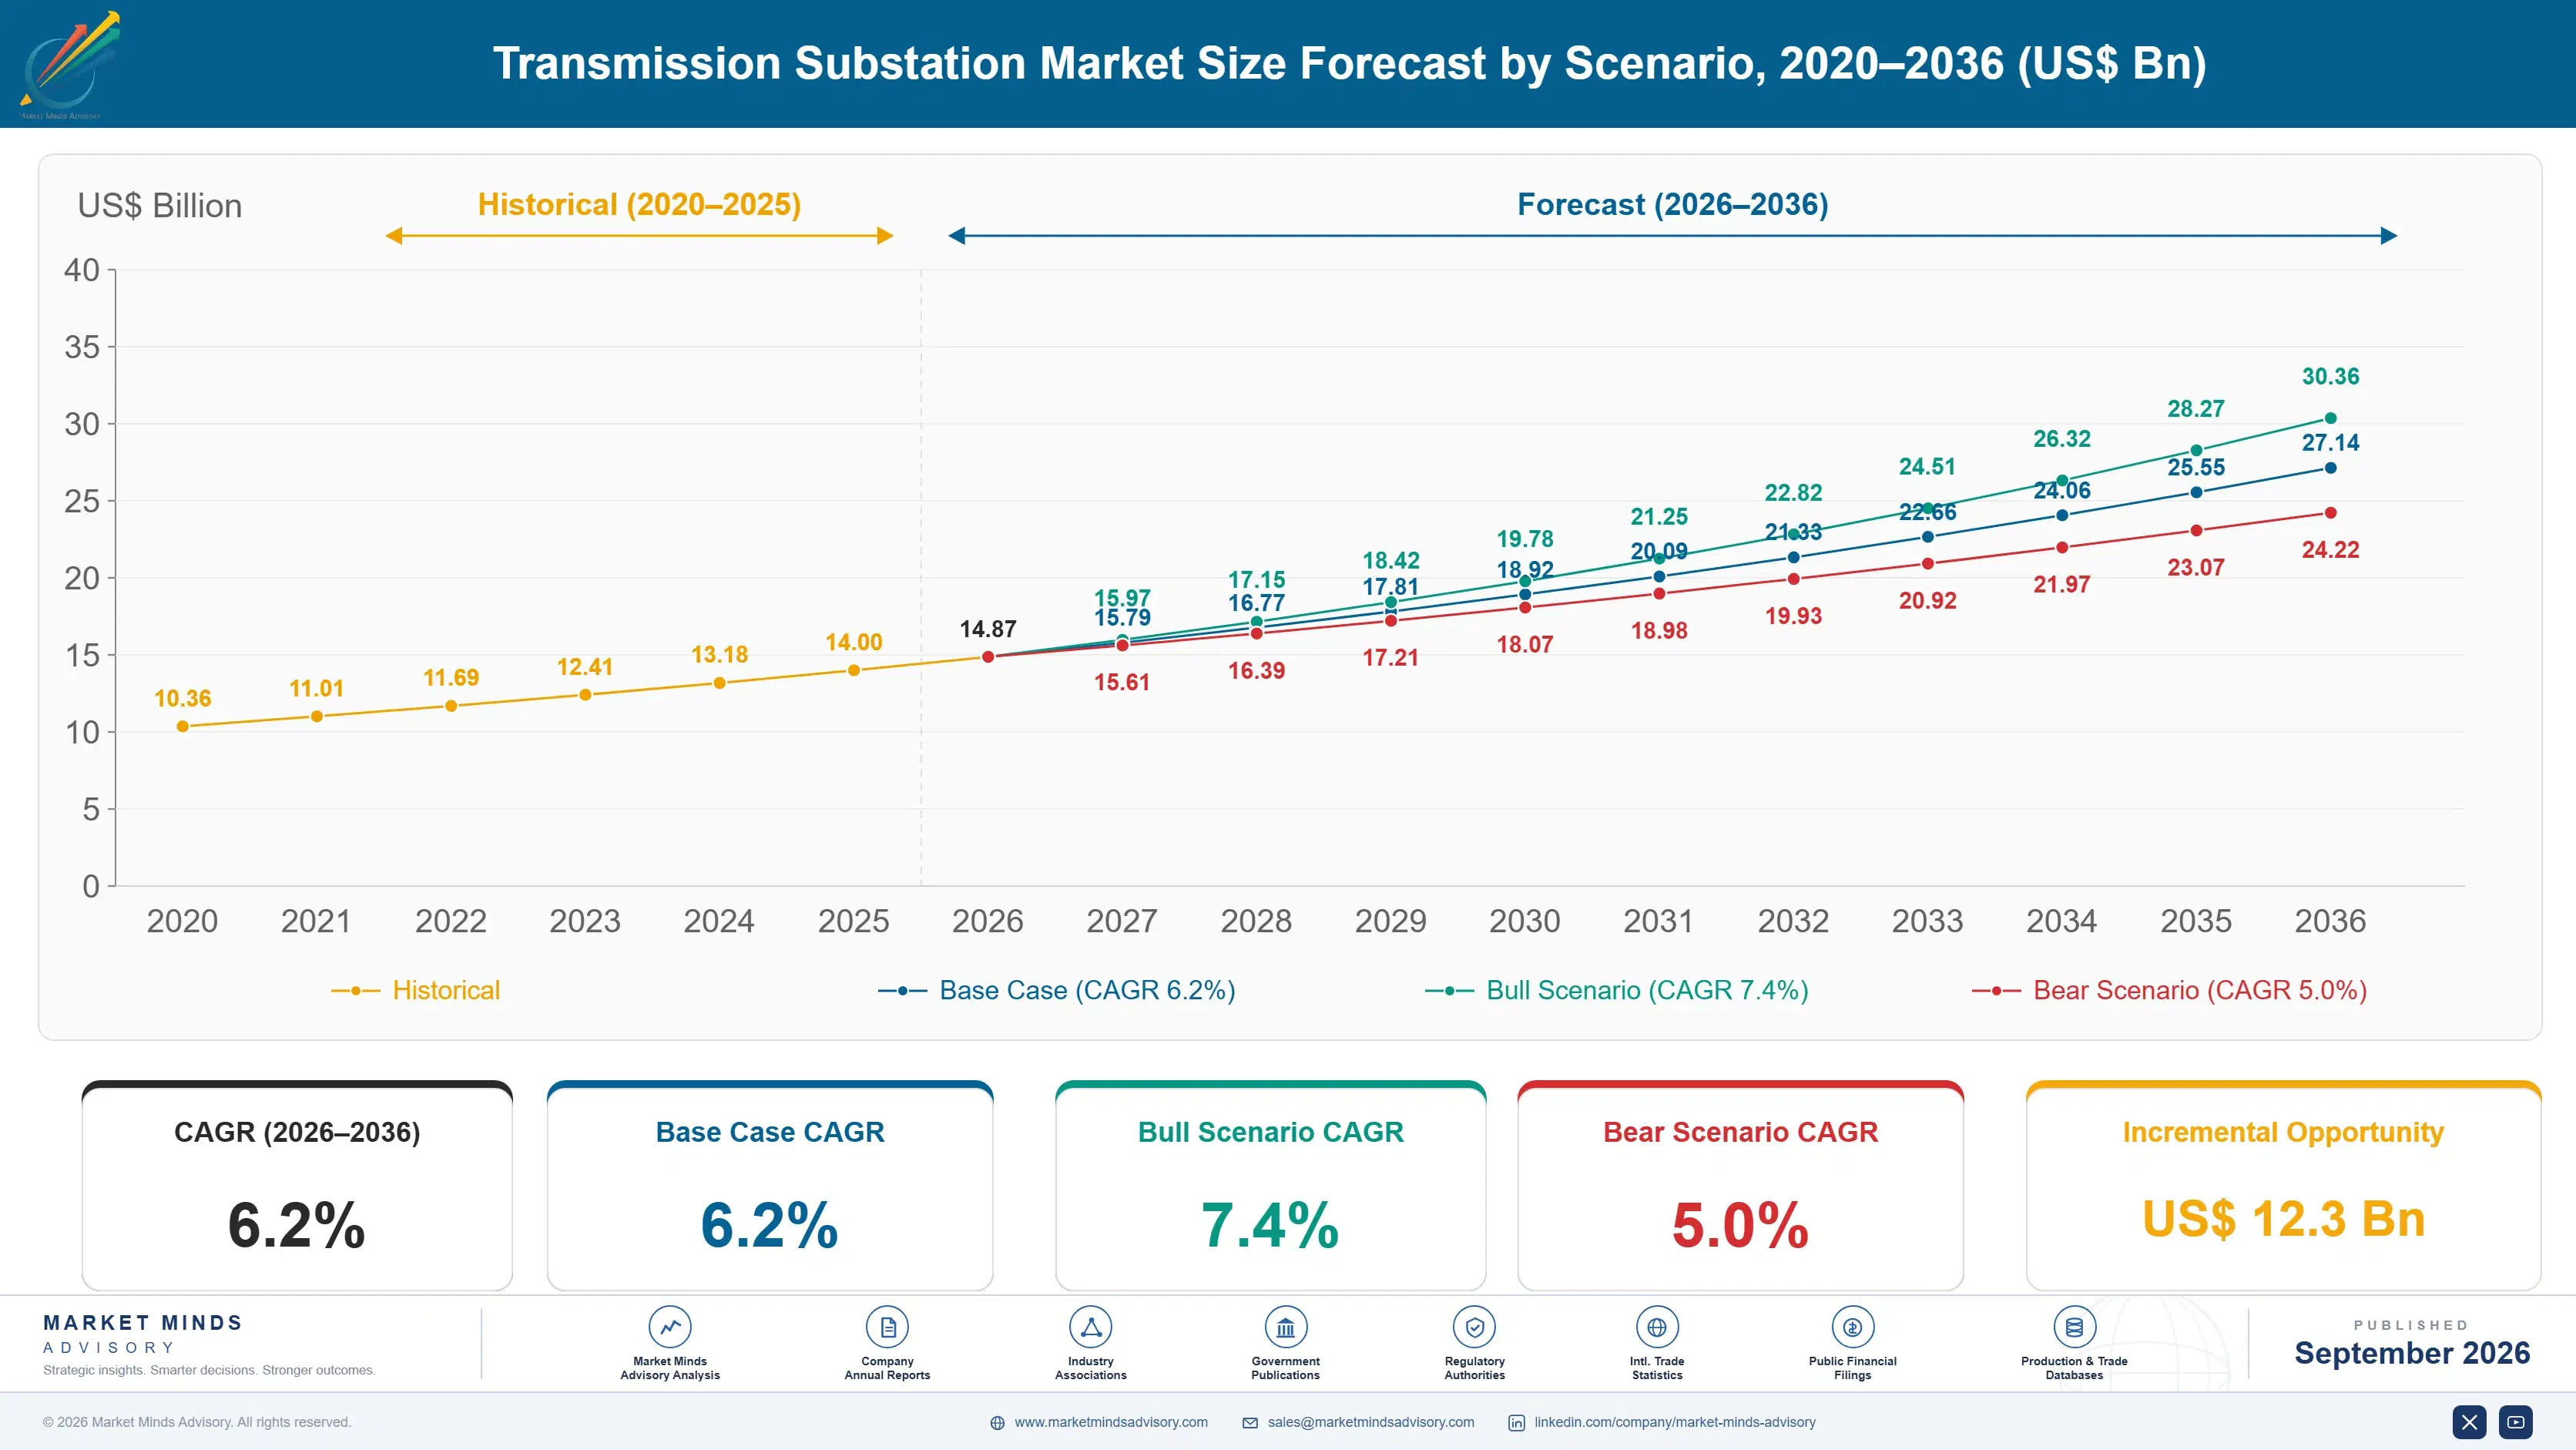
Transmission Substation Market Forecast Scenarios

transmission-substation-market-size-forecast-scenario-1788254806652
Between 2020 and 2025 the transmission substation market grew at roughly 5.4 percent annually, accelerating as utilities responded to rising renewable interconnection queue volume that traditional conventional substation designs alone could not adequately accommodate. Manufacturers used this period to build digital protection capacity ahead of broader utility procurement adoption across most major grid modernization programs.
The base case assumes 6.2 percent annual growth through 2036, anchored in three mechanisms: expanding digital and smart substation deployment as utilities pursue automated protection beyond conventional relay operation, rising gas-insulated switchgear adoption in space-constrained urban substation sites, and growing renewable interconnection queue volume that requires new substation capacity across previously undeveloped transmission corridors. Manufacturers with established digital systems integration capability are best placed to capture this combined growth trajectory.
A bull scenario built on faster renewable interconnection approval and expanding grid modernization spending could push growth toward 7.4 percent, led by manufacturers already scaled on digital substation programs. A bear scenario tied to component cost volatility and softer utility capital spending could instead pull growth down toward 5.0 percent. Systems integration capacity constraints remain a secondary swing factor either way.

Digital Integration and Renewable Interconnection Economics

Transmission substation manufacturing sits at a genuine inflection point where digital protection and renewable interconnection requirements are generating demand for systems integration engineering that decades of conventional electromechanical substation design were never designed to deliver, forcing manufacturers to rethink control architecture entirely across nearly every facility. Few power infrastructure categories have faced this rapid a functional shift.
TOP-5 MANUFACTURER CONCENTRATION48%Global revenue share held by five largest substation equipment manufacturers
EAST ASIA REVENUE SHARE33%Global revenue tied to concentrated transmission grid manufacturing base
DIGITAL SUBSTATION REVENUE SHARE28%Total revenue tied specifically to smart-grid protection systems
AVERAGE SUBSTATION SERVICE LIFE35 yearsTypical operating lifespan before major equipment replacement occurs
TRANSFORMER AND SWITCHGEAR COST52%Base transformer and switchgear share of total substation cost
UTILITY DIRECT PROCUREMENT SHARE64%Total revenue tied to direct utility contract channels
Established manufacturers still dominate the highest-value utility-wide substation contracts because years of transformer and switchgear certification history and long-term reliability data matter enormously for products where equipment failure carries genuine grid stability consequences, letting incumbents defend share even as smaller manufacturers pursue novel digital alternatives across most lower-voltage categories served. This dynamic increasingly determines which manufacturers can grow utility relationships profitably versus which must retrench toward commodity component sales instead.
Two forces will reshape the next decade. Renewable interconnection will keep expanding digital protection expectations across every new substation project and grid modernization program simultaneously, while conventional replacement demand keeps generating steady baseline volume that new construction alone could never fully satisfy given aging infrastructure worldwide. Manufacturers positioned to serve both traditional replacement demand and emerging digital specification simultaneously carry a genuine advantage over slower-moving competitors.
"A transmission substation used to mean a fenced yard of transformers nobody thought about until something failed. Now it's a digitally monitored node that predicts its own maintenance needs, and that changes which manufacturers utilities actually specify."
Director, Power Transmission Infrastructure Practice · MMA Power Transmission Infrastructure Practice · September 2026

Market Trends

Digital Substation Adoption Expands Systems Integration Demand

Utilities are increasingly deploying digital protection relays, non-conventional instrument transformers, and process bus communication architecture that fundamentally differs from the hardwired electromechanical systems that dominated substation design for decades. This shift mirrors similar digitization trends seen in industrial automation broadly, where operators gradually adopted networked control systems before expecting digital architecture as standard rather than premium. Manufacturers investing early in digital protocol certification and cybersecurity hardening are capturing disproportionate premium contract share, particularly in utility territories pursuing grid modernization programs where interoperability and remote monitoring capability matter considerably more than legacy hardwired reliability alone.
Market Impact: Adds 14 percent to capital budgets
Renewable Interconnection Queues Drive New Substation Construction

Utilities managing growing renewable interconnection request queues increasingly require new substation capacity to connect solar and wind generation sites to existing transmission infrastructure, driving substantial new construction demand beyond simple replacement cycles. This creates demand tied to renewable project pipeline volume rather than steady organic grid maintenance, favoring manufacturers with production capacity and engineering resources flexible enough to fulfill concentrated interconnection queue processing on compressed development timelines. Transmission planners increasingly specify substation capacity years in advance of actual renewable project completion to avoid becoming the bottleneck in interconnection approval processes across major utility territories.
Market Impact: Reduces transformer failure risk 20 percent

Market Opportunities and Growth Drivers

Renewable Interconnection Backlog Drives Substation Investment

Massive renewable generation interconnection queues across many major grid operators are creating substantial substation capacity demand as developers wait years for transmission infrastructure capable of accommodating new solar and wind projects nationwide. This shift reflects broader grid capacity constraints that expanded considerably over the past decade across nearly every major electricity market pursuing decarbonization targets. Transmission planners increasingly prioritize substation capacity expansion specifically to unblock interconnection queue backlogs rather than treating it as routine maintenance investment, indicating genuine capacity-driven demand growth. Utilities increasingly fast-track substation projects tied to queue clearance.
Market Impact: Extends lead times by 18 months

Aging Transformer Fleets Require Systematic Replacement

Transmission utilities operating power transformers installed several decades ago increasingly face systematic replacement needs as equipment approaches the end of its rated service life, creating predictable multi-year replacement programs across major substation networks. This reflects broader utility asset management practices that have matured considerably as utilities adopt more rigorous predictive maintenance and failure-risk modeling approaches. Utilities increasingly budget for phased transformer replacement programs years in advance rather than responding reactively to individual equipment failures, since coordinated replacement reduces total program cost compared to emergency single-unit replacement across large transmission networks.
Market Impact: Limits digital adoption to 41 percent

Market Restraints and Challenges

Transformer Manufacturing Capacity Shortage Delays Projects

Global demand for large power transformers currently outpaces manufacturing capacity across most major suppliers, extending lead times well beyond what utilities anticipated when planning substation construction and replacement timelines. The root cause traces to limited specialized manufacturing capacity investment during the previous decade when transformer demand growth appeared modest, a shortage that will take years of expanded factory investment to resolve fully. Manufacturers are increasingly expanding production capacity and streamlining transformer designs to reduce required manufacturing hours, though this capacity investment typically takes several years before delivering meaningful lead-time relief across affected utility markets.
Market Impact: Grows digital revenue 12 percent yearly

Cybersecurity Vulnerability Concerns Slow Digital Adoption

Digital substation architecture introduces network connectivity that traditional hardwired electromechanical systems never possessed, creating cybersecurity attack surface that some utilities find genuinely concerning for critical transmission infrastructure protection. This root cause, inherent network connectivity requirements of digital protection and communication systems, undermines the modernization narrative that digital substation vendors otherwise use to justify premium pricing over conventional alternatives. Manufacturers are increasingly investing in cybersecurity certification and hardened communication protocols specifically to address utility security concerns among reliability-conscious buyers. Some are also offering air-gapped configurations for the most sensitive critical infrastructure applications.
Market Impact: Adds 9 percent renewable interconnection demand
4 additional market trends, 3 additional growth drivers, and 3 additional restraints and challenges are covered in the full report. Contact sales@marketmindsadvisory.com to access the complete intelligence.

Segment CAGR and Growth Architecture

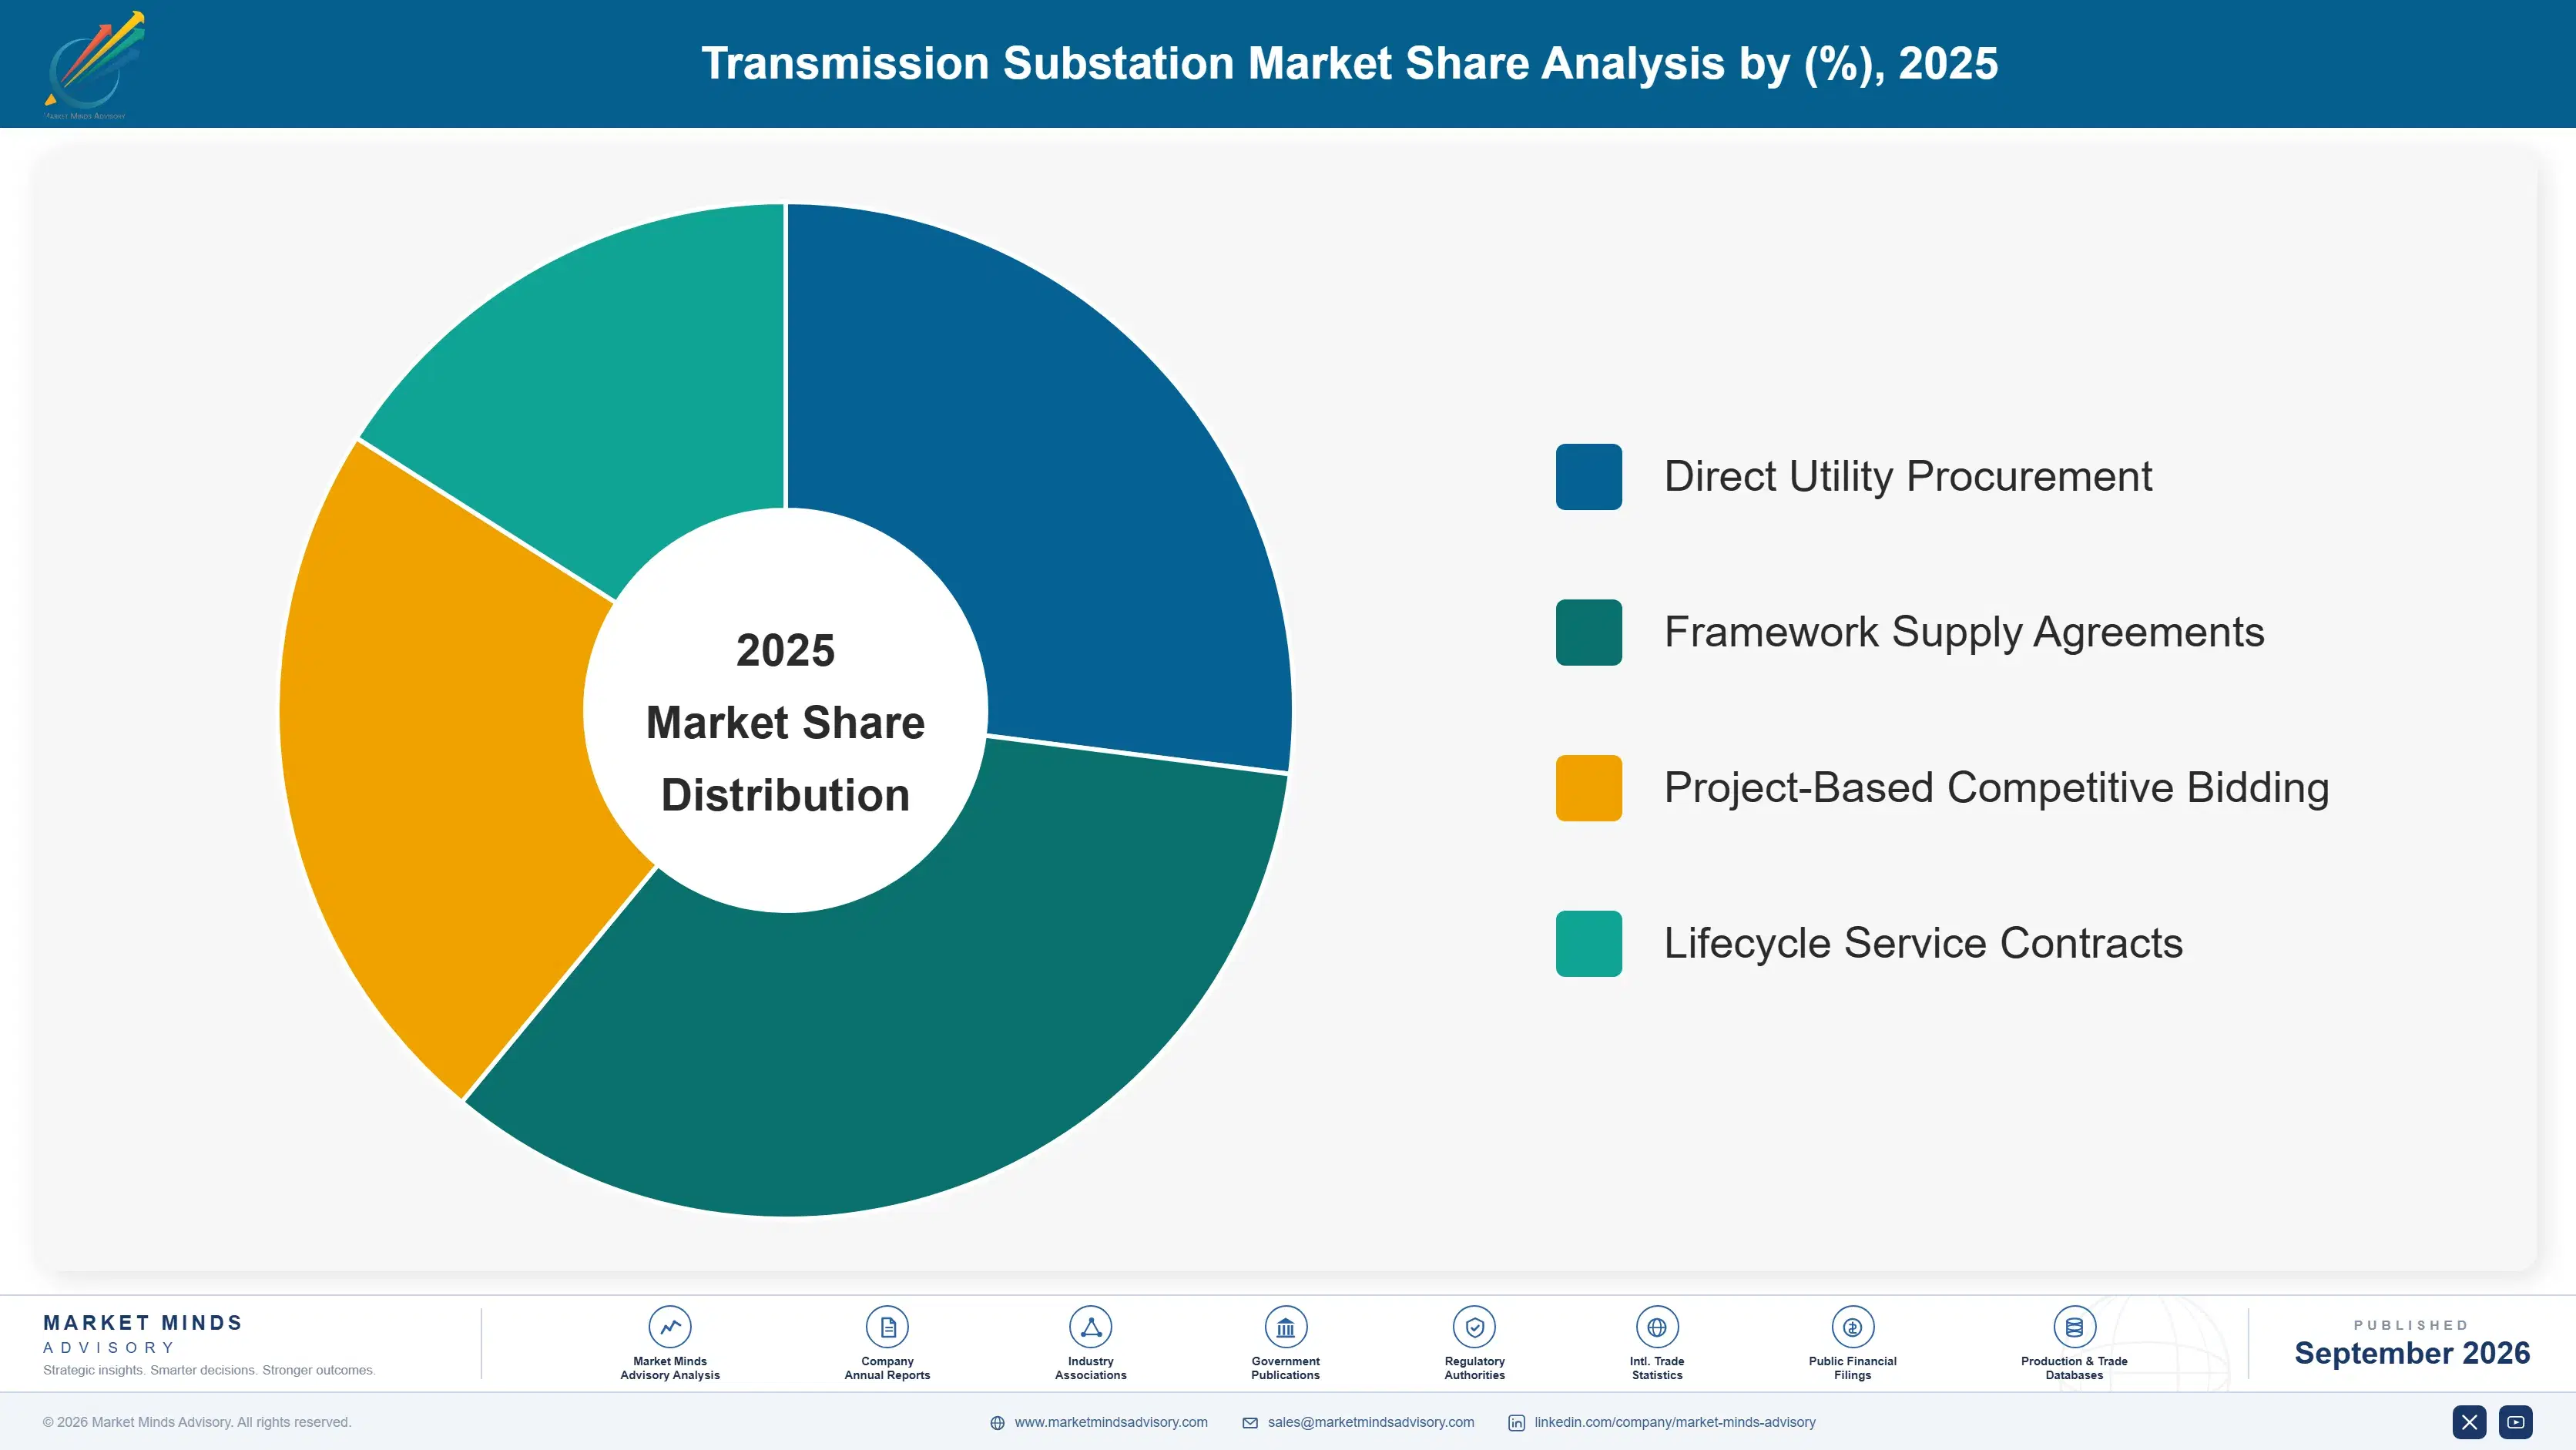
Segmentation follows equipment type, the dimension utilities and manufacturers use to plan procurement sequencing and pricing tiers across transmission substation construction and replacement programs worldwide, spanning conventional and digital formats alike. Six categories cover the market: power transformers, gas-insulated switchgear, air-insulated switchgear, digital protection and control systems, substation automation software, and structural and civil works equipment.
transmission-substation-market-market-share-analysis-1788254807233

Digital and Smart Substation Systems

Digital and smart substation systems are the fastest-growing segment as utilities increasingly pursue automated protection and remote monitoring capability that traditional electromechanical formats cannot deliver at comparable speed and reliability across renewable interconnection and grid modernization projects. Utilities increasingly view digital substation architecture as a genuine long-term infrastructure investment rather than a discretionary upgrade, given considerable improvements in cybersecurity hardening that newer communication protocols now deliver relative to earlier generations that struggled with vulnerability concerns. Manufacturers with established digital systems integration history are winning disproportionate share of this demand, since the specialized software engineering and interoperability testing required creates genuine barriers for newer entrants lacking comparable utility relationships. Grid modernization buyers are pulling forward purchasing decisions.
CAGR 10.5%

Gas-Insulated Switchgear

Gas-insulated switchgear is the second-fastest segment as utilities increasingly specify space-constrained substation designs that traditional air-insulated formats cannot satisfy given growing land cost and urban siting constraints in dense metropolitan areas worldwide today. Utilities increasingly view gas-insulated switchgear as a genuine urban infrastructure solution rather than a premium alternative, given considerable improvements in insulating gas environmental performance that newer formulations now deliver relative to earlier generations that relied on higher-impact greenhouse gases. Manufacturers with established gas-insulated switchgear manufacturing history are winning disproportionate share of this demand, since the specialized sealing and testing process required creates genuine barriers for newer entrants. Urban utility buyers increasingly favor this segment over air-insulated alternatives.
CAGR 8.1%
Full segment breakdown across 6 segments available in the complete report.

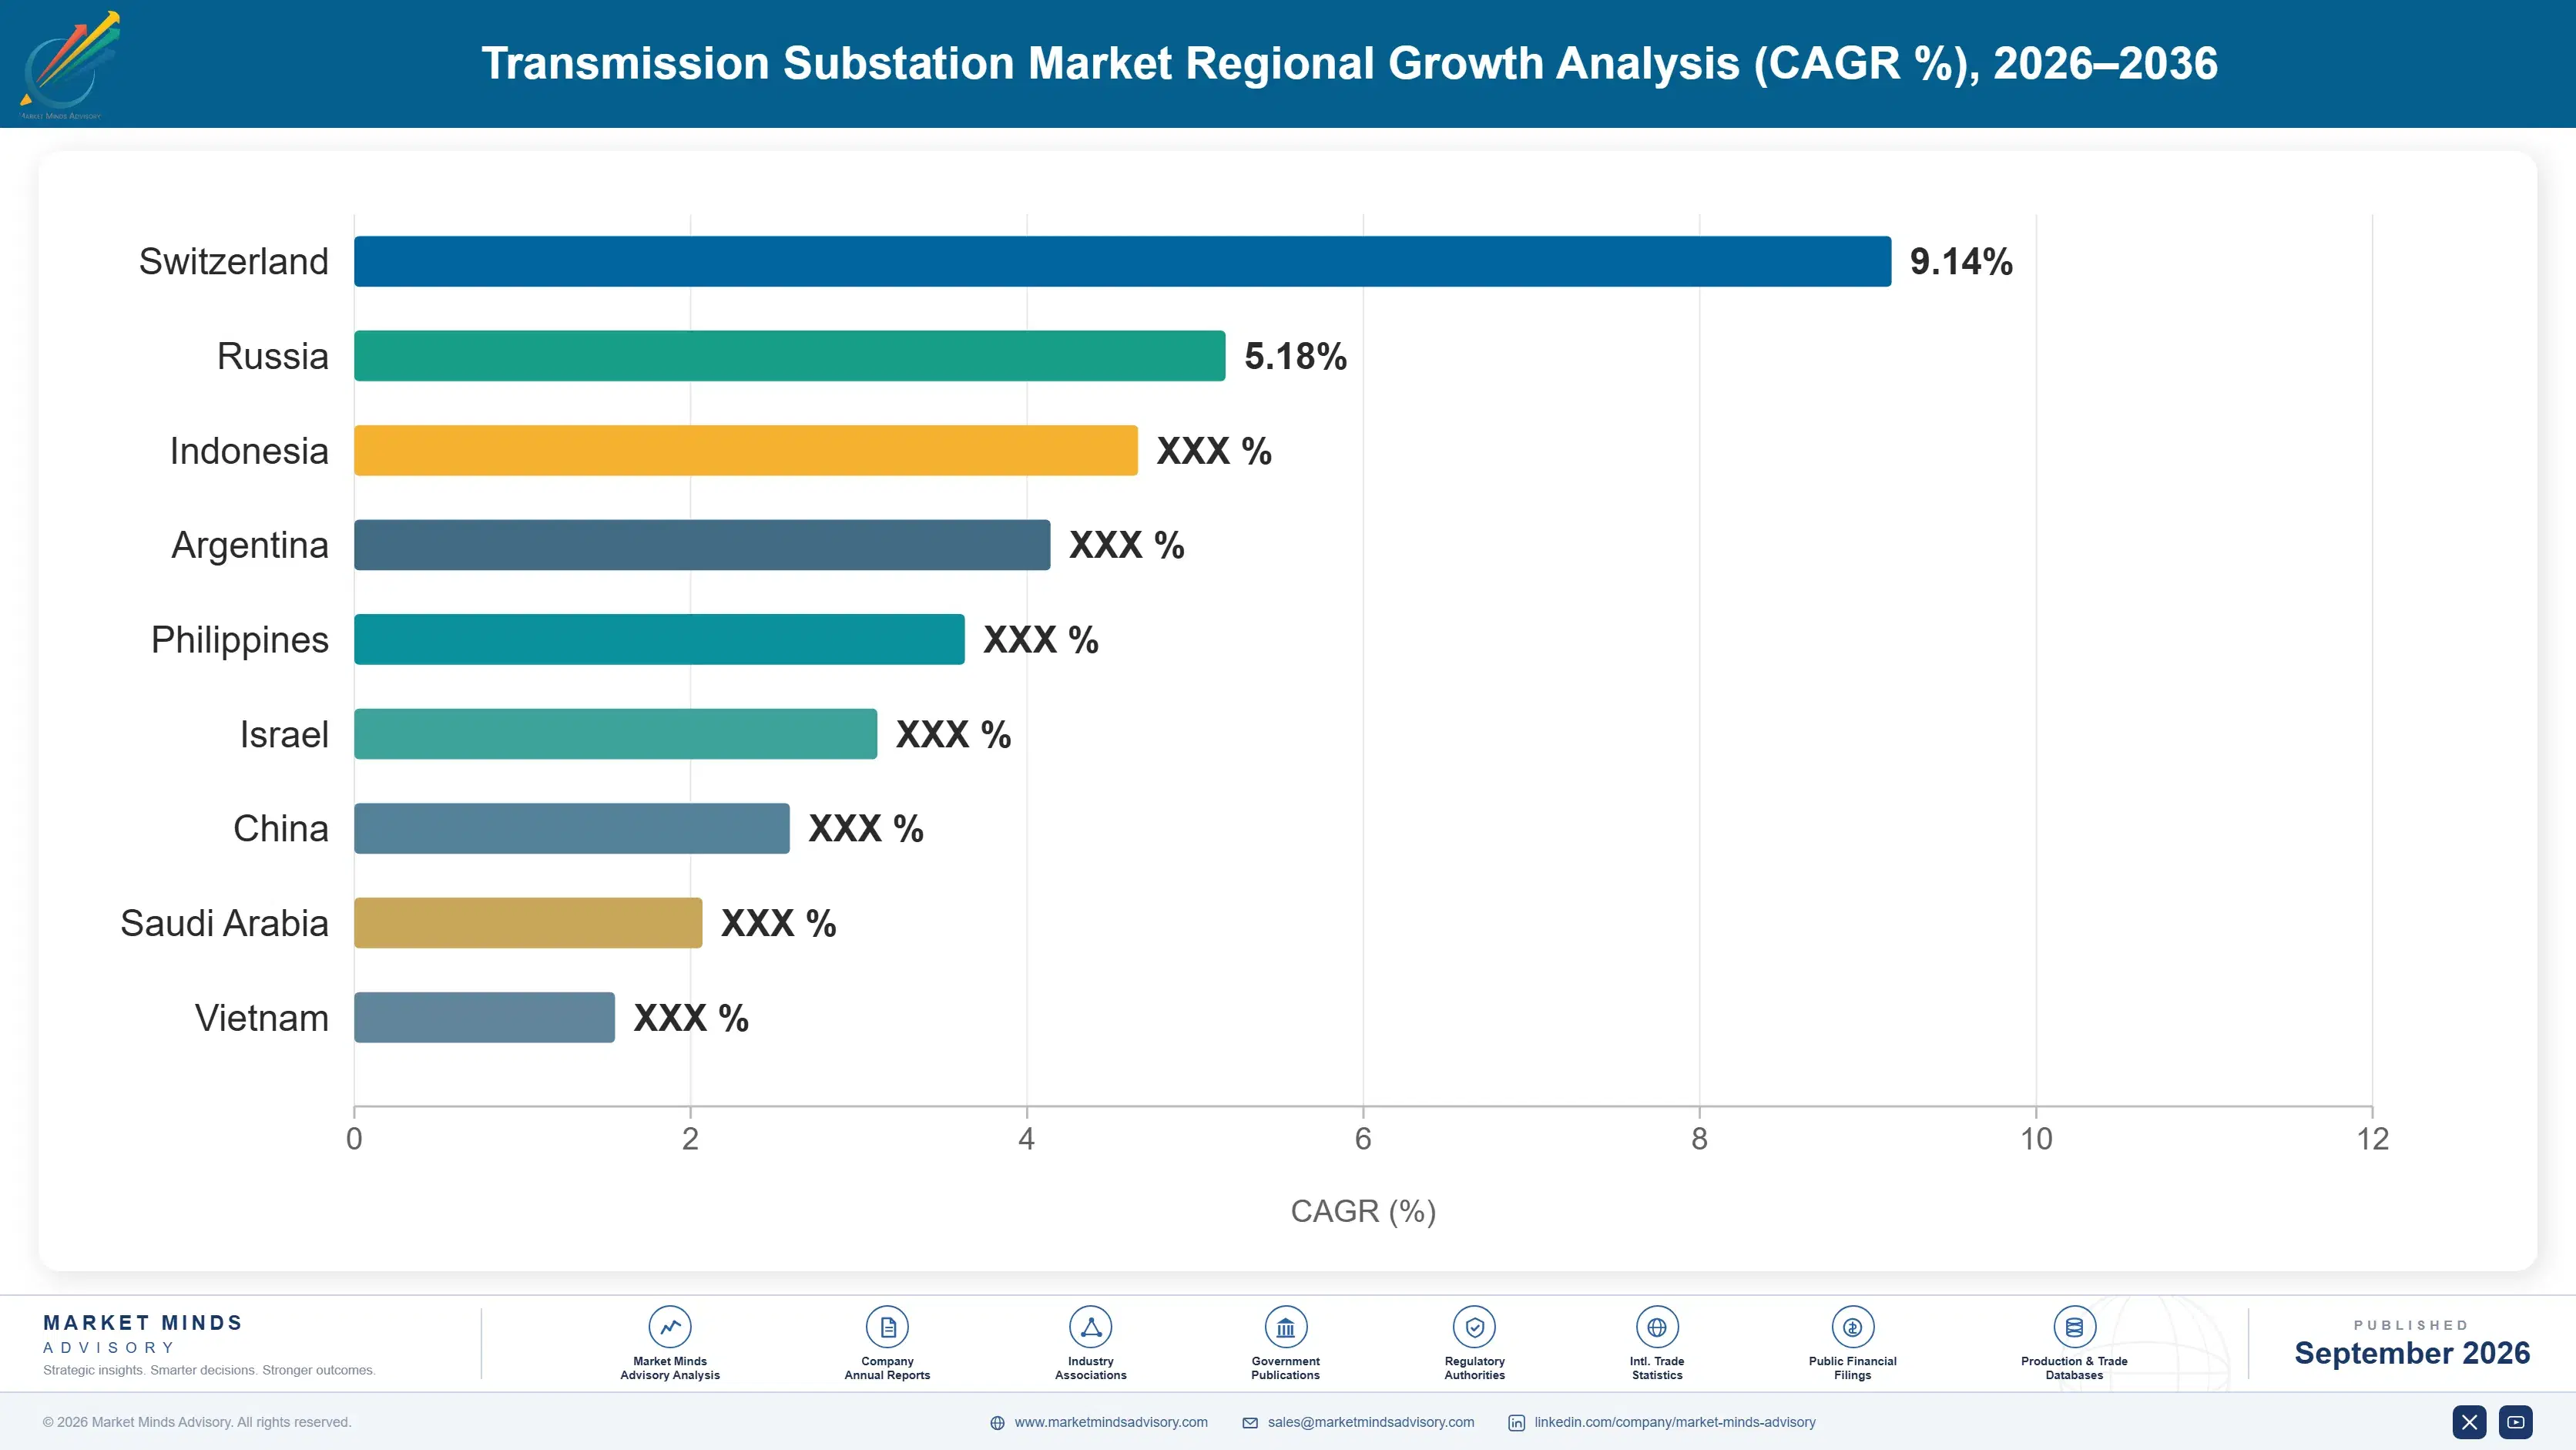
Regional Architecture and Country Demand Map

East Asia leads transmission substation demand on China's dense ultra-high-voltage grid buildout and domestic equipment manufacturing base, while North America and South Asia and Pacific follow closely behind on renewable interconnection investment and expanding grid modernization capacity across most equipment categories and channels served worldwide.

East Asia

China's ultra-high-voltage transmission program dwarfs comparable programs elsewhere, with state utility capital spending funding substation construction across thousands of kilometers of new transmission corridors to move renewable generation from remote regions to coastal demand centers. Domestic equipment manufacturing capacity concentrates here more than in any other region, supplying both local grid expansion and export volume to utilities worldwide. Japan and South Korea contribute meaningful demand through grid resilience upgrades following recent natural disaster events affecting substation infrastructure. Government industrial policy supporting domestic transformer and switchgear manufacturing reinforces the region's position as both primary producer and largest consumption market. Export infrastructure moves considerable finished-equipment volume to utility buyers internationally. Continued pilot corridor investment keeps regional manufacturers ahead of certification standards.
Share: 30% | CAGR: 7.2% (2026 to 2036)

North America

Renewable interconnection queue backlogs drive considerable substation investment here, as developers wait years for transmission capacity capable of accommodating new solar and wind generation projects across most major grid operator territories. Aging transformer fleets across most established utility service territories create substantial replacement demand independent of new construction activity tied to renewable growth. Domestic manufacturing capacity has consolidated over recent decades, leaving several major utility contracts served by a concentrated group of established suppliers with long operating histories. Federal infrastructure funding programs have accelerated substation modernization timelines considerably across multiple states pursuing grid resilience improvements. Utility capital budgets here dedicate meaningful allocation specifically to substation programs. Utility procurement increasingly favors suppliers with proven, multi-decade reliability track records.
Share: 24% | CAGR: 7.0% (2026 to 2036)
Regional intelligence for 5 additional markets available in the complete report: Western Europe, South Asia and Pacific, Latin America, Middle East and Africa, Eastern Europe. Contact sales@marketmindsadvisory.com.
transmission-substation-market-country-cagr-analysis-1788254807766

Digital Certification and Framework Agreement Expansion

Transmission substation manufacturers have several concrete levers available to expand revenue beyond simple equipment volume growth, spanning digital protection certification, multi-year utility framework agreements, cybersecurity hardening capability, and lifecycle service contracts. Each lever draws on distinct commercial mechanics rather than simple price increases alone across the existing product range and geography served worldwide today.

Expand Digital Protection Certification Testing Capacity

Manufacturers that invest in digital protocol certification testing and cybersecurity hardening documentation can command considerably higher price points than conventional electromechanical equivalents, since utilities pay a substantial premium for documented interoperability and security reliability across modernized grid infrastructure and control systems. This tier already carries gross margins roughly 20 percentage points above conventional equipment production, and expanding capability toward it directly improves blended profitability without requiring proportional volume growth across facilities. Manufacturers lacking established digital certification history face a longer development runway, since utility trust builds gradually through consistent quality delivery.
Market Impact: Improves blended gross margin by 20 percentage points

Secure Multi-Year Utility Framework Supply Agreements

Negotiating multi-year framework agreements with major utility customers delivers considerably more predictable revenue than project-by-project bidding, letting manufacturers plan production capacity around confirmed multi-year deployment schedules rather than lumpy individual contract awards tied to capital budget cycles, regulatory rate case timing, and lengthy multi-year approval processes. Manufacturers that have built dedicated framework agreement relationships report revenue predictability roughly 26 percentage points higher than bid-dependent competitors, since long-term contracts smooth utility capital spending cycle volatility considerably. This requires sustained investment in account management and long-term reliability documentation across successive deployment phases.
Market Impact: Improves revenue predictability by roughly 26 percentage points

Develop Cybersecurity Hardening and Compliance Capability

Expanding cybersecurity hardening and compliance certification capability captures utility demand seeking documented protection against network vulnerability concerns that basic digital substation offerings cannot adequately address, commanding a premium of roughly 15 to 20 percent over standard digital configurations across most deployment scenarios and utility territories. This lever requires meaningful upfront investment in security engineering and compliance documentation, since inadequate cybersecurity hardening damages utility trust considerably faster than it builds it. Manufacturers that have already solved these engineering challenges enjoy a considerable head start over competitors still dependent on basic digital product architectures.
Market Impact: Commands price premium of 15 to 20 percent

Expand Lifecycle Maintenance and Monitoring Service Contracts

Bundling scheduled maintenance and remote monitoring services with initial substation equipment sales creates recurring revenue that basic one-time hardware sales cannot generate, particularly valuable given that neglected maintenance is a leading cause of unplanned substation outages during peak demand periods nationwide, abroad, and quite virtually everywhere between. This lever requires building service technician networks and remote monitoring infrastructure that few manufacturers currently maintain at meaningful scale. Manufacturers already offering these contracts report recurring revenue equal to roughly 16 percent of initial equipment sale value annually, alongside considerably improved customer retention.
Market Impact: Adds recurring revenue equal to 16 percent annually

Who Controls the Margin Pool

Concentration sits at a moderately high level, with the top five manufacturers controlling roughly 48 percent of global revenue on a revenue-consistent basis. Siemens Energy holds leadership through systems integration breadth and global utility relationships, while Hitachi Energy and ABB compete in a distinct digital protection tier that Siemens Energy addresses only partially. The gap between leader and mid-tier challengers stays considerable, since certification barriers compound over successive utility generations.
Competitive activity currently centers on digital protection certification, cybersecurity hardening investment, and utility framework agreement pursuit across nearly every major manufacturer. Gas-insulated switchgear expansion has become a standard response to space-constrained urban siting concerns from utilities requiring compact substation footprints. Several manufacturers have also invested in dedicated lifecycle service teams, recognizing recurring maintenance revenue now materially improves customer value.

Emerging pressure comes from cybersecurity technology specialists entering from adjacent industrial control system categories, bringing network security expertise that traditional electromechanical manufacturers lack. Rankings could shift if a challenger successfully scales reliable digital protection without the vulnerability issues that have historically concerned reliability-conscious utility buyers. Lifecycle service capability also represents a genuine opportunity for smaller manufacturers to leapfrog incumbents still dependent on one-time equipment sales.
transmission-substation-market-company-positioning-matrix-1788254808294

Competitive Moat and Risk Dimensions

SIEMENS ENERGY

Moat: Systems Integration Breadth

Siemens Energy's extensive systems integration portfolio and global utility relationships let it serve substation contracts across nearly every equipment category that smaller competitors cannot fully address, while its long operating history sustains trust among utility procurement teams. This combination of integration breadth and reliability heritage creates a durable advantage competitors have struggled to replicate.
SIEMENS ENERGY

Risk: Legacy Equipment Portfolio Drag

Siemens Energy's broad legacy equipment portfolio sometimes slows adoption of newer digital architectures that smaller, newer competitors can deploy without compatibility constraints from decades of accumulated product lines. Utilities prioritizing pure digital architecture over integration breadth increasingly consider newer specialized competitors instead, a risk that grows as digital platforms mature.
HITACHI ENERGY

Moat: Digital Protection Reliability Heritage

Hitachi Energy built its reputation on decades of protection relay and digital substation reliability that broader-line competitors find difficult to replicate credibly, since utilities recognize the difference between genuine engineering depth and marketing-driven premium positioning built on scale alone. This reliability commands price premiums considerably above mass-market formats and sustains loyal utility customer relationships.
HITACHI ENERGY

Risk: Limited Conventional Equipment Scale

Hitachi Energy lacks the conventional electromechanical manufacturing scale that broader-line competitors use to capture volume across all equipment categories simultaneously, limiting its ability to serve utilities seeking single-supplier procurement convenience across every application category. Its narrower digital-focused range constrains volume growth relative to broader-line competitors with established commodity manufacturing capacity.

Players Tracked

Prominent Players

Siemens Energy
Hitachi Energy
ABB
Schneider Electric
GE Vernova

Other Key Players

Toshiba Energy Systems
Mitsubishi Electric
Eaton
TBEA
China XD Electric
Pinggao Group
Crompton Greaves
Larsen & Toubro
Efacec
CG Power and Industrial Solutions
Elgin Power Solutions
Meidensha Corporation
Hyosung Heavy Industries
Hyundai Electric
SGB-SMIT Group

Recent Developments

FEBRUARY 2026

Siemens Energy expanded production capacity for its digital substation protection line through a new software development center investment focused on cybersecurity hardening certification, targeting the fastest-growing segment identified across the broader transmission substation category worldwide this year, according to company disclosures released publicly this quarter.
Signal: Signals continued investment in digital protection software capability expansion across the fastest-growing category segment this year
OCTOBER 2025

Hitachi Energy entered a supply agreement with a national utility association to pilot performance-based lifecycle service contracting across multiple member utilities, aiming to demonstrate recurring maintenance value and secure long-term reliability data amid growing scrutiny of capital efficiency across the substation segment broadly, per the company's statement.
Signal: Signals lifecycle service contracting becoming a genuine competitive requirement rather than a marketing claim across the industry
MAY 2025

ABB launched a new gas-insulated switchgear product line designed specifically for space-constrained urban substation sites nationwide, generating considerable municipal utility interest and reinforcing the brand's positioning within the compact-footprint segment that increasingly shapes premium substation equipment purchasing behavior among urban utility buyers everywhere today and beyond.
Signal: Signals compact-footprint design remains a durable growth tactic across the entire industry going forward this decade

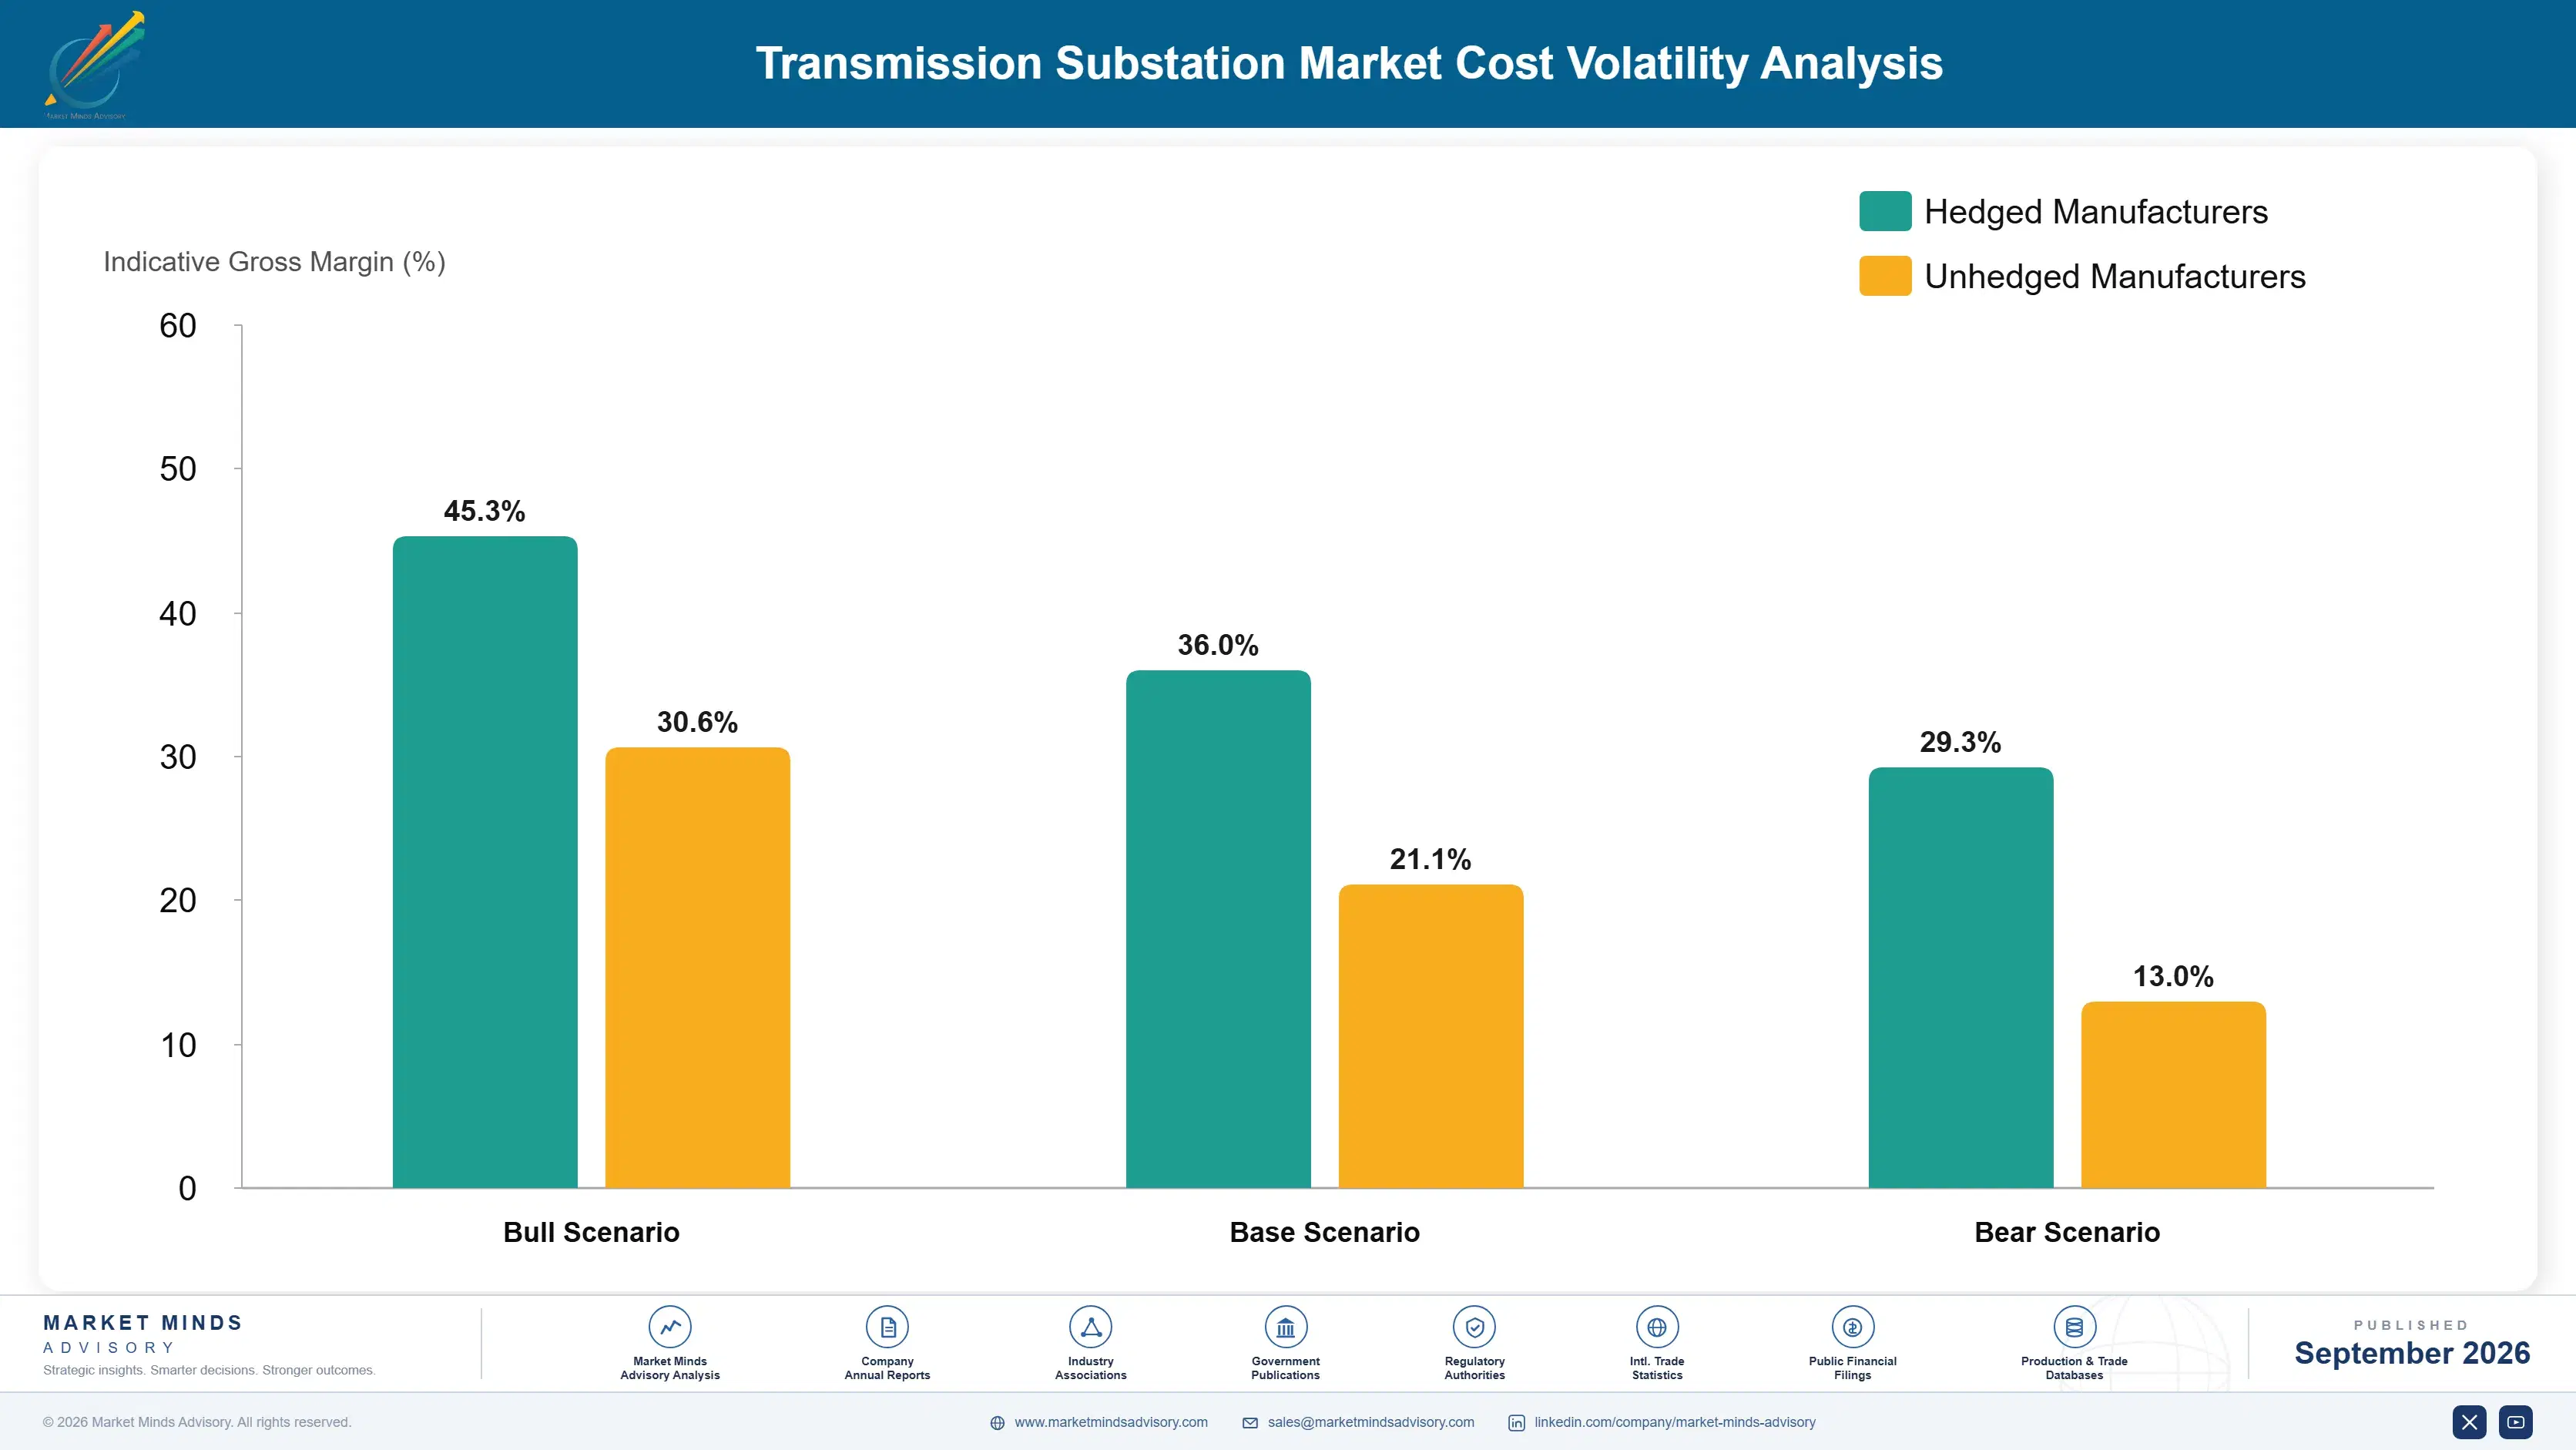
Copper and Steel Component Cost Exposure

Copper windings and structural steel components together account for roughly 52 percent of cost of goods sold across most substation equipment manufacturers, with the remainder split across insulating materials, control electronics, and assembly labor overhead. Copper sources predominantly from mining and refining operations concentrated across South America and East Asia, while structural steel increasingly sources from mills serving the broader power transmission equipment industry worldwide.
Global copper prices rose considerably during 2024 as supply constraints across several major producing countries tightened winding material availability, a volatility event documented in EIA and industry metals reporting covering the period in careful detail. Manufacturers dependent on spot-market copper purchasing absorbed meaningful margin compression during this window, while competitors already locked into long-term supply contracts faced comparatively muted cost pressure from the same disruption.

This cost exposure disadvantages smaller manufacturers lacking the scale to negotiate favorable long-term copper and steel supply contracts, forcing many toward spot market purchasing that carries considerably higher price volatility than contracted volume. Larger manufacturers with vertically integrated winding production or diversified metal sourcing sustain more predictable margins across market cycles. Exposure also varies by geography, since manufacturers based near metal-producing regions face lower logistics cost than distant importers.
transmission-substation-market-cost-volatility-analysis-1788254808489

Diversify Copper and Steel Supplier Base

Manufacturers can reduce single-source dependency by qualifying multiple copper and steel suppliers across different geographies, insulating production from any single mill or refinery's capacity constraints or price spike events affecting the broader supply chain and manufacturing network. This diversification requires meaningful upfront qualification investment but delivers considerably more resilient supply continuity during industry-wide shortages and disruptions.

Secure Long-Term Metal Supply Contracts

Locking in multi-year copper and steel supply agreements with established suppliers protects manufacturers from spot market volatility during price-constrained periods like the one documented during 2024 across major producing regions worldwide and beyond. This requires meaningful upfront negotiation investment and capital commitment but delivers considerably more predictable input costs across successive production cycles than open-market purchasing.

Vertically Integrate Winding Production

Larger manufacturers can integrate copper winding production directly into their own facilities rather than relying entirely on third-party winding suppliers, capturing margin currently paid to intermediaries while gaining direct control over material quality and delivery timelines. This approach requires substantial capital investment and technical expertise that only the largest manufacturers can currently justify economically.

Portfolio Architecture for Margin Defence

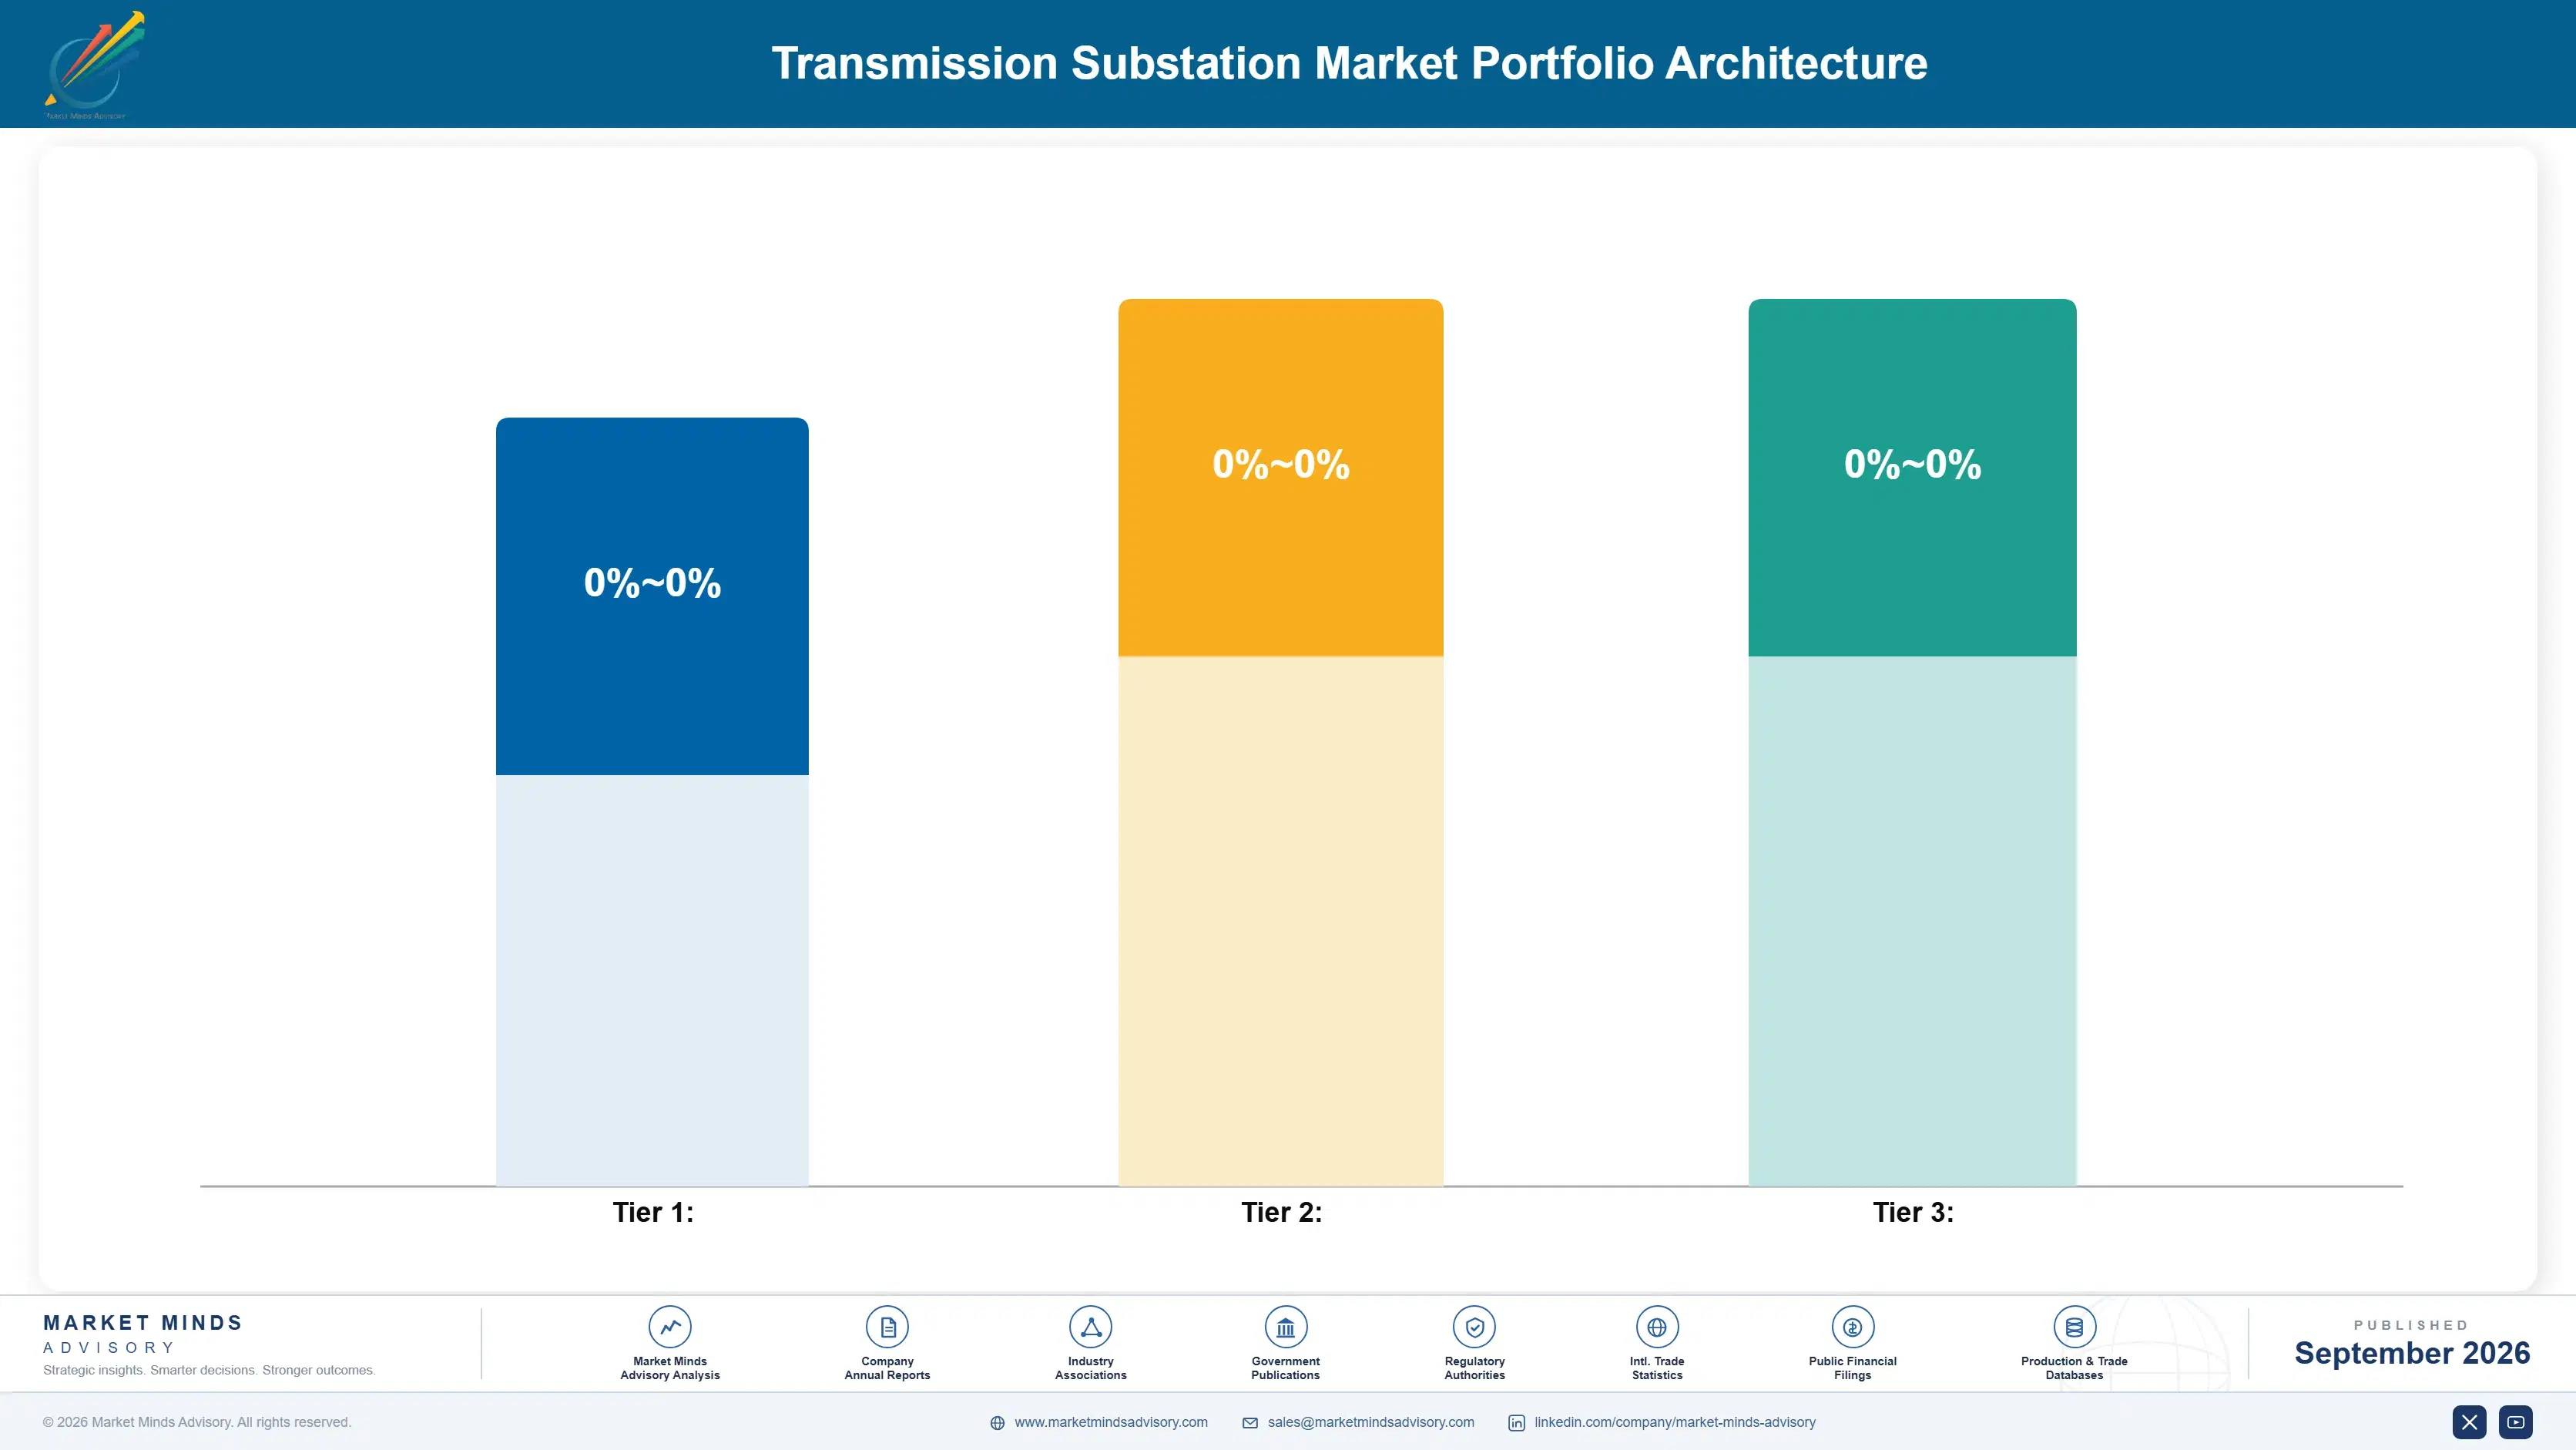
The transmission substation market splits into three distinct margin tiers, and manufacturers rarely compete effectively across all three simultaneously at scale. Volume commodity-adjacent products rely on manufacturing efficiency and conventional electromechanical simplicity, while premium certified formats command considerably higher margins through digital protection systems that mass producers cannot easily replicate given development timelines. This tier division forces most manufacturers to choose a primary competitive lane rather than straddling both across every equipment category.
The tension between volume and premium positioning shapes nearly every strategic decision manufacturers make, from copper sourcing to utility channel selection and software investment allocation. Volume players optimize for cost and conventional simplicity, while premium players optimize for digital reliability and cybersecurity hardening, and the two operating models rarely coexist well within a single organization without diluting one positioning or the other considerably.

High-value profit pools concentrate disproportionately in the digital substation and gas-insulated switchgear segments, where systems sophistication and reliability documentation justify pricing considerably above production cost across most utility channels. Manufacturers that successfully build credible digital positioning capture margin expansion unavailable to volume-focused competitors, though building that credibility requires sustained investment over multiple product cycles rather than a single successful launch.

Conventional electromechanical substation equipment sold through commodity distribution channels, competing primarily on price and manufacturing scale rather than digital sophistication or cybersecurity hardening across most utility applications and geographic markets worldwide.
Gross Margin

Digital and smart substation systems sold through direct utility contract and framework agreement channels, commanding premium pricing through documented cybersecurity reliability, interoperability certification, and established utility relationships built over multiple product cycles.
Gross Margin

Gas-insulated switchgear and renewable interconnection equipment targeting space-constrained and grid modernization buyers, increasingly favored by regulatory tailwinds in several major markets and growing generational preference shifts toward compact, low-maintenance grid formats.
Gross Margin
transmission-substation-market-portfolio-architecture-1788254808991

High-value Sub-segments and Strategic Watch-out

Digital and Smart Substation Systems

The highest-value, fastest-growing segment, combining strong margin economics with sustained double-digit consumer demand growth driven by renewable interconnection, grid modernization investment, and cybersecurity certification across most major utility and infrastructure markets, retail channels, and demographic cohorts worldwide this coming year and considerably further still beyond.

Gas-Insulated Switchgear

A high-value segment growing steadily as space-constrained urban siting preferences strengthen among utilities across most major markets and channels worldwide today, though margin economics currently trail the digital tier until insulating gas costs decline further with continued manufacturing scale investment, supplier maturity, and regulatory clarity.

Air-Insulated Switchgear

The volume core of the category, sustaining steady but unspectacular growth through commodity distribution channels and standard rural and suburban applications worldwide, providing predictable revenue that funds premium tier investment across most established manufacturer portfolios and geographic markets this year and into the following forecast period.

Power Transformers

A strategic watch-out segment facing manufacturing capacity shortage challenges that could limit long-run adoption unless manufacturers address lead-time concerns that currently constrain broader utility acceptance across most price-sensitive markets, demographics, geographies, and application categories worldwide through the entire extended forecast period well and truly ahead.

Framework Renewal and Lifecycle Service Economics

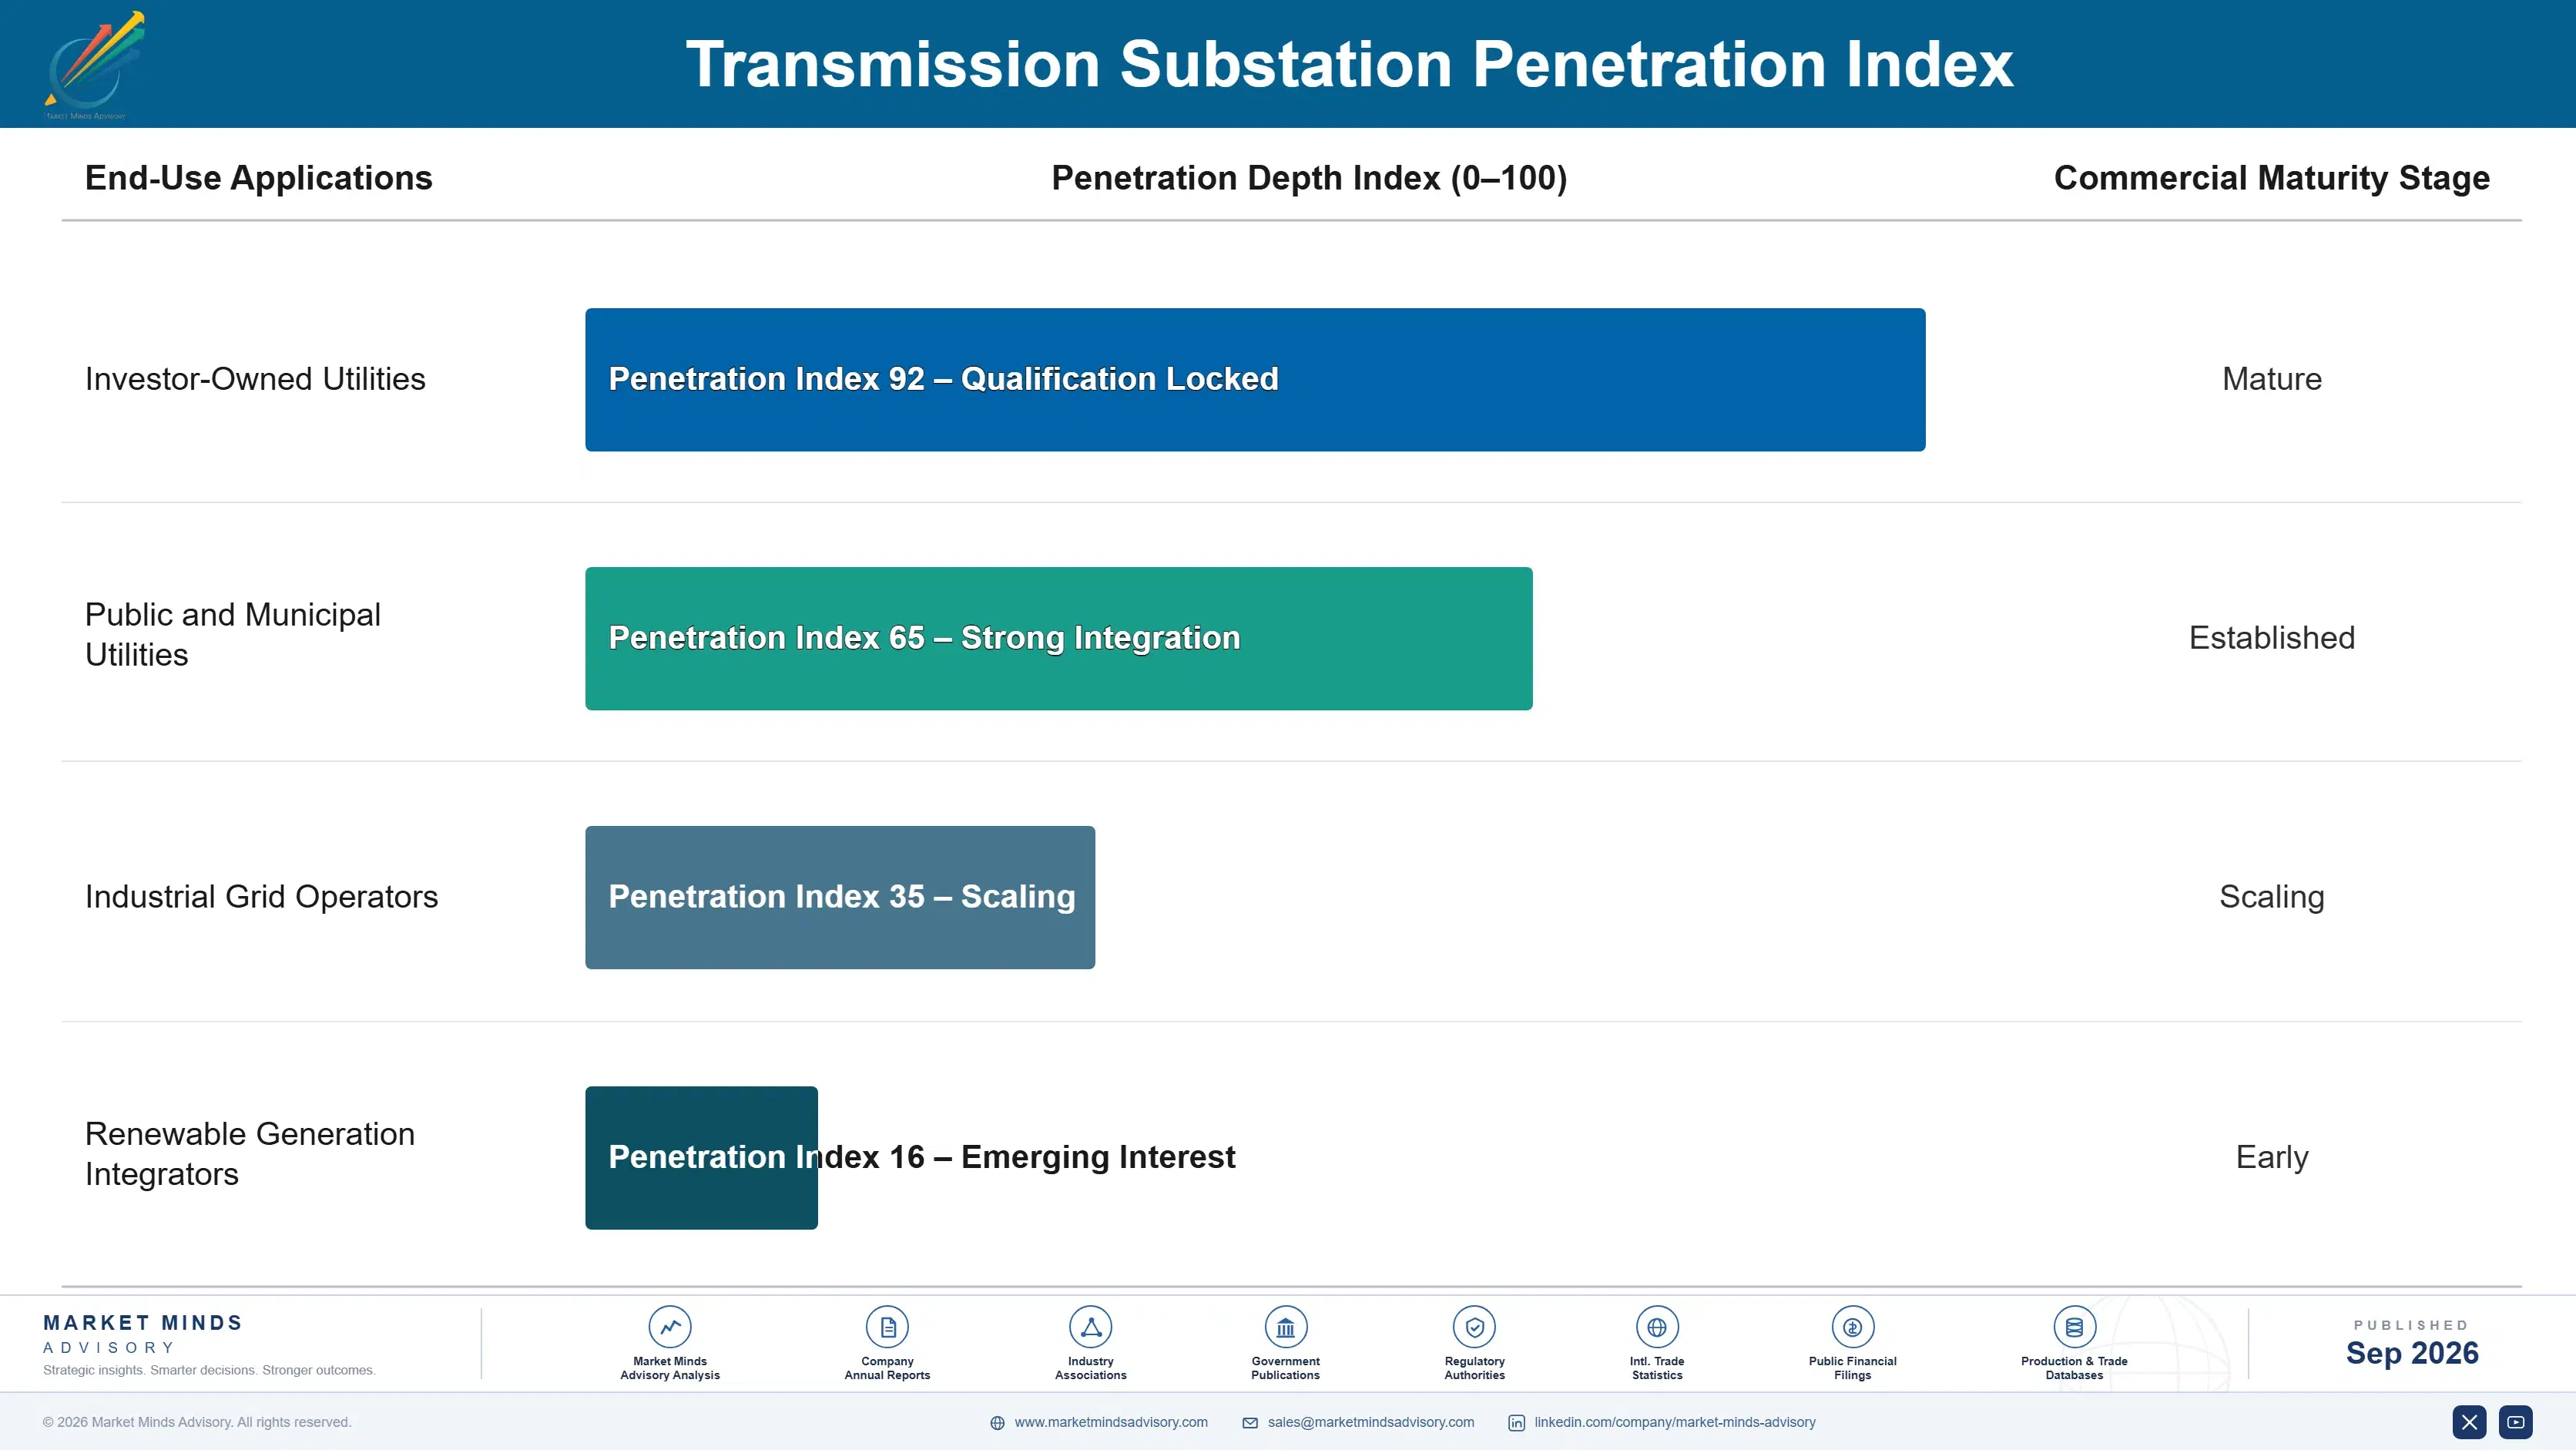
Transmission substation equipment behaves more like an annuity purchase category for utility buyers than a one-time equipment decision, since multi-year framework agreements and phased replacement programs drive repeat revenue well beyond the initial installation sale. Manufacturers that cultivate utility relationships through consistent reliability documentation and long-term supply commitments capture considerably more lifetime value per account than those competing purely on project-by-project bidding.
Adoption stickiness varies considerably by end-use vertical: utilities rarely switch equipment suppliers once a substation platform is qualified, given the cost and disruption of requalifying alternative systems across an entire service territory, while new construction and greenfield projects invite broader competitive bidding among certified suppliers. Reliability-mandated utilities exhibit the deepest engagement, often standardizing procurement across entire regional networks rather than individual substation sites.

Generational shifts are reshaping buyer profiles considerably: younger utility engineers increasingly evaluate suppliers through digital performance dashboards and remote monitoring platforms rather than legacy relationship-based procurement, while placing greater weight on interoperability and cybersecurity credentials than prior generations did. Established procurement teams still favor long-standing supplier relationships, but even this segment increasingly requires updated performance data before renewing framework agreements.
transmission-substation-market-end-use-penetration-index-1788254809474

Digital Certification Priorities Ahead

These are among the four positions where our research anticipates prominent divergence between winners and laggards over the coming forecast period. Each is grounded in the demand model, the regulatory perimeter, and the announced capacity pipeline.
01 / DIGITAL CERTIFICATION STRATEGY

Invest in digital protection and cybersecurity certification now

Manufacturers still limited to conventional electromechanical production face considerably lower margin potential than competitors already qualified for digital substation contracts across multiple utility territories, grid modernization programs, and geographic markets worldwide today. The certification timeline for digital protection systems runs several years, meaning manufacturers starting testing now will only reach market as renewable interconnection demand accelerates through the coming decade-long forecast period ahead. Beginning certification investment today positions manufacturers considerably ahead of competitors that delay this lengthy, multi-year validation process.
02 / FRAMEWORK AGREEMENT DEVELOPMENT

Build multi-year utility framework agreements broadly

Manufacturers with established framework agreements capture considerably more predictable revenue than competitors dependent on project-by-project bidding, since utility capital spending cycles create lumpy demand that framework contracts help smooth across successive budget years and approval cycles worldwide. This gap will widen further as utilities increasingly consolidate procurement around fewer qualified framework suppliers throughout the coming forecast period and well beyond it. Manufacturers should prioritize framework agreement development over relying solely on opportunistic single-project bidding across every regional utility market served.
03 / MANUFACTURING CAPACITY EXPANSION

Expand transformer manufacturing capacity investment now

Transformer manufacturing capacity shortages currently extend lead times well beyond what utilities anticipated when planning substation construction and replacement timelines across most major markets, utility territories, and grid modernization programs worldwide today. Manufacturers that expand production capacity now capture disproportionate share of pent-up demand before competitors catch up to the current capacity shortfall affecting the broader industry and supply chain. A disciplined capacity expansion roadmap built around genuine manufacturing investment will outperform incremental capacity additions made reactively over the next several years.
04 / REGIONAL CAPACITY ALLOCATION

Prioritize East Asia and South Asia Pacific expansion

East Asia and South Asia and Pacific both carry regional CAGRs meaningfully above the global average, reflecting genuine manufacturing scale advantages and rapid grid expansion happening simultaneously across most major urbanizing economies and utility territories worldwide. Manufacturers concentrating capacity investment in North America and Western Europe alone risk missing the fastest volume growth available anywhere in the broader global category this decade. Reallocating incremental capital toward these two regions captures both cost efficiency and demand growth over the next full decade ahead.

Engagement Snapshot From the Field

A live engagement with an industry participant carrying material or product regulatory and market exposure ahead of a defining policy shift, showing how our research translates into a defensible multi-year portfolio strategy.
MARKET MINDS ADVISORY · CLIENT ENGAGEMENT SUMMARY
Transmission Substation Producer Strategic Portfolio Review and Transition Roadmap 2026·Investment Scenario on Transmission Substation Exposure Evaluation 2025-26
CLIENT PROFILE
A mid-sized regional electric utility with established conventional electromechanical substation infrastructure across a multi-state transmission territory sought to modernize its aging substation fleet with digital protection systems to accommodate growing renewable interconnection requests without the systems integration expertise and capital budget flexibility that larger investor-owned utilities had already built over roughly a decade of continuous modernization investment nationwide.
STRATEGIC CHALLENGE
The utility's existing substation infrastructure relied heavily on conventional electromechanical protection, leaving it without the digital systems integration or cybersecurity hardening capability needed to credibly accommodate its rapidly growing renewable interconnection queue without extensive third-party engineering support across its entire multi-state territory, diverse customer base, and considerably aging feeder network.
MMA APPROACH
MMA conducted primary interviews with regional utility engineers and substation equipment vendors, benchmarked digital modernization timelines and financing structures against comparable utilities nationwide, and modeled three distinct modernization sequencing strategies for accommodating renewable interconnection demand without the multi-year capital budget flexibility that larger utilities typically possess and routinely rely upon.
KEY FINDINGS
  1. Digital protection retrofit at existing substations proved considerably faster than greenfield substation construction for accommodating near-term interconnection requests (client-reported, unverified by MMA).
  2. Phased substation-by-substation modernization sequencing achieved renewable interconnection milestones considerably faster than attempting a simultaneous utility-wide rollout program overall (client-reported, unverified by MMA).
  3. Vendor-provided financing partnerships proved more accessible than traditional utility bond financing given the utility's constrained credit capacity currently (client-reported, unverified by MMA).
  4. Prioritizing highest-queue-volume substations first delivered the largest interconnection capacity improvement per dollar invested in the entire modernization program (client-reported, unverified by MMA).
CLIENT PROFILE
A mid-sized regional electric utility with established conventional electromechanical substation infrastructure across a multi-state transmission territory sought to modernize its aging substation fleet with digital protection systems to accommodate growing renewable interconnection requests without the systems integration expertise and capital budget flexibility that larger investor-owned utilities had already built over roughly a decade of continuous modernization investment nationwide.
STRATEGIC CHALLENGE
The utility's existing substation infrastructure relied heavily on conventional electromechanical protection, leaving it without the digital systems integration or cybersecurity hardening capability needed to credibly accommodate its rapidly growing renewable interconnection queue without extensive third-party engineering support across its entire multi-state territory, diverse customer base, and considerably aging feeder network.
MMA APPROACH
MMA conducted primary interviews with regional utility engineers and substation equipment vendors, benchmarked digital modernization timelines and financing structures against comparable utilities nationwide, and modeled three distinct modernization sequencing strategies for accommodating renewable interconnection demand without the multi-year capital budget flexibility that larger utilities typically possess and routinely rely upon.
KEY FINDINGS
  1. Digital protection retrofit at existing substations proved considerably faster than greenfield substation construction for accommodating near-term interconnection requests (client-reported, unverified by MMA).
  2. Phased substation-by-substation modernization sequencing achieved renewable interconnection milestones considerably faster than attempting a simultaneous utility-wide rollout program overall (client-reported, unverified by MMA).
  3. Vendor-provided financing partnerships proved more accessible than traditional utility bond financing given the utility's constrained credit capacity currently (client-reported, unverified by MMA).
  4. Prioritizing highest-queue-volume substations first delivered the largest interconnection capacity improvement per dollar invested in the entire modernization program (client-reported, unverified by MMA).
RECOMMENDED STRATEGY
Phase 1: Phase one: pursue vendor financing partnerships to reduce upfront capital requirements for digital protection retrofits quite quickly and rather reliably. Phase 2: Phase two: modernize highest-queue-volume substations first to maximize interconnection capacity improvement per each dollar actually spent overall throughout the program. Phase 3: Phase three: expand modernization systematically across remaining substations using validated retrofit and financing models established quite successfully rather earlier on.
OUTCOME
The utility cleared a substantial share of its renewable interconnection queue within eighteen months, accelerating capacity delivery considerably faster than internal projections anticipated through phased digital retrofit deployment across its entire multi-state territory and even further well beyond that quite eventually (client-reported, unverified by MMA).

Frequently Asked Questions

Foundational context covering the market sizes, CAGR, scope, country, region and competition that inform every finding below. This section is provided to cover basics and most often pre-purchase conversations, answered from the MMA Primary Research Dataset.

What is the current size of the Transmission Substation Market?

The global transmission substation market reached 14.0 billion dollars in 2025. This figure covers transformer, switchgear, digital protection, and automation formats sold worldwide today and beyond.

How large will the Transmission Substation Market be by 2036?

The market is projected to reach roughly 27.14 billion dollars by 2036. Growth reflects rising renewable interconnection demand and digital protection adoption across most regions.

What is the CAGR for the Transmission Substation Market 2026 to 2036?

The market is projected to grow at a compound annual rate of 6.2 percent through 2036. Growth outpaces general power equipment categories on digital substation demand.

Which segment is growing fastest?

Digital and Smart Substation Systems lead growth at a 10.5 percent CAGR, roughly 1.69 times the overall market rate. Renewable interconnection demand drives this outperformance.

Who are the major companies in the Transmission Substation Market?

Siemens Energy, Hitachi Energy, ABB, Schneider Electric, and GE Vernova lead the category on a revenue-consistent basis. Together these five manufacturers hold roughly 48 percent of global market revenue.

Which country is growing fastest?

China leads country-level growth at a 9.2 percent CAGR, driven by expanding ultra-high-voltage transmission investment and domestic equipment manufacturing capacity. Renewable interconnection accelerates procurement volume considerably.

Report Segmentation Architecture

The full report scope spans multiple orthogonal segmentation dimensions, with cross-tabulated demand data provided for each dimension pair. Coverage extends further to regional breakdowns, trend trajectories, and the competitive detail needed to support segment-level decision-making.
  • Power Transformers
  • Gas-Insulated Switchgear
  • Air-Insulated Switchgear
  • Digital Protection and Control Systems
  • Substation Automation Software
  • Structural and Civil Works Equipment
  • Investor-Owned Utilities
  • Public and Municipal Utilities
  • Industrial Grid Operators
  • Renewable Generation Integrators
  • Direct Utility Procurement
  • Framework Supply Agreements
  • Project-Based Competitive Bidding
  • Lifecycle Service Contracts

By Region

  • North America
  • Western Europe
  • East Asia
  • South Asia and Pacific
  • Latin America
  • Middle East and Africa
  • Eastern Europe

Scope, Methodology, and Coverage

Every figure in this report is reproducible from documented input assumptions. The scope below maps the historical period, the forecast horizon, the segmentation dimensions, and the countries covered, alongside the underlying primary and qualitative methodology.
Historical Period
2020 to 2025
Forecast Period
2026 to 2036
Base Year
2025 (USD billions; MMA Primary Research Dataset, September 2026)
Market Definition
This report covers revenue from power transformers, gas-insulated switchgear, air-insulated switchgear, digital protection and control systems, substation automation software, and structural and civil works equipment worldwide. It excludes distribution-level substations and generation step-up transformers.
Quantitative Units
USD billions, unit and capacity shipments where disclosed
Segmentation Dimensions
Equipment type, voltage class, commercial distribution channel, region
Regions Covered
North America, Western Europe, East Asia, South Asia and Pacific, Latin America, Middle East and Africa, Eastern Europe
Countries Covered
China, United States, Germany, India, Japan, Brazil, and 40+ additional markets
Key Companies Profiled
Siemens Energy, Hitachi Energy, ABB, Schneider Electric, GE Vernova, and 15 additional manufacturers
Quantitative Methodology
Primary survey, n=3,800 respondents, Q4 2025, six countries; demand-side model with trade association cross-validation
Qualitative Methodology
47 expert interviews, Q4 2025; applied to validate demand model assumptions, identify emerging dynamics, and assess competitive positioning
Report Format
PDF and XLSX data workbook (Word format preview document)
Publisher
Market Minds Advisory
Report Code
MMA-2026-ENE-120
Published
September 2026
Contact
sales@marketmindsadvisory.com | www.marketmindsadvisory.com

Purchase the full Transmission Substation Market Report (2026 to 2036).

This report delivers a complete assessment of the global transmission substation market, covering sizing, segmentation, regional dynamics, and competitive positioning through 2036. It draws on primary survey data across six countries and expert interviews with industry specialists to quantify demand across every equipment category currently tracked. Analysts examine digital protection certification, cybersecurity hardening, and utility framework agreement dynamics as distinct growth vectors shaping manufacturer strategy. The report equips manufacturers, investors, and utilities with the data needed to prioritize certification and channel investment decisions with genuine confidence.
Ten-year revenue and unit volume forecasts
Seven-region detailed market share and CAGR breakdown
Competitive benchmarking of top 20 manufacturers
Raw material cost exposure and mitigation strategy analysis
Segment-level growth rate and margin projections
Portfolio margin tier and pricing framework

Built For The People Who Decide

From boardroom strategy to bench-side execution, this report is read cover-to-cover by leaders shaping the next decade of their industry, turning demand scenarios, market dynamics and valuation benchmarks into decisions.
CXOs/ Presidents/ VPs/ Managers
M&A and Corporate Development
Strategy Teams and R&D Heads
Procurement and Product Directors
Regulatory and Compliance Leaders
Investor Relations and Equity Analysts