Market Minds Advisory
Transformer Spare Parts Market

Transformer Spare Parts Market: Transformer Spare Parts Market. Aging Grid Infrastructure Sustains Aftermarket Replacement Demand

Decades-old power transformers nearing end of service life are driving spare parts demand across aging grid networks, as utilities extend asset life through component replacement rather than full transformer substitution wherever feasible.

Lead Analyst

Published

October 2026

Make Smarter Decisions with Customized Research Insights

Request a free sample report and evaluate market opportunities, growth trends, and competitive dynamics relevant to your business needs.

2025 MARKET VALUE$4.1BMarket Size 2025
2036 FORECAST VALUE$6.8BBase Case , 2026 to 2036
CAGR 2026 TO 20364.7 %Bull 5.9% / Bear 3.5%
INCREMENTAL OPPORTUNITY$2.5BNet 10- year value creation
EXPANSION MULTIPLE1.58x2036 value over 2026 base
Strategic Levers
M&A Pipeline
Regional Outlook
Country Rankings
Competitive Intelligence
Segmental Deep-dive
Call-Us : 91 93563 13602

Executive Snapshot and Market Trajectory.

Transformer spare parts demand is rising steadily as utilities across aging grid networks extend asset life through component replacement, since full transformer substitution carries lead times now stretching past two years amid constrained global manufacturing capacity across most major suppliers. Lead times remain stretched across most major regions today.
Bushings and insulation components are growing fastest within the category, expanding at nearly seven percent annually as utilities prioritize replacing failure-prone parts that account for a disproportionate share of forced outages relative to their cost. North America and Western Europe anchor demand given the sheer scale of their aging installed transformer base, much of it installed decades ago and now requiring component-level intervention to avoid premature full-unit failure.
Competition splits between original equipment manufacturers offering certified parts carrying warranty continuity and independent aftermarket suppliers competing on price and faster delivery for non-critical components. Grid modernization funding in the United States and expanding renewable integration requirements across the European Union are pulling specifications toward higher-grade insulation materials, while counterfeit component risk increasingly separates trusted suppliers from disqualified ones in utility procurement processes. Warranty continuity concerns are increasingly steering large utilities back toward certified suppliers.
Market Definition
This report covers replacement components for power and distribution transformers, including bushings, cooling systems, tap changers, insulation materials, and gaskets sold as aftermarket or original equipment manufacturer parts. It excludes complete transformer units sold new, transformer oil sold as a standalone commodity, and transformer monitoring software sold independently of physical replacement components.
Base Year Value
$4.1B in 2025 (MMA Primary Research Dataset, October 2026)
Forecast Period
2026 to 2036, eleven discrete annual values
CAGR
4.7% base case. Bull 5.9%. Bear 3.5%.
Fastest Growth Segment
Bushings and Insulation Components: 6.9% CAGR
Fastest Growth Country
India: 6.3% CAGR
Fastest Growth Region
South Asia and Pacific: 6.8% CAGR
Largest Region
North America: 27% of 2025 global value
Market Leaders
Siemens Energy, Hitachi Energy, General Electric, Mitsubishi Electric, TBEA Co. Source: MMA Analysis based on company annual reports.
Primary Survey
n=3,800 procurement and R&D decision-makers, Q4 2025, six countries
Methodology
Demand-side build-up, cross-validated against public data, 47 expert interviews

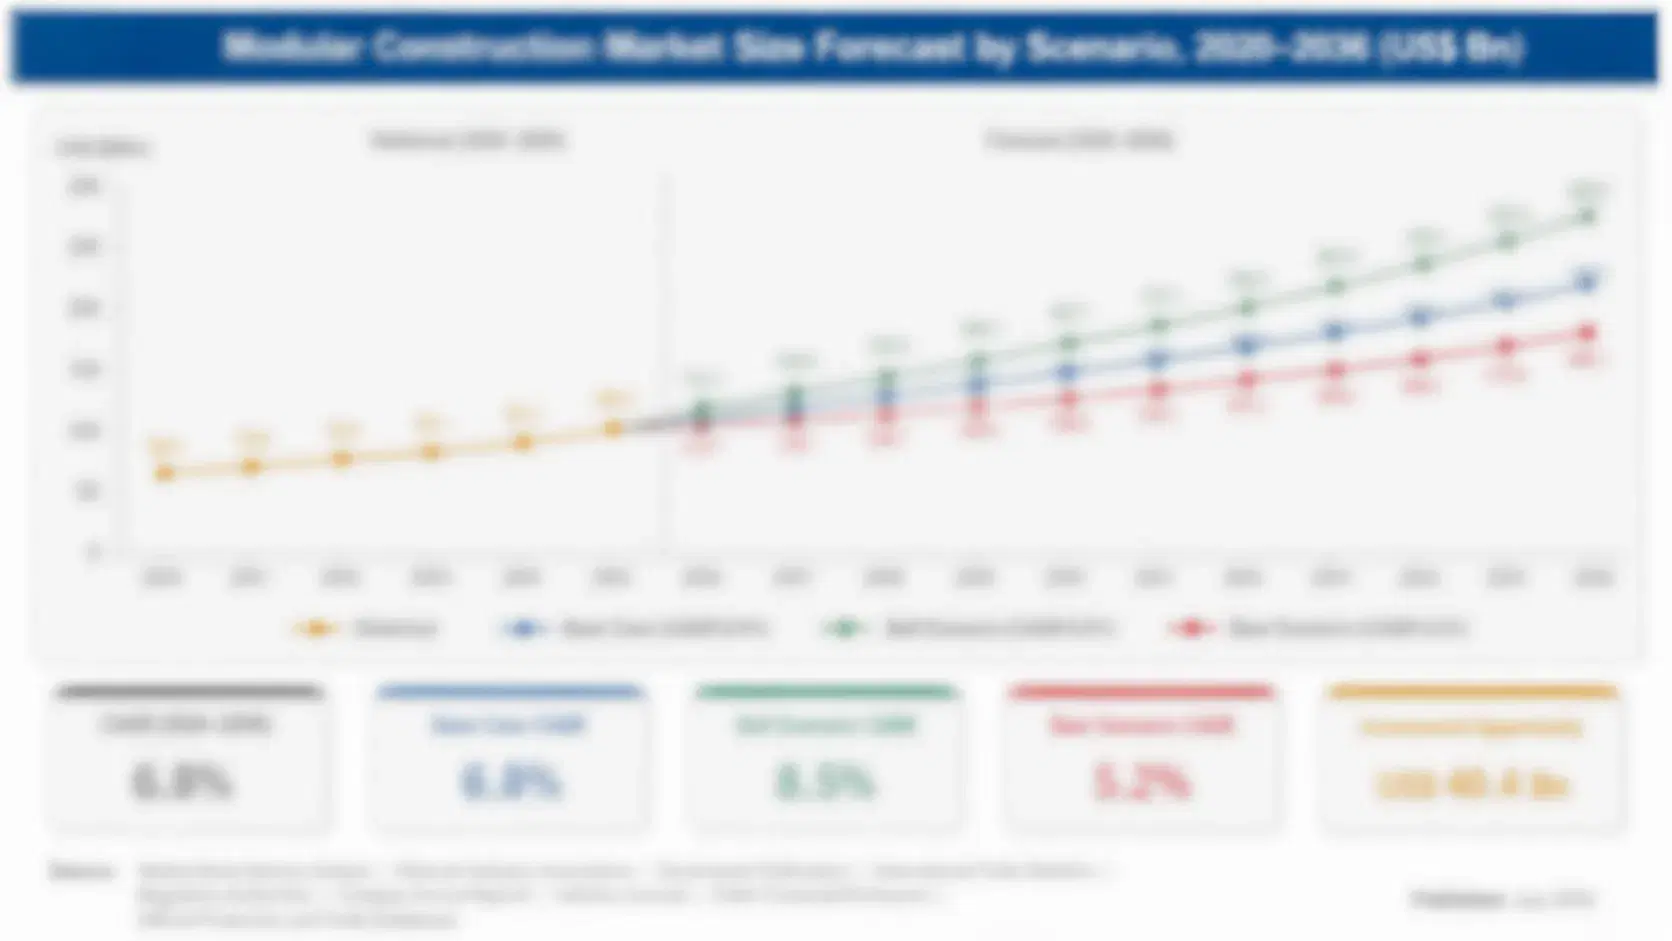
Transformer Spare Parts Market Forecast Scenarios

transformer-spare-parts-market-size-forecast-scenario-1791011606910
Transformer spare parts demand grew steadily across 2020 to 2025 at roughly 3.9 percent annually, supported throughout by aging grid infrastructure that continued requiring maintenance regardless of broader economic conditions affecting other industrial equipment categories. Growth accelerated modestly toward the end of the period as new transformer lead times stretched, pushing more utilities toward life-extension strategies over outright replacement.
The base case assumes 4.7 percent annual growth through 2036, anchored on three concurrent mechanisms: continued aging of installed transformer fleets across mature grid networks in North America and Europe, extended new transformer lead times that push utilities toward component-level life extension, and expanding grid modernization investment tied to renewable integration across multiple major economies. These mechanisms reinforce one another rather than depending on a single regulatory jurisdiction or funding program.
The bull case centers on a sustained new transformer supply shortage that forces even well-funded utilities toward aggressive component replacement programs across their full fleet. The bear case assumes new transformer manufacturing capacity expands faster than expected, easing the lead time pressure that currently favors spare parts over full-unit replacement across most utility procurement decisions.

Extended Lead Times Redirect Utility Procurement

The transformer spare parts market reaches an estimated 4.293 billion dollars in 2026, continuing a steady multi-year expansion driven by aging grid infrastructure and extended new transformer lead times across most major economies. Utility transmission and distribution operators account for the large majority of unit demand, though industrial facilities operating their own substations represent a smaller but steadily growing buyer segment as grid-edge electrification expands.
MARKET CONCENTRATION LEVEL41%Reflects moderate fragmentation between original equipment and aftermarket suppliers
AVERAGE COMPONENT PRICE$12,400Varies substantially between bushings, tap changers, and full cooling assemblies
LEADING SUPPLIER SHARE16%No single vendor dominates despite decades of manufacturer relationships
AGING FLEET SHARE38%Represents installed transformers now requiring component-level intervention across major grids
AVERAGE COMPONENT LEAD TIME9 monthsExtends further for specialized insulation materials from limited suppliers
COUNTERFEIT COMPONENT INCIDENCE6%Reflects growing utility concern driving stricter supplier verification procurement requirements
Average component prices vary substantially across the category, from a few hundred dollars for basic gaskets to tens of thousands for complete cooling system assemblies and specialized tap changers, which fragments the market into distinct procurement tiers rather than one uniform price curve. North America and Western Europe's aging installed base gives these regions outsized influence over unit volume even though East Asia's manufacturing scale increasingly shapes global component pricing and availability.
Looking ahead, suppliers are racing to bundle parts supply with predictive maintenance diagnostics and guaranteed delivery contracts, since margins on standalone components continue compressing under competitive utility procurement pressure. The companies that control the diagnostics and service relationship, not just the initial parts sale, are positioned to capture disproportionate value as utilities extend asset life further through the decade.
"Utilities used to buy a part when something broke. Now they are buying a prediction of what breaks next."
Director, Power Transmission and Grid Infrastructure Practice · MMA Energy Practice · October 2026

Market Trends

Predictive Diagnostics Guide Component Replacement Timing

Utilities are increasingly deploying sensor-based diagnostic systems that monitor transformer health continuously, flagging specific failing components before they cause a forced outage rather than discovering degradation during periodic manual inspection cycles that occur only a few times annually. Vendors able to bundle diagnostics with guaranteed parts delivery are winning larger fleet-wide service contracts, since transmission operators increasingly require data-driven justification before approving capital spending on component replacement across their aging transformer fleet. Several large utilities now mandate this capability in new service contracts. Field technicians report fewer emergency callouts as a result.
Market Impact: Adds 15,000 aging units
Counterfeit Component Risk Reshapes Supplier Verification

Utilities are tightening supplier verification procedures after several documented incidents of counterfeit bushings and insulation materials entering the aftermarket supply chain through unauthorized distributors, creating safety and reliability risk that regulators are increasingly scrutinizing. This has consolidated procurement toward a shorter list of verified suppliers even in markets where dozens of aftermarket vendors technically compete on price, since utility risk management teams screen out unverified suppliers automatically regardless of quoted delivery speed. Regulators are increasingly requiring documented chain-of-custody records for critical components. Third-party authentication services have emerged to serve this need.
Market Impact: Adds 1.5 billion in demand

Market Opportunities and Growth Drivers

Aging Transformer Fleet Requires Component-Level Intervention

A substantial share of installed power transformers across North America and Western Europe now exceed thirty years of service, pushing utilities toward aggressive component replacement programs that extend asset life without the capital expense and multi-year lead time of full unit replacement. Each additional year of deferred full-unit replacement increases component-level maintenance spending, since aging insulation and bushings fail at accelerating rates once a transformer passes its originally designed service life threshold across most utility fleets. Many utilities now track component failure rates by transformer age cohort. Budget planning now extends further into future fiscal years.
Market Impact: Delays repairs 3 to 5 months

Extended New Transformer Lead Times Push Component Demand

New power transformer lead times have stretched past two years at several major manufacturers, forcing utilities facing imminent failure risk to pursue component-level repair as the only viable near-term option regardless of long-term cost comparison against full replacement. This dynamic has persisted longer than most utilities initially expected, pushing spare parts budgets higher as capital projects originally planned around new transformer delivery timelines face repeated schedule slippage across the broader procurement pipeline. Some utilities have begun stockpiling critical spares years ahead of anticipated need. Manufacturers are prioritizing their largest, longest-standing utility accounts first.
Market Impact: Adds 4 to 8 weeks

Market Restraints and Challenges

Specialized Component Lead Times Still Extend Repairs

While spare parts generally ship faster than complete transformers, highly specialized components such as custom tap changers and large cooling assemblies still carry lead times stretching several months, delaying repairs at exactly the moment utilities most need rapid turnaround to avoid extended outages. The root cause is that specialized component manufacturing capacity expanded more slowly than demand during the recent surge, since manufacturers hesitated to invest in capacity for products with historically lumpy order patterns. Suppliers are responding by pre-building inventory of the most commonly needed specialized parts. Pre-building inventory ties up working capital that smaller suppliers lack.
Market Impact: Cuts outages 20 percent

Compatibility Risk Complicates Cross-Brand Component Sourcing

Transformers manufactured decades ago by companies that have since merged, been acquired, or exited the market entirely create compatibility challenges when utilities seek replacement components, since original engineering specifications are not always preserved or accessible to current manufacturers. This often forces costly custom fabrication rather than standard part ordering, extending repair timelines well beyond typical expectations. Suppliers are addressing this through reverse-engineering programs that recreate legacy specifications for components no longer documented by any current manufacturer. This gap particularly affects transformers from manufacturers that exited decades ago. Documentation archives from defunct manufacturers have become valuable assets.
Market Impact: Excludes 30 percent of vendors
3 additional market trends, 4 additional growth drivers, and 4 additional restraints and challenges are covered in the full report. Contact sales@marketmindsadvisory.com to access the complete intelligence.

Segment CAGR and Growth Architecture

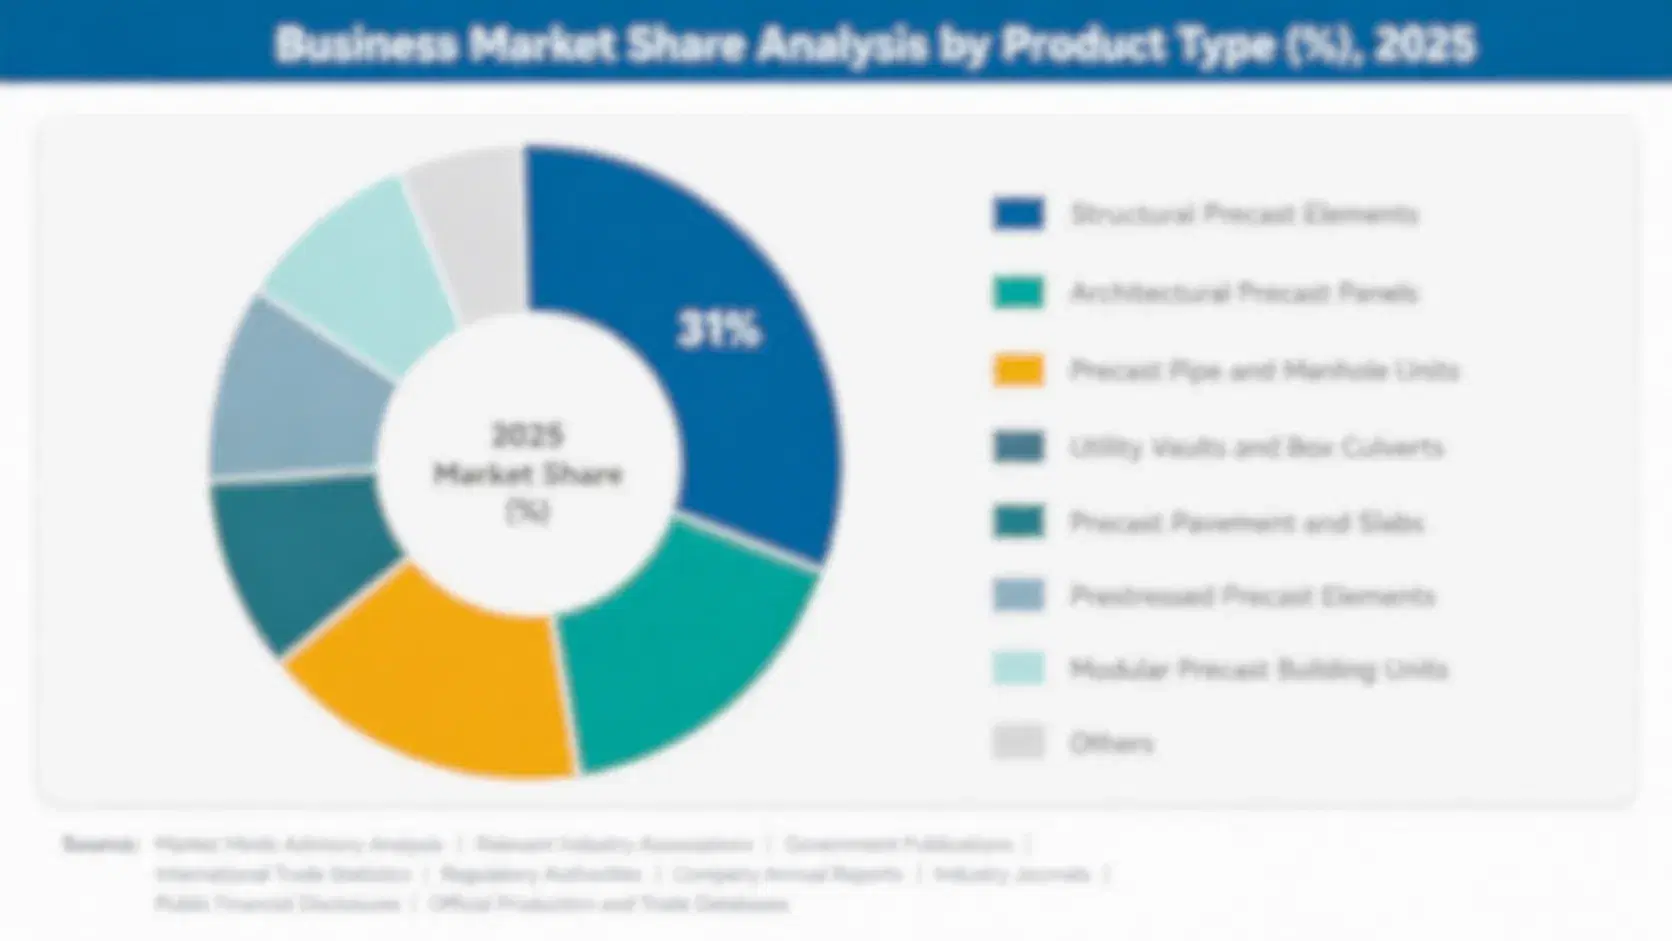
Transformer spare parts segment by component type rather than application, since the same bushing, tap changer, cooling system, or insulation component applies whether the transformer sits at a generation substation, a transmission node, or a distribution facility serving end customers directly. Regional sourcing patterns and material science advances shape how each component category evolves over time.
transformer-spare-parts-market-market-share-analysis-1791011607199

Bushings and Insulation Components

Bushings and insulation components fail more frequently than other transformer parts, since they bear direct electrical stress and environmental exposure continuously throughout the unit's service life, making them the single largest driver of forced outage events across aging fleets. This segment is growing at nearly seven percent annually, roughly 1.5 times the overall market rate, as utilities prioritize replacing these specific high-failure-rate components ahead of less critical parts when capital budgets are constrained. Demand concentrates heavily among utilities operating transformers installed before modern insulation materials became standard, creating a multi-year replacement opportunity as these units continue aging across major grid networks worldwide. Replacement timing increasingly follows diagnostic data rather than fixed maintenance schedules.
CAGR 6.9%

Cooling System Components

Cooling system components, including radiators, fans, and pumps, keep transformers operating within safe temperature ranges, and their failure risks accelerated insulation degradation that shortens overall unit life if not addressed promptly. This segment is growing at 5.8 percent annually, the second-fastest in the category, as rising ambient temperatures and growing load demands push more transformers toward their thermal design limits. Demand concentrates among utilities in warmer climates and those serving data center and industrial customers with high, sustained load profiles that stress cooling systems more intensively than typical residential distribution patterns. Suppliers are expanding capacity specifically for these higher-growth cooling applications. Average component pricing in this category has also risen steadily.
CAGR 5.8%
Full segment breakdown across 7 segments available in the complete report.

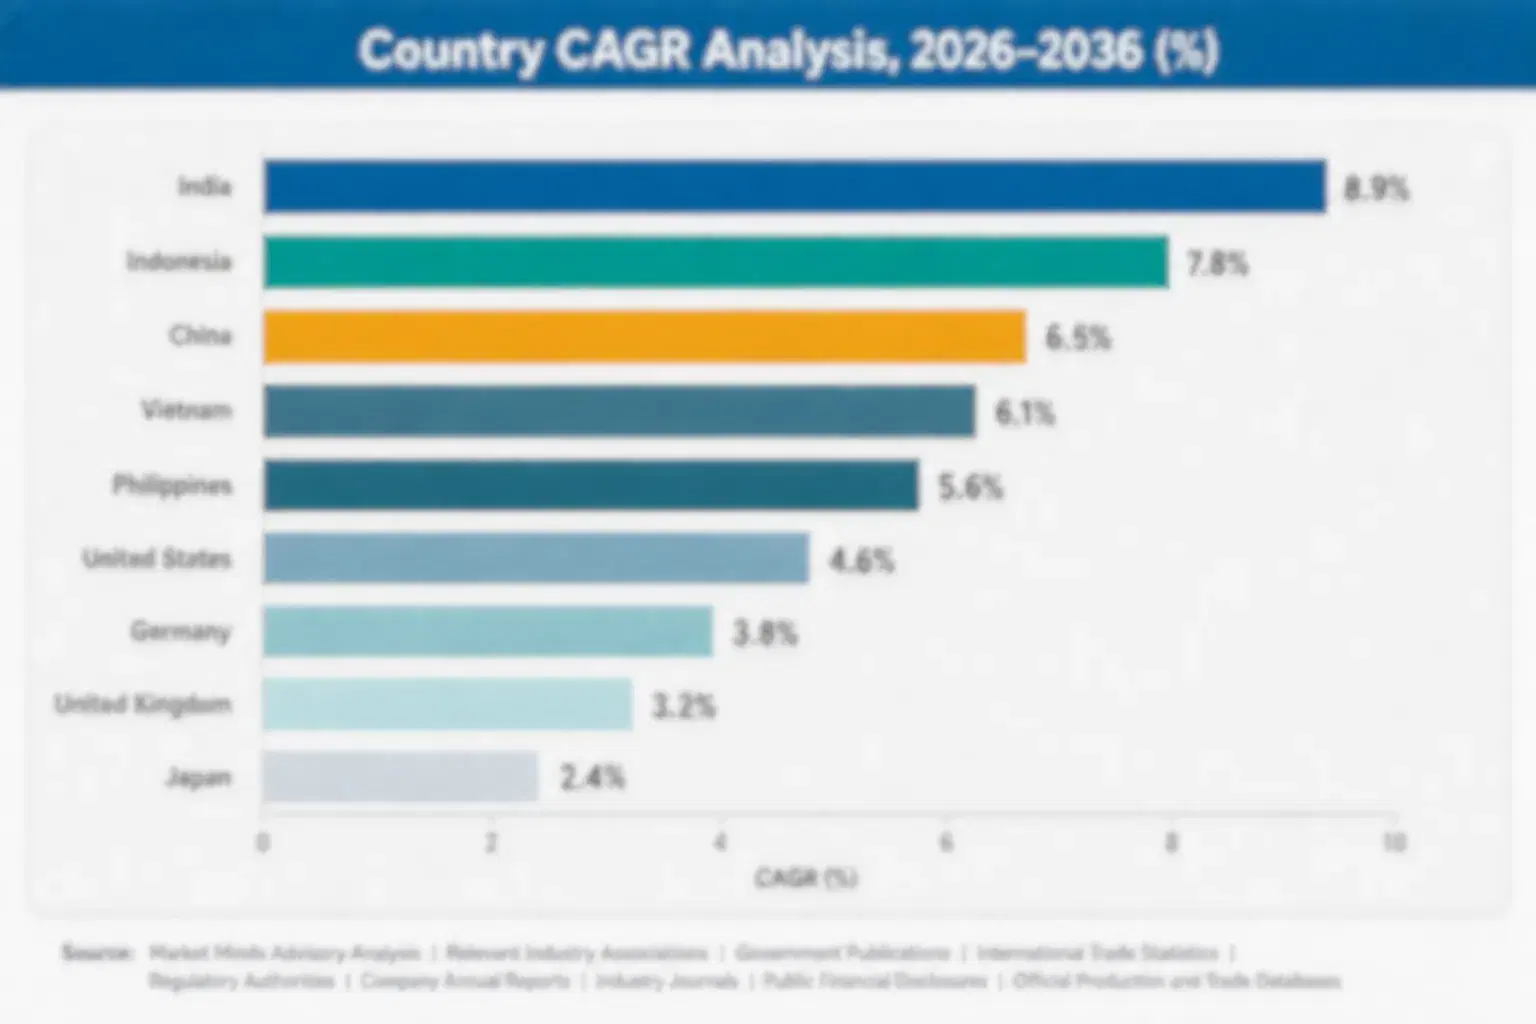
Regional Architecture and Country Demand Map

North America and Western Europe lead on sheer aging transformer fleet scale, both installed decades ago and now requiring sustained component intervention. South Asia and Pacific posts the fastest growth as India expanding grid network reaches its first major maintenance cycle. Grid age distribution continues shaping utility procurement priorities worldwide.

North America

The United States operates one of the world's oldest transformer fleets, with a substantial share installed before 1990 and now requiring sustained component-level intervention to avoid premature full-unit failure. Grid modernization funding tied to renewable integration is accelerating replacement at facilities connecting new solar and wind generation capacity to the existing transmission network. Canada's hydroelectric-heavy grid contributes a smaller but steady complementary demand pool, particularly for cooling system components suited to its distinct climate and load profile. Multi-year framework agreements with major utilities are becoming the dominant procurement model. Several major investor-owned utilities have formalized decade-long sourcing commitments with preferred vendors. These commitments provide suppliers with multi-year production planning visibility.
Share: 27% | CAGR: 5.4% (2026 to 2036)

Western Europe

Germany, France, and the United Kingdom anchor regional demand through mature grid infrastructure installed across multiple decades, much of it now approaching or exceeding typical service life thresholds requiring intervention. Renewable integration across the bloc is adding new stress on existing transformers as intermittent generation patterns differ substantially from the steady industrial load profiles these units were originally designed around decades earlier. Nordic countries contribute a smaller but technically sophisticated demand pool, favoring premium components suited to extreme cold weather operating conditions. Equipment certified under one national grid code typically satisfies requirements across the bloc. Offshore wind interconnection projects are adding a distinct new category of transformer stress. Suppliers are developing specialized offshore-rated components to address this demand.
Share: 23% | CAGR: 3.3% (2026 to 2036)
Regional intelligence for 5 additional markets available in the complete report: East Asia, South Asia and Pacific, Latin America, Middle East and Africa, Eastern Europe. Contact sales@marketmindsadvisory.com.
transformer-spare-parts-market-country-cagr-analysis-1791011607491

Monetizing the Predictive Maintenance Relationship

Component margins continue compressing as aftermarket competition intensifies, pushing original equipment manufacturers toward recurring revenue tied to predictive diagnostics subscriptions, guaranteed delivery contracts, and supplier verification services that protect margin more durably than standalone parts sales alone. The levers below concentrate where recurring revenue holds up best over time. Suppliers investing early in these capabilities are building durable differentiation.

Predictive Diagnostics and Component Monitoring Subscriptions

Manufacturers bundling sensor-based diagnostic subscriptions alongside component sales capture recurring revenue that smooths the lumpiness of one-time parts purchases tied to failure events, since utilities increasingly value early warning over reactive replacement. This locks utilities into the manufacturer's own diagnostics platform rather than third-party monitoring providers, since original equipment manufacturers carry component design knowledge that independent monitoring firms struggle to match. These subscriptions carry margins roughly 25 to 32 percentage points above standalone component sales and typically renew automatically each fleet cycle. Smaller independent aftermarket vendors rarely match this design-level diagnostic depth.
Market Impact: Adds 25 to 32 percentage points of margin

Guaranteed Delivery and Priority Fulfillment Contracts

Utilities facing extended lead times increasingly pay premium pricing for guaranteed delivery contracts that lock in priority fulfillment for critical spare parts, turning what was once a transactional purchase into an ongoing capacity reservation relationship with predictable renewal economics. Manufacturers offering this structure report contract renewal rates above 71 percent among utilities managing large aging fleets, since guaranteed delivery meaningfully reduces forced outage risk relative to spot-market purchasing during emergencies. The relationship also gives manufacturers forward demand visibility that improves production planning accuracy. Early adopters are locking in multi-year capacity reservations now.
Market Impact: Reaches above 71 percent contract renewal rate yearly

Who Controls the Margin Pool

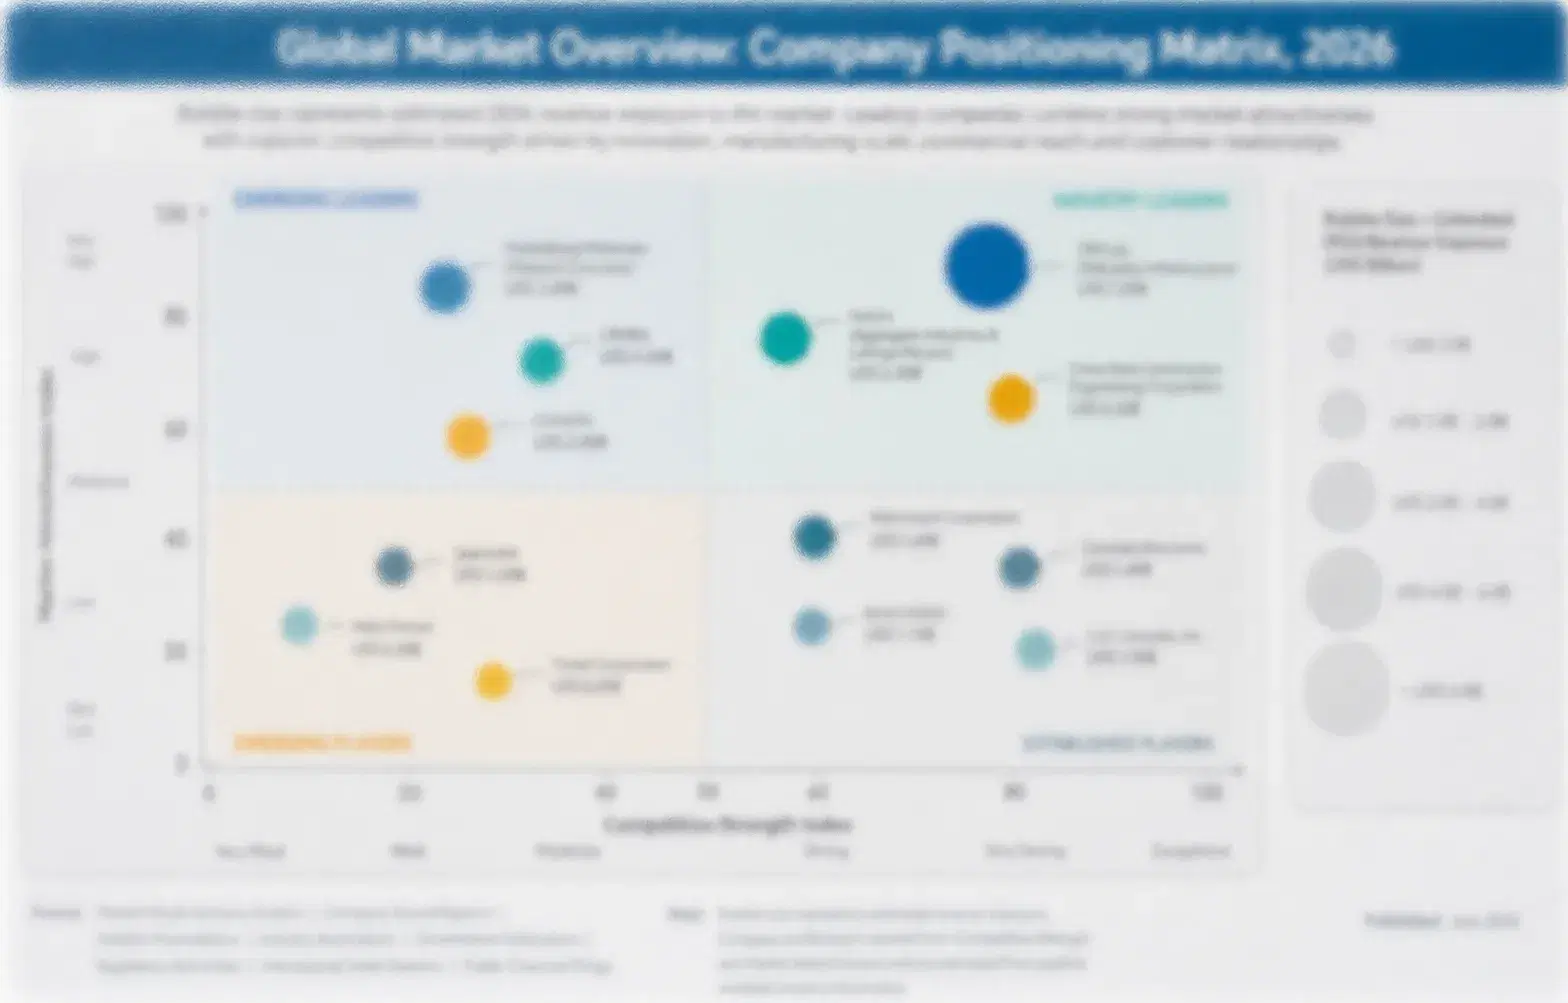
Concentration in transformer spare parts sits at 41 percent across the top five suppliers on a global revenue basis, leaving substantial room for regional aftermarket specialists alongside the diversified power equipment makers that lead the category. Siemens Energy and Hitachi Energy hold the broadest original equipment manufacturer parts catalogs, while General Electric leans on its wide installed base of legacy units requiring compatible replacement components. The gap between the leading tier and independent aftermarket challengers remains substantial.
Current activity centers on supplier verification and diagnostics integration rather than basic part availability, which has become table stakes across established manufacturers. Vendors increasingly bundle predictive monitoring subscriptions and guaranteed delivery contracts into the initial sale, since the service relationship now generates a larger share of lifetime customer value than the original component purchase across most utility accounts.

Pressure is building from independent aftermarket suppliers expanding capacity and competing aggressively on price and delivery speed for non-critical components, though safety-critical parts still favor original equipment manufacturers with design-level knowledge. Chinese manufacturers are also expanding export capacity, increasingly competing for international component supply contracts, suggesting rankings among the second tier shift within the forecast window.
transformer-spare-parts-market-company-positioning-matrix-1791011607768

Competitive Moat and Risk Dimensions

SIEMENS ENERGY

Moat: Original Design Knowledge Depth

Siemens Energy's position rests on deep design-level knowledge of its own installed transformer base, letting it supply exactly compatible replacement components that independent aftermarket vendors often cannot replicate without reverse-engineering original specifications. This knowledge advantage is difficult for competitors to replicate quickly or affordably. Few competitors hold comparable depth.
SIEMENS ENERGY

Risk: Premium Pricing Invites Substitution

Siemens Energy's premium component pricing creates an opening for independent aftermarket suppliers offering compatible parts at lower cost, particularly for non-critical components where utilities face less safety concern about sourcing outside the original equipment manufacturer relationship. Utilities under budget pressure increasingly explore these lower-cost alternatives for routine maintenance.
HITACHI ENERGY

Moat: Global Service Network Scale

Hitachi Energy uses its extensive global service network and field technician presence to offer rapid component delivery and installation support that smaller regional competitors cannot match across multiple continents simultaneously, particularly during emergency outage situations requiring urgent response. This responsiveness is particularly valued by utilities managing geographically dispersed transmission assets.
HITACHI ENERGY

Risk: Legacy Unit Support Costs Rising

Supporting an aging, diverse installed base across decades of acquired product lines creates rising support costs for components no longer in active production, requiring costly small-batch manufacturing runs that erode margins relative to standardized current-generation parts. Margins on these legacy support lines trail those on current-generation component sales.

Players Tracked

Prominent Players

Siemens Energy
Hitachi Energy
General Electric
Mitsubishi Electric
TBEA Co

Other Key Players

Schneider Electric
Toshiba Energy Systems
Weg SA
CG Power and Industrial Solutions
Hyundai Electric
Bharat Heavy Electricals
Hyosung Heavy Industries
SPX Transformer Solutions
Virginia Transformer Corporation
ERMCO
Wilson Power Solutions
Delta Star Inc
Hammond Power Solutions
Cotran Corporation
Niagara Transformer

Recent Developments

JUNE 2025

Siemens Energy completed an organic capacity expansion at its bushing manufacturing facility, adding dedicated production lines for high-voltage insulation components, responding to sustained order growth from utilities accelerating aging fleet component replacement programs across North America. The expansion addresses backlog that had grown over several previous quarters.
Signal: Signals confidence that bushing replacement demand will keep expanding faster than full-unit cycles. Peers may follow suit.
DECEMBER 2025

Hitachi Energy signed a multi-year supply agreement with a major Indian state transmission utility to guarantee priority component delivery across its expanding substation network, supporting the utility's aging grid replacement program amid extended new transformer lead times. Terms were not fully disclosed to the public.
Signal: Shows Indian utilities securing guaranteed supply well ahead of anticipated fleet aging pressures across the region.

Electrical Steel and Copper Component Costs

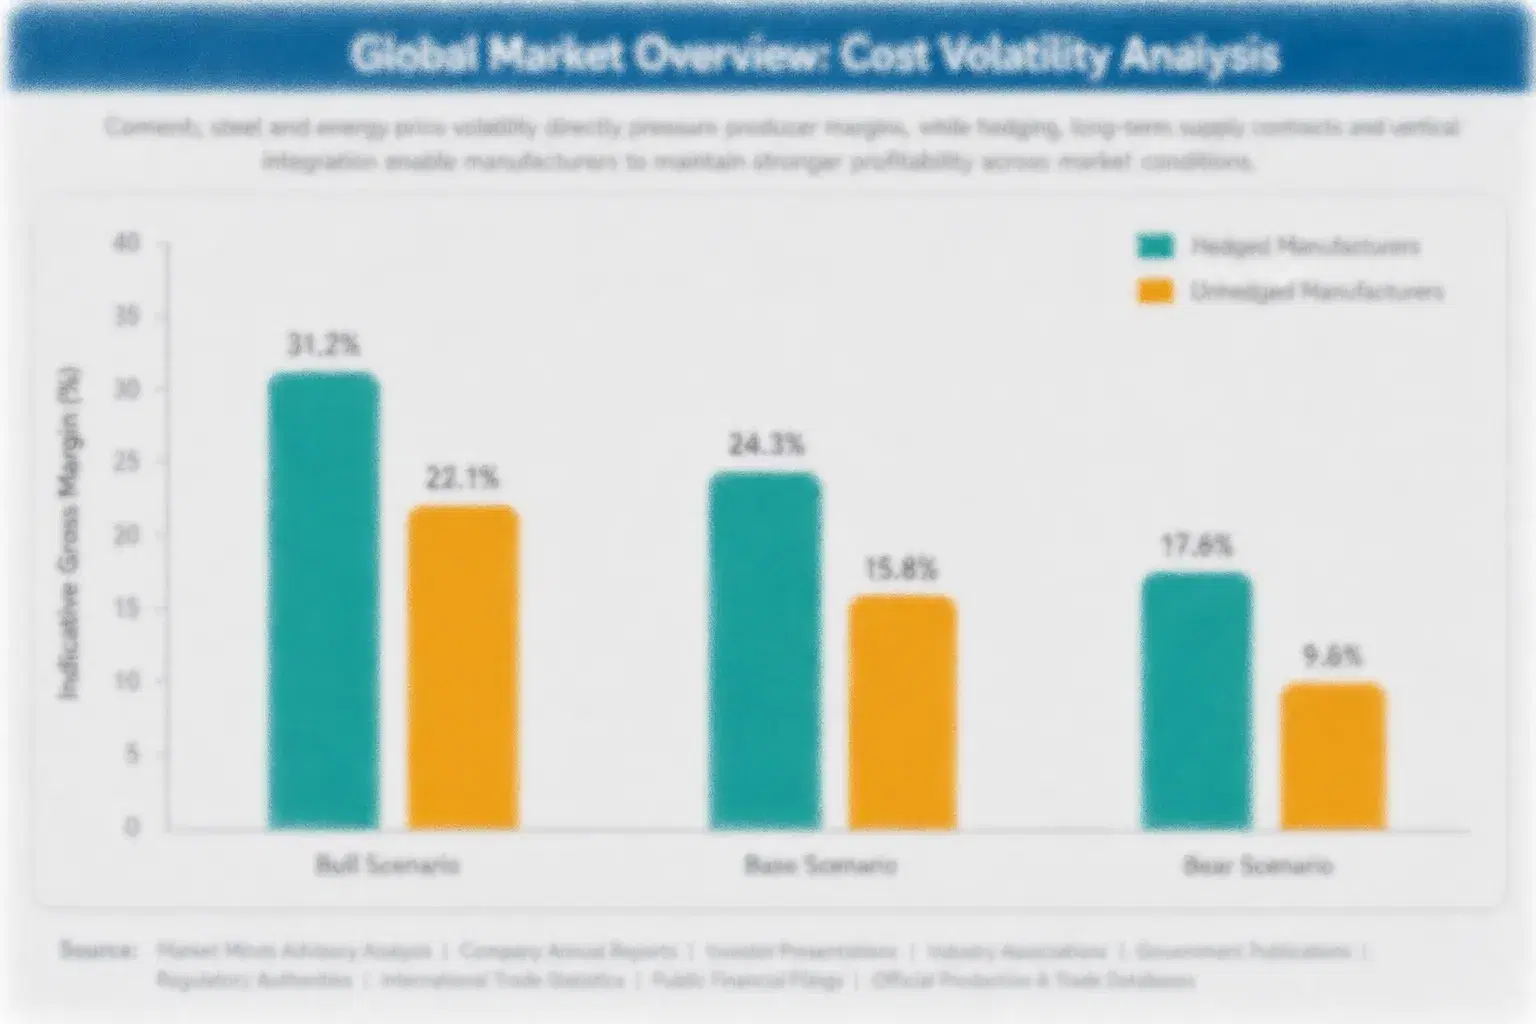
Electrical steel used in transformer cores and copper windings used in replacement coils represent roughly 26 to 32 percent of cost of goods sold for major component lines, while porcelain and composite insulation materials add another 10 to 14 percent. Electrical steel supply concentrates heavily in Japan, South Korea, and China, while copper sourcing spans global mining markets, leaving distinct exposure profiles across the two input categories.
Copper prices surged sharply across 2024 and into 2025 as global electrification demand, including transformer manufacturing itself, outpaced new mine supply growth across major producing countries. The IEA's 2023 critical minerals review noted that downstream component manufacturers faced sustained margin pressure during copper price spikes, since most replacement component contracts are priced months in advance of actual production, leaving manufacturers exposed to price movements between contract signing and delivery.

Smaller aftermarket suppliers without long-term copper hedging programs carried disproportionate exposure during this period, often absorbing cost increases that larger original equipment manufacturers passed through more readily given their stronger customer relationships. Siemens Energy and Hitachi Energy negotiate annual volume agreements directly with metal suppliers that smooth exposure across cycles, giving them a durable cost advantage that compounds over successive volatility episodes.
transformer-spare-parts-market-cost-volatility-analysis-1791011608062

Multi-Year Copper and Steel Supply Agreements

Locking in copper and electrical steel volumes through multi-year supply agreements with price collars shields manufacturers from spot market volatility and lets them quote stable component pricing to utility customers even during broader metal price disruptions affecting the wider electrical equipment industry. Priority allocation also shortens replacement lead times during emergency unit failures. This also reduces warranty exposure.

Aluminum Winding Substitution for Select Components

Several manufacturers are qualifying aluminum winding alternatives for non-critical replacement coils, reducing exposure to copper price volatility while preserving the electrical performance specifications required for standard utility certification across most regulatory jurisdictions and grid codes. Qualification testing typically spans twelve to eighteen months before full production rollout. Vendors view this as a long-term resilience investment worth pursuing.

Portfolio Architecture for Margin Defence

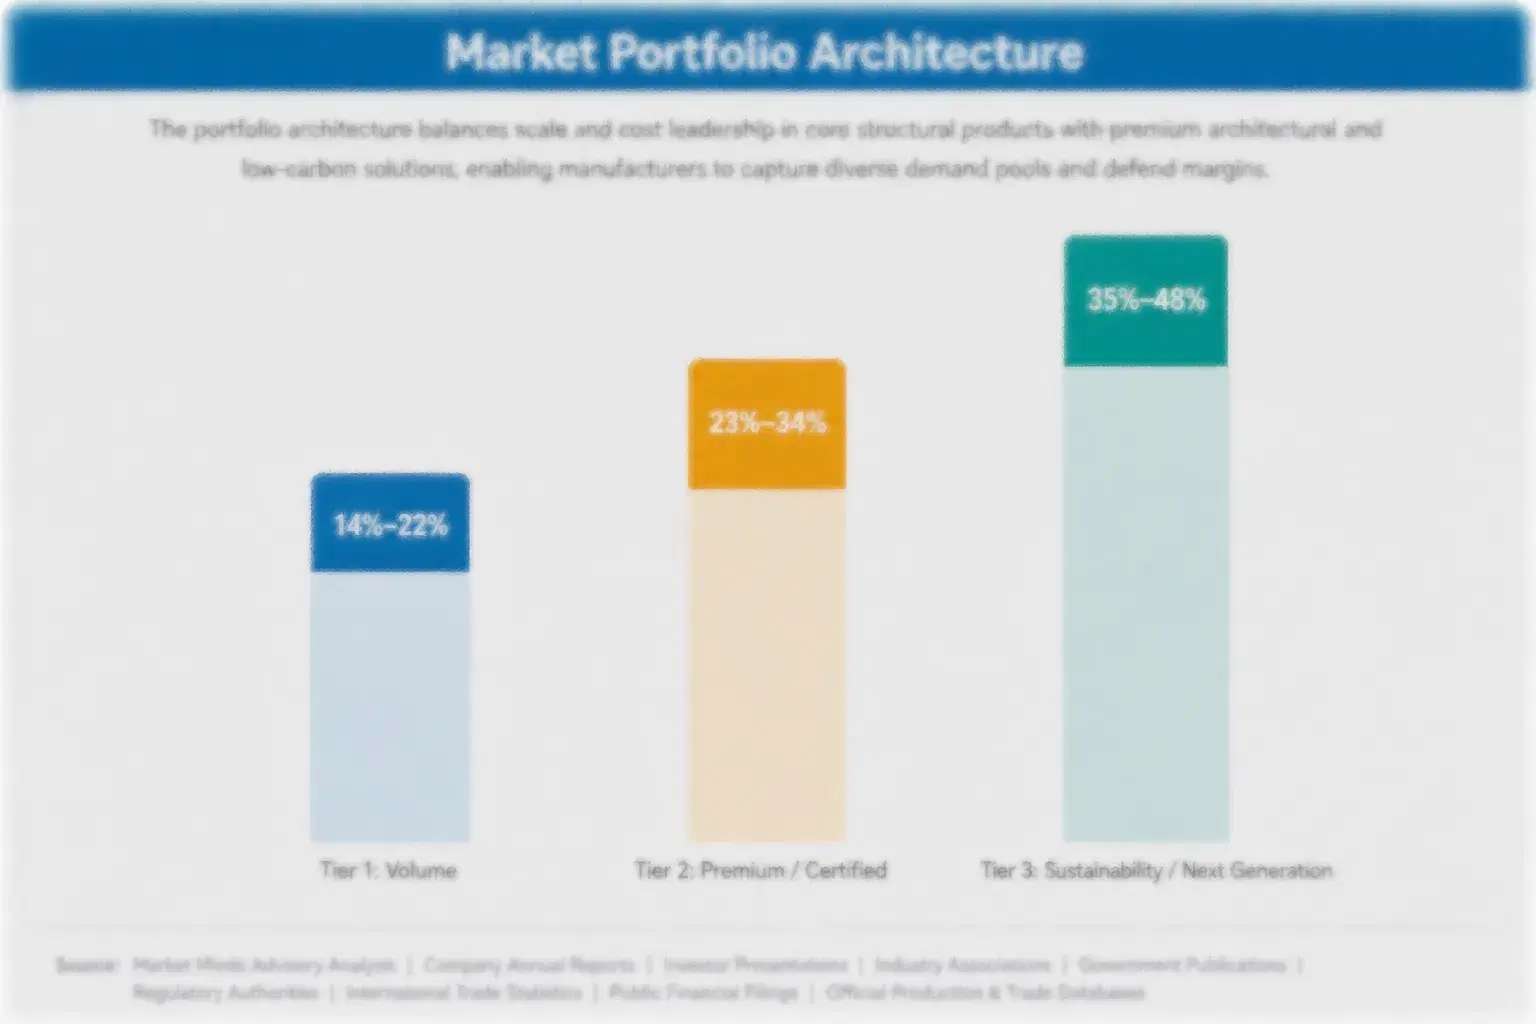
Portfolio economics in transformer spare parts split across three tiers, with gross margins ranging from the low twenties on basic gaskets and standard hardware to the high thirties on certified bushings and diagnostics-integrated components sold directly by original equipment manufacturers. The spread between tiers has widened over the past several years as commodity hardware pricing compresses while premium certified component pricing holds firm on design-knowledge barriers.
Volume concentrates in basic hardware and gasket categories by unit count, but value concentrates disproportionately in bushings, insulation, and the diagnostics subscriptions attached to premium components, creating the familiar tension where manufacturers must sustain hardware-tier scale to cover fixed costs while channeling investment toward the higher-margin tiers that actually drive profit growth across the business. This divide has become more pronounced with each successive fleet replacement cycle.

High-value pools concentrate specifically around large utilities managing aging fleets who value guaranteed delivery and diagnostics integration over unit price alone. Manufacturers positioned to serve these accounts capture disproportionate profitability relative to unit volume, while pure aftermarket hardware sellers compete almost entirely on price and face the thinnest margins anywhere across the category. The gap between these two groups continues widening rather than narrowing over time.

Standard gaskets, basic hardware, and non-critical fasteners sold at high volume across most utility procurement channels, competing primarily on unit price with minimal differentiation between suppliers. Replacement typically follows scheduled maintenance rather than emergency failure events.
Gross Margin

Bushings, tap changers, and insulation components carrying original equipment manufacturer certification, commanding premium pricing on design compatibility and guaranteed delivery contracts bundled into the purchase. Buyers increasingly expect diagnostics integration as a baseline requirement now.
Gross Margin

Diagnostics-integrated components with embedded sensor monitoring supporting grid resilience and renewable integration requirements, creating durable pricing power through data-platform lock-in and subscription attachment. Few competitors can match this combination without years of platform investment.
Gross Margin
transformer-spare-parts-market-portfolio-architecture-1791011608371

High-value Sub-segments and Strategic Watch-out

Sensor-Integrated Diagnostic Components

Components with embedded diagnostic sensors combine premium pricing with the category's fastest adoption curve among utilities managing large aging fleets, positioning this segment as the clearest profit expansion opportunity through 2036 for manufacturers with existing sensor integration capability. Early movers are locking in multi-year diagnostics platform contracts now.

Aging Fleet Replacement Component Demand

Replacement demand tied to aging transformer fleets carries strong margins and steady, demographically driven purchasing cycles, though volume growth stays moderate since fleet aging progresses gradually rather than arriving in sudden waves across utility service territories. Fleet age data gives manufacturers unusually reliable demand forecasting visibility.

Standard Hardware and Gasket Equipment

The largest unit volume pool by count, carrying the thinnest margins and facing continuous price pressure from independent aftermarket producers, this segment remains essential for absorbing fixed manufacturing overhead even as its profit contribution keeps shrinking steadily. Few manufacturers exit this tier without losing meaningful production scale.

New Transformer Supply Normalization Risk

Continued new transformer manufacturing capacity expansion threatens to ease the lead time pressure that currently favors spare parts demand, requiring component-focused manufacturers to monitor this substitution dynamic closely and diversify toward diagnostics revenue earlier. Capital reallocation decisions made now will shape future competitive positioning. Capital flows accordingly.

Fleet Age Drives Recurring Replacement

Demand in transformer spare parts behaves like an annuity tied to fleet age distribution rather than discretionary capital spending, since utilities must maintain functioning transformers for the full multi-decade service life of the grid asset regardless of broader economic conditions. Aging fleet demographics and extended new transformer lead times generate recurring replacement revenue that persists across economic cycles affecting other utility capital categories.
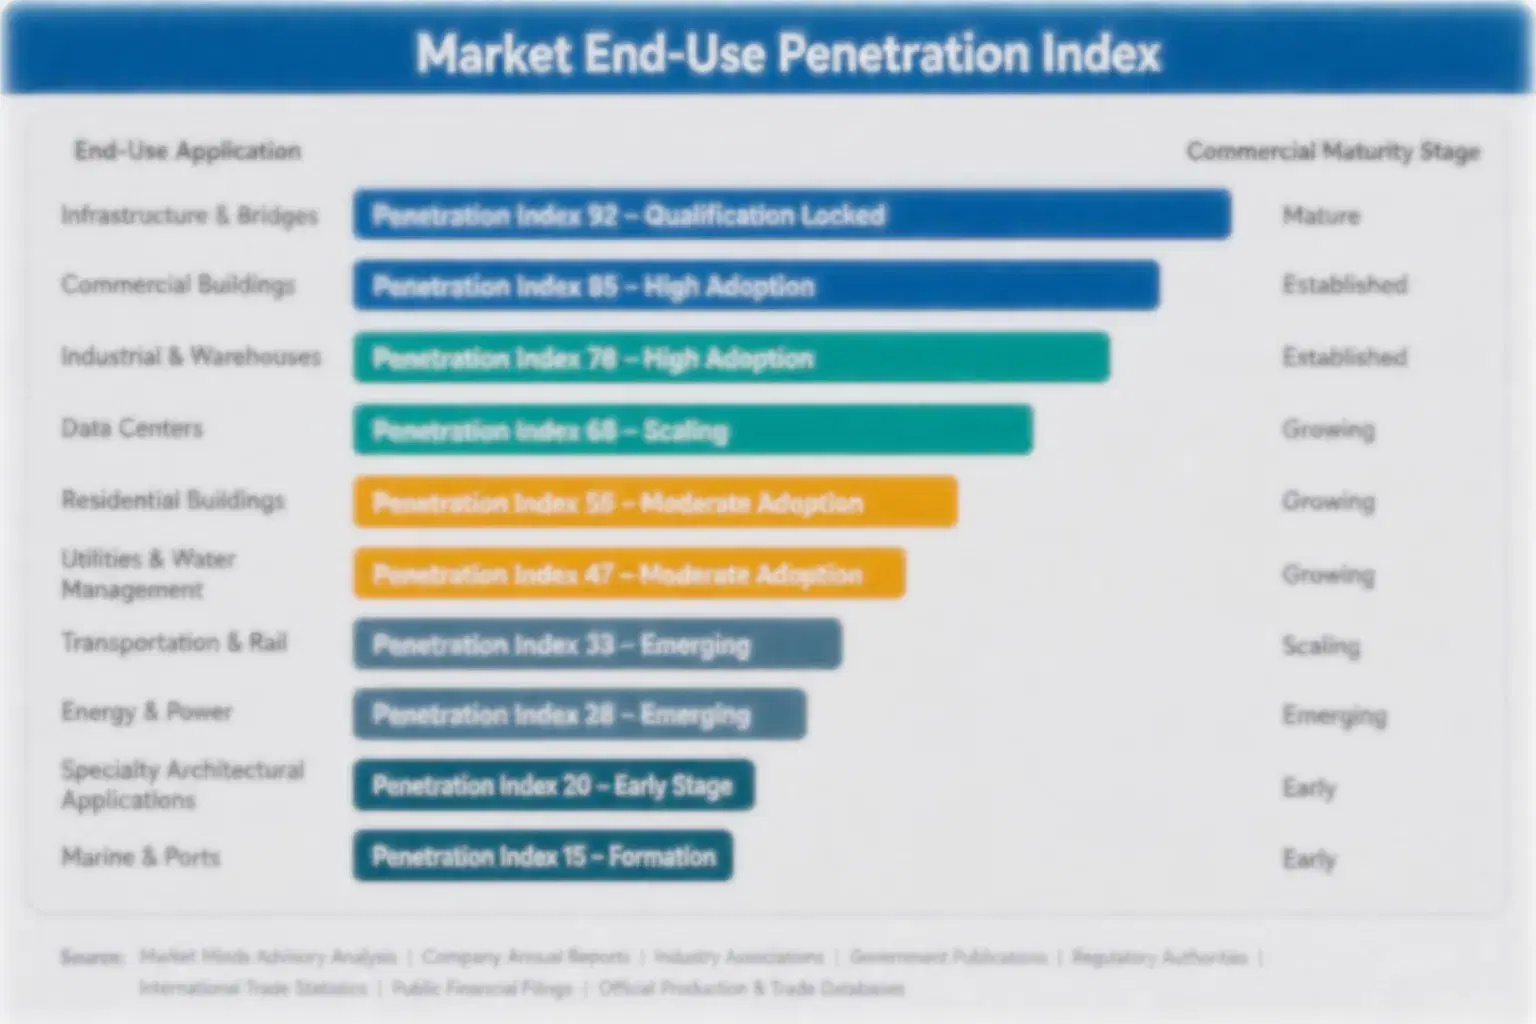
Adoption stickiness and depth vary sharply by end-use vertical. Large transmission utilities retain original equipment manufacturer relationships deeply once established, since component compatibility and warranty continuity carry genuine safety and liability implications that discourage switching suppliers casually. Smaller distribution utilities show shallower stickiness, often selecting aftermarket suppliers based on price and delivery speed rather than deep technical preference, while industrial substation operators sit between these extremes.

Buyer profiles are shifting generationally as utility procurement consolidates from individual substation engineers toward centralized asset management teams overseeing fleet-wide replacement planning across entire service territories. This favors manufacturers offering standardized diagnostics platforms and guaranteed delivery contracts over smaller specialists who once won business through direct relationships with individual substation engineers. Regional asset managers now negotiate framework contracts covering multiple substations simultaneously.
transformer-spare-parts-market-end-use-penetration-index-1791011608651

Where to Commit Capital Next

These are among the four positions where our research anticipates prominent divergence between winners and laggards over the coming forecast period. Each is grounded in the demand model, the regulatory perimeter, and the announced capacity pipeline.
01 / BUSHING MANUFACTURING CAPACITY

Expand bushing production ahead of aging fleet replacement wave

Bushings and insulation components are growing at nearly seven percent annually, well above the category average, driven by their outsized share of forced outage events across aging transformer fleets in North America and Western Europe. Manufacturers that expand qualified bushing capacity now, before the replacement wave peaks, will capture durable share before independent aftermarket competitors close the remaining design-knowledge gap. Waiting risks ceding the fastest-growing segment to better-positioned incumbents with longer manufacturing lead times already secured, and gain preferred positioning for the next multi-year replacement cycle.
02 / DIAGNOSTICS SUBSCRIPTION BUILDOUT

Build dedicated predictive monitoring service capability

Predictive diagnostics and guaranteed delivery contracts reward manufacturers who demonstrate certified component compatibility, commanding margins well above standard parts sales across the broader category and across most utility account relationships. Building dedicated diagnostics capability turns a declining-margin hardware category into a durable, high-margin recurring revenue stream that independent aftermarket competitors struggle to replicate without comparable design knowledge. Manufacturers without this capability today are already losing large fleet accounts to better-equipped specialists, with early contracts establishing the performance baseline for future renewals.
03 / REGIONAL MARKET POSITIONING

Prioritize South Asia and Pacific ahead of saturation

South Asia and Pacific posts the fastest regional CAGR in the category, driven by India's rapidly aging grid network reaching its first major maintenance cycle across many regions simultaneously. Manufacturers establishing distribution and service infrastructure now, well ahead of broader market awareness, will capture disproportionate share before competitors recognize the full scale of the opportunity. Entering after the maintenance wave peaks means competing against already-entrenched early movers on distinctly worse commercial terms, since first-mover service networks become difficult to displace.
04 / SUPPLIER VERIFICATION INVESTMENT

Prioritize certification depth over price competition alone

Margin data shows certified premium and diagnostics-integrated components carry margins roughly double commodity hardware, and that gap has widened rather than closed over the past several years of pricing observation across the category. Manufacturers chasing unit cost reduction in commodity tiers compete directly against persistently lower-cost aftermarket producers on their single worst competitive terms available anywhere in the category. Investing instead in broader supplier verification protects margin and builds switching costs around certified compatibility that lower-cost rivals cannot easily replicate.

Engagement Snapshot From the Field

A live engagement with an industry participant carrying material or product regulatory and market exposure ahead of a defining policy shift, showing how our research translates into a defensible multi-year portfolio strategy.
MARKET MINDS ADVISORY · CLIENT ENGAGEMENT SUMMARY
Transformer Spare Parts Producer Strategic Portfolio Review and Transition Roadmap 2026·Investment Scenario on Transformer Spare Parts Exposure Evaluation 2025-26
CLIENT PROFILE
A regional transmission utility operating a transformer fleet averaging thirty-four years of age approached MMA to assess whether an accelerated component replacement program could defer costly full-unit replacement across its aging substation network while new transformer lead times remained extended. MMA was engaged directly by the utility's asset management division. The utility serves several million customers across its territory.
STRATEGIC CHALLENGE
The utility faced a growing backlog of transformers approaching end of service life, with new unit lead times stretching past two years and insufficient capital budget to replace every aging unit simultaneously. Asset managers lacked a data-driven framework for prioritizing which units needed component intervention versus full replacement first. Delaying decisions further risked unplanned emergency outages.
MMA APPROACH
MMA conducted a fleet-wide risk assessment ranking each transformer by failure probability, component availability, and replacement cost, combining sensor diagnostic data with historical failure records across the full installed base. The engagement produced a prioritized multi-year capital allocation plan balancing component replacement against new unit procurement for the highest-risk assets.
KEY FINDINGS
  1. Twenty-two of the utility's transformers showed elevated failure risk indicators but could be safely life-extended through targeted bushing and insulation replacement. This approach preserved capital for the most urgent cases.
  2. Only eight units required full replacement within the next three years, freeing an estimated 40 million dollars (client-reported, unverified by MMA) for component programs instead.
  3. Three transformers from a now-defunct manufacturer required reverse-engineered components, adding approximately four months to their repair timelines. Documentation archives proved valuable for this reverse-engineering effort.
  4. The prioritized component program was projected to extend average fleet life by six years at roughly 30 percent (client-reported, unverified by MMA) of full replacement cost.
CLIENT PROFILE
A regional transmission utility operating a transformer fleet averaging thirty-four years of age approached MMA to assess whether an accelerated component replacement program could defer costly full-unit replacement across its aging substation network while new transformer lead times remained extended. MMA was engaged directly by the utility's asset management division. The utility serves several million customers across its territory.
STRATEGIC CHALLENGE
The utility faced a growing backlog of transformers approaching end of service life, with new unit lead times stretching past two years and insufficient capital budget to replace every aging unit simultaneously. Asset managers lacked a data-driven framework for prioritizing which units needed component intervention versus full replacement first. Delaying decisions further risked unplanned emergency outages.
MMA APPROACH
MMA conducted a fleet-wide risk assessment ranking each transformer by failure probability, component availability, and replacement cost, combining sensor diagnostic data with historical failure records across the full installed base. The engagement produced a prioritized multi-year capital allocation plan balancing component replacement against new unit procurement for the highest-risk assets.
KEY FINDINGS
  1. Twenty-two of the utility's transformers showed elevated failure risk indicators but could be safely life-extended through targeted bushing and insulation replacement. This approach preserved capital for the most urgent cases.
  2. Only eight units required full replacement within the next three years, freeing an estimated 40 million dollars (client-reported, unverified by MMA) for component programs instead.
  3. Three transformers from a now-defunct manufacturer required reverse-engineered components, adding approximately four months to their repair timelines. Documentation archives proved valuable for this reverse-engineering effort.
  4. The prioritized component program was projected to extend average fleet life by six years at roughly 30 percent (client-reported, unverified by MMA) of full replacement cost.
RECOMMENDED STRATEGY
Phase 1: Phase one: immediately initiate component replacement at the twenty-two highest-risk units identified through diagnostic assessment within the current fiscal year. Phase 2: Phase two: proceed with full replacement procurement for the eight units beyond viable life extension, securing manufacturing slots early given extended lead times. Phase 3: Phase three: establish an ongoing fleet-wide diagnostic monitoring program to continuously reprioritize future replacement and component decisions as conditions evolve.
OUTCOME
The utility began phase one component replacement within the current fiscal year and secured manufacturing slots for the eight full-replacement units ahead of further lead time extensions (client-reported, unverified by MMA). Asset management leadership adopted the prioritization framework as a standing annual fleet review process across the broader transmission network.

Frequently Asked Questions

Foundational context covering the market sizes, CAGR, scope, country, region and competition that inform every finding below. This section is provided to cover basics and most often pre-purchase conversations, answered from the MMA Primary Research Dataset.

What is the current size of the Transformer Spare Parts Market?

The global transformer spare parts market is valued at 4.1 billion dollars in 2025. Demand is sustained by aging grid infrastructure and extended new transformer manufacturing lead times.

How large will the Transformer Spare Parts Market be by 2036?

The market is projected to reach 6.796 billion dollars by 2036, up from 4.293 billion dollars in 2026. This represents a cumulative increase of 2.503 billion dollars across the forecast decade.

What is the CAGR for the Transformer Spare Parts Market 2026 to 2036?

The market is forecast to grow at a 4.7 percent CAGR between 2026 and 2036. Bull and bear scenarios range between 3.5 and 5.9 percent depending on new transformer lead times.

Which segment is growing fastest?

Bushings and insulation components lead at a 6.9 percent CAGR, roughly 1.5 times the overall market rate. High failure rates relative to cost drive this prioritized replacement demand.

Who are the major companies in the Transformer Spare Parts Market?

Siemens Energy, Hitachi Energy, General Electric, Mitsubishi Electric, and TBEA Co lead the category, together holding a 41 percent combined revenue share across the global transformer spare parts market.

Which country is growing fastest?

India leads country-level growth at a 6.3 percent CAGR, driven by its rapidly expanding and aging transmission network reaching its first major maintenance cycle nationwide.

Report Segmentation Architecture

The full report scope spans multiple orthogonal segmentation dimensions, with cross-tabulated demand data provided for each dimension pair. Coverage extends further to regional breakdowns, trend trajectories, and the competitive detail needed to support segment-level decision-making.

By Product Type

    By End-Use Industry

      By Commercial Dimension

        By Region

        • North America
        • Western Europe
        • East Asia
        • South Asia and Pacific
        • Latin America
        • Middle East and Africa
        • Eastern Europe

        Scope, Methodology, and Coverage

        Every figure in this report is reproducible from documented input assumptions. The scope below maps the historical period, the forecast horizon, the segmentation dimensions, and the countries covered, alongside the underlying primary and qualitative methodology.
        Historical Period
        2020 to 2025
        Forecast Period
        2026 to 2036
        Base Year
        2025 (USD billions; MMA Primary Research Dataset, October 2026)
        Market Definition
        This report covers replacement components for power and distribution transformers, including bushings, cooling systems, tap changers, insulation materials, and gaskets sold as aftermarket or original equipment manufacturer parts. It excludes complete transformer units sold new, transformer oil sold as a standalone commodity, and transformer monitoring software sold independently of physical replacement components.
        Quantitative Units
        USD billions
        Segmentation Dimensions
        Regions Covered
        North America, Western Europe, East Asia, South Asia and Pacific, Latin America, Middle East and Africa, Eastern Europe
        Countries Covered
        Key Companies Profiled
        Siemens Energy, Hitachi Energy, General Electric, Mitsubishi Electric, TBEA Co, Schneider Electric, Toshiba Energy Systems, Weg SA, CG Power and Industrial Solutions, Hyundai Electric, Bharat Heavy Electricals, Hyosung Heavy Industries, SPX Transformer Solutions, Virginia Transformer Corporation, ERMCO, Wilson Power Solutions, Delta Star Inc, Hammond Power Solutions, Cotran Corporation, Niagara Transformer
        Quantitative Methodology
        Primary survey, n=3,800 respondents, Q4 2025, six countries; demand-side model with trade association cross-validation
        Qualitative Methodology
        47 expert interviews, Q4 2025; applied to validate demand model assumptions, identify emerging dynamics, and assess competitive positioning
        Report Format
        PDF and XLSX data workbook (Word format preview document)
        Publisher
        Market Minds Advisory
        Report Code
        MMA-2026-ENE-227
        Published
        October 2026
        Contact
        sales@marketmindsadvisory.com | www.marketmindsadvisory.com

        Purchase the full Transformer Spare Parts Market Report (2026 to 2036).

        The full report expands every section summarized here into complete analytical depth. It includes the full segmentation model across all six segments, detailed profiles of all twenty tracked competitors, and the complete regional dataset across all seven markets covered in this research program. It also adds extended trend, driver, and restraint coverage well beyond the two visible items shown in each category here, along with full input cost and portfolio tier analysis. Buyers additionally receive the underlying primary survey dataset and full expert interview summary notes.
        Complete six-segment MECE breakdown with margins
        Full twenty-company competitive profile set included
        All seven regional markets with demand mechanisms
        Extended trend, driver, and restraint library
        Primary survey dataset access, n=3,800 respondents
        Expert interview summary notes, 47 interviews

        Built For The People Who Decide

        From boardroom strategy to bench-side execution, this report is read cover-to-cover by leaders shaping the next decade of their industry, turning demand scenarios, market dynamics and valuation benchmarks into decisions.
        CXOs/ Presidents/ VPs/ Managers
        M&A and Corporate Development
        Strategy Teams and R&D Heads
        Procurement and Product Directors
        Regulatory and Compliance Leaders
        Investor Relations and Equity Analysts