Market Minds Advisory
Trade Management Software Market

Trade Management Software Market: Trade Management Software Market: Enforcement Demand, Classification Liability and Unclaimed Preference, 2026 to 2036

Almost nobody buys this before a penalty arrives, which means demand follows enforcement intensity rather than trade volume and grows perfectly well in years when goods movement is falling. Volume is the wrong driver.

Lead Analyst

Published

September 2026

Make Smarter Decisions with Customized Research Insights

Request a free sample report and evaluate market opportunities, growth trends, and competitive dynamics relevant to your business needs.

2025 MARKET VALUE$1.9BMarket Size 2025
2036 FORECAST VALUE$6.5BBase Case , 2026 to 2036
CAGR 2026 TO 203611.8 %Bull 13.0% / Bear 10.6%
INCREMENTAL OPPORTUNITY$4.3BNet 10- year value creation
EXPANSION MULTIPLE3.05x2036 value over 2026 base
Strategic Levers
M&A Pipeline
Regional Outlook
Country Rankings
Competitive Intelligence
Segmental Deep-dive
Call-Us : 91 93563 13602

Executive Snapshot and Market Trajectory.

This software is bought after something goes wrong. Some 71% of purchases follow an audit, a penalty or a violation rather than any planned compliance programme, which means demand tracks enforcement activity rather than the volume of goods actually crossing borders. Container volume forecasts get this wrong every time.
Tariff volatility then changed who signs. When duty rates were low and stable, product classification was a compliance chore performed by a trade manager. With applicable rates now moving across a 23 point spread, a classification decision moves gross margin, so finance took the file. Classification and tariff management grows at 17.7%, half again the market rate of 11.8%. The finance function holds the budget now, and it asks entirely different questions.
Five vendors hold 44% of measured licence and subscription revenue, and the real product is regulatory content rather than software. The unexploited opportunity is preference: roughly 42% of eligible preferential duty saving is never claimed, because rules of origin demand bill of materials evidence from suppliers who will not provide it. That is money sitting on the table. The obstacle is supplier refusal rather than any calculation difficulty.
Market Definition
The trade management software market covers applications that govern cross-border movement of goods, spanning customs filing and declaration, product classification and tariff management, free trade agreement and origin management, export control and sanctions screening, landed cost and duty optimisation, and trade documentation and certification. Sizing is measured at vendor licence, subscription and maintenance revenue. Freight forwarding services, customs brokerage execution, transportation management, warehouse systems, tax determination for domestic transactions and consulting delivery are excluded.
Base Year Value
$1.9B in 2025 (MMA Primary Research Dataset, September 2026)
Forecast Period
2026 to 2036, eleven discrete annual values
CAGR
11.8% base case. Bull 13.0%. Bear 10.6%.
Fastest Growth Segment
Product Classification and Tariff Management: 17.7% CAGR
Fastest Growth Country
Vietnam: 19.2% CAGR
Fastest Growth Region
South Asia and Pacific: 14.0% CAGR
Largest Region
North America: 34% of 2025 global value
Market Leaders
SAP, Descartes Systems Group, Oracle, e2open, WiseTech Global. Source: MMA Analysis based on company annual reports and measured licence and subscription revenue.
Primary Survey
n=3,800 procurement and R&D decision-makers, Q4 2025, six countries
Methodology
Demand-side build-up, cross-validated against public data, 47 expert interviews

Trade Management Software Market Forecast Scenarios

trade-management-software-market-size-forecast-scenario-1788415887230
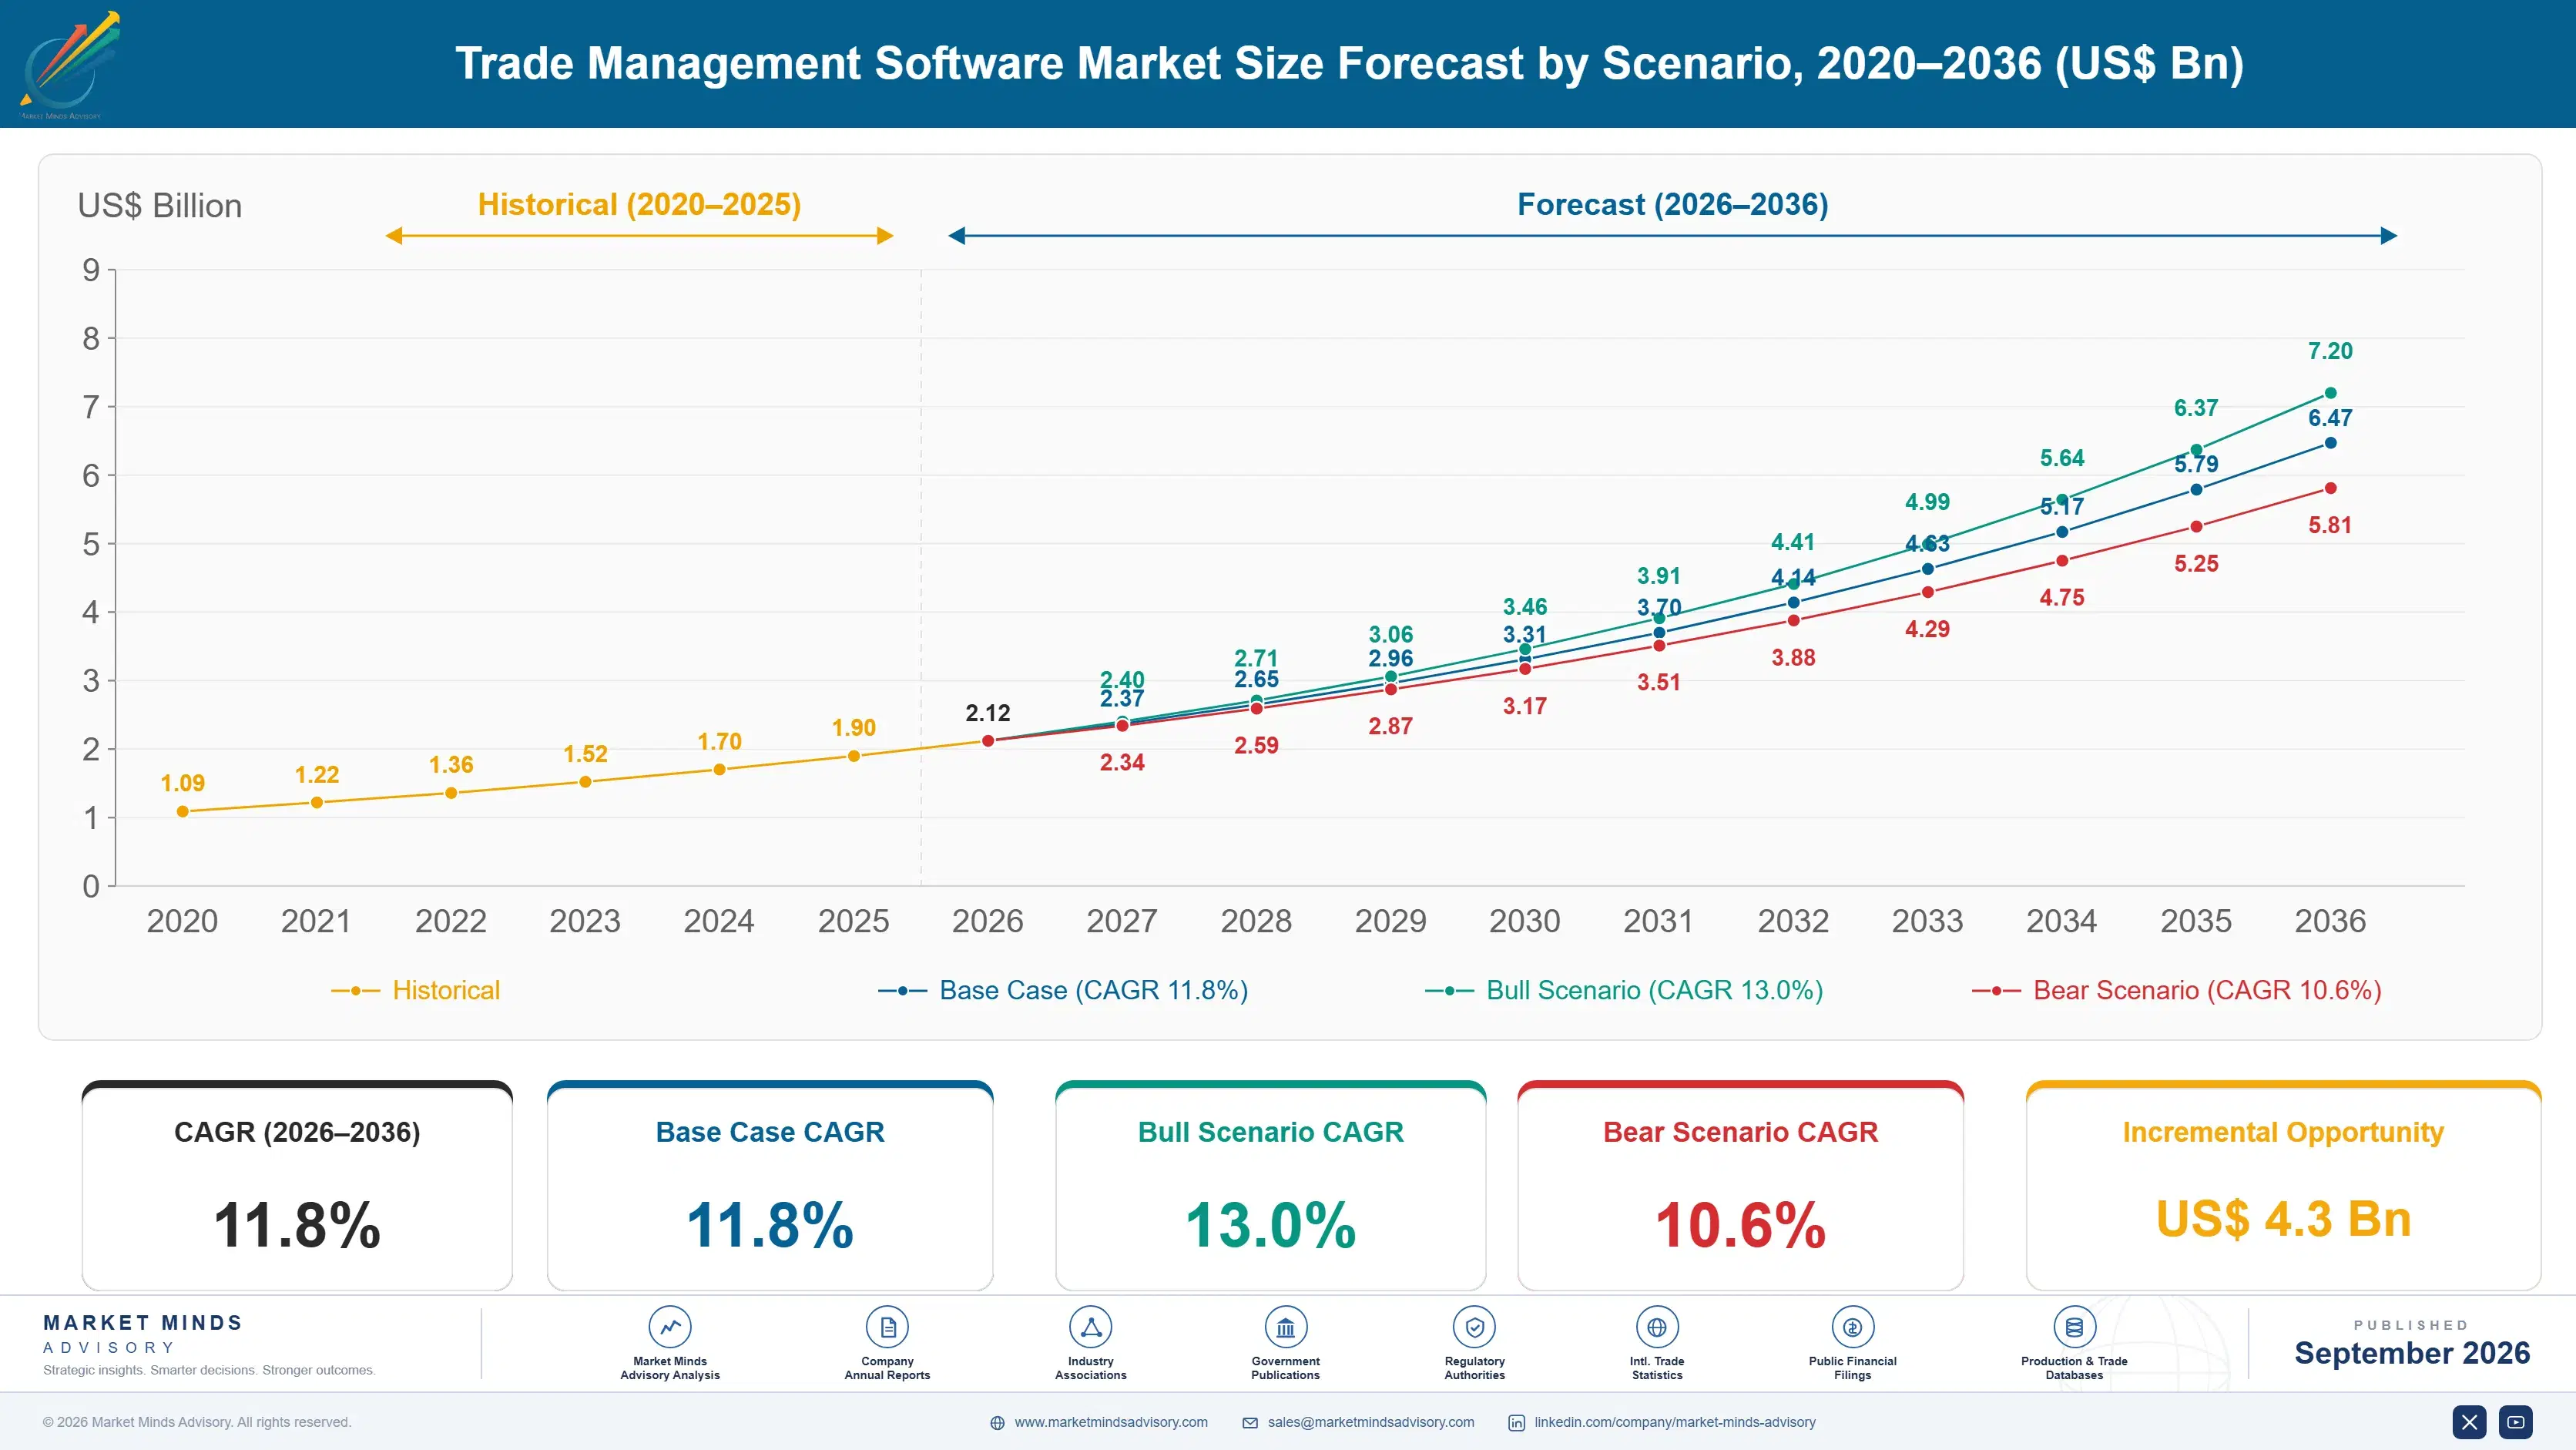
Between 2020 and 2025 the market compounded at 10.6% while world goods trade did nothing consistent, which is clear evidence that volume is the wrong driver. Growth came from enforcement instead: sanctions regimes expanded, forced labour import prohibitions arrived, and tariff programmes changed repeatedly. Each of those created a compliance obligation with a penalty behind it and a budget released to answer it.
The 11.8% base case rests on three commercial mechanisms. Enforcement continues intensifying across sanctions, origin verification and supply chain provenance, and none of it is being relaxed by anybody. Tariff rate volatility has moved classification from a compliance question to a margin question, which changes both the buyer and the budget. And preferential trade agreements keep multiplying while the share of eligible saving actually claimed stays low, which is a gap software is finally able to close.
The bull case is origin verification requirements extending deeper into supply chains, which would force bill of materials collection that no company can manage manually at any scale. The bear case is trade policy stabilising and enforcement attention moving elsewhere, since a market driven by penalties shrinks when they stop and buyers revert to treating it as overhead.

Bought After The Penalty, Not Before It

Nobody wakes up wanting trade management software. Around 71% of purchases follow an audit finding, a penalty or a screening violation, which makes this a market driven by enforcement activity rather than by the volume of goods moving. That is why it grew comfortably through years when world trade was flat or falling, and why forecasts built from container volumes have been consistently and confidently wrong.
TOP FIVE CONCENTRATION44%Share of measured licence and subscription revenue held by leaders
UNCLAIMED PREFERENCE SHARE42%Portion of eligible preferential duty savings never actually claimed
CLASSIFICATION ERROR RATE17%Share of catalogue classifications found incorrect on formal review
PURCHASE TRIGGER SHARE71%Portion of purchases following an audit, penalty or violation
CATALOGUE SIZE240,000 linesProduct lines a large importer must classify and maintain
DUTY RATE VOLATILITY23 pointsSpread in applicable duty rate across recent tariff changes
Tariff volatility changed the internal politics. Classification of a product into a tariff heading was a clerical judgement when duty rates were low and stable, performed by a trade compliance manager nobody in finance had met. With applicable rates now varying across roughly a 23 point spread, the same judgement moves gross margin on every shipment, and the chief financial officer takes an interest. The budget followed the interest.
The most valuable thing in this market is being left on the table. Preferential agreements offer duty reductions requiring rules of origin evidence at component level, and suppliers frequently will not provide it, so roughly 42% of eligible saving is never claimed. That is a quantifiable return, and the obstacle is supplier data collection rather than anything about the software.
"The strangest thing about this market is that the biggest number in it is money nobody collects. Companies fight over percentage points of freight rate and leave nearly half their preferential duty entitlement unclaimed, because asking a supplier for a bill of materials is awkward."
Director, Supply Chain Compliance and Trade Technology Practice · MMA Technology and Supply Chain Software Practice · September 2026

Market Trends

Classification Becomes A Margin Question Not A Chore

A product's tariff heading determines the duty paid, and while rates were low and stable that choice was administrative. Applicable rates now vary across roughly a 23 point spread depending on classification, origin and programme, which turns a clerical decision into one that visibly moves gross margin on every shipment. Finance functions have taken ownership as a result, bringing budgets that trade compliance managers never held. Classification and tariff management grows at 17.7% against a market at 11.8%, and the growth is concentrated in importers whose catalogues run to hundreds of thousands of lines.
Market Impact: Triggers 71% of purchases
Automated Classification Raises An Unresolved Liability Question

Classification is judgement rather than lookup, since the same product can be defensibly placed in several headings, and a large importer maintains around 240,000 lines assigned over years by people who have long since left. Automated classification is genuinely useful here for the first time and reduces the 17% error rate found on formal review. What nobody has settled is liability: when a model classifies incorrectly and a penalty follows, the importer remains legally responsible while having relied on a vendor it cannot easily hold accountable. Contract language is being written now that will matter later.
Market Impact: Grows at 19.2% annually

Market Opportunities and Growth Drivers

Enforcement Intensity Rather Than Trade Volume Drives Demand

Sanctions programmes have expanded, forced labour import prohibitions have arrived with detention powers behind them, and origin verification has tightened across several major economies simultaneously. Each creates an obligation with a penalty attached, and 71% of purchases in this market follow exactly such an event rather than any planned programme. That decouples demand from goods volume completely. Enforcement is a policy choice rather than an economic cycle, which makes this market behave unlike anything else in supply chain software. Nothing about it follows an economic cycle at all. Policy choice rather than trade drives it.
Market Impact: Blocks 42% of eligible claims

Vietnamese Exporters Face Intense Origin Scrutiny

Trade rerouting has concentrated attention on Vietnamese origin declarations, with authorities in destination markets examining whether goods are genuinely transformed there or merely transhipped, and penalties for getting that wrong reach the importer rather than the exporter. Vietnamese manufacturers and their multinational customers therefore need origin evidence they have never previously had to produce. Growth of 19.2% makes Vietnam the fastest growing country in this market, driven entirely by scrutiny rather than by any expansion in the software budget available. The scrutiny arrived faster than the budgets did. Penalties reach the importer, not the exporter.
Market Impact: Tracks 200 separate jurisdictions

Market Restraints and Challenges

Suppliers Refuse The Data Origin Claims Require

Rules of origin qualification needs component-level information about materials and their sources, and suppliers treat that as commercially sensitive, fearing disintermediation or price pressure if the buyer learns what inputs actually cost. The root cause is a genuine conflict of interest rather than any administrative difficulty. Commercial impact is that roughly 42% of eligible preferential saving goes unclaimed even where software is installed and working. Mitigation runs through neutral third-party collection that does not expose data to the buyer, contractual origin obligations written into purchase terms, and industry data exchanges that suppliers trust more than customers.
Market Impact: Moves duty across 23 points

Regulatory Content Maintenance Is The Real Cost Base

Tariff schedules, sanctions lists, origin rules and documentation requirements change constantly across roughly 200 jurisdictions, and keeping that content current is a permanent operation employing people rather than a software release. The root cause is that governments do not publish changes in any consistent machine-readable form. Commercial impact is a cost base that scales with jurisdictional coverage rather than with customers, which punishes small vendors severely. Participants mitigate by licensing content from specialist providers, by focusing coverage on jurisdictions that actually matter to their customers, and by sharing maintenance across product lines.
Market Impact: Reduces a 17% error rate
4 additional market trends, 3 additional growth drivers, and 2 additional restraints and challenges are covered in the full report. Contact sales@marketmindsadvisory.com to access the complete intelligence.

Segment CAGR and Growth Architecture

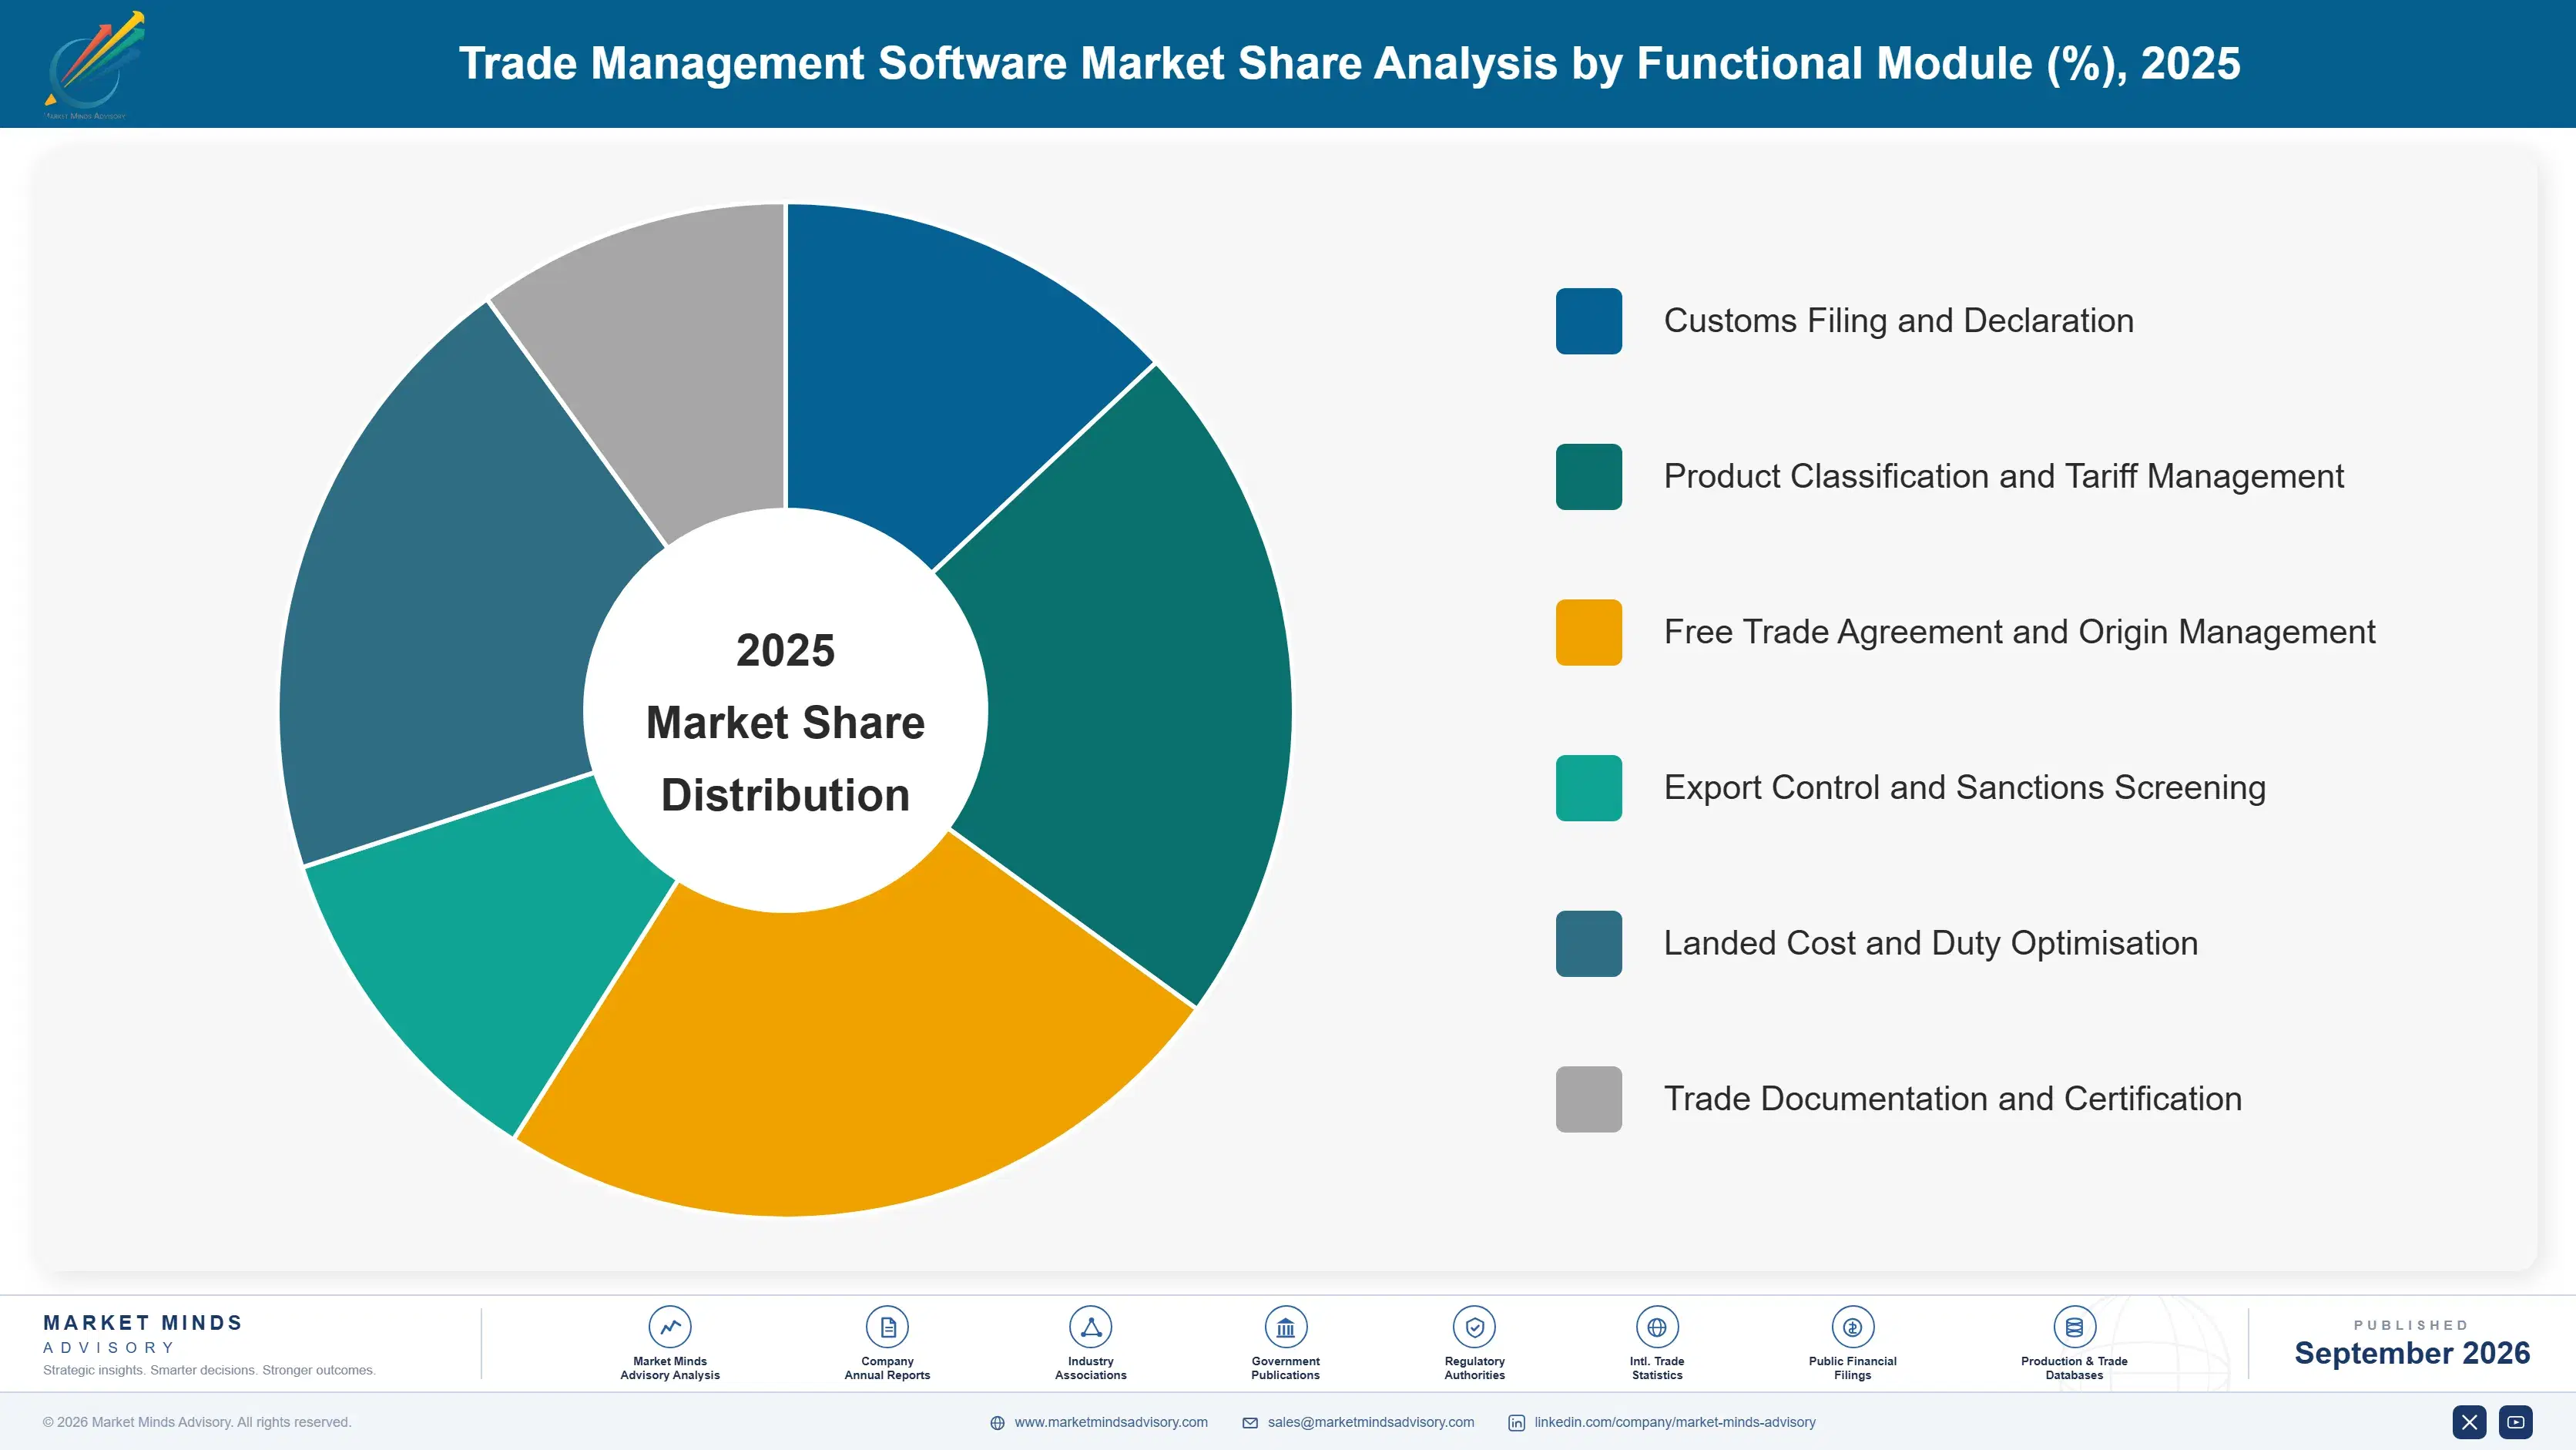
Segmentation follows the functional module deployed, which is how these products are licensed and how buyers budget for them. Filing, classification, origin management, sanctions screening, landed cost and documentation each answer a different obligation, are frequently bought at different times and increasingly come from different vendors within the same company. Growth between them diverges sharply.
trade-management-software-market-market-share-analysis-1788415887771

Product Classification and Tariff Management

Classification determines the duty rate applied, and with applicable rates varying across roughly a 23 point spread the decision now moves gross margin rather than merely satisfying a customs officer. That moved ownership to finance and brought budgets trade compliance managers never controlled. A large importer maintains around 240,000 product lines with a 17% error rate found on formal review, which is a data problem software genuinely solves. Growth at 17.7% is half again the market rate of 11.8%. Automated classification works well and leaves an unresolved question about who carries liability when it is wrong and a penalty follows. Nobody has settled who carries that liability yet. Catalogue scale makes it a data problem.
CAGR 17.7%

Free Trade Agreement and Origin Management

Preferential agreements offer duty reductions conditional on rules of origin that require component-level evidence, and roughly 42% of eligible saving goes unclaimed because suppliers will not provide the bill of materials data those rules demand. This is the only module in the market with an immediate measurable financial return rather than a compliance justification, which makes it far easier to fund. Growth at 15.4% reflects both the multiplication of agreements and rising origin enforcement. The binding obstacle is supplier cooperation rather than software capability, and vendors solving the collection problem rather than the calculation problem are the ones winning here. Collection rather than calculation is the durable position. Agreements keep multiplying regardless.
CAGR 15.4%
Full segment breakdown across 6 segments available in the complete report.

Regional Architecture and Country Demand Map

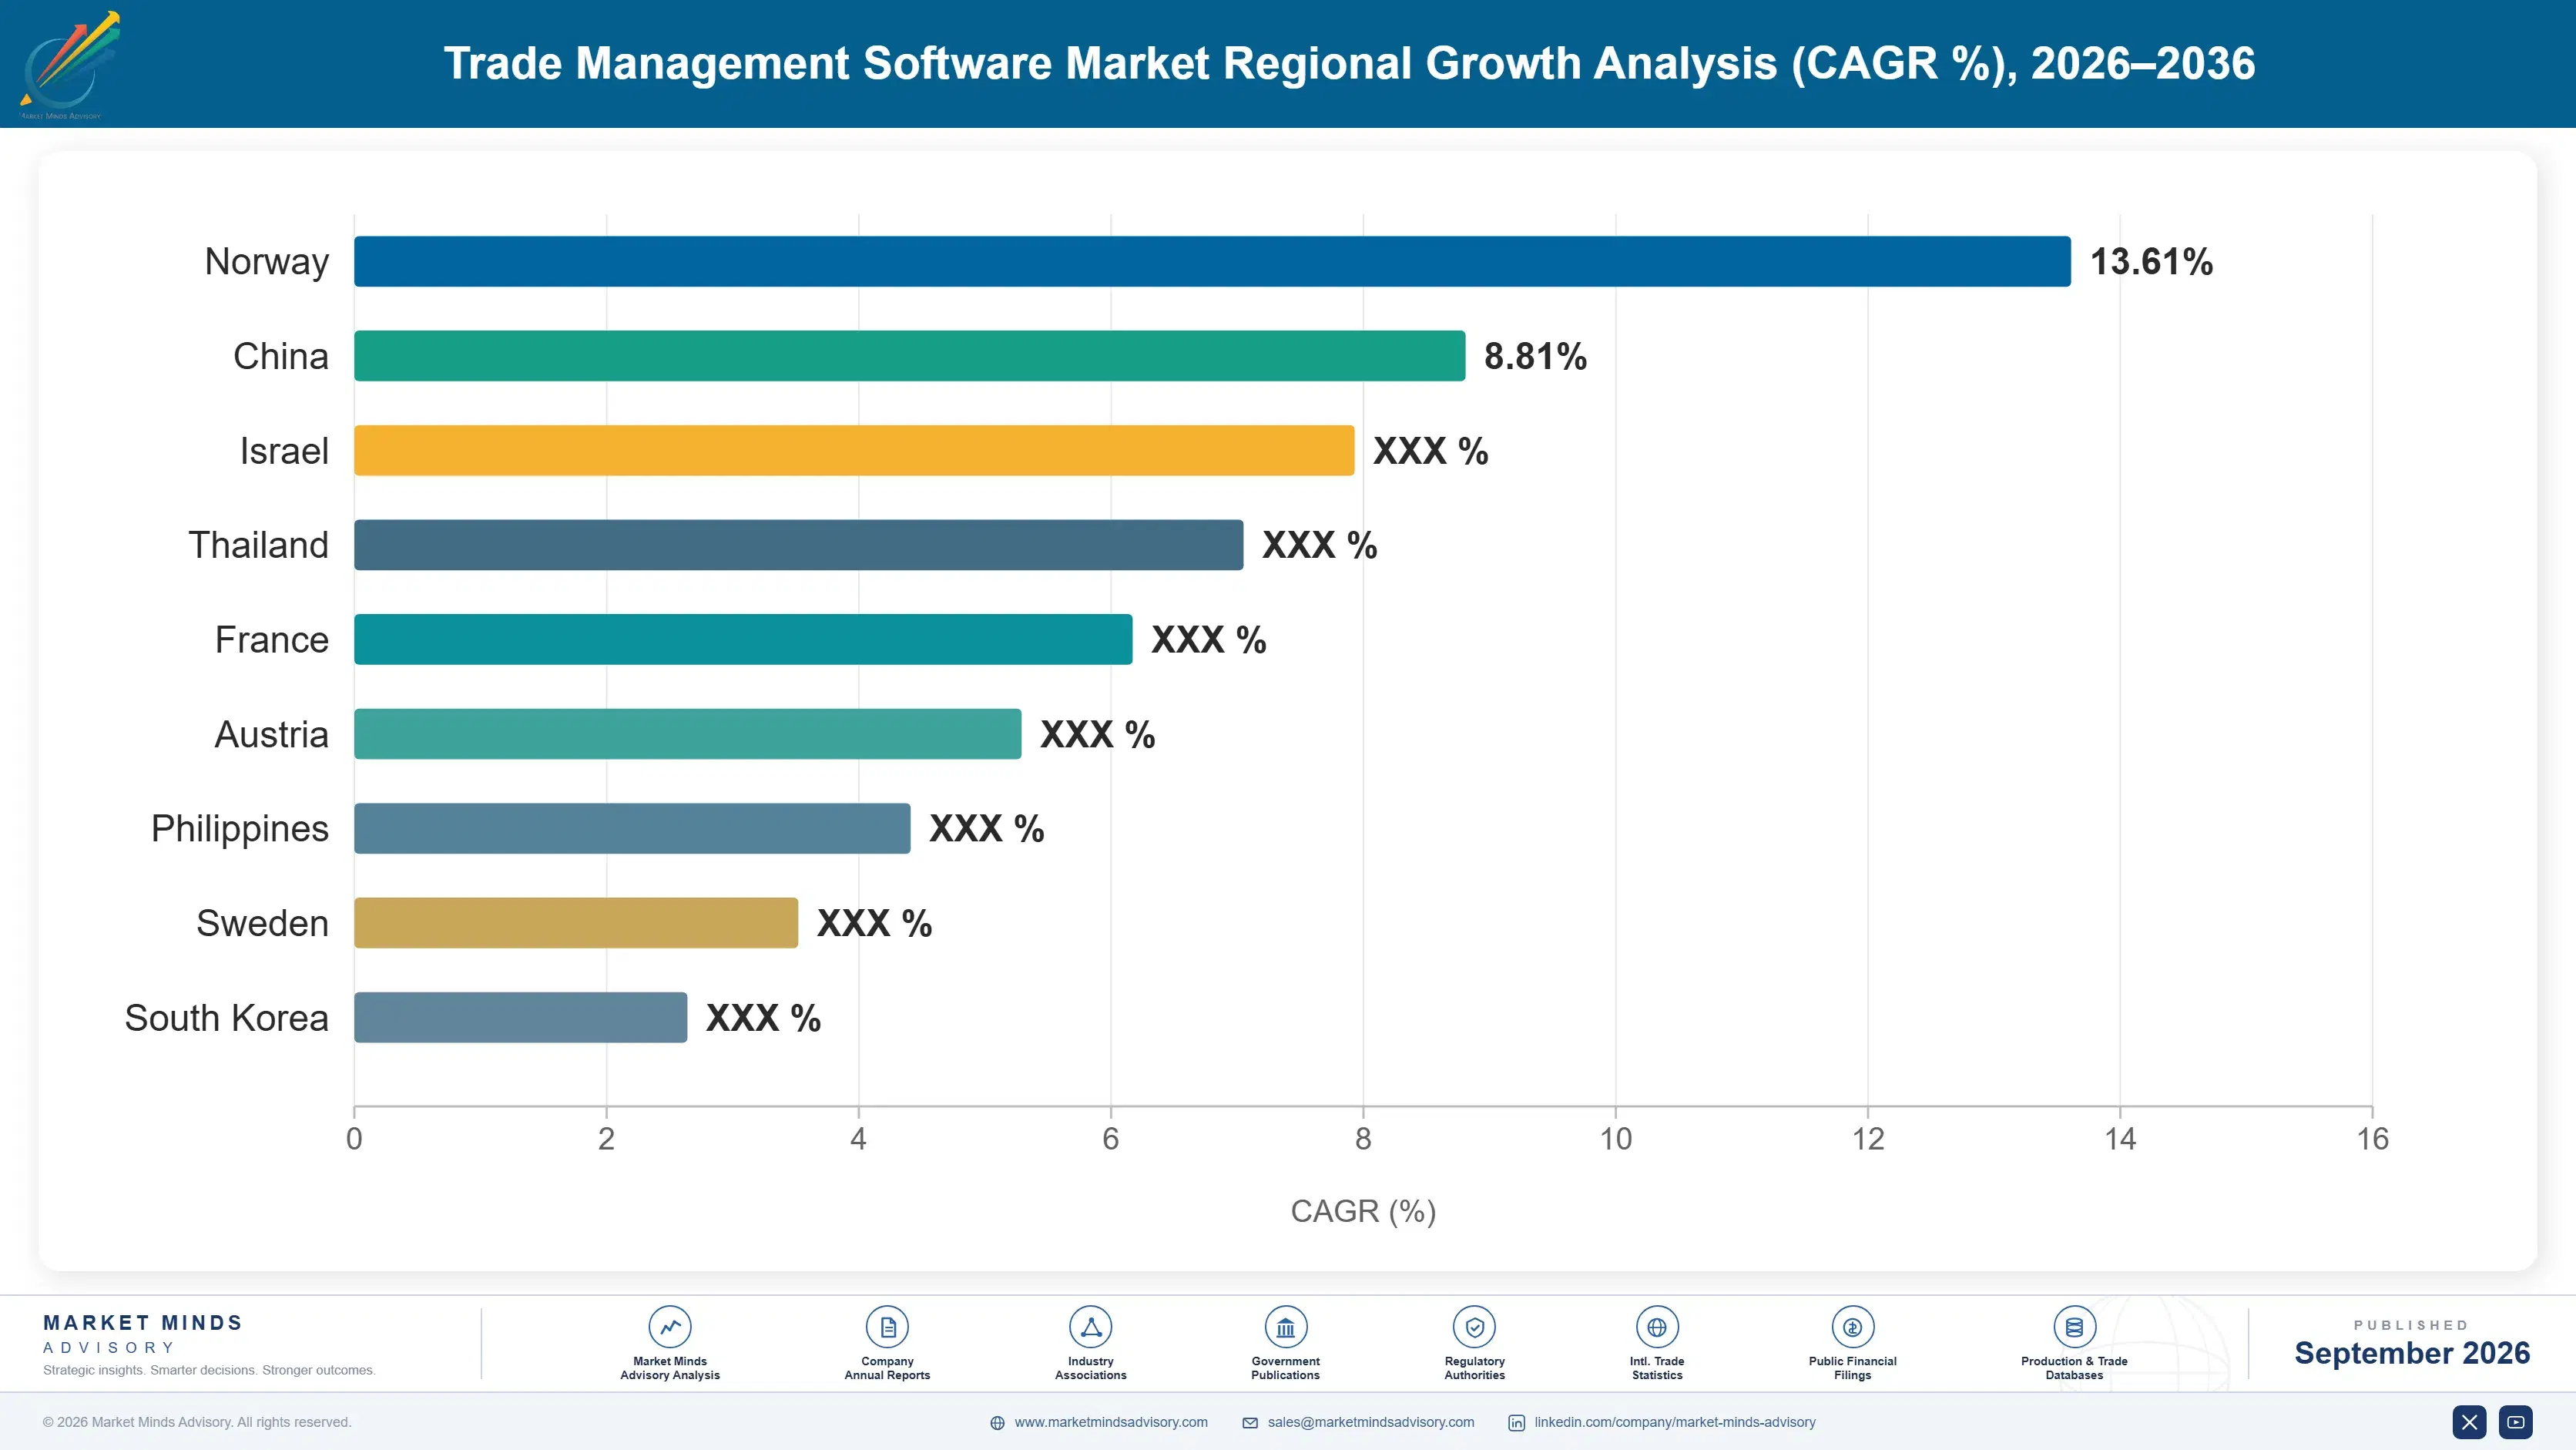
Demand follows enforcement intensity and trade complexity rather than trade volume, which puts the market where the penalties are rather than where the goods are. North America and Western Europe enforce most aggressively and therefore buy most. Container volumes mislead completely here. Penalties decide the map.

North America

Enforcement here is the most aggressive anywhere, combining sanctions programmes, forced labour import prohibitions with detention powers and repeated tariff changes, which is why the region sits at 34%, above the standard band ceiling of 32%. Penalties are large and publicised, which is precisely what generates the 71% of purchases that follow an enforcement event. Origin verification for regional trade agreements imposes documentation burdens on manufacturers that were previously nominal. Mexican and Canadian demand is growing quickly as nearshoring brings origin qualification questions to companies that never faced them before. Penalties are large and publicised, which is precisely what generates purchases that no planned compliance programme ever would have produced.
Share: 34% | CAGR: 11.2% (2026 to 2036)

Western Europe

Customs union operation across member states combined with national implementation differences creates complexity that no single system handles without configuration, and post-departure arrangements added a border where none had existed for decades. Sanctions enforcement has intensified sharply and reaches ownership structures several layers deep. Supply chain due diligence legislation requires provenance evidence beyond anything customs law demanded. Growth of 10.4% is the slowest of any region and reflects a mature market where most large importers already hold some capability rather than buying it for the first time. Supply chain due diligence legislation demands provenance evidence well beyond anything customs law ever required, which reaches companies that considered themselves compliant already.
Share: 26% | CAGR: 10.4% (2026 to 2036)
Regional intelligence for 5 additional markets available in the complete report: East Asia, South Asia and Pacific, Latin America, Middle East and Africa, Eastern Europe. Contact sales@marketmindsadvisory.com.
trade-management-software-market-country-cagr-analysis-1788415888291

Where Trade Software Actually Earns

Four positions carry margin in a market bought reactively by buyers who did not want it. Each involves reaching a different budget or solving a data problem the industry has treated as somebody else's, which is why the obvious opportunity in this market has sat unexploited for so long. None involves better software. Each reaches a different budget.

Sell Duty Recovery To Finance Directly

Roughly 42% of eligible preferential duty saving goes unclaimed, which is an immediate measurable return rather than a compliance argument, and a finance function funds it enthusiastically where it funds compliance reluctantly. Classification now moves margin across a 23 point rate spread, which is the same conversation. Vendors selling compliance assurance to trade managers are addressing a smaller budget held by somebody with no authority to expand it. The proposition changes completely without the product changing at all. Nothing about the product needs to change for this to work. The proposition changes completely.
Market Impact: Recovers the 42% of duty now going unclaimed

Solve Supplier Data Collection Not Calculation

Origin qualification fails because suppliers will not disclose bill of materials detail, not because anybody struggles to compute the rules once the data exists. Neutral third-party collection that never exposes component costs to the buyer, contractual origin obligations written into purchase terms and shared industry data exchanges all address the actual obstacle. Vendors competing on rules engines are solving the easy half of a problem worth 42% of eligible savings. The collection problem is where the durable position sits. Rules engines are the easy half of it. Refusal is the actual obstacle.
Market Impact: Unblocks the 42% of eligible claims now failing

Own Regulatory Content Rather Than Licensing It

Maintaining tariff schedules, sanctions lists and origin rules across roughly 200 jurisdictions is a permanent operation employing people, and it is the genuine barrier in this market rather than any software capability. Vendors licensing content from specialists carry a permanent margin deduction and no differentiation, since competitors license the same source. Owning it costs a great deal and cannot be assembled quickly by anyone entering. This is the least glamorous asset in the industry and the one that actually decides who survives. Nothing about it is glamorous and it decides who survives an entry attempt.
Market Impact: Covers all 200 jurisdictions continuously and reliably enough

Resolve Classification Liability Before Customers Ask

Automated classification reduces the 17% error rate found on formal review and creates a question nobody has answered about who carries the penalty when a model is wrong. Importers remain legally responsible while relying on a vendor they cannot easily hold accountable, and the contract language being written now determines how that resolves. Vendors offering defensible audit trails, documented reasoning and explicit accountability terms will win against those quietly disclaiming everything. The question arrives with the first substantial penalty. The question arrives with the first substantial penalty, and the answer will already be in the contract by then.
Market Impact: Addresses the 17% classification error rate found on review

Who Controls the Margin Pool

Measured on licence and subscription revenue, the basis used throughout this section, the top five hold 44%. Concentration reflects the cost of maintaining regulatory content across roughly 200 jurisdictions, which is a fixed operation that only scale supports. The gap between leaders and the rest is content coverage and enterprise system integration rather than any difference in the rules engines everybody has built.
Competition runs on jurisdictional coverage, integration with enterprise resource planning systems and increasingly on whether a vendor can demonstrate duty recovery rather than compliance assurance. Enterprise software vendors hold positions inside systems customers already run. Specialist trade vendors compete on content depth and customs authority connectivity. Newer entrants compete on classification automation and on the supplier data collection problem nobody else has addressed.

Pressure builds from two directions. Enterprise vendors bundling trade modules into wider platform renewals reach buyers before specialists ever see the requirement. And classification automation is commoditising a capability that specialist vendors built decades of content around, which changes what customers will pay for. Rankings shift where vendors reached finance buyers with recovery propositions rather than defending compliance relationships with trade managers.
trade-management-software-market-company-positioning-matrix-1788415888814

Competitive Moat and Risk Dimensions

SAP

Moat: Enterprise system integration position

Trade modules sitting inside the enterprise system a customer already runs remove the integration work that specialist products require and make the purchase an extension of an existing agreement rather than a new procurement. Master data and finance records already sit where trade compliance needs them. Displacing it means arguing against the system of record, which customers rarely attempt.
SAP

Risk: Content depth against specialists

Regulatory content coverage and customs authority connectivity are deeper at specialist vendors who do nothing else, and customers with complex filing requirements notice the difference quickly. The duty recovery proposition that finance funds requires origin capability that platform breadth does not automatically provide. Trade also competes internally for development attention against far larger product lines within the same organisation.
DESCARTES SYSTEMS GROUP

Moat: Customs connectivity and content depth

Direct connectivity to customs authorities across many jurisdictions combined with maintained regulatory content gives capability that enterprise platforms buy in rather than build, and filing reliability is what customers actually judge these systems on. Long acquisition history has assembled coverage that would take years to replicate. Logistics network position provides adjacent data that pure software vendors lack entirely.
DESCARTES SYSTEMS GROUP

Risk: Acquisition integration and overlap

Capability assembled through many acquisitions creates overlapping products and integration debt that customers encounter as inconsistency between modules. Enterprise vendors bundling trade into platform renewals reach buyers earlier in the decision. The finance-funded duty recovery conversation requires a commercial motion oriented toward compliance buyers rather than toward margin recovery arguments.

Players Tracked

Prominent Players

SAP
Descartes Systems Group
Oracle
e2open
WiseTech Global

Other Key Players

MIC Customs Solutions
AEB
Livingston International
Vertex
Avalara
BDP International
Aptean
Blue Yonder
Infor
Manhattan Associates
Shipsy
Kewill
3rdwave
Trademo
Altana AI

Recent Developments

MARCH 2025

Major economy announces broad tariff changes requiring reclassification

Tariff programme changes across a wide range of product categories obliged importers to review classification and origin positions across entire catalogues, a policy decision rather than any commercial transaction. Applicable duty rates moved by margins large enough to change sourcing economics outright for many affected products.
Signal: A tariff change turns classification from an administrative task into a question the chief financial officer asks about.
NOVEMBER 2024

Forced labour import prohibition enforcement extends to further sectors

Import prohibition enforcement expanded to additional product categories, with detention powers requiring importers to evidence supply chain provenance several tiers back before goods could be released. The obligation reaches inputs rather than finished products, which most existing compliance systems were never built to trace. Detention periods were extended.
Signal: Provenance obligations that reach several supplier tiers back cannot be discharged by anyone still working manually.
JULY 2025

Trade software vendor acquires classification automation specialist

A trade management vendor acquired a company specialising in automated product classification, an acquisition rather than any partnership or joint venture. Catalogue scale at large importers and the error rates found in existing classifications were both cited as the commercial rationale for the transaction. Liability terms were not disclosed.
Signal: Automation reduces classification error and quietly transfers a liability question nobody in this market has properly answered.

Regulatory Content And Engineering

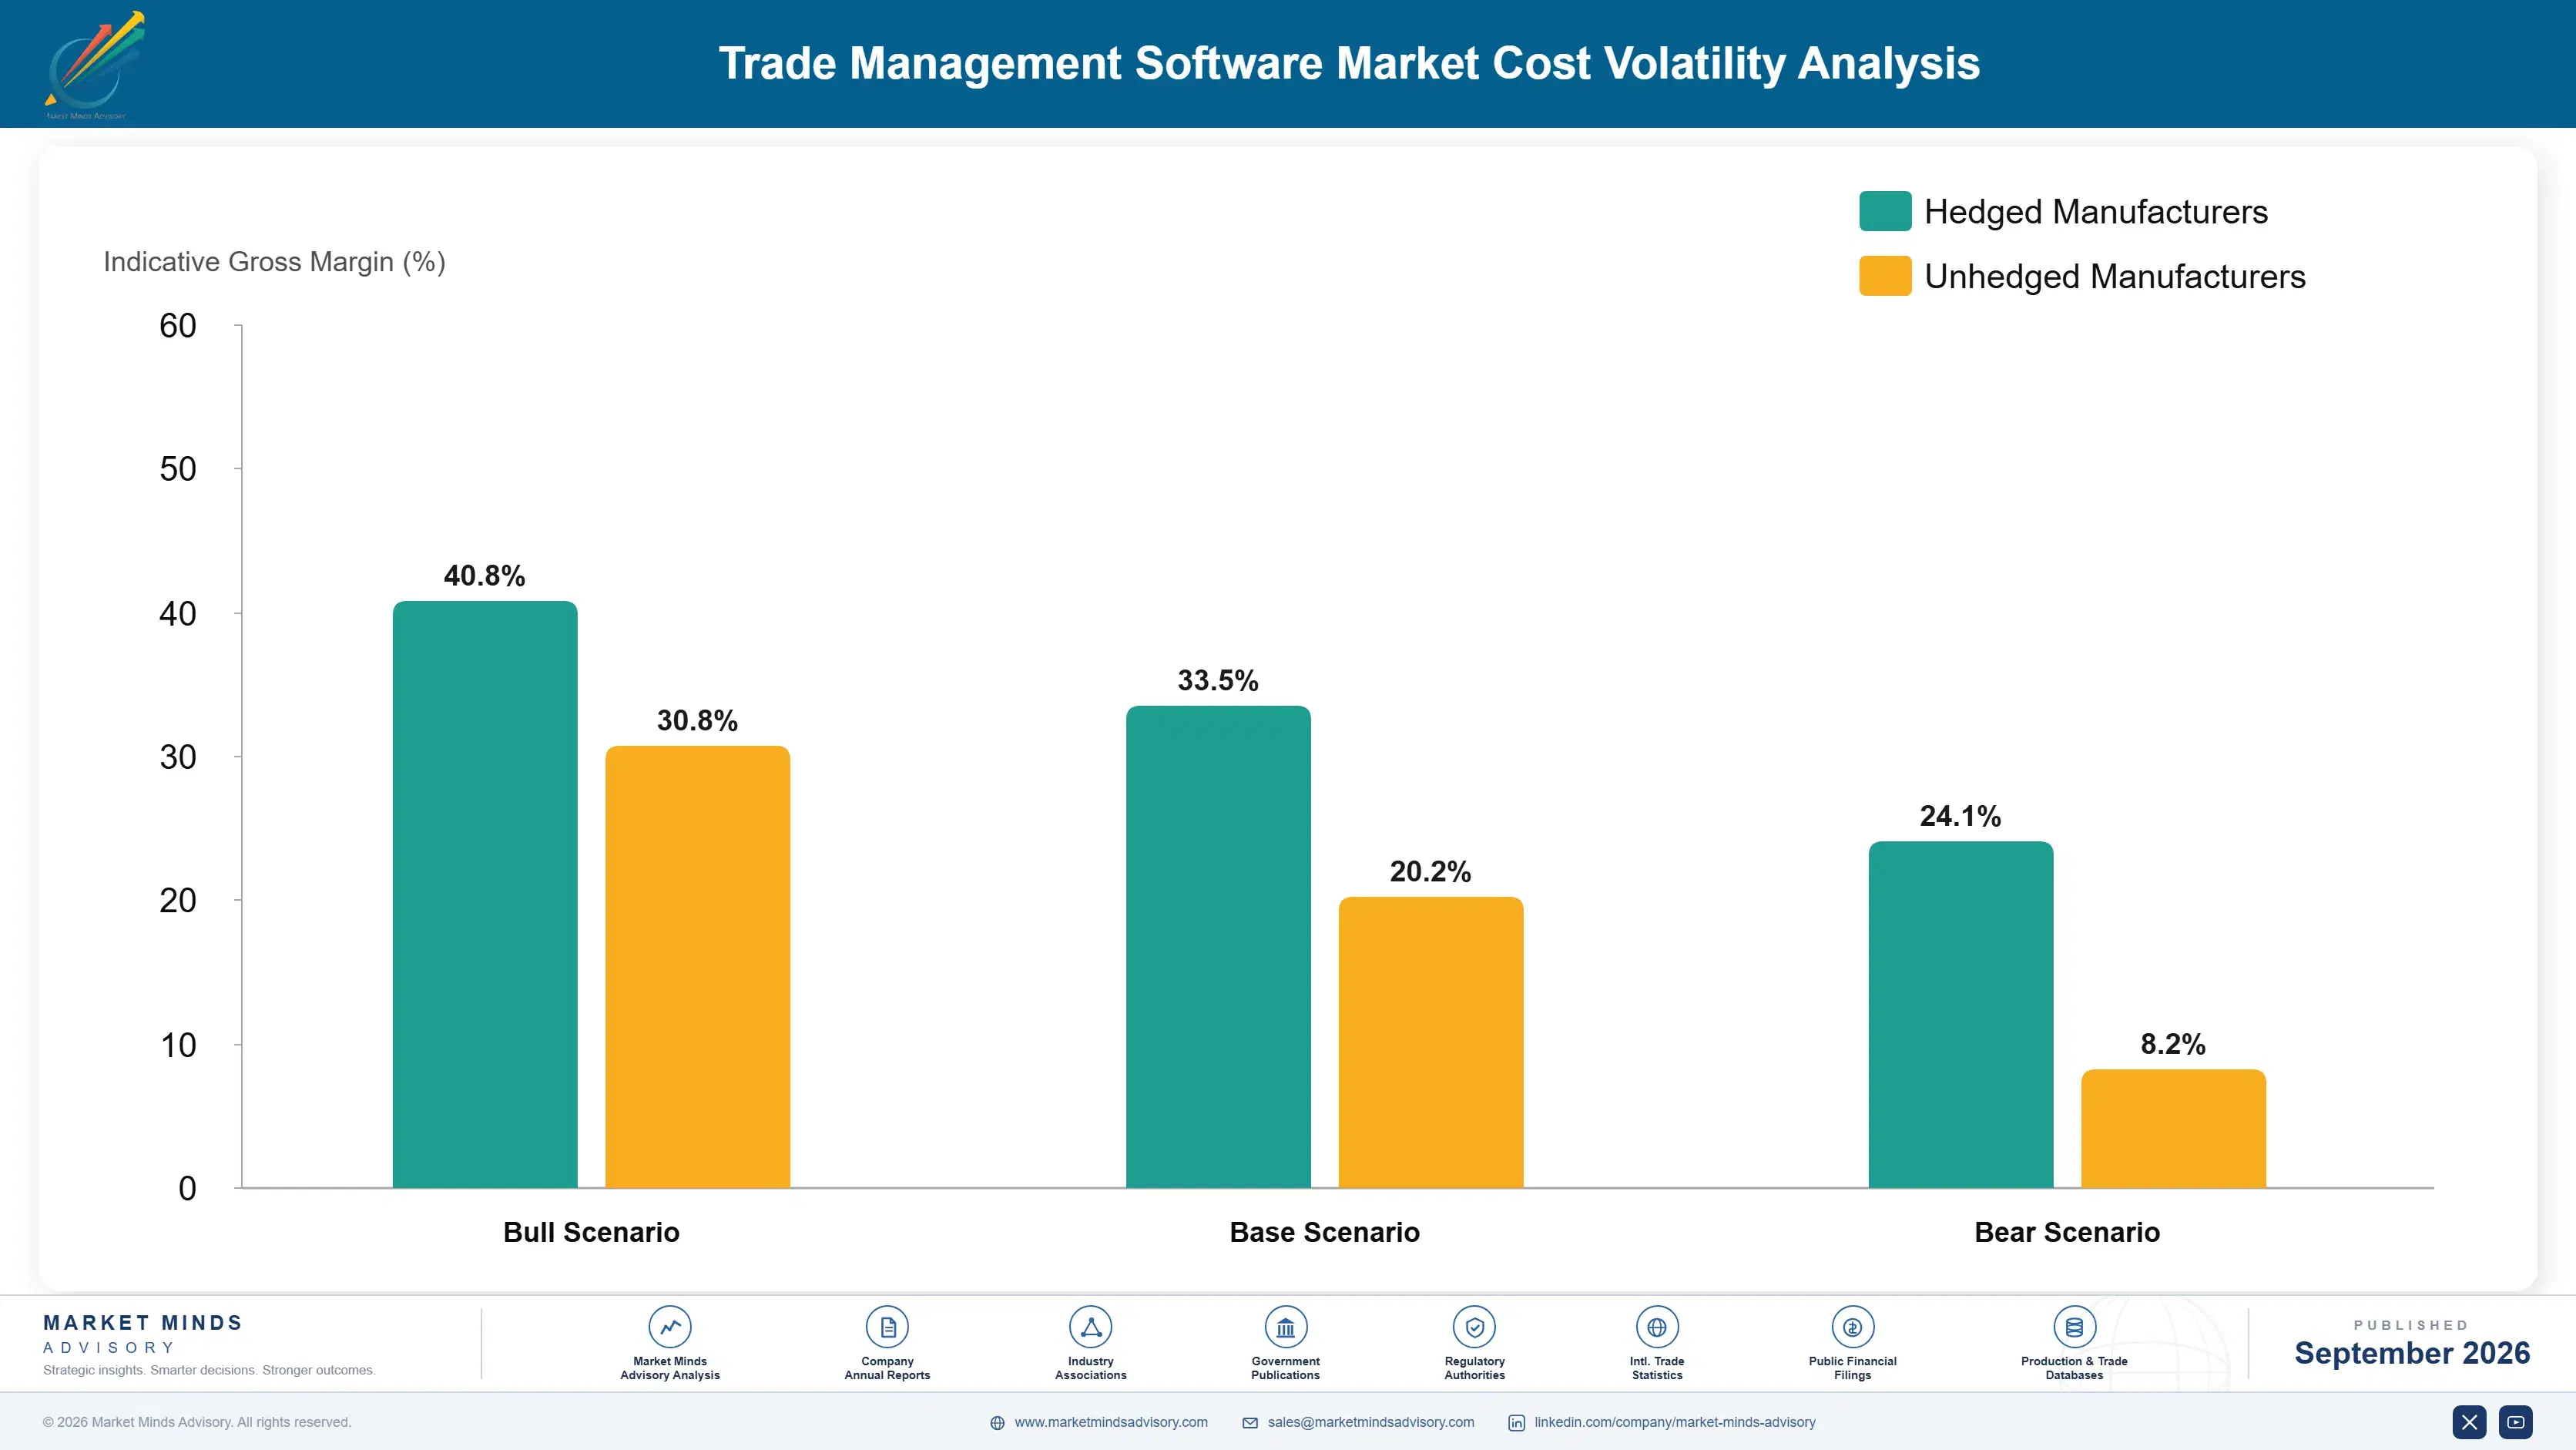
Regulatory content maintenance accounts for roughly 38% of vendor cost, software engineering around 29%, implementation and customer support near 18%, and hosting, sales and overhead the balance. The content operation is unusual: tariff schedules, sanctions lists, origin rules and documentation formats change constantly across roughly 200 jurisdictions, and World Trade Organization notifications record the volume of measures without making any of them machine-readable.
Content maintenance cost rose sharply as sanctions programmes multiplied and tariff changes accelerated, since each requires analysis by people who understand both the law and the data model. Specialist trade and legal analysts became scarce as demand rose across vendors, brokers and corporate compliance functions simultaneously. Several vendors disclosed increased content investment in results covering the period without corresponding revenue arriving in the same year.

The disadvantage mechanism is coverage breadth rather than customer scale. Content cost scales with the number of jurisdictions supported rather than with how many customers use them, so a vendor covering 200 jurisdictions for a hundred customers carries the same operation as one serving a thousand. That punishes small vendors severely and explains the concentration. Licensing content from specialists removes the fixed cost and removes the differentiation with it.
trade-management-software-market-cost-volatility-analysis-1788415889012

Coverage focused on jurisdictions customers actually use

Maintaining deep content for the jurisdictions a customer base genuinely trades through, rather than claiming universal coverage, reduces the fixed operation substantially without losing any business that existed. It requires admitting gaps in marketing material, which vendors resist strongly even when the gaps make no practical difference to anybody. Marketing departments resist admitting it.

Shared content operations across product lines

Tariff and sanctions content serves classification, screening, landed cost and filing modules alike, so maintaining it once for all of them rather than separately within each product team removes duplication that grows quietly in organisations assembled through acquisition. The saving is substantial and the reorganisation is politically difficult. The reorganisation is politically awkward. Few attempt it willingly.

Automated monitoring of regulatory publication sources

Automated collection and change detection across government publication sources reduces the analyst effort spent finding changes, leaving specialists to interpret them rather than to hunt for them. Sources publish inconsistently and change format without warning, so the automation itself needs continuous maintenance that vendors consistently underestimate. Sources change format without warning. The automation needs constant maintenance.

Portfolio Architecture for Margin Defence

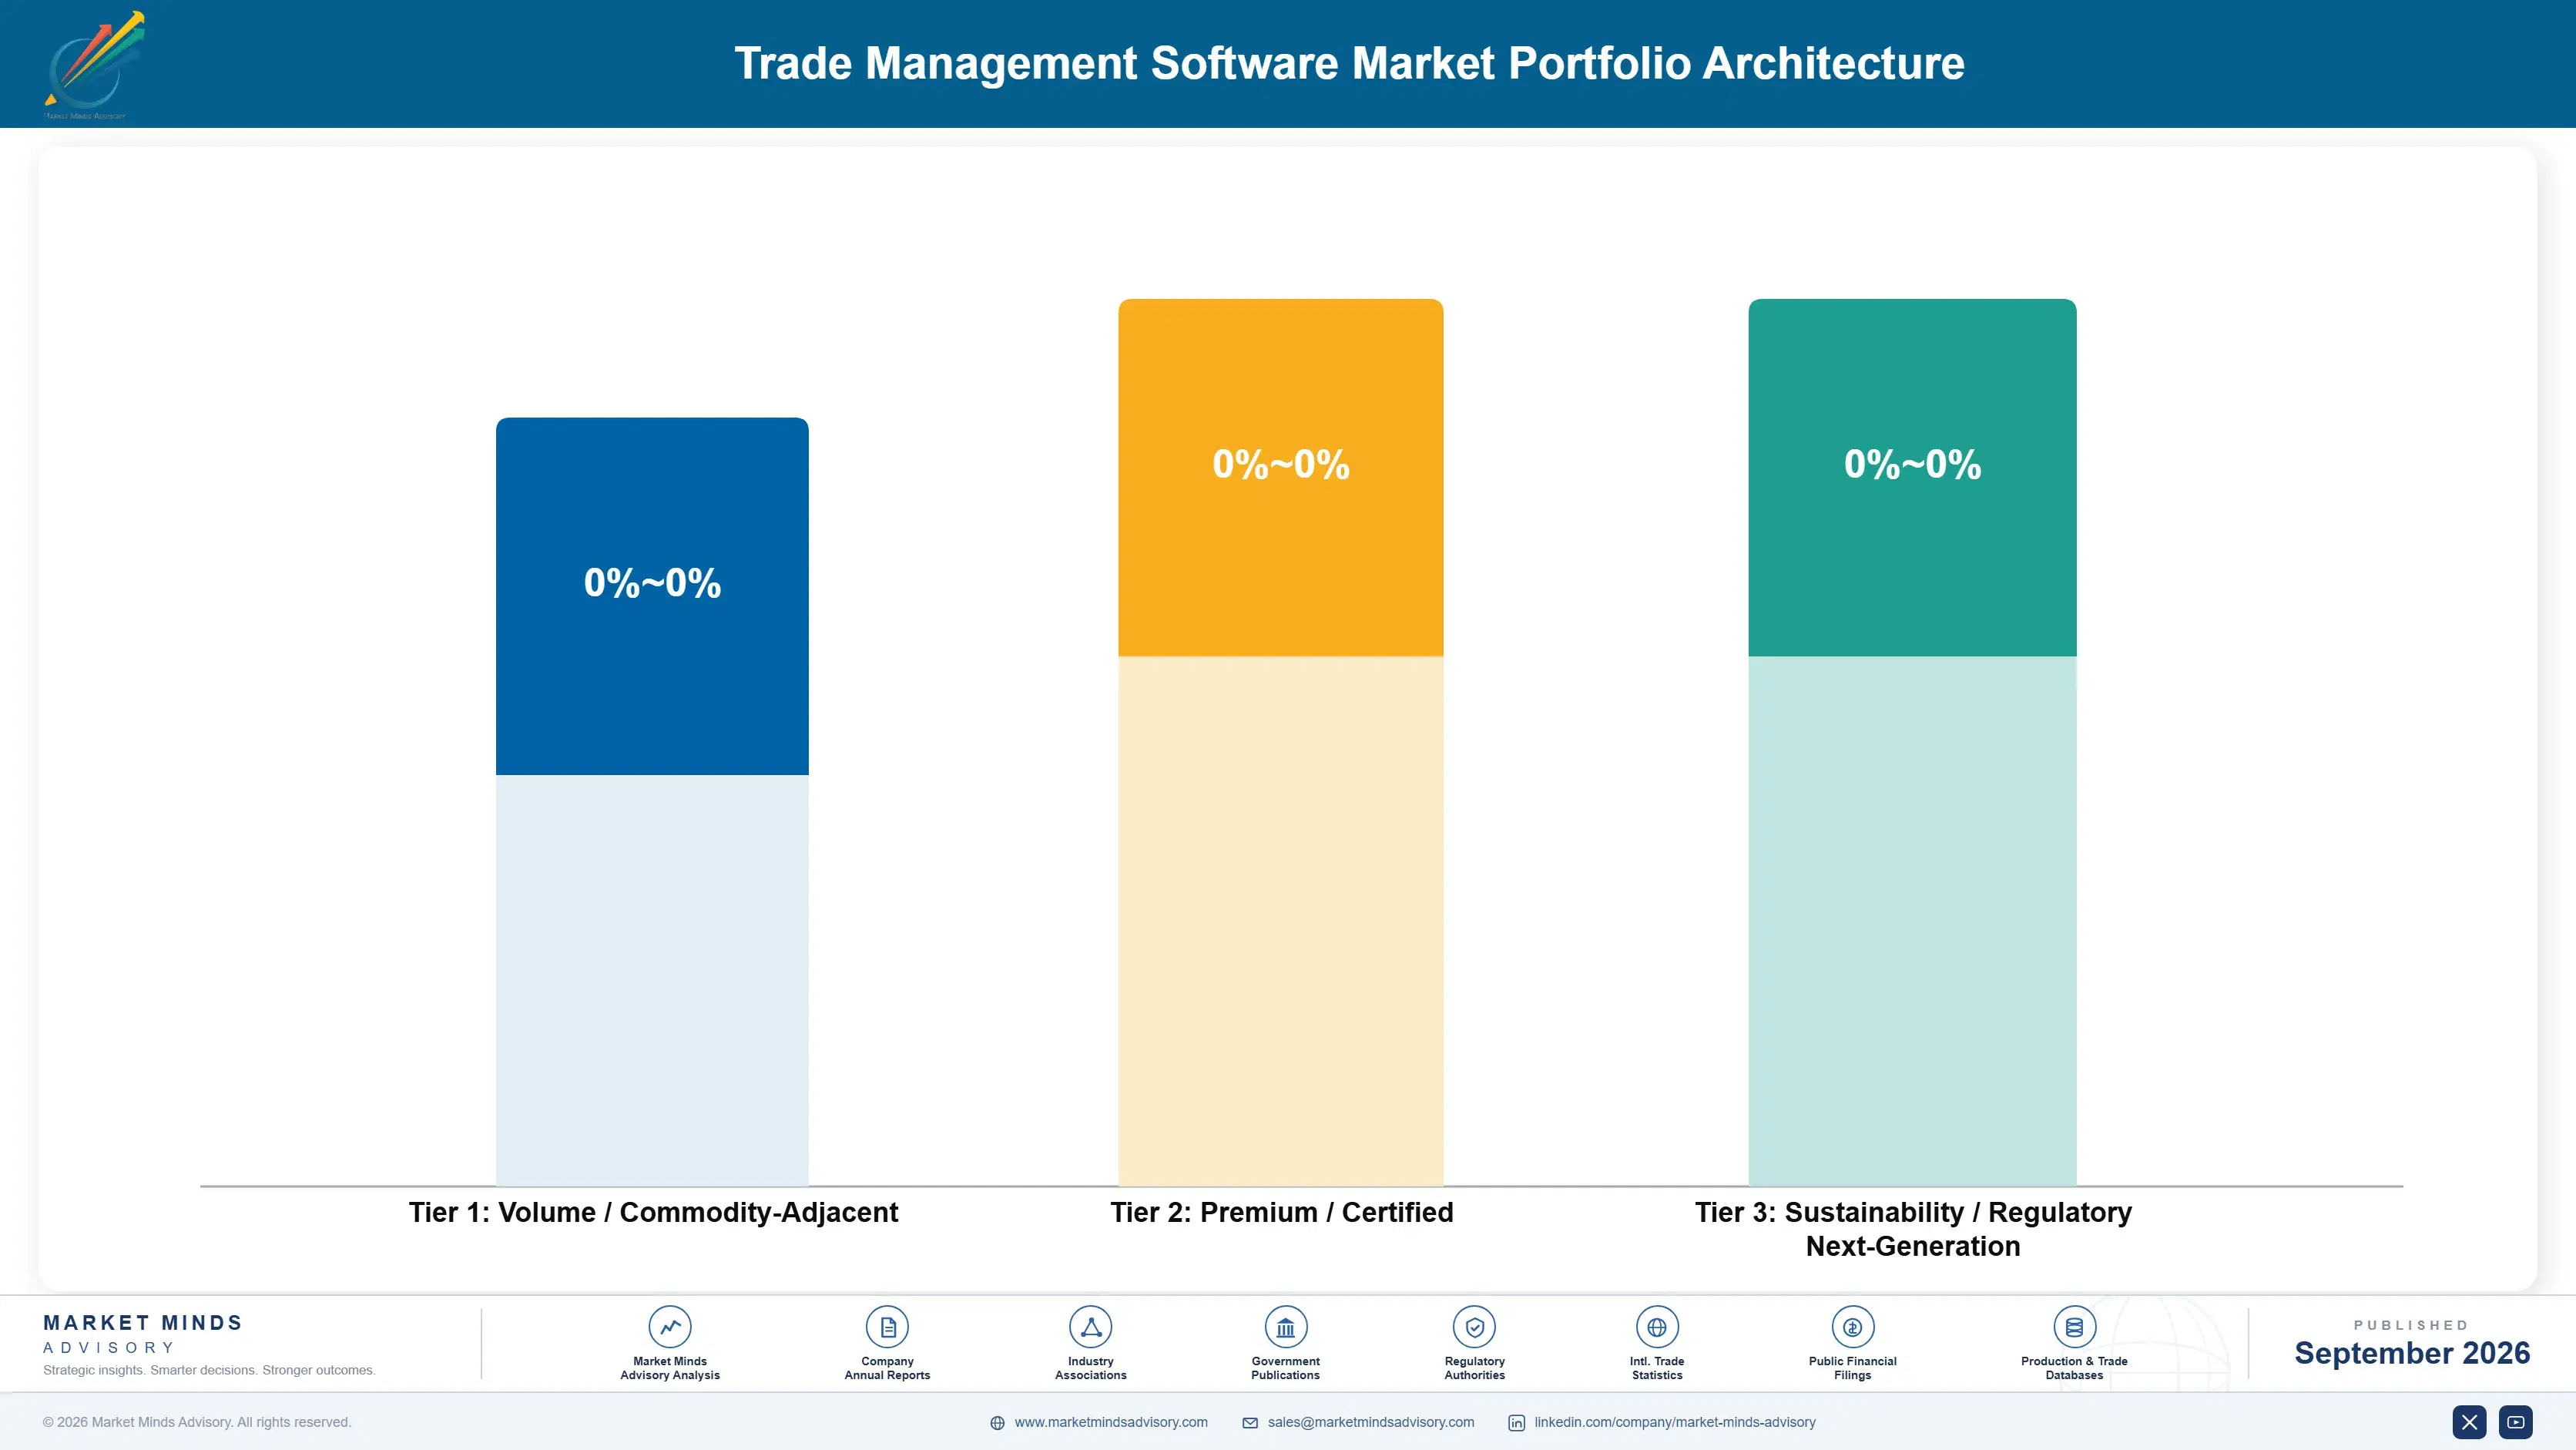
Margin separates by whether the module saves money or merely avoids a penalty. Filing and documentation are administrative necessities bought against an obligation, competed on price and integration, and priced accordingly. Origin management and classification save duty that lands directly in gross margin, which lets a vendor price against the recovery delivered rather than against a competitor's licence fee, and finance funds them on entirely different terms.
The volume against premium tension runs through content. Filing and documentation modules carry the jurisdictional content that origin and classification modules also depend on, so the low-margin products fund the operation the high-margin ones need. No vendor can abandon filing without weakening everything else. The correct reading is that filing is infrastructure rather than a business, and most vendors still manage it as a profit centre in its own right.

High-value pools sit where the customer receives money rather than avoids a loss: preferential duty recovery, classification optimisation across a 23 point rate spread, and supplier origin data collection. Each is funded by finance rather than by compliance, and finance budgets are larger and less grudging. The pools are smaller in licence count and carry most of the profit.

Volume / Commodity-Adjacent

Customs filing, declaration and trade documentation bought against an operating obligation and competed on price, integration and filing reliability. Necessary infrastructure carrying the content operation everything else depends upon rather than a business in itself.
Gross Margin: 44 to 56%

Premium / Certified

Sanctions screening, export control and landed cost modules bought against penalty exposure and audit findings. The 12 point range reflects whether the vendor holds the enterprise system relationship or is selling alongside somebody else's platform.
Gross Margin: 60 to 72%

Sustainability / Regulatory / Next-Generation

Preferential duty recovery, classification optimisation and supplier origin data collection sold to finance against measurable savings. The 14 point range reflects how completely a recovery proposition changes pricing against a compliance one.
Gross Margin: 68 to 82%
trade-management-software-market-portfolio-architecture-1788415889508

High-value Sub-segments and Strategic Watch-out

Preferential Duty Recovery

Recovers roughly 42% of eligible saving that currently goes unclaimed, which is measurable money rather than avoided risk. Finance funds this enthusiastically where the same organisation funds compliance reluctantly and slowly. Nothing else in compliance software gets funded this willingly. Finance funds this one willingly.
Gross Margin: 70 to 82%

Supplier Origin Data Collection

Addresses the actual obstacle to preferential claims, which is supplier refusal rather than any calculation difficulty. Neutral collection that never exposes component costs to the buyer is where the durable position genuinely sits. Vendors competing on calculation are solving the easy half. Collection is the durable position.
Gross Margin: 64 to 76%

Classification And Tariff Optimisation

Growing at 17.7% as duty rates vary across a 23 point spread and the decision moves gross margin directly. Automation reduces the 17% error rate and raises a liability question nobody has yet properly answered. Finance took ownership of this file and brought a budget with it.
Gross Margin: 62 to 74%

Customs Filing And Documentation

Bought against an operating obligation and competed on price and reliability, carrying the content operation the profitable modules depend upon. Infrastructure rather than a business, though most vendors still manage it as a profit centre. Abandoning it weakens everything that depends on the content. Reliability decides it.
Gross Margin: 44 to 56%

Who Buys And What Triggers It

Annuity economics here are unusually strong once installed, because filing and audit records cannot easily be reconstructed elsewhere, and switching risks penalties nobody accepts for a licence saving. Renewal is close to automatic and churn is very low. The difficulty is entirely in the initial sale, which 71% of the time happens only after something has already gone wrong.
Adoption depth varies sharply by trigger. A company buying after a penalty implements narrowly against the specific failure and expands slowly afterwards, if at all. A company pursuing duty recovery implements broadly because the return scales with coverage, and expands willingly. Companies buying because a customer demanded origin evidence implement the minimum that satisfies that customer and nothing more, which is the least valuable of the three relationships.

The buyer profile has moved and it changes everything. Trade compliance managers bought assurance against penalties on modest budgets they did not control. Finance functions now buy duty recovery and classification accuracy against measurable margin, on budgets that are larger and released faster. Vendors whose commercial organisation was built to call on compliance departments are reaching the smaller of the two budgets available inside the same company.
trade-management-software-market-end-use-penetration-index-1788415889995

Where Vendors Should Compete

These are among the four positions where our research anticipates prominent divergence between winners and laggards over the coming forecast period. Each is grounded in the demand model, the regulatory perimeter, and the announced capacity pipeline.
01 / FINANCE BUYER REORIENTATION

Sell duty recovered, not penalties avoided

Roughly 42% of eligible preferential duty saving goes unclaimed, which is measurable money arriving in gross margin rather than a risk being avoided, and a finance function funds that enthusiastically where it funds compliance both slowly and reluctantly. Classification now moves duty across a 23 point rate spread, which is the same conversation with exactly the same audience. Vendors selling assurance to trade managers are addressing the smaller budget held by somebody with no authority to expand it at all.
02 / SUPPLIER DATA COLLECTION

Solve the refusal, not the rules engine

Origin qualification fails because suppliers will not disclose their bill of materials detail, not because anyone finds the rules difficult to compute once the underlying data actually exists. Neutral third-party collection that never exposes any component costs to the buyer, contractual origin obligations and shared industry exchanges all address the actual obstacle directly and properly. Vendors competing purely on rules engines are solving the easy half of a problem worth 42% of eligible savings to each of their own customers.
03 / CONTENT OWNERSHIP DECISION

Own the regulatory content or accept commodity margin

Maintaining tariff schedules, sanctions lists and origin rules across roughly two hundred jurisdictions is a permanent operation employing real people, and it is the genuine barrier in this market rather than any software capability that anybody has actually built. Vendors licensing content from specialists carry a permanent margin deduction alongside no differentiation of any kind whatsoever, since their competitors license precisely the same underlying source as they do. It cannot be assembled quickly by any new entrant arriving in this market.
04 / CLASSIFICATION LIABILITY TERMS

Answer the accountability question before customers ask

Automated classification reduces the 17% error rate found on formal review considerably and creates a question nobody has yet answered about who carries the penalty when the model gets it wrong and a penalty duly follows. Importers remain legally responsible while relying on a vendor they cannot easily hold to account for it, and the contract language written today determines how that question eventually resolves itself. Vendors offering defensible audit trails and explicit accountability terms will beat those who quietly disclaim everything instead.

Engagement Snapshot From the Field

A live engagement with an industry participant carrying material or product regulatory and market exposure ahead of a defining policy shift, showing how our research translates into a defensible multi-year portfolio strategy.
MARKET MINDS ADVISORY · CLIENT ENGAGEMENT SUMMARY
Trade Management Software Producer Strategic Portfolio Review and Transition Roadmap 2026·Investment Scenario on Trade Management Software Exposure Evaluation 2025-26
CLIENT PROFILE
A global industrial manufacturer importing components and exporting finished equipment across more than sixty markets, with annual revenue reported at approximately USD 11 billion (client-reported, unverified by MMA). Trade compliance was managed regionally by small teams using a mixture of enterprise modules and spreadsheets, and no consolidated view of duty paid existed anywhere in the group.
STRATEGIC CHALLENGE
A customs audit in one market had produced a penalty and reclassification of several product families, and management could not tell whether the same exposure existed elsewhere. Tariff changes were moving landed costs unpredictably. Nobody in finance could say how much duty the group paid annually or how much of it was avoidable.
MMA APPROACH
MMA reconstructed group duty paid by jurisdiction and product family from customs records rather than from internal reporting, tested a sample of classifications against formal review, and assessed how much preferential entitlement the group qualified for but had never claimed across its agreement coverage. Regional system usage was mapped alongside.
KEY FINDINGS
  1. Around 17% of sampled classifications were incorrect, and the errors ran in both directions, with overpayment roughly as common as the underpayment that had triggered the original penalty.
  2. Roughly 42% of eligible preferential duty saving was unclaimed, almost entirely because suppliers had never been asked for the bill of materials evidence rules of origin require.
  3. Group duty paid annually exceeded the entire trade compliance function's budget by a very wide margin, and nobody in finance had ever seen the figure consolidated.
  4. Regional teams were using four different systems with no shared classification master, so the same component carried different tariff headings in different markets.
CLIENT PROFILE
A global industrial manufacturer importing components and exporting finished equipment across more than sixty markets, with annual revenue reported at approximately USD 11 billion (client-reported, unverified by MMA). Trade compliance was managed regionally by small teams using a mixture of enterprise modules and spreadsheets, and no consolidated view of duty paid existed anywhere in the group.
STRATEGIC CHALLENGE
A customs audit in one market had produced a penalty and reclassification of several product families, and management could not tell whether the same exposure existed elsewhere. Tariff changes were moving landed costs unpredictably. Nobody in finance could say how much duty the group paid annually or how much of it was avoidable.
MMA APPROACH
MMA reconstructed group duty paid by jurisdiction and product family from customs records rather than from internal reporting, tested a sample of classifications against formal review, and assessed how much preferential entitlement the group qualified for but had never claimed across its agreement coverage. Regional system usage was mapped alongside.
KEY FINDINGS
  1. Around 17% of sampled classifications were incorrect, and the errors ran in both directions, with overpayment roughly as common as the underpayment that had triggered the original penalty.
  2. Roughly 42% of eligible preferential duty saving was unclaimed, almost entirely because suppliers had never been asked for the bill of materials evidence rules of origin require.
  3. Group duty paid annually exceeded the entire trade compliance function's budget by a very wide margin, and nobody in finance had ever seen the figure consolidated.
  4. Regional teams were using four different systems with no shared classification master, so the same component carried different tariff headings in different markets.
RECOMMENDED STRATEGY
Phase 1: Phase one: consolidate classification onto a single master with formal review of the highest duty value product families before anything else is attempted. Phase 2: Phase two: launch supplier origin data collection through a neutral third party that does not expose component costs to procurement teams. Phase 3: Phase three: move trade technology ownership and budget to finance, where the duty figure and the recovery opportunity are both visible.
OUTCOME
Within twelve months the client had consolidated classification, begun supplier origin data collection across its largest categories, and reported annual duty paid down 11.4% (client-reported, unverified by MMA). The trade technology budget now sits with finance and has roughly tripled in size since the change.

Frequently Asked Questions

Foundational context covering the market sizes, CAGR, scope, country, region and competition that inform every finding below. This section is provided to cover basics and most often pre-purchase conversations, answered from the MMA Primary Research Dataset.

What is the current size of the Trade Management Software Market?

The market was valued at USD 1.9 billion in 2025 and reaches USD 2.12 billion in 2026. Enforcement intensity rather than trade volume drives demand in this market.

How large will the Trade Management Software Market be by 2036?

MMA forecasts USD 6.47 billion by 2036, an increase of USD 4.35 billion over the 2026 base. That represents an expansion multiple of 3.05 times.

What is the CAGR for the Trade Management Software Market 2026 to 2036?

The base case CAGR is 11.8%, with a bull case of 13.0% and a bear case of 10.6%. The historical rate between 2020 and 2025 was 10.6%.

Which segment is growing fastest?

Product classification and tariff management grows at 17.7%, half again the market rate of 11.8%. Duty rates now vary enough that classification moves gross margin directly.

Who are the major companies in the Trade Management Software Market?

SAP, Descartes Systems Group, Oracle, e2open and WiseTech Global lead on measured licence and subscription revenue. Together they account for roughly 44% of the market.

Which country is growing fastest?

Vietnam grows fastest at 19.2%, as destination market authorities now scrutinise whether goods are genuinely transformed there rather than simply being transhipped through the country.

Report Segmentation Architecture

The full report scope spans multiple orthogonal segmentation dimensions, with cross-tabulated demand data provided for each dimension pair. Coverage extends further to regional breakdowns, trend trajectories, and the competitive detail needed to support segment-level decision-making.

By Functional Module

  • Customs Filing and Declaration
  • Product Classification and Tariff Management
  • Free Trade Agreement and Origin Management
  • Export Control and Sanctions Screening
  • Landed Cost and Duty Optimisation
  • Trade Documentation and Certification

By End-Use Industry

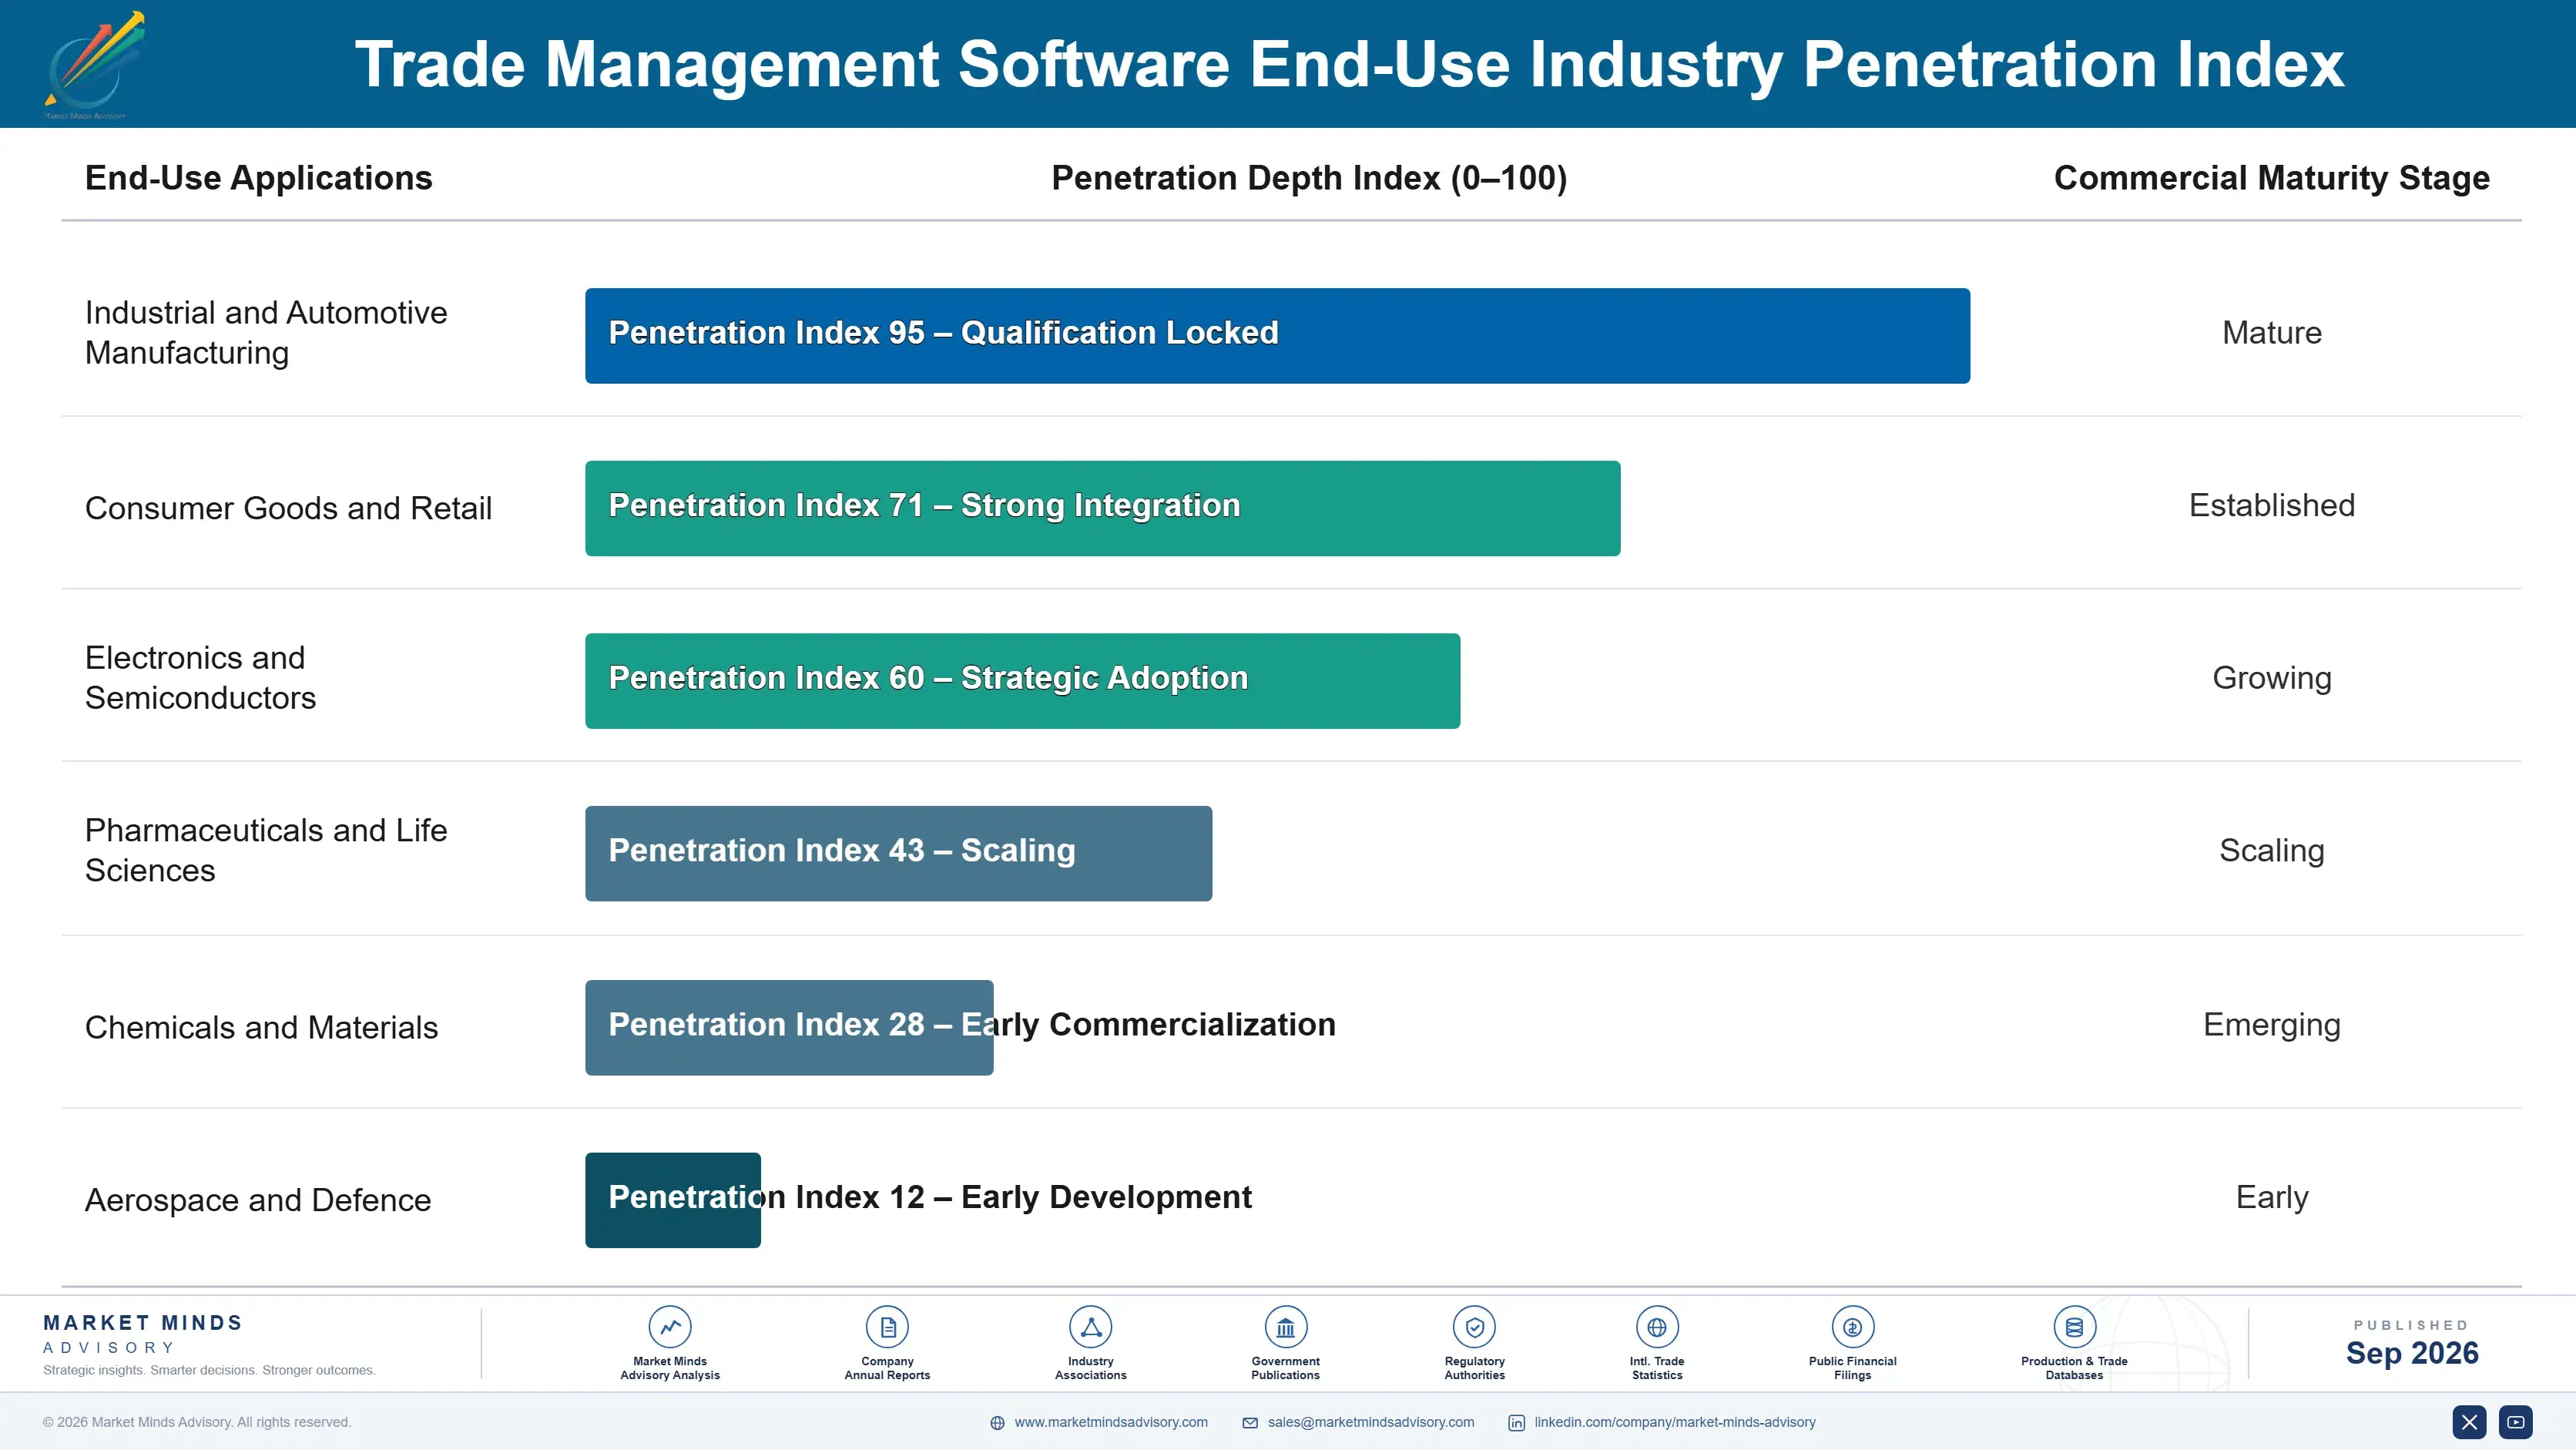
  • Industrial and Automotive Manufacturing
  • Consumer Goods and Retail
  • Electronics and Semiconductors
  • Pharmaceuticals and Life Sciences
  • Chemicals and Materials
  • Aerospace and Defence

By Deployment Route and Buying Function

  • Enterprise Platform Modules
  • Specialist Vendor Applications
  • Broker and Forwarder Provided
  • Trade Compliance Procurement
  • Finance and Treasury Procurement
  • Managed Compliance Services

By Region

  • North America
  • Western Europe
  • East Asia
  • South Asia and Pacific
  • Latin America
  • Middle East and Africa
  • Eastern Europe

Scope, Methodology, and Coverage

Every figure in this report is reproducible from documented input assumptions. The scope below maps the historical period, the forecast horizon, the segmentation dimensions, and the countries covered, alongside the underlying primary and qualitative methodology.
Historical Period
2020 to 2025
Forecast Period
2026 to 2036
Base Year
2025 (USD billions; MMA Primary Research Dataset, September 2026)
Market Definition
The trade management software market covers applications that govern cross-border movement of goods, spanning customs filing and declaration, product classification and tariff management, free trade agreement and origin management, export control and sanctions screening, landed cost and duty optimisation, and trade documentation and certification. Sizing is measured at vendor licence, subscription and maintenance revenue. Freight forwarding services, customs brokerage execution, transportation management, warehouse systems, tax determination for domestic transactions and consulting delivery are excluded.
Quantitative Units
USD billions at vendor licence, subscription and maintenance revenue, with supporting customer counts and jurisdictional coverage by region
Segmentation Dimensions
Functional module, end-use industry, deployment route and buying function, region
Regions Covered
North America, Western Europe, East Asia, South Asia and Pacific, Latin America, Middle East and Africa, Eastern Europe
Countries Covered
United States, Canada, Mexico, Brazil, Germany, Netherlands, United Kingdom, France, Belgium, Poland, Czech Republic, China, Japan, South Korea, Vietnam, India, Australia, United Arab Emirates
Key Companies Profiled
SAP, Descartes Systems Group, Oracle, e2open, WiseTech Global, MIC Customs Solutions, AEB, Livingston International, Vertex, Avalara, BDP International, Aptean, Blue Yonder, Infor, Manhattan Associates, Shipsy, Kewill, 3rdwave, Trademo, Altana AI
Quantitative Methodology
Primary survey, n=3,800 respondents, Q4 2025, six countries; demand-side model with trade association cross-validation
Qualitative Methodology
47 expert interviews, Q4 2025; applied to validate demand model assumptions, identify emerging dynamics, and assess competitive positioning
Report Format
PDF and XLSX data workbook (Word format preview document)
Publisher
Market Minds Advisory
Report Code
MMA-2026-TEC-691
Published
September 2026
Contact
sales@marketmindsadvisory.com | www.marketmindsadvisory.com

Purchase the full Trade Management Software Market Report (2026 to 2036).

The full report models demand from enforcement activity rather than from trade volume, which is the framing that explains why this market grew steadily through years when goods movement did not. It sizes six functional modules with individual growth rates, seven regions built from enforcement intensity and trade complexity, and the preferential duty entitlement that goes unclaimed across most importers. Competitive analysis covers twenty vendors on a consistent licence and subscription revenue basis, with regulatory content ownership and finance buyer access treated as the decisive variables. Input cost modelling breaks out content maintenance and engineering exposure by jurisdictional coverage.
Six functional modules with individual growth rates
Enforcement activity modelled against purchase triggers
Unclaimed preferential duty quantified by agreement
Regulatory content cost mapped against jurisdiction coverage
Twenty vendors on consistent subscription revenue basis
Content maintenance and engineering cost exposure

Built For The People Who Decide

From boardroom strategy to bench-side execution, this report is read cover-to-cover by leaders shaping the next decade of their industry, turning demand scenarios, market dynamics and valuation benchmarks into decisions.
CXOs/ Presidents/ VPs/ Managers
M&A and Corporate Development
Strategy Teams and R&D Heads
Procurement and Product Directors
Regulatory and Compliance Leaders
Investor Relations and Equity Analysts