Market Minds Advisory
Total Carbon Analyzers Market

Total Carbon Analyzers Market: Total Carbon Analyzers Market. Ultrapure Water Standards Force a Precision Instrumentation Upgrade

Semiconductor fabs and pharmaceutical water systems now demand parts-per-billion carbon detection, pushing instrument makers still selling laboratory-grade analyzers toward continuous, in-line monitoring platforms that plant operators can trust without manual sampling.

Lead Analyst

Published

September 2026

Make Smarter Decisions with Customized Research Insights

Request a free sample report and evaluate market opportunities, growth trends, and competitive dynamics relevant to your business needs.

2025 MARKET VALUE$1.2BMarket Size 2025
2036 FORECAST VALUE$2.4BBase Case , 2026 to 2036
CAGR 2026 TO 20366.6 %Bull 7.9% / Bear 5.3%
INCREMENTAL OPPORTUNITY$1.1BNet 10- year value creation
EXPANSION MULTIPLE1.90x2036 value over 2026 base
Strategic Levers
M&A Pipeline
Regional Outlook
Country Rankings
Competitive Intelligence
Segmental Deep-dive
Call-Us : 91 93563 13602

Executive Snapshot and Market Trajectory.

Semiconductor fabs today now specify carbon detection limits so tight that a single contaminated water batch can idle an entire production line worth many millions of dollars, turning total carbon analyzers into a genuine process-critical instrument rather than a periodic quality check performed occasionally by ordinary lab staff members.
Pharmaceutical manufacturers, water utilities, and semiconductor fabs together drive most demand, each pushing analyzer makers toward continuous online monitoring rather than grab-sample laboratory testing that catches contamination only after the fact and after real production damage has already occurred. East Asia's dense concentration of advanced semiconductor fabrication capacity and expanding municipal water infrastructure gives the region an outsized role in global instrument demand relative to its historical manufacturing base a decade ago.
Five vendors hold just over half of global unit sales, reflecting decades of accumulated analytical chemistry expertise that smaller entrants struggle to replicate quickly across every application segment served worldwide today and every year hereafter. Tightening pharmaceutical compendial standards and municipal water quality enforcement are pushing laboratories toward higher-sensitivity instruments, a shift that favors established vendors with proven detection performance over newer, less-proven suppliers.
Market Definition
The total carbon analyzers market covers laboratory and online instruments that measure total organic carbon, total inorganic carbon, and total carbon in water, wastewater, and process fluid samples through combustion or oxidation-based detection methods. It excludes general water quality sensors measuring parameters such as pH, conductivity, or turbidity alone.
Base Year Value
$1.2B in 2025 (MMA Primary Research Dataset, September 2026)
Forecast Period
2026 to 2036, eleven discrete annual values
CAGR
6.6% base case. Bull 7.9%. Bear 5.3%.
Fastest Growth Segment
Online/In-Line Process TOC Analyzers: 9.9% CAGR
Fastest Growth Country
South Korea: 8.8% CAGR
Fastest Growth Region
South Asia and Pacific: 8.6% CAGR
Largest Region
East Asia: 29% of 2025 global value
Market Leaders
Shimadzu, Teledyne Tekmar, Sievers, Thermo Fisher Scientific, and Metrohm lead the market. Source: MMA Primary Research Dataset, July 2026.
Primary Survey
n=3,800 procurement and R&D decision-makers, Q4 2025, six countries
Methodology
Demand-side build-up, cross-validated against public data, 47 expert interviews

Total Carbon Analyzers Market Forecast Scenarios

total-carbon-analyzers-market-size-forecast-scenario-1790002749599
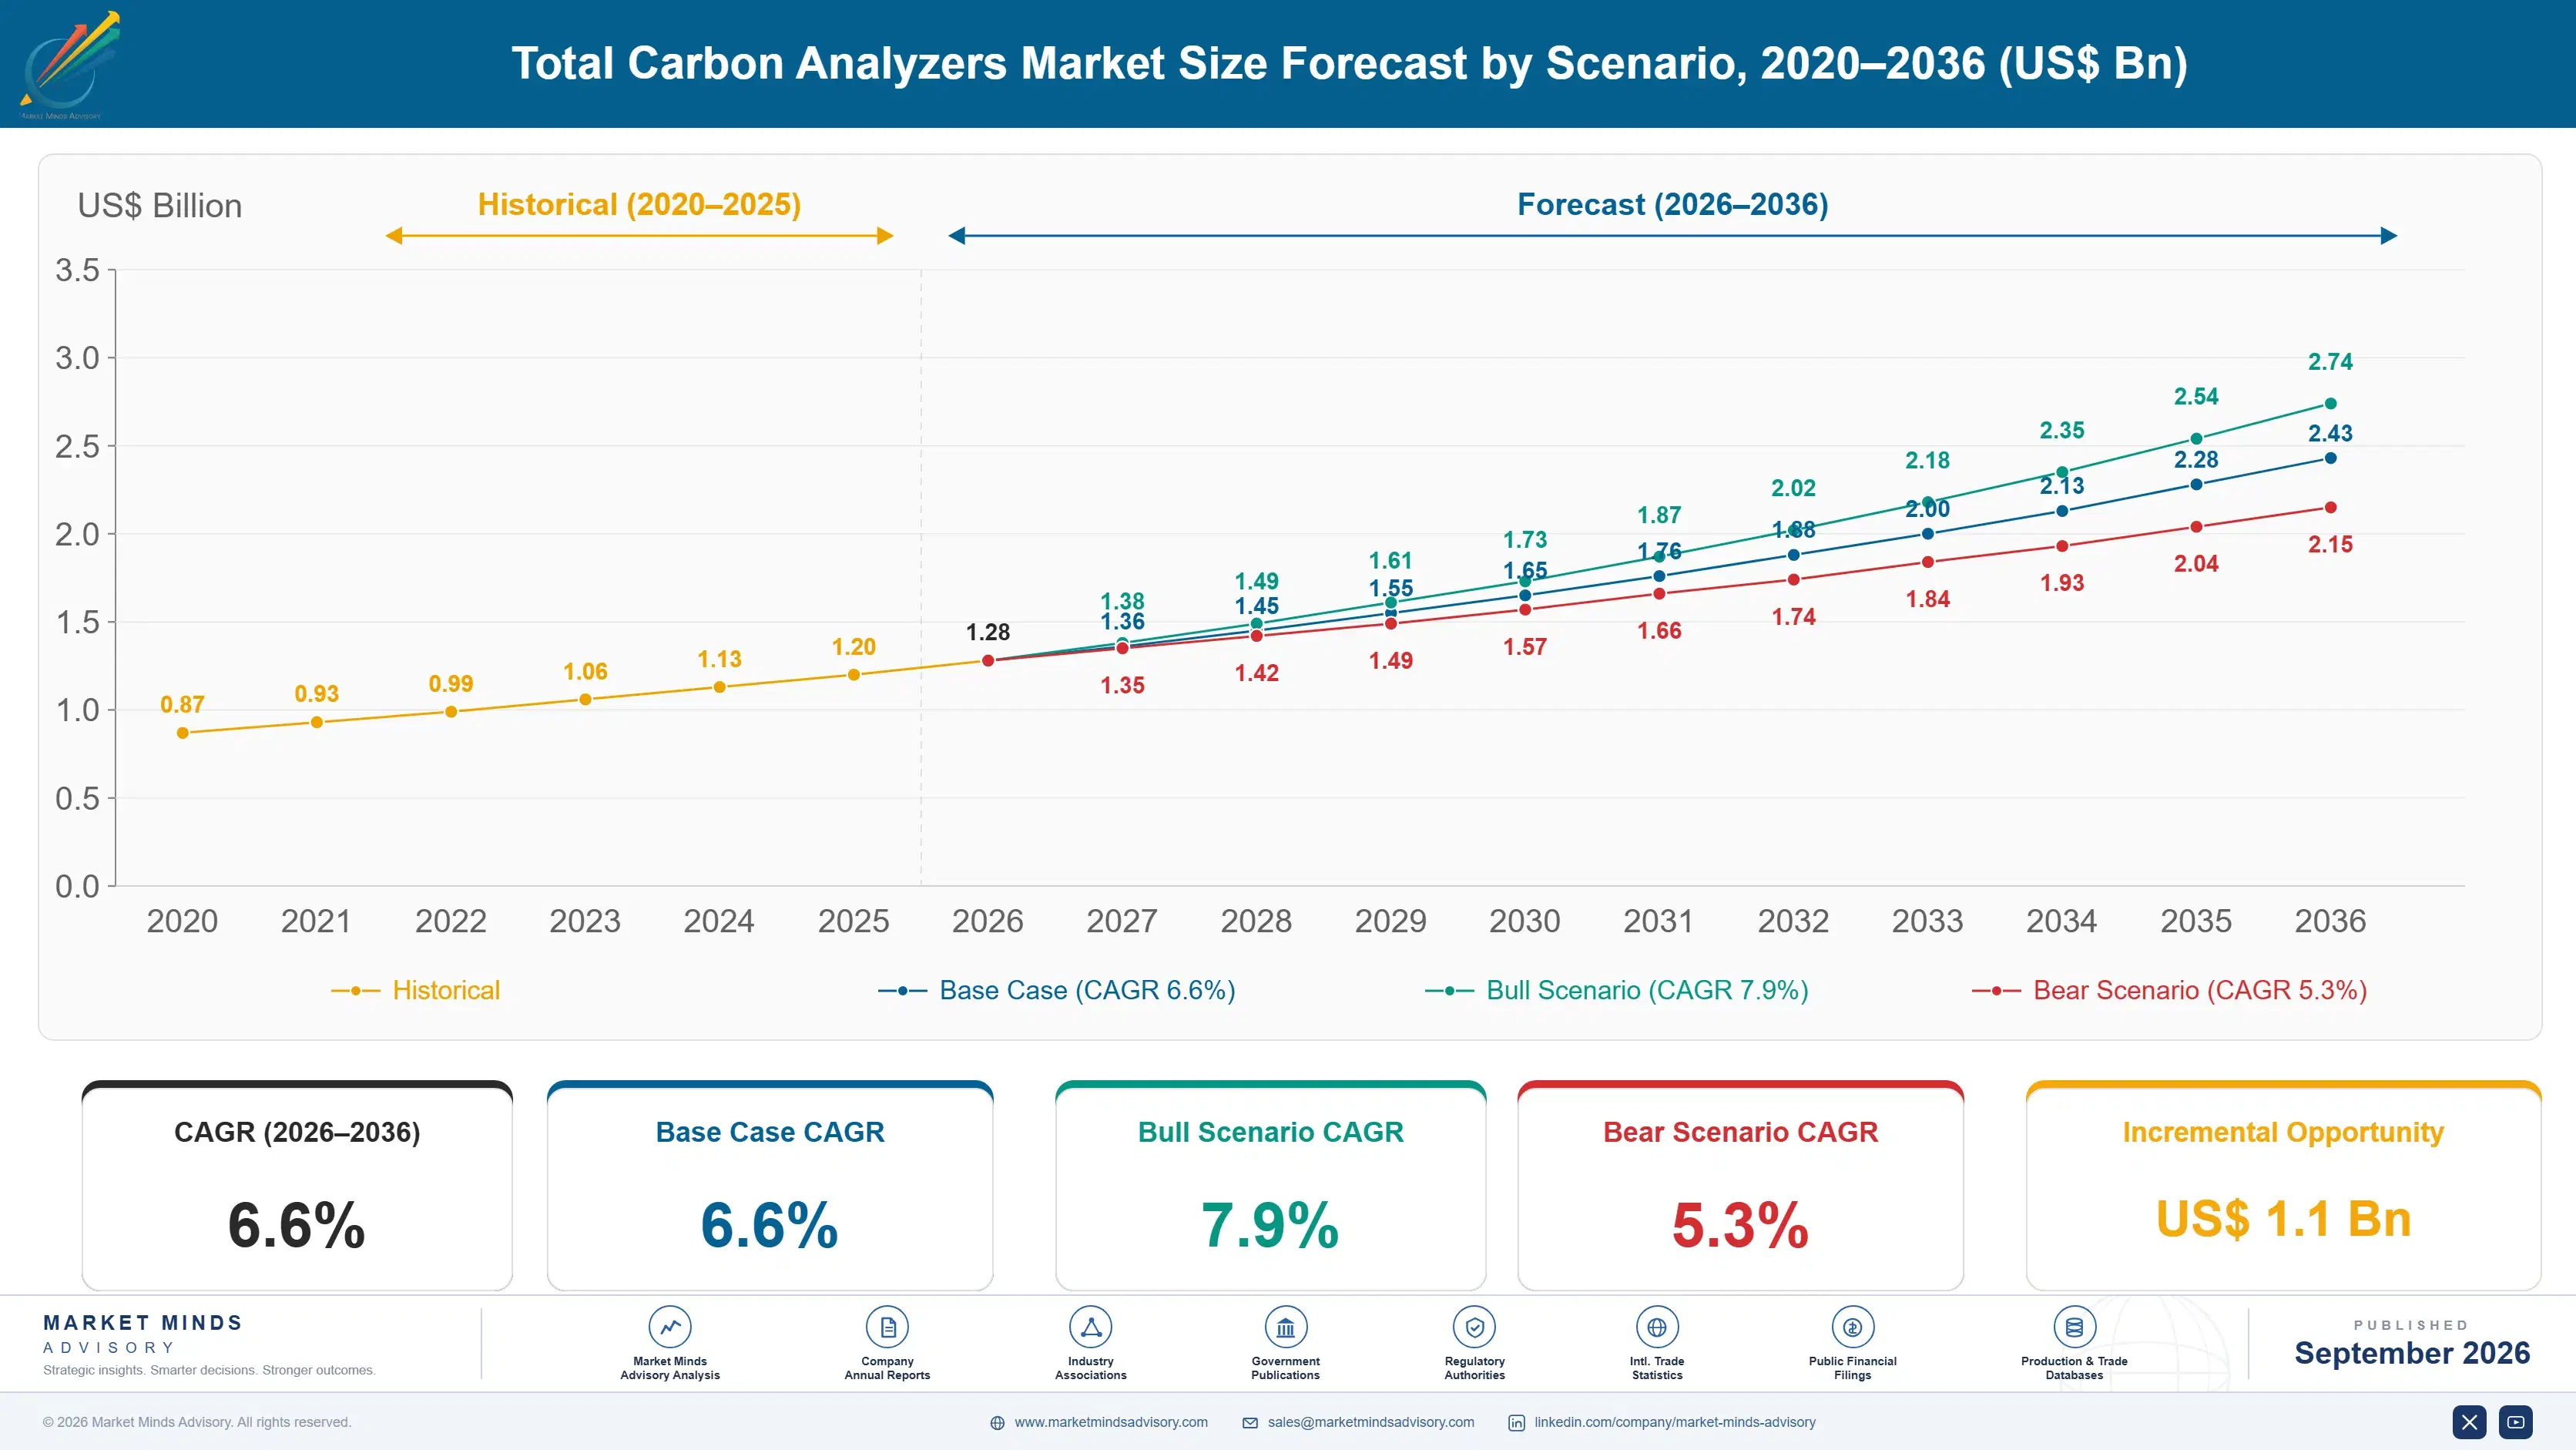
Between 2020 and 2025 the market grew at roughly 5.7% a year as pandemic-era laboratory shutdowns and delayed capital equipment purchases slowed early replacement cycles before a strong rebound in semiconductor fab construction and pharmaceutical manufacturing capacity pulled demand forward again through the back half of the period across most major producing regions worldwide, particularly across East Asia.
The base case assumes 6.6% annual growth through 2036, built on three mechanisms: expanding semiconductor fabrication capacity requiring ultrapure water monitoring at parts-per-billion sensitivity levels across every single process step, tightening pharmaceutical compendial standards mandating more frequent total organic carbon testing across manufacturing water systems worldwide, and municipal water utilities upgrading from periodic laboratory sampling toward continuous online monitoring following contamination incidents that drew significant regulatory attention in recent years.
A bull case near 7.9% follows if additional semiconductor fabrication capacity investment accelerates well beyond currently announced projects across East Asia and North America over the coming several years and beyond that horizon. The principal bear risk, a broad slowdown in capital equipment spending across the semiconductor and pharmaceutical industries simultaneously, would instead pull growth toward 5.3%.

Total Carbon Analyzers Market Overview

Total carbon analyzers sit at the point where a semiconductor wafer or pharmaceutical batch either passes quality control or gets scrapped entirely, and that intersection has pushed a once-simple wet chemistry instrument toward extraordinary detection precision. Buyers no longer choose an analyzer purely on carbon range. They increasingly demand parts-per-billion sensitivity, continuous online operation, and validated performance documentation that satisfies both internal quality teams and external regulators.
MARKET CONCENTRATIONCR5 54%Top five vendors hold just over half of global sales
AVERAGE SELLING PRICE$8,500-45,000Price spans benchtop laboratory units to online process analyzers
LEADING PRODUCING COUNTRYJapan, 26% shareJapanese manufacturers concentrate premium analytical instrument production capacity
DETECTION LIMIT STANDARDSub-1 ppb carbonSemiconductor-grade applications demand extremely sensitive carbon detection capability today
TRADE INTENSITY44% import shareMost national markets rely heavily on imported precision instruments
INPUT COST SHARE41%Optical detectors and combustion furnace components dominate unit cost
Japan hosts a disproportionate share of premium instrument manufacturing, reflecting decades of analytical chemistry expertise concentrated among a handful of established instrument makers with global reach. East Asia more broadly is the largest single demand pool by volume, driven by extensive semiconductor fabrication capacity requiring ultrapure water monitoring and a growing pharmaceutical manufacturing base expanding steadily across the region.
Detection limit requirements have tightened considerably as chip geometries shrink and contamination tolerances fall correspondingly, forcing instrument makers to compete on genuine analytical performance rather than price alone in the premium segment of the broader market. Import dependence remains high across most national markets, since precision analytical instrumentation manufacturing concentrates in a small number of established production centers worldwide.
"A total carbon analyzer used to be a lab technician's problem. Now it's a fab manager's problem, because a missed reading doesn't mean a bad report, it means a scrapped wafer lot."
Director, Analytical Instrumentation Practice · MMA Technology Practice · September 2026

Market Trends

Continuous online monitoring replaces periodic grab-sample testing

Semiconductor fabs and pharmaceutical manufacturers are increasingly installing in-line total organic carbon analyzers directly into process water loops rather than relying on periodic grab samples sent to a central laboratory for testing days later on end. This shift catches contamination events in real time rather than hours or days after the fact, when a contaminated batch has already moved further through production. Instrument makers are responding with ruggedized, self-calibrating platforms designed for continuous operation in industrial environments rather than controlled laboratory conditions, a meaningfully different engineering challenge than benchtop instrument design.
Market Impact: 40 billion dollar fab capex

Sub-part-per-billion detection becomes standard for advanced nodes

Leading-edge semiconductor manufacturing nodes require ultrapure water carbon contamination levels below one part per billion, a detection threshold that only the most sensitive current instrument platforms can reliably achieve under real, sustained production conditions today across the entire global industry worldwide. Fabs building capacity for the most advanced chip generations increasingly specify analyzers with validated performance at these extreme sensitivity levels as a non-negotiable procurement requirement rather than a nice-to-have feature. This has concentrated leading-edge fab business among a smaller group of instrument makers capable of meeting the specification reliably.
Market Impact: 3,200 pharma facilities require upgrades

Market Opportunities and Growth Drivers

Global semiconductor fabrication capacity expansion accelerates instrument demand

Semiconductor manufacturers are building new fabrication facilities across East Asia and North America at a pace not seen in over a decade, driven by national subsidy programmes and reshoring initiatives aimed at securing domestic chip supply chains for the long term. Every new fab requires an ultrapure water treatment system with total organic carbon monitoring integrated at multiple points throughout the process, generating first-time instrument demand independent of ordinary replacement cycles. Taiwan, South Korea, and the United States have all announced major fab construction projects requiring this instrumentation over the next several years.
Market Impact: 38,000 dollar average premium unit cost

Pharmaceutical compendial standards tighten total organic carbon limits

Pharmacopeial standards governing water used in pharmaceutical manufacturing continue tightening acceptable total organic carbon limits year after year, requiring manufacturers to upgrade testing infrastructure to maintain compliance across their production facilities worldwide and avoid costly regulatory citations during routine inspections. Regulatory bodies in the United States, Europe, and increasingly in China are aligning testing requirements more closely, creating consistent global demand for validated instrumentation rather than fragmented regional specifications from country to country. Pharmaceutical manufacturers failing to demonstrate compliant testing face production delays and potential regulatory action against their operating facilities.
Market Impact: 22% higher operating cost without training

Market Restraints and Challenges

High instrument acquisition cost limits smaller laboratory adoption

Premium total carbon analyzers capable of parts-per-billion detection carry acquisition costs well beyond what smaller contract laboratories and municipal water utilities can readily justify against their available capital budgets each fiscal year without external financing support of some kind. The root cause is that achieving extreme sensitivity requires precision optical and combustion components that cannot be manufactured at lower cost without compromising detection performance meaningfully across the board. Several manufacturers have introduced instrument leasing and pay-per-test service models to lower the up-front cost barrier for laboratories that cannot justify full ownership.
Market Impact: 45% of new units now inline

Calibration and maintenance complexity requires specialized technical staff

Precision total carbon analyzers require regular calibration against certified reference standards and periodic maintenance by technically trained staff, a genuine resource constraint for smaller laboratories operating without dedicated instrumentation specialists on site at all times of day. The underlying cause is that combustion and detection components drift gradually over time, and improper calibration produces results that appear valid but are quietly inaccurate in practice and go undetected for weeks. Several manufacturers now offer remote diagnostic monitoring that flags drift before it affects reported results, reducing reliance on scheduled in-person service visits.
Market Impact: Sub-1 ppb detection now required
4 additional market trends, 3 additional growth drivers, and 3 additional restraints and challenges are covered in the full report. Contact sales@marketmindsadvisory.com to access the complete intelligence.

Segment CAGR and Growth Architecture

Total carbon analyzers segment cleanly by deployment mode and detection method, the two dimensions that determine both application fit and price for any given laboratory or plant. This framework separates benchtop laboratory analyzers, portable field analyzers, online/in-line process analyzers, combustion-based systems, UV/persulfate oxidation-based systems, and multi-parameter combination platforms, avoiding overlap between hardware configuration and end-use application.
Section default visual

Online/In-Line Process TOC Analyzers

Online/in-line process analyzers are pulling ahead of every other configuration as semiconductor fabs and pharmaceutical manufacturers convert what was once periodic quality assurance testing into continuous, real-time process control across their entire operations and global supply chains alike today. These units integrate directly into water treatment and process loops, providing constant measurement rather than the point-in-time snapshot a laboratory grab sample delivers hours or days later after the batch has already moved forward through subsequent processing steps. Fabs and manufacturers favor this configuration because it catches contamination events immediately, before an entire production batch or wafer lot is compromised and must be scrapped at significant cost to the business overall.
CAGR 9.9%

Benchtop Laboratory Analyzers

Benchtop laboratory analyzers remain the largest single configuration by installed base worldwide today, continuing to serve environmental testing labs, municipal water utilities, and quality control departments that require flexible, multi-sample throughput rather than dedicated single-point process monitoring equipment installed permanently on a production line somewhere on the facility floor. Their appeal lies in versatility across a wide range of sample types and detection ranges within a single instrument, a genuine advantage for contract laboratories serving diverse client bases across many different industries simultaneously and cost-effectively year round without interruption. Regulatory compliance testing across water utilities and pharmaceutical quality control departments continues generating steady replacement demand for this established, proven configuration.
CAGR 5.4%
Full segment breakdown across 7 segments available in the complete report.

Regional Architecture and Country Demand Map

East Asia leads on the strength of dense semiconductor fabrication capacity requiring ultrapure water monitoring at extreme sensitivity levels across every process step, while North America and Western Europe follow closely behind on established pharmaceutical manufacturing bases and mature municipal water quality regulatory regimes overall.

East Asia

Taiwan, South Korea, and China together host the densest concentration of advanced semiconductor fabrication capacity in the world, and each new leading-edge fab requires ultrapure water monitoring at sensitivity levels most other industries never encounter in ordinary operations. Japanese instrument manufacturers supply a substantial share of this regional demand directly, benefiting from proximity to major fab customers and decades of analytical chemistry expertise built domestically over many years. China's expanding pharmaceutical manufacturing base and municipal water treatment infrastructure investment add a second, faster-growing demand layer behind the region's already dominant semiconductor-driven instrument purchasing volume, which continues to accelerate steadily year over year. Ongoing five-nanometer and three-nanometer node investment across the region keeps this demand pool expanding for the foreseeable future.
Share: 29% | CAGR: 7.6% (2026 to 2036)

North America

The United States hosts a large and diversified pharmaceutical manufacturing base subject to strict compendial water testing standards, alongside a growing number of new semiconductor fabrication projects backed by federal subsidy programmes aimed at reshoring domestic chip production capacity. Municipal water utilities across major metropolitan areas are gradually upgrading from periodic laboratory sampling toward continuous online monitoring following several high-profile contamination incidents that drew significant regulatory scrutiny in recent years. Canadian pharmaceutical and water treatment demand adds modest incremental volume behind the much larger American market, growing at a broadly comparable pace across most product categories. Federal infrastructure funding aimed at aging water systems adds a further incremental layer of demand across many states.
Share: 27% | CAGR: 7.2% (2026 to 2036)
Regional intelligence for 5 additional markets available in the complete report: Western Europe, South Asia and Pacific, Latin America, Middle East and Africa, Eastern Europe. Contact sales@marketmindsadvisory.com.
total-carbon-analyzers-market-market-share-analysis-1790002750507

Where Margin Concentrates in Carbon Analysis

Manufacturers capture the widest margins where extreme detection sensitivity becomes a non-negotiable specification requirement rather than a nice-to-have feature, and where installed instruments generate recurring service or consumables revenue well beyond the original equipment sale itself, year after year. Four levers stand out as the clearest paths to expanding gross margin over the coming decade ahead.

Bundle remote diagnostics into instrument service contracts

Manufacturers that pair a connected analyzer with a paid remote diagnostic monitoring subscription capture recurring revenue well beyond the original equipment transaction, transforming a one-time capital purchase into an ongoing commercial relationship with the customer laboratory or plant. Leading vendors have expanded cloud dashboards that flag calibration drift before it produces inaccurate results, cutting unplanned downtime for customers substantially compared with scheduled in-person service alone. Semiconductor fabs running continuous process monitoring find the reliability assurance attractive enough to accept a service fee that raises blended margin by roughly 10 percentage points.
Market Impact: 10 percentage point blended margin uplift from services

Win exclusive qualification on leading-edge fab specifications

Securing formal qualification on a leading semiconductor manufacturer's approved vendor list for advanced process nodes locks in multi-year volume and effectively excludes competitors from that specific fab's procurement process entirely for the full contract term and beyond. Semiconductor manufacturers increasingly standardize instrumentation across multiple fabrication facilities once a vendor proves reliable performance at the most demanding detection thresholds required for advanced nodes. Manufacturers that invest early in qualification testing typically hold their position for the full duration of that fab's operating life, worth an estimated 18% revenue premium over spot equipment sales.
Market Impact: 18% revenue premium earned on qualified fab contracts

Sell certified consumables and calibration standards directly

Manufacturers selling certified reference standards and combustion consumables directly to instrument owners, rather than ceding this recurring revenue to third-party chemical suppliers, capture margin on every single calibration cycle throughout an instrument's entire operating life span across many years of use. This model also strengthens customer relationships, since certified consumables tied to a specific instrument platform create switching costs that pure hardware competition alone does not generate for competitors seeking market entry. Vendors operating direct consumables programmes report gross margins on this revenue stream near 60%, well above typical hardware margins.
Market Impact: 60% gross margin achieved on certified consumables sales

License validated methods to regulatory compliance software platforms

Compliance software platforms used by pharmaceutical and water utility quality teams increasingly pay instrument manufacturers for validated testing method libraries that integrate directly with laboratory information management systems used across a facility's operations. This creates a software-like revenue stream layered on top of the original hardware sale, carrying margins that substantially exceed those available on the physical instrument itself. Early adopters of this model report that method licensing revenue, while still a modest share of total sales, carries gross margins above 68% and grows independently of new unit shipment volume.
Market Impact: 68% gross margin achieved on method licensing revenue

Who Controls the Margin Pool

Five manufacturers, measured by unit shipment volume, hold roughly 54% of global total carbon analyzer sales, leaving the remainder split among specialist instrument makers and regional laboratories equipment suppliers. Shimadzu and Teledyne Tekmar lead this group with the broadest validated product ranges across semiconductor, pharmaceutical, and municipal water applications, and the gap to the third-ranked player is wide enough that challengers compete mainly for the remaining mid-tier and specialist segments.
Current competitive activity centres on detection sensitivity and validated performance documentation, with manufacturers racing to certify instruments against the strictest semiconductor and pharmaceutical specification thresholds. Several producers have added remote diagnostic and calibration monitoring capability to previously standalone hardware, letting a single sales relationship cover both equipment and ongoing service revenue.

Emerging pressure is coming from Chinese domestic instrument manufacturers entering pharmaceutical and municipal water tenders at prices below incumbent levels, testing whether validated performance requirements are strict enough to keep them confined to lower-sensitivity applications. Rankings are most likely to shift in Latin America and parts of South Asia, where budget constraints give new entrants a genuine opening that incumbents in premium semiconductor-grade applications do not face.
total-carbon-analyzers-market-country-cagr-analysis-1790002751446

Competitive Moat and Risk Dimensions

SHIMADZU

Moat: Deep semiconductor fab qualification base

Shimadzu has qualified its instruments across a broad base of leading semiconductor fabrication facilities globally, a process that typically takes years and creates real switching costs once a fab standardizes on a specific platform. This qualification depth lets Shimadzu win specification battles on proven reliability even where competitors offer lower list prices on comparable hardware specifications.
SHIMADZU

Risk: Slower pharmaceutical market penetration

Shimadzu's brand strength concentrates more heavily in semiconductor and industrial applications than in pharmaceutical compendial testing, leaving room for competitors with deeper pharmaceutical industry relationships to win specification battles in that specific vertical. Building comparable pharmaceutical credibility requires sustained investment in validation documentation and industry relationships.
TELEDYNE TEKMAR

Moat: Broad application-specific product portfolio

Teledyne Tekmar offers one of the widest ranges of application-specific analyzer configurations spanning environmental, pharmaceutical, and industrial process monitoring applications across nearly every major vertical, letting distributors and large customers consolidate purchasing with a single vendor across multiple internal departments and diverse use cases company-wide.
TELEDYNE TEKMAR

Risk: Integration complexity across acquired brands

Teledyne Tekmar's portfolio breadth partly reflects a history of acquisitions made over many years, and integrating differing product architectures and software platforms under one coherent brand remains an ongoing internal challenge that can slow new product development relative to more focused single-platform competitors with narrower but deeper expertise.

Players Tracked

Prominent Players

Shimadzu
Teledyne Tekmar
Sievers (Veolia Water Technologies)
Thermo Fisher Scientific
Metrohm

Other Key Players

Hach
Elementar Analysensysteme
LAR Process Analysers
Analytik Jena
Emerson (Rosemount Analytical)
Xylem
Skalar Analytical
Mettler Toledo
Horiba
PerkinElmer
Agilent Technologies
Yokogawa Electric
Hitachi High-Tech
Envirotech Instruments
Focused Photonics

Recent Developments

APRIL 2026

Shimadzu completed the acquisition of a South Korean analytical chemistry software firm specializing in automated compliance reporting for pharmaceutical and semiconductor customers, adding a purpose-built software layer rather than building equivalent functionality internally. The acquisition brings existing customer relationships across several major Korean semiconductor fabs into Shimadzu's network.
Signal: Instrument manufacturers are increasingly buying compliance software capability outright rather than building it internally from scratch each time.
NOVEMBER 2025

Teledyne Tekmar and a German consumables manufacturer signed a supply agreement giving Teledyne Tekmar exclusive access to certified reference standards optimized for its instrument platform, rather than sourcing generic consumables through third-party distributors. The agreement targets pharmaceutical customers seeking guaranteed calibration consistency across their testing programmes.
Signal: Exclusive consumables supply agreements are becoming a genuine competitive differentiator across this instrumentation market and its adjacent segments.

Optical and Furnace Component Cost Exposure

Optical detectors, non-dispersive infrared sensors, and combustion furnace components together account for roughly 41% of unit cost of goods sold, sourced primarily from specialized optics manufacturers concentrated in Japan and Germany, with combustion catalyst materials sourced from a smaller number of specialty chemical suppliers globally. Precision machined furnace housings, sourced more regionally, add a further meaningful cost layer.
Rare earth catalyst material price volatility during 2023 and 2024, documented in the International Energy Agency's critical minerals market review and multiple company annual reports covering that period, forced several instrument manufacturers to redesign combustion cartridges around alternative catalyst formulations with different performance characteristics and cost structures. Producers unable to secure long-term supply contracts faced extended lead times on catalyst-dependent components throughout much of this period.

Smaller manufacturers carry disproportionately more of this exposure because they lack the volume commitments and direct optics manufacturer relationships that larger competitors use to secure priority allocation and preferential pricing. Vendors dependent on distributor channels rather than direct component sourcing relationships face longer lead times and higher per-unit costs, a persistent disadvantage that compounds during periods of genuine component scarcity across the industry.
total-carbon-analyzers-market-company-positioning-matrix-1790002751777

Qualify alternative catalyst formulations across two chemistries

Manufacturers increasingly qualify combustion catalysts based on both rare earth and alternative metal chemistries rather than relying on a single formulation, reducing exposure to any one material's price volatility across the supply chain. Shimadzu and Teledyne Tekmar have both expanded qualified catalyst options for this exact reason in recent product generations released to market.

Hold strategic optics inventory ahead of known demand cycles

Some manufacturers now hold larger safety stock of critical optical components ahead of known demand spikes tied to semiconductor fab construction announcements, accepting higher working capital cost in exchange for reduced exposure to sudden allocation shortages during periods of scarcity. This approach requires accurate forecasting of fab construction timelines well in advance of actual orders.

Portfolio Architecture for Margin Defence

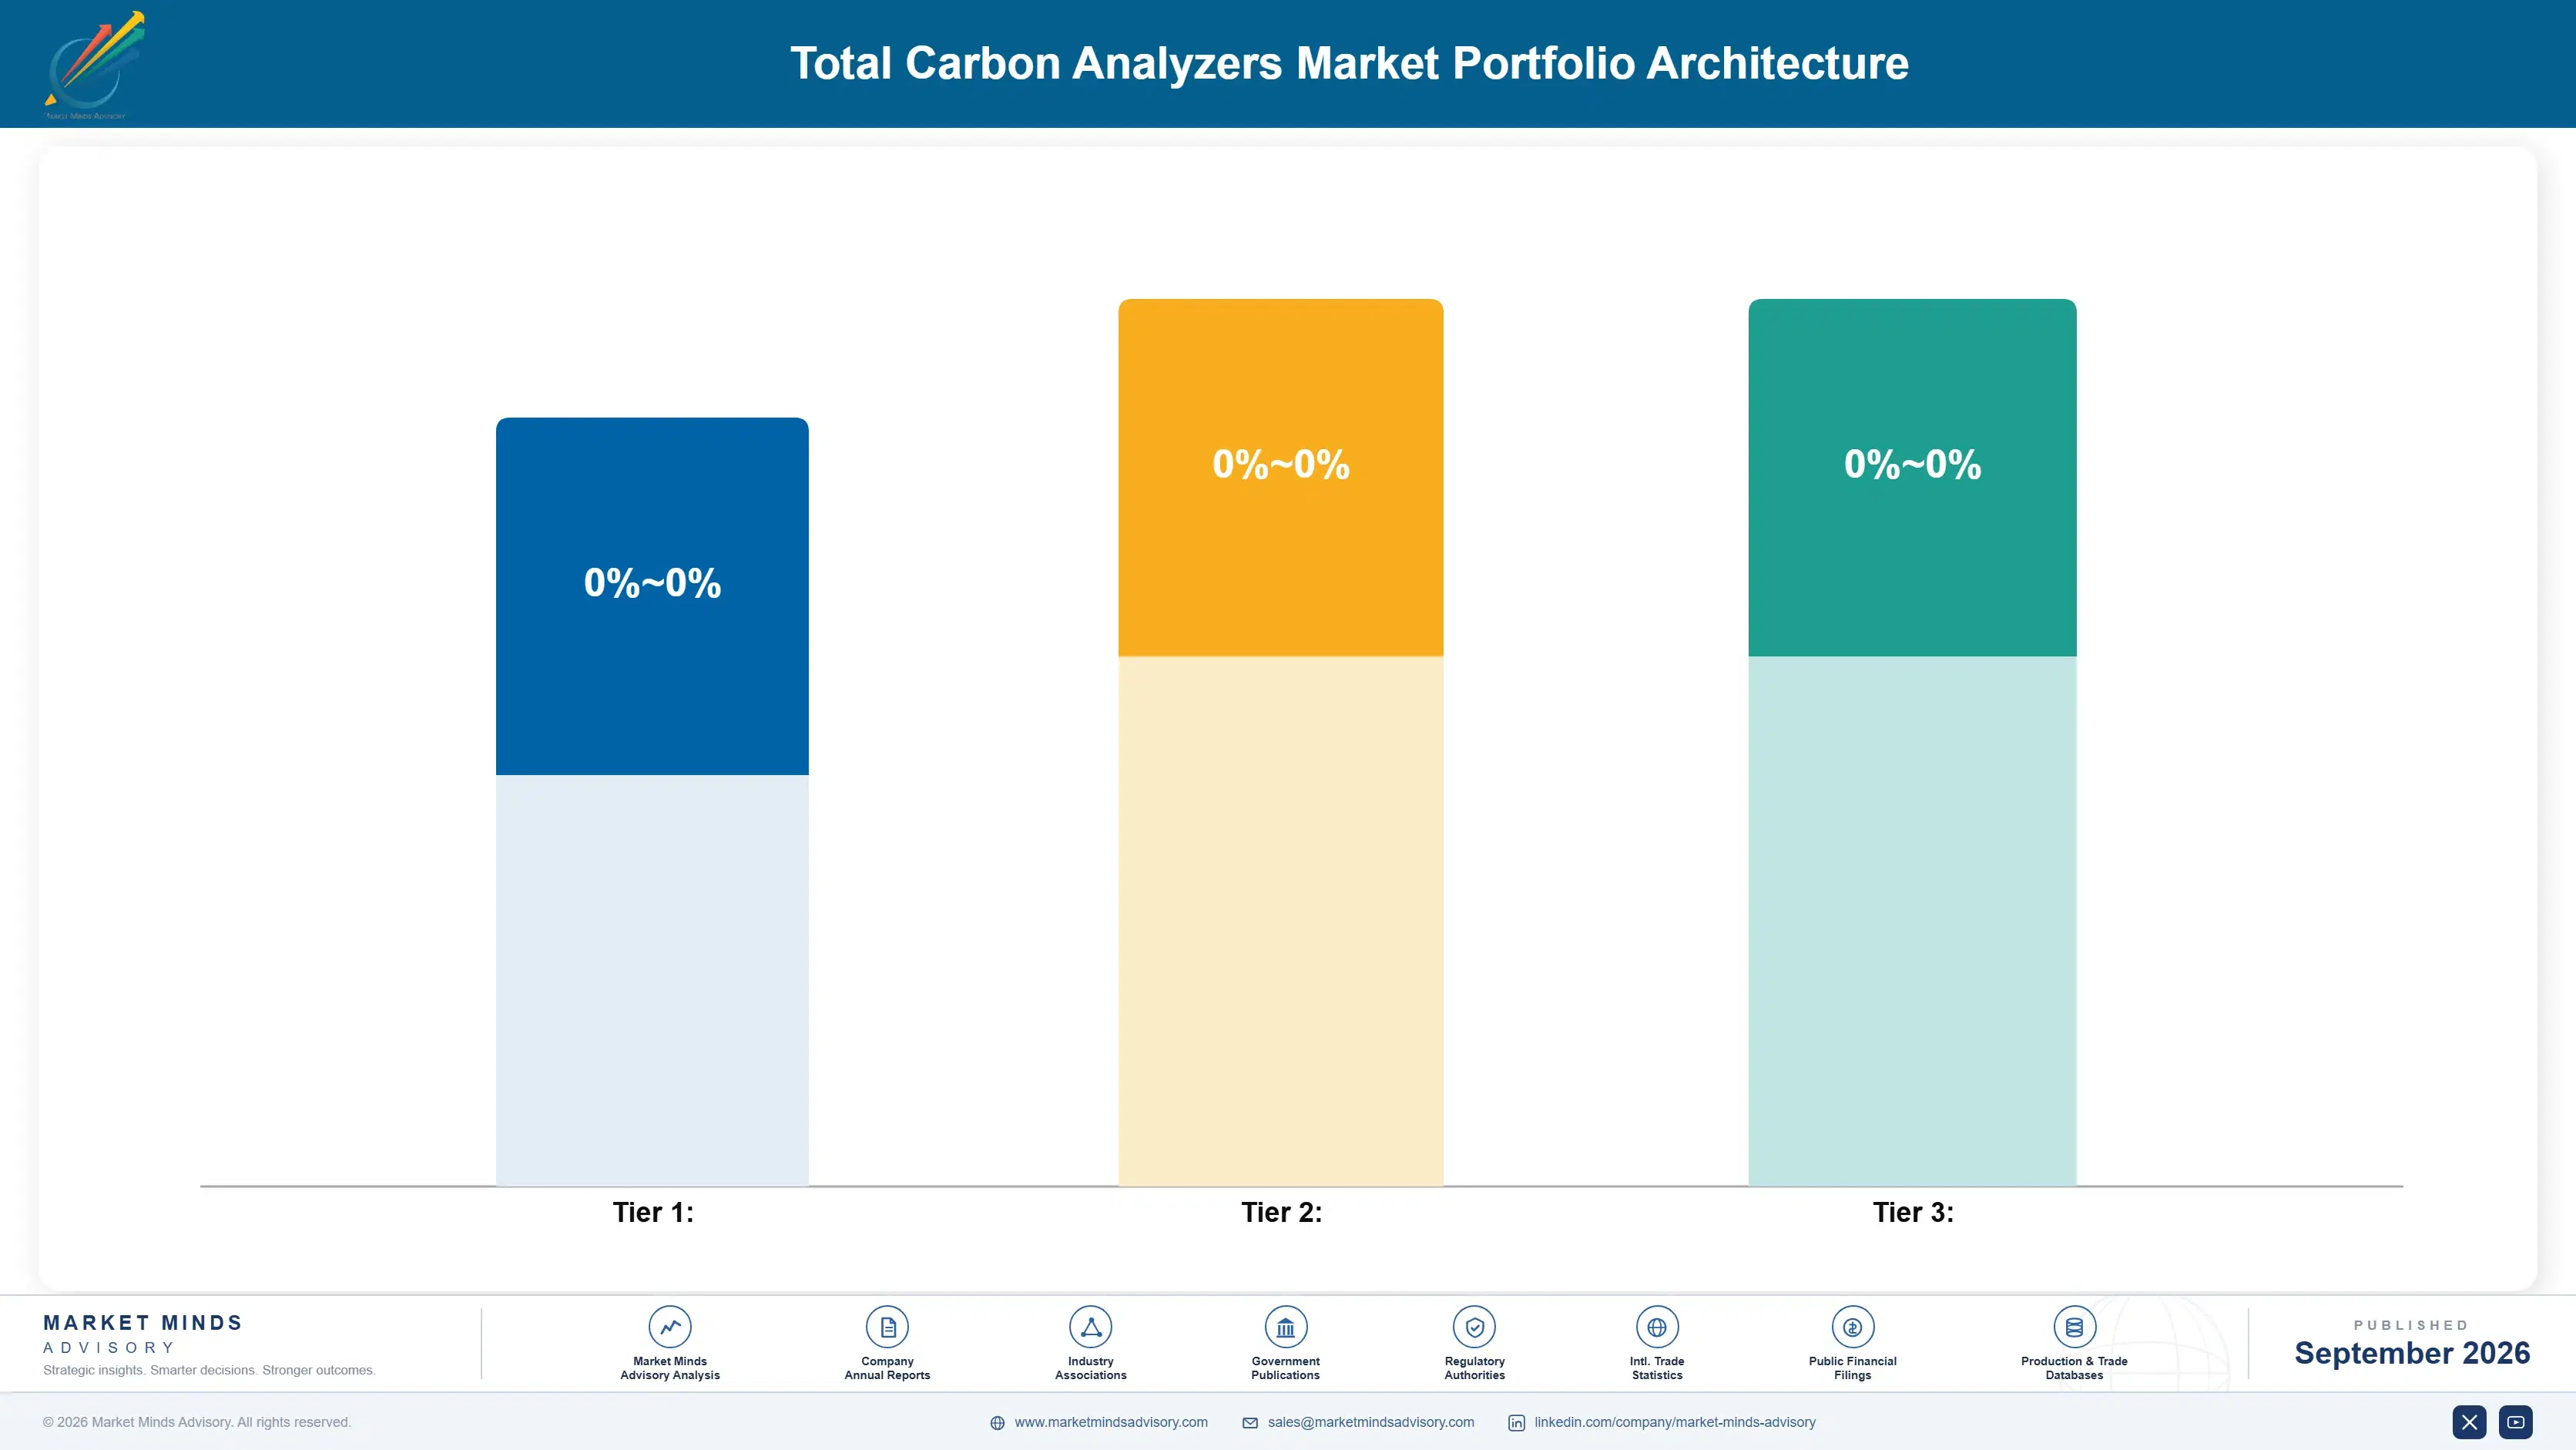
Manufacturers organize product portfolios across three margin tiers that mirror how customers actually buy instrumentation, ranging from basic benchtop analyzers purchased for routine compliance testing to fully validated, ultrasensitive systems specified for semiconductor fabrication regardless of cost. Volume tier products carry the thinnest margins but the highest unit sales, while certified premium systems command significantly higher prices from customers that prioritize validated detection performance over sticker price.
The tension between volume and premium tiers shows up most clearly in pharmaceutical customer purchasing behavior, where routine compendial testing keeps basic units selling steadily even as leading manufacturers push toward continuous online monitoring alternatives. High-value margin pools concentrate disproportionately in semiconductor fabrication procurement, where extreme sensitivity requirements and long-term service contracts justify premium pricing that ordinary laboratory customers would resist paying.

Next-generation product lines integrating sub-part-per-billion detection with continuous online operation are still a small share of total revenue but carry the highest margins in the entire portfolio, reflecting genuine technical differentiation rather than brand premium alone. Manufacturers investing here are positioning for a future where leading-edge semiconductor manufacturing makes basic detection sensitivity effectively obsolete for advanced applications.

Basic benchtop analyzers sold primarily on price to smaller contract laboratories and municipal water testing facilities with routine compliance testing needs and modest sensitivity requirements, purchased mainly for infrequent sample batches.
Gross Margin

Validated, high-sensitivity systems specified by pharmaceutical manufacturers and larger water utilities that must demonstrate documented compliance with tightening compendial and regulatory standards consistently across every production batch tested each month.
Gross Margin

Sub-part-per-billion online systems built for leading-edge semiconductor fabrication facilities, positioned for a manufacturing environment that increasingly treats extreme detection sensitivity as mandatory rather than optional for advanced process nodes worldwide.
Gross Margin
total-carbon-analyzers-market-cost-volatility-analysis-1790002752661

High-value Sub-segments and Strategic Watch-out

Online/In-Line Process TOC Analyzers

High-value and high-growth simultaneously, this segment benefits from both semiconductor fabrication expansion and pharmaceutical continuous monitoring adoption, commanding premium pricing while adding unit volume faster than any other configuration in the entire market today across nearly every tracked region worldwide. Manufacturers are prioritizing this configuration in future product development plans.

Benchtop Laboratory Analyzers

High-value with moderate but steady growth, benchtop systems carry solid margins tied to versatility across sample types, expanding gradually as contract laboratories and municipal utilities maintain flexible multi-application testing capability across their operations and diverse client portfolios nationwide. These systems remain the entry point for most first-time instrument buyers globally.

Portable Field Analyzers

The volume core of certain application niches, generating steady unit sales even as growth trails online and premium benchtop alternatives, remaining essential for field sampling work where fixed installation is impractical or unavailable at the site being tested currently. Rental and leasing programmes are helping sustain volume in this category.

UV/Persulfate Oxidation-Based Systems

A strategic watch-out segment where growth depends heavily on which oxidation method dominant instrument makers standardize around next, creating demand that is real but sensitive to shifting technical preferences among leading manufacturers over time and across regions worldwide. Manufacturer investment decisions here carry outsized influence on segment trajectory.

Recurring Analytical Instrument Economics

Total carbon analyzers generate something close to annuity economics once a facility standardizes on a validated platform, because every batch of pharmaceutical water or every fabrication process step requires ongoing testing regardless of broader capital spending cycles. Replacement purchasing follows equipment obsolescence or a facility expansion decision rather than discretionary upgrade choices, giving manufacturers unusually predictable long-term revenue visibility across their installed base.
Adoption depth varies sharply by end-use vertical. Semiconductor fabs exhibit the deepest stickiness, having standardized instrumentation around specific validated platforms tied directly to process qualification documentation that discourages switching between vendors mid-production. Municipal water utilities show comparatively looser loyalty, frequently choosing equipment based on procurement cycle timing and budget availability rather than any fixed technical standard applied across their facilities.

A generational shift in buyer profile is underway as younger quality assurance managers, more comfortable evaluating cloud dashboards and automated compliance reporting than raw detection specifications, increasingly influence purchasing decisions once made almost entirely by senior analytical chemists. This shift favors vendors who can present a compelling software and data story alongside traditional instrument performance claims that dominated buying conversations for decades.
Section default visual

MMA Verdict on Carbon Analysis

These are among the four positions where our research anticipates prominent divergence between winners and laggards over the coming forecast period. Each is grounded in the demand model, the regulatory perimeter, and the announced capacity pipeline.
01 / FAB QUALIFICATION STRATEGY

Prioritize leading-edge fab qualification over broad market coverage

Manufacturers spreading development resources across every application segment equally risk losing the qualification race for leading-edge semiconductor fabs to competitors who focus engineering effort specifically on extreme sensitivity requirements demanded by advanced process nodes. Winning qualification on a single major fab's approved vendor list generates multi-year, high-margin revenue that dwarfs what broader but shallower market coverage typically delivers across ordinary accounts. The window to secure this position before competitors catch up on detection sensitivity is closing fast within the next several years.
02 / CONSUMABLES REVENUE STRATEGY

Bring certified consumables sales in-house rather than ceding them

Instrument manufacturers ceding certified reference standards and combustion consumables sales to third-party chemical suppliers lose both margin and the recurring customer touchpoint that consumables purchasing naturally creates throughout an instrument's entire operating life span across many years of continuous use. Building direct consumables capability captures value currently flowing to intermediaries while simultaneously strengthening customer relationships through more frequent, higher-margin interactions with every calibration cycle performed. This shift requires only modest incremental investment relative to the recurring revenue it eventually generates over time.
03 / GEOGRAPHIC EXPANSION PRIORITY

Prioritize India and Southeast Asia pharmaceutical manufacturing growth

East Asian semiconductor demand already carries deep instrument penetration among established manufacturers with strong existing relationships built over many decades in that specific vertical alone across the region. India's expanding pharmaceutical manufacturing sector, one of the largest generic drug producers worldwide, offers considerably more room for genuine share gain than defending position in already saturated semiconductor accounts elsewhere. Manufacturers building local service and calibration capability early will capture this growth well before competitors arrive in meaningful force across the subcontinent.
04 / SOFTWARE AND DATA STRATEGY

Treat compliance method libraries as a licensable product line

Validated testing methods integrated with laboratory information management systems carry genuine value to pharmaceutical and water utility quality teams that extends well beyond the immediate instrument sale they were originally developed to support in the first place. Manufacturers currently give this integration away as a bundled feature rather than pricing it as a separate, high-margin product line worth real recurring revenue over time. Charging for method licensing, even quite modestly at first, converts an underused software asset into a durable, recurring revenue stream.

Engagement Snapshot From the Field

A live engagement with an industry participant carrying material or product regulatory and market exposure ahead of a defining policy shift, showing how our research translates into a defensible multi-year portfolio strategy.
MARKET MINDS ADVISORY · CLIENT ENGAGEMENT SUMMARY
Total Carbon Analyzers Producer Strategic Portfolio Review and Transition Roadmap 2026·Investment Scenario on Total Carbon Analyzers Exposure Evaluation 2025-26
CLIENT PROFILE
The client is an advanced logic semiconductor fabrication facility operating in East Asia, producing chips at leading-edge process nodes requiring ultrapure water carbon contamination below one part per billion. The facility was preparing to qualify a new total carbon analyzer platform ahead of a planned capacity expansion, replacing aging instrumentation nearing the end of its validated service life across the site.
STRATEGIC CHALLENGE
The fab needed to qualify a replacement analyzer platform without interrupting continuous ultrapure water monitoring across an active production line, all while meeting an internal deadline tied to the planned capacity expansion timeline that left very limited runway for extended parallel testing between the old and new instrumentation platforms involved.
MMA APPROACH
MMA conducted a comparative technical assessment of leading analyzer platforms against the fab's specific sensitivity, reliability, and integration requirements across its existing process control systems and reporting infrastructure. The engagement included a phased qualification plan running new instrumentation in parallel with existing equipment before full cutover, minimizing production risk throughout.
KEY FINDINGS
  1. Parallel qualification testing identified a 15% improvement in detection consistency versus the incumbent platform, based on client-reported validation data collected during the trial period.
  2. Phased cutover avoided any measurable disruption to continuous ultrapure water monitoring during the transition period, according to client-reported production continuity records shared with MMA.
  3. The selected platform reduced calibration frequency requirements by roughly 30% overall, per client-reported maintenance scheduling data shared during the engagement review process.
  4. Integration with existing process control systems required minimal custom engineering work, cutting the overall implementation timeline by several weeks according to client reporting.
CLIENT PROFILE
The client is an advanced logic semiconductor fabrication facility operating in East Asia, producing chips at leading-edge process nodes requiring ultrapure water carbon contamination below one part per billion. The facility was preparing to qualify a new total carbon analyzer platform ahead of a planned capacity expansion, replacing aging instrumentation nearing the end of its validated service life across the site.
STRATEGIC CHALLENGE
The fab needed to qualify a replacement analyzer platform without interrupting continuous ultrapure water monitoring across an active production line, all while meeting an internal deadline tied to the planned capacity expansion timeline that left very limited runway for extended parallel testing between the old and new instrumentation platforms involved.
MMA APPROACH
MMA conducted a comparative technical assessment of leading analyzer platforms against the fab's specific sensitivity, reliability, and integration requirements across its existing process control systems and reporting infrastructure. The engagement included a phased qualification plan running new instrumentation in parallel with existing equipment before full cutover, minimizing production risk throughout.
KEY FINDINGS
  1. Parallel qualification testing identified a 15% improvement in detection consistency versus the incumbent platform, based on client-reported validation data collected during the trial period.
  2. Phased cutover avoided any measurable disruption to continuous ultrapure water monitoring during the transition period, according to client-reported production continuity records shared with MMA.
  3. The selected platform reduced calibration frequency requirements by roughly 30% overall, per client-reported maintenance scheduling data shared during the engagement review process.
  4. Integration with existing process control systems required minimal custom engineering work, cutting the overall implementation timeline by several weeks according to client reporting.
RECOMMENDED STRATEGY
Phase 1: Phase one: run new instrumentation in parallel with existing equipment to validate performance under real, sustained production conditions over several weeks. Phase 2: Phase two: execute a phased cutover by individual process line, avoiding a single simultaneous facility-wide transition across the entire site. Phase 3: Phase three: integrate the new platform's data outputs fully into the fab's broader process control and quality reporting systems used daily.
OUTCOME
The fab completed instrument qualification ahead of its capacity expansion deadline and reported measurable improvements in detection consistency, calibration efficiency, and integration speed, all figures client-reported and unverified by MMA. The engagement also established a qualification template applicable to future instrument transitions at other facilities within the same corporate group.

Frequently Asked Questions

Foundational context covering the market sizes, CAGR, scope, country, region and competition that inform every finding below. This section is provided to cover basics and most often pre-purchase conversations, answered from the MMA Primary Research Dataset.

What is the current size of the Total Carbon Analyzers Market?

The global total carbon analyzers market was valued at $1.2 billion in 2025. This figure covers laboratory and online instruments used in water, wastewater, and process fluid testing.

How large will the Total Carbon Analyzers Market be by 2036?

The market is projected to reach $2.43 billion by 2036, up from a 2026 base of $1.28 billion. That represents roughly a 1.9 times expansion over the forecast period.

What is the CAGR for the Total Carbon Analyzers Market 2026 to 2036?

The market is expected to grow at a 6.6% compound annual growth rate over this period. Growth is driven primarily by semiconductor fabrication expansion and pharmaceutical compendial standards tightening.

Which segment is growing fastest?

Online/in-line process TOC analyzers are the fastest-growing segment, expanding at roughly 9.9% annually through 2036. That is about 1.5 times the overall market growth rate.

Who are the major companies in the Total Carbon Analyzers Market?

Shimadzu, Teledyne Tekmar, Sievers, Thermo Fisher Scientific, and Metrohm lead the market by unit shipment volume. Together these five vendors hold roughly 54% of global unit sales.

Which country is growing fastest?

South Korea is the fastest-growing national market tracked in this report, expanding at roughly 8.8% annually. Growth is tied to expanding semiconductor fabrication capacity requiring ultrapure water monitoring.

Report Segmentation Architecture

The full report scope spans multiple orthogonal segmentation dimensions, with cross-tabulated demand data provided for each dimension pair. Coverage extends further to regional breakdowns, trend trajectories, and the competitive detail needed to support segment-level decision-making.

        By Region

        • North America
        • Western Europe
        • East Asia
        • South Asia and Pacific
        • Latin America
        • Middle East and Africa
        • Eastern Europe

        Scope, Methodology, and Coverage

        Every figure in this report is reproducible from documented input assumptions. The scope below maps the historical period, the forecast horizon, the segmentation dimensions, and the countries covered, alongside the underlying primary and qualitative methodology.
        Historical Period
        2020 to 2025
        Forecast Period
        2026 to 2036
        Base Year
        2025 (USD billions; MMA Primary Research Dataset, September 2026)
        Market Definition
        The total carbon analyzers market covers laboratory and online instruments that measure total organic carbon, total inorganic carbon, and total carbon in water, wastewater, and process fluid samples through combustion or oxidation-based detection methods. It excludes general water quality sensors measuring parameters such as pH, conductivity, or turbidity, and dissolved oxygen meters sold independently of carbon detection capability.
        Quantitative Units
        USD billions
        Segmentation Dimensions
        Regions Covered
        North America, Western Europe, East Asia, South Asia and Pacific, Latin America, Middle East and Africa, Eastern Europe
        Countries Covered
        Key Companies Profiled
        Shimadzu, Teledyne Tekmar, Sievers (Veolia Water Technologies), Thermo Fisher Scientific, Metrohm, Hach, Elementar Analysensysteme, LAR Process Analysers, Analytik Jena, Emerson (Rosemount Analytical), Xylem, Skalar Analytical, Mettler Toledo, Horiba, PerkinElmer, Agilent Technologies, Yokogawa Electric, Hitachi High-Tech, Envirotech Instruments, Focused Photonics
        Quantitative Methodology
        Primary survey, n=3,800 respondents, Q4 2025, six countries; demand-side model with trade association cross-validation
        Qualitative Methodology
        47 expert interviews, Q4 2025; applied to validate demand model assumptions, identify emerging dynamics, and assess competitive positioning
        Report Format
        PDF and XLSX data workbook (Word format preview document)
        Publisher
        Market Minds Advisory
        Report Code
        MMA-2026-TEC-273
        Published
        September 2026
        Contact
        sales@marketmindsadvisory.com | www.marketmindsadvisory.com

        Purchase the full Total Carbon Analyzers Market Report (2026 to 2036).

        This report provides a comprehensive analysis of the global total carbon analyzers market, covering market sizing, segmentation, competitive dynamics, and regional demand patterns through 2036. It examines the shift toward continuous online monitoring and extreme detection sensitivity driven by semiconductor fabrication expansion and tightening pharmaceutical compendial standards worldwide. The analysis includes detailed profiles of leading instrument manufacturers, input cost exposure, and revenue diversification strategies available to equipment vendors operating in this space. Readers gain a structured view of where margin concentrates across product tiers and which regional markets offer the strongest growth opportunity over the coming decade.
        Full 2026 to 2036 forecast across all major segments
        Detailed competitive profiles of five leading manufacturers
        Regional demand analysis across all seven global regions
        Input cost exposure and mitigation strategy assessment
        Revenue lever analysis for margin expansion opportunities
        Anonymized client case study on instrument qualification

        Built For The People Who Decide

        From boardroom strategy to bench-side execution, this report is read cover-to-cover by leaders shaping the next decade of their industry, turning demand scenarios, market dynamics and valuation benchmarks into decisions.
        CXOs/ Presidents/ VPs/ Managers
        M&A and Corporate Development
        Strategy Teams and R&D Heads
        Procurement and Product Directors
        Regulatory and Compliance Leaders
        Investor Relations and Equity Analysts