Market Minds Advisory
Tire Materials Market

Tire Materials Market: Wear Rate Became a Regulated Emission

Abrasion limits now regulate how fast a tread wears away, which turns the oldest trade-off in rubber compounding into a compliance problem that grip and rolling resistance both fight against.

Lead Analyst

Bilal Shaikh

Published

September 2026

Make Smarter Decisions with Customized Research Insights

Request a free sample report and evaluate market opportunities, growth trends, and competitive dynamics relevant to your business needs.

2025 MARKET VALUE$58.0BMarket Size 2025
2036 FORECAST VALUE$101.3BBase Case , 2026 to 2036
CAGR 2026 TO 20365.2 %Bull 6.4% / Bear 4.0%
INCREMENTAL OPPORTUNITY$40.3BNet 10- year value creation
EXPANSION MULTIPLE1.66x2036 value over 2026 base
Strategic Levers
M&A Pipeline
Regional Outlook
Country Rankings
Competitive Intelligence
Segmental Deep-dive
Call-Us : 91 93563 13602

Executive Snapshot and Market Trajectory

For the first time a tyre's wear rate is regulated rather than merely marketed. Abrasion limits treat tread loss as an emission, which means the compound must now last longer while still gripping in the wet and rolling easily, and those three properties have traded against each other for decades.
Silica and silane systems resolve part of that conflict and grow at 7.8%, half again the market rate of 5.2%, at roughly 30% higher compound cost than carbon black formulations. Electric vehicles push the same way from a different direction, since they are heavier, deliver torque instantly and wear tread around 25% faster than comparable combustion fitments. Noise matters more too, since no engine masks the tread pattern.
Natural rubber carries the awkward part. Roughly 85% comes from smallholders across a narrow equatorial band, trees yield nothing for seven years, and deforestation rules now demand plot level traceability from a supply chain of millions of growers who frequently hold no land title at all. Leaf disease travels quickly through monoculture plantings, and a grower responding to high prices adds supply almost a decade later into a market nobody can forecast that far ahead.
Market Definition
Raw materials consumed in tyre manufacture, covering natural rubber, synthetic rubber, carbon black, silica and silane systems, reinforcement cord and fabric, and curing and protective chemicals. Measured at supplier selling value into tyre production. Excludes reclaimed and recycled rubber feedstock, finished tyres, retreading materials and services, tyre manufacturing equipment, and non-tyre rubber goods.
Base Year Value
$58.0B in 2025 (MMA Primary Research Dataset, August 2026)
Forecast Period
2026 to 2036, eleven discrete annual values
CAGR
5.2% base case. Bull 6.4%. Bear 4.0%.
Fastest Growth Segment
Silica and Silane Systems: 7.8% CAGR
Fastest Growth Country
Vietnam: 9.4% CAGR
Fastest Growth Region
South Asia and Pacific: 7.2% CAGR
Largest Region
East Asia: 30% of 2025 global value
Market Leaders
Sinopec, Cabot Corporation, Evonik, LANXESS, Bekaert. Source: MMA Primary Research Dataset, July 2026.
Primary Survey
n=3,800 procurement and R&D decision-makers, Q4 2025, six countries
Methodology
Demand-side build-up, cross-validated against public data, 47 expert interviews

Tire Materials Market Forecast Scenarios

tire-materials-market-trends-size-forecast-scenario-1787639994101
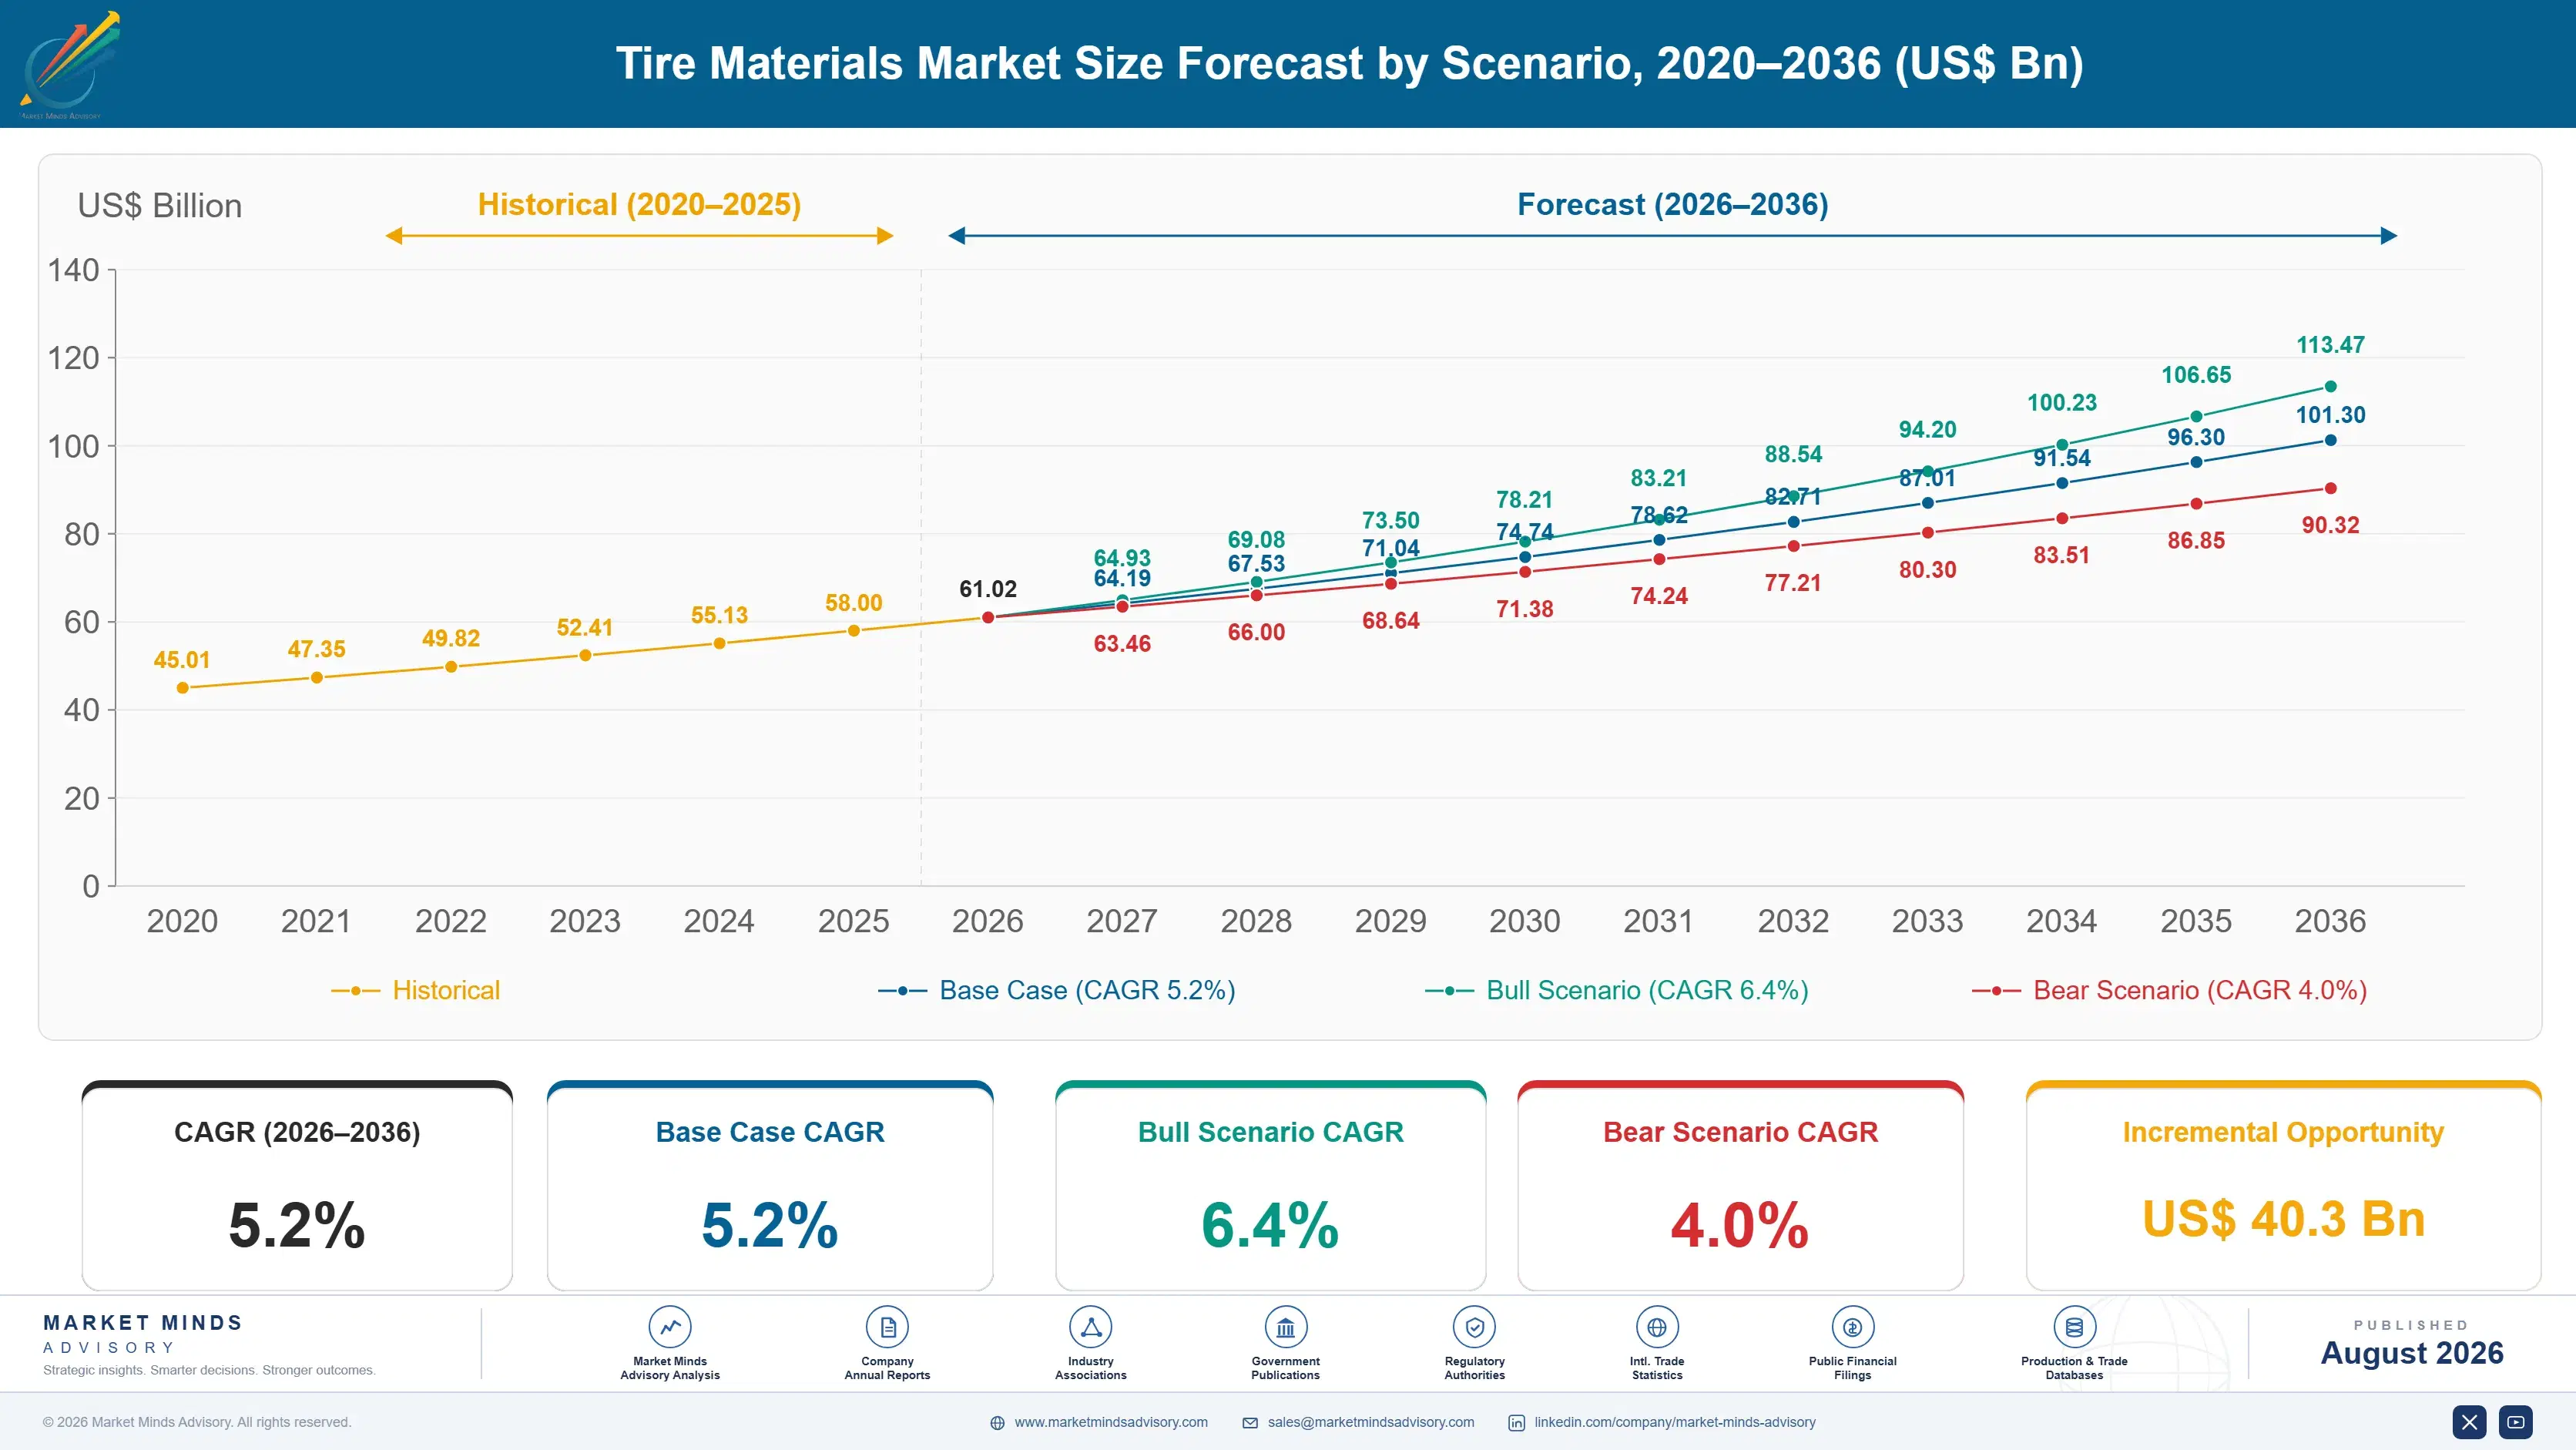
Growth ran near 4.2% between 2020 and 2025 and mix moved considerably more than volume did. Silica and silane content rose steadily as rolling resistance labelling pushed compounders away from carbon black in passenger tread. Natural rubber pricing swung on weather and disease rather than on demand. Tyre manufacturing relocated out of China toward Southeast Asia.
Base case 5.2% rests on three mechanisms. Silica and silane systems grow at 7.8% as abrasion regulation joins rolling resistance labelling in constraining tread compounds. Reinforcement cord and fabric grows at 5.6% because heavier electric vehicles need more load carrying capability in the same envelope. And Vietnam grows fastest of any country at 9.4% as tyre manufacturing relocates and natural rubber production sits alongside it. None of the three depends on tyre unit volume growing at all.
The bull case at 6.4% assumes abrasion limits tightening beyond what current tread technology delivers, which would force silica loading and functionalised polymer content up across the entire passenger fitment. The bear case at 4.0% is natural rubber pricing collapsing on a strong harvest, since natural rubber is a large share of total value and its price moves further than any other input in the mix.

Three Properties, One Compound

Tread compounding has always been a negotiation between three properties that resist each other. Grip in the wet, low rolling resistance and slow wear cannot all be maximised in the same rubber, and eighty years of formulation work has consisted of choosing where to give ground. Abrasion limits now regulate the wear side directly, so wear can no longer be traded away to buy grip.
TOP FIVE CONCENTRATION34%Polymer, filler and reinforcement suppliers occupy quite separate positions
ELECTRIC VEHICLE TREAD LOSS25%Additional tread wear against a comparable combustion vehicle fitment
NATURAL RUBBER YIELD DELAY7 yearsTime from planting to the first commercial latex harvest
SILICA COMPOUND PREMIUM30%Additional compound cost against an equivalent carbon black formulation
SMALLHOLDER SUPPLY SHARE85%Portion of natural rubber grown on very small plots
MATERIAL COST SHARE62%Portion of manufacturing cost attributable to raw material purchase
Silica and silane systems are the partial answer, improving wet grip and rolling resistance together at roughly 30% higher compound cost than carbon black, and they grow at 7.8% accordingly. Electric vehicles push from another direction entirely. They weigh more, deliver full torque from a standstill and wear tread around 25% faster than comparable combustion fitments, which raises material consumption per vehicle even as the vehicle itself emits nothing from a tailpipe.
Natural rubber remains the least controllable part of the picture. Around 85% comes from smallholders across a narrow equatorial band, a newly planted tree yields nothing for seven years, and leaf disease travels quickly through monoculture plantings. Deforestation rules now demand plot level traceability from growers who hold no formal land title.
"Regulating tread abrasion is the first time anybody has told a compounder how fast the rubber is allowed to disappear. Every lever that buys grip costs wear, so the whole formulation stack has to move rather than one ingredient in it."
Director, Elastomers and Automotive Materials Practice · MMA Chemicals and Materials Practice · August 2026

Market Trends

Abrasion limits turning tread wear into a compliance property

Regulation now treats tread loss as an emission rather than a durability claim, which removes the compounder's oldest lever. Grip has always been bought by accepting faster wear, and that trade is no longer available at the same terms. Silica and silane systems grow at 7.8% because they improve wet grip and rolling resistance together, though at roughly 30% higher compound cost. Functionalised polymers and resin systems carry the rest of the burden. Suppliers arriving with a grade and a price are answering a tender that somebody else already framed.
Market Impact: Vietnam growing fastest at 9.4%
Electric vehicle mass and torque raising material consumption

Electric vehicles are heavier, deliver full torque instantly and wear tread around 25% faster than comparable combustion fitments, which raises material consumption per vehicle across the whole fitment. Reinforcement cord grows at 5.6% because that additional mass has to be carried within the same envelope. Noise matters more too, since no engine masks tread pattern sound, and quieter patterns generally trade against both grip and wear. Reinforcement suppliers pricing on a per kilogram basis are quoting against the wrong measure, because the customer is buying carrying capability per unit of mass instead.
Market Impact: Adds about 30% compound cost

Market Opportunities and Growth Drivers

Tyre manufacturing relocating toward Southeast Asian capacity

Vietnam grows fastest of any country at 9.4% as tyre manufacturing relocates from China under trade measures and finds natural rubber supply already sitting in the region. Material suppliers organised around Chinese plant geography are covering capacity that is steadily moving elsewhere. Carbon black, synthetic rubber and cord supply all have to follow the plants rather than the vehicle market, since tyre materials are consumed where tyres are built. Plant construction announcements run years ahead of production, which gives ample warning to anybody actually tracking them. Automotive registration data is close to useless here.
Market Impact: Roughly 85% from smallholder plots

Rolling resistance labelling pulling silica into passenger tread

Tyre labelling schemes across most developed markets grade rolling resistance and wet grip on the same label, which rewards exactly the combination silica and silane systems deliver and carbon black cannot match. That pressure predates abrasion regulation and has been steadily shifting passenger tread formulation for years. Compound cost runs roughly 30% higher, which manufacturers accept because the label grade is visible to the buyer at point of sale. Abrasion regulation now reinforces the same direction from a different regulatory instrument entirely. Label grades are visible to buyers at point of sale, which is why manufacturers accept the cost.
Market Impact: Trees yield after 7 years

Market Restraints and Challenges

Natural rubber traceability landing on undocumented smallholder supply

Roughly 85% of natural rubber comes from smallholders across a narrow equatorial band, and deforestation rules now require plot level traceability from growers who frequently hold no formal land title. The root cause is a supply chain structure that predates any documentation requirement by a century. Commercially it risks excluding compliant material for want of paperwork. Cooperative aggregation, satellite plot mapping and dealer level verification are the approaches under active development. Buyers who wait for the requirement to bite will find compliant volume scarce and expensive. Documentation is the binding constraint.
Market Impact: Silica systems growing at 7.8%

Replanting economics discouraging supply response to price

A newly planted rubber tree yields nothing for seven years, so a grower responding to high prices adds supply almost a decade later and frequently into a very different market. The root cause is agronomy rather than any commercial failure. Commercially it means price signals do not produce supply response on any useful timescale. Yield improvement on existing trees, disease resistant clones and tapping intensity changes are the practical responses available. Neither closes the gap between a price signal and any meaningful supply response. Supply arrives a decade after the signal.
Market Impact: Electric fitments wear 25% faster
4 additional market trends, 3 additional growth drivers, and 2 additional restraints and challenges are covered in the full report. Contact sales@marketmindsadvisory.com to access the complete intelligence.

Segment CAGR and Growth Architecture

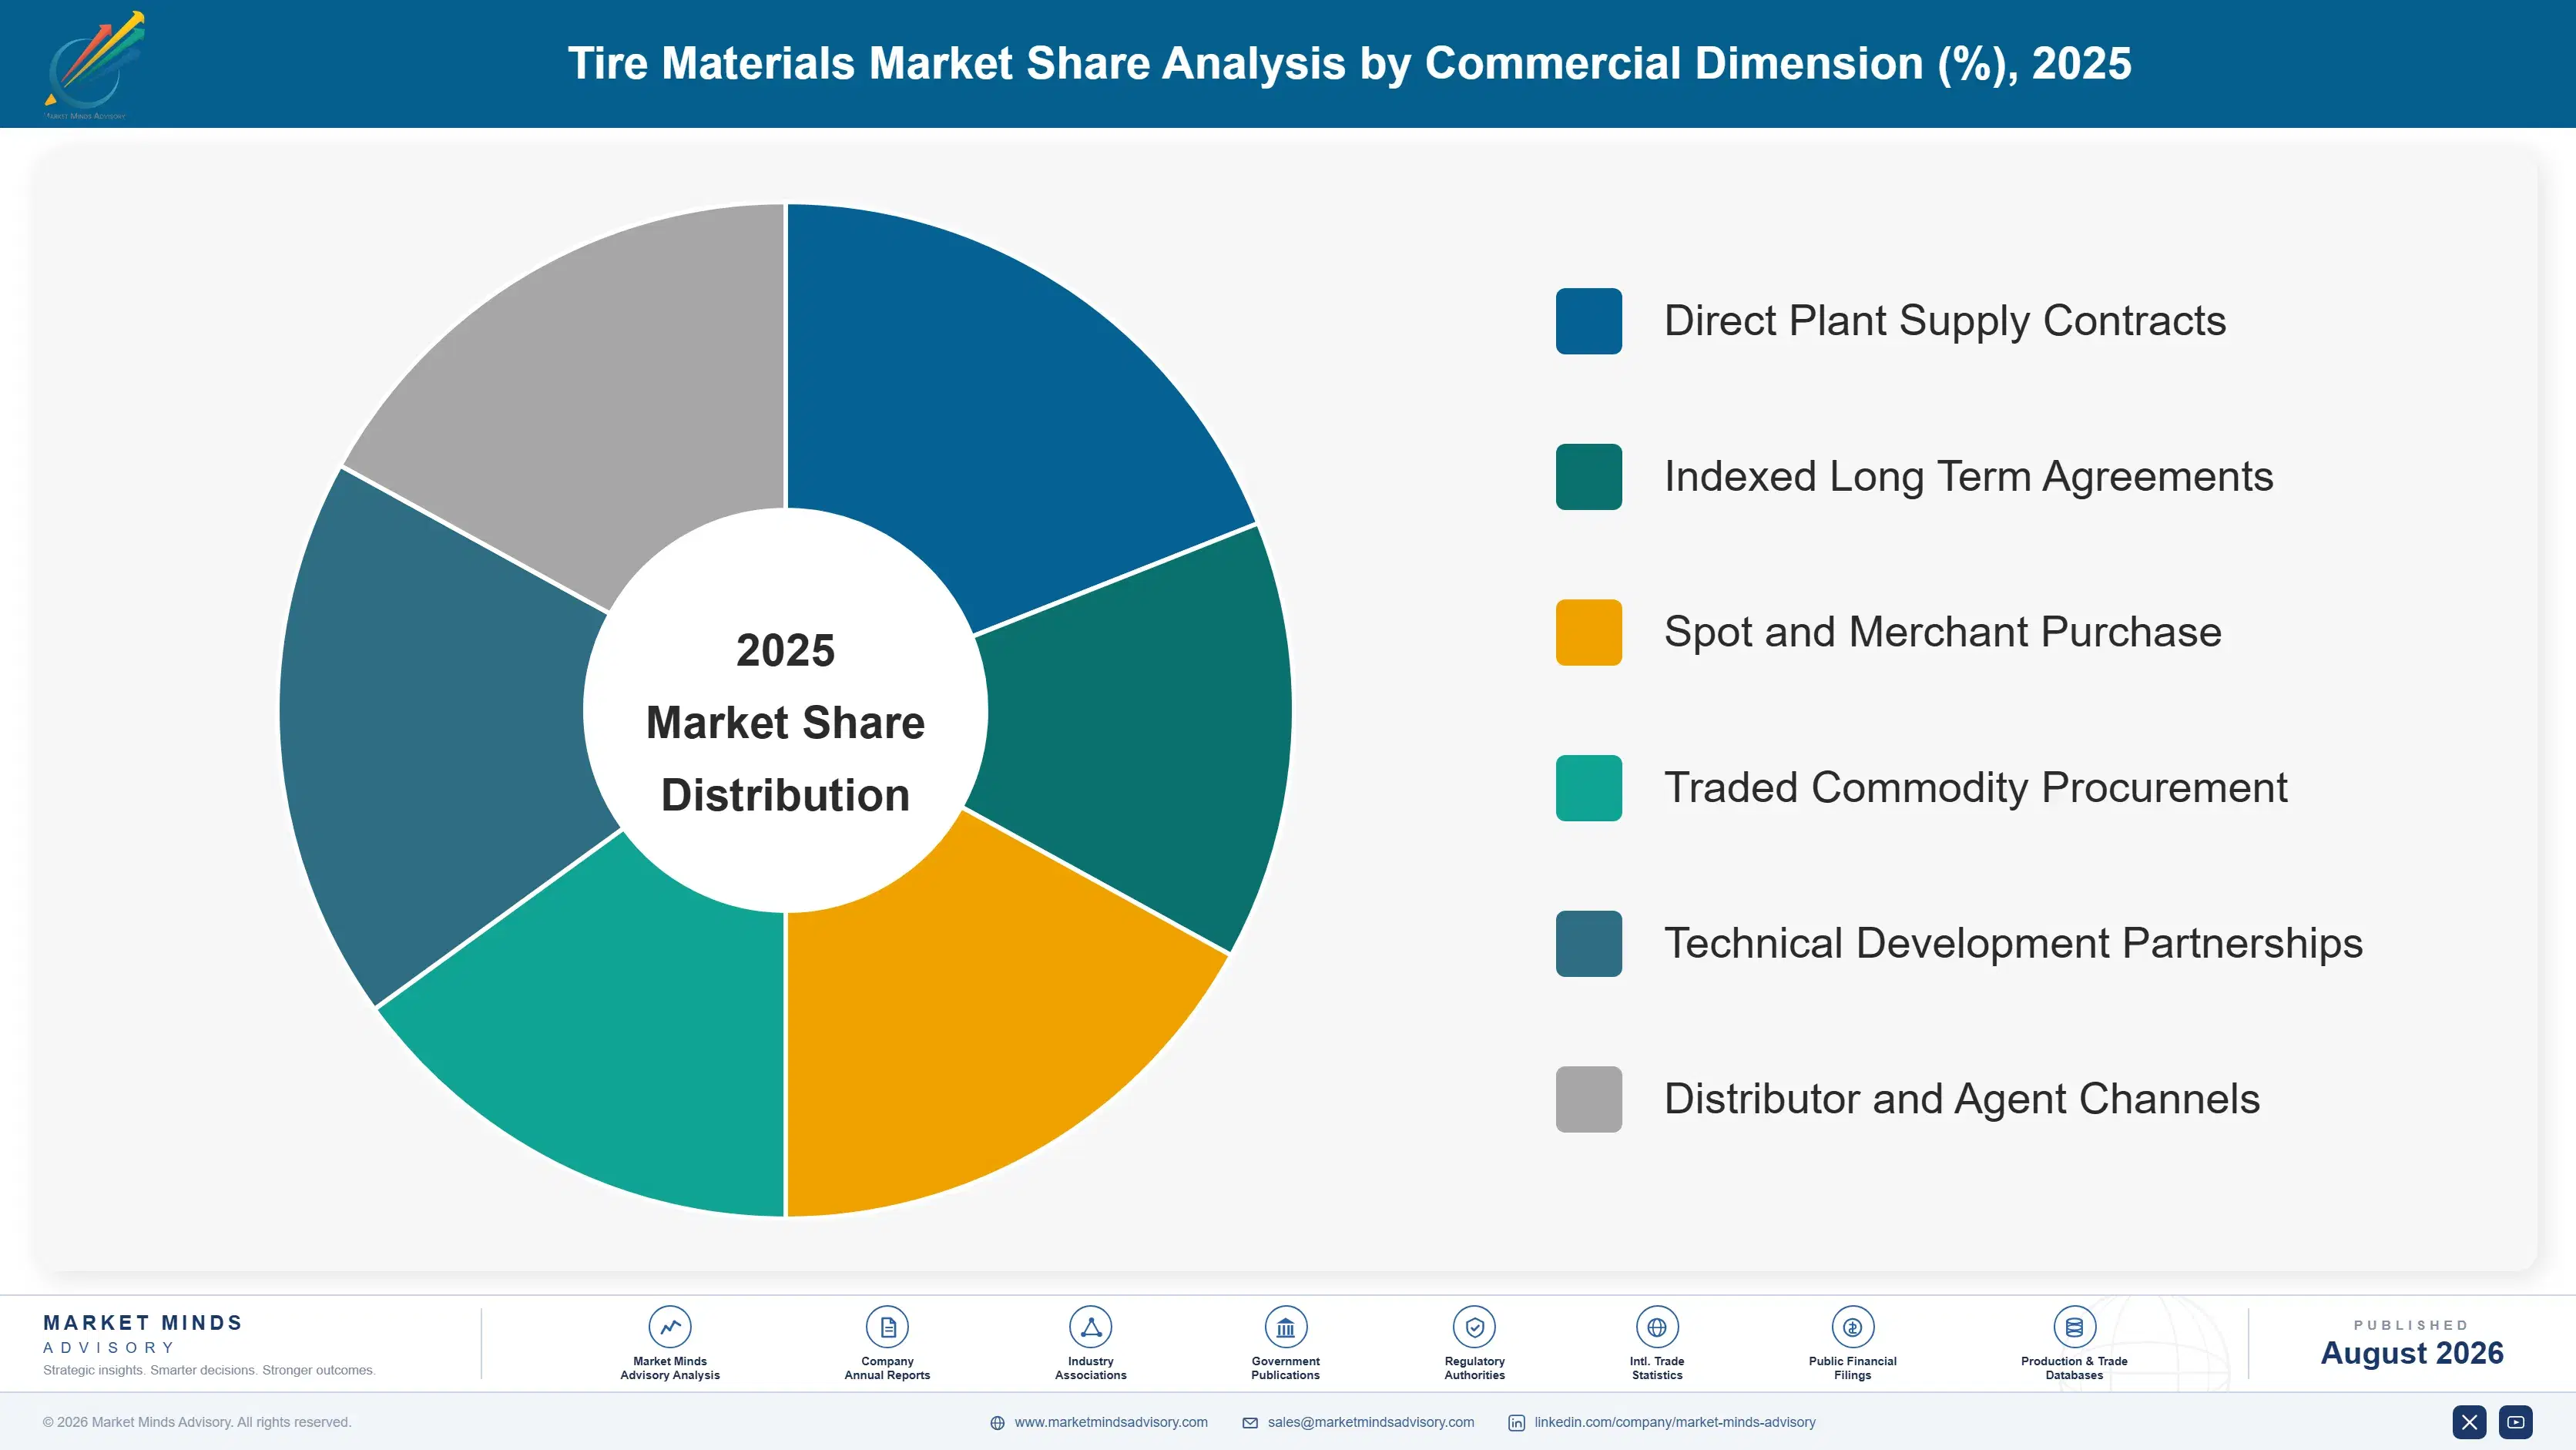
Six segments split by material family, because family determines the property it contributes to the compound, the supply chain behind it, the substitution options available and the price behaviour it exhibits. Grade and specification variants sit inside each family. Tyre type and channel dimensions are handled separately within the framework rather than mixed here. Family determines the commercial position entirely.
tire-materials-market-trends-market-share-analysis-1787639994681

Silica and Silane Systems

Growing at 7.8%, half again the market rate of 5.2%, precipitated silica with silane coupling agents improves wet grip and rolling resistance simultaneously in a way carbon black cannot, which is exactly what tyre labelling grades and abrasion limits both reward. Compound cost runs roughly 30% higher and mixing is considerably more demanding, requiring longer cycles and tighter temperature control. Adoption concentrates in passenger tread and is spreading into truck applications as regulation widens beyond passenger vehicles. Suppliers offering compound development support reach the point where a recipe is being rebuilt, which is where the cost premium becomes justifiable rather than merely visible on a quotation. Mixing demands longer cycles and tighter control.
CAGR 7.8%

Reinforcement Cord and Fabric

At 5.6% steel cord, bead wire and textile reinforcement carry the structural load of the tyre, and electric vehicle mass has raised what that load actually is within an unchanged envelope. Higher tensile steel and aramid content allow the same carrying capacity at lower weight, which matters because weight itself costs range. Supply is concentrated among a small group of specialists whose capability in cord adhesion and consistency takes years for any entrant to replicate. Electric fitments have raised the load requirement without changing the space available, which favours higher tensile constructions over simply adding more material to the carcass. Cord adhesion consistency is genuinely difficult to replicate at volume, which keeps the qualified supplier field narrow.
CAGR 5.6%
Full segment breakdown across 6 segments available in the complete report.

Regional Architecture and Country Demand Map

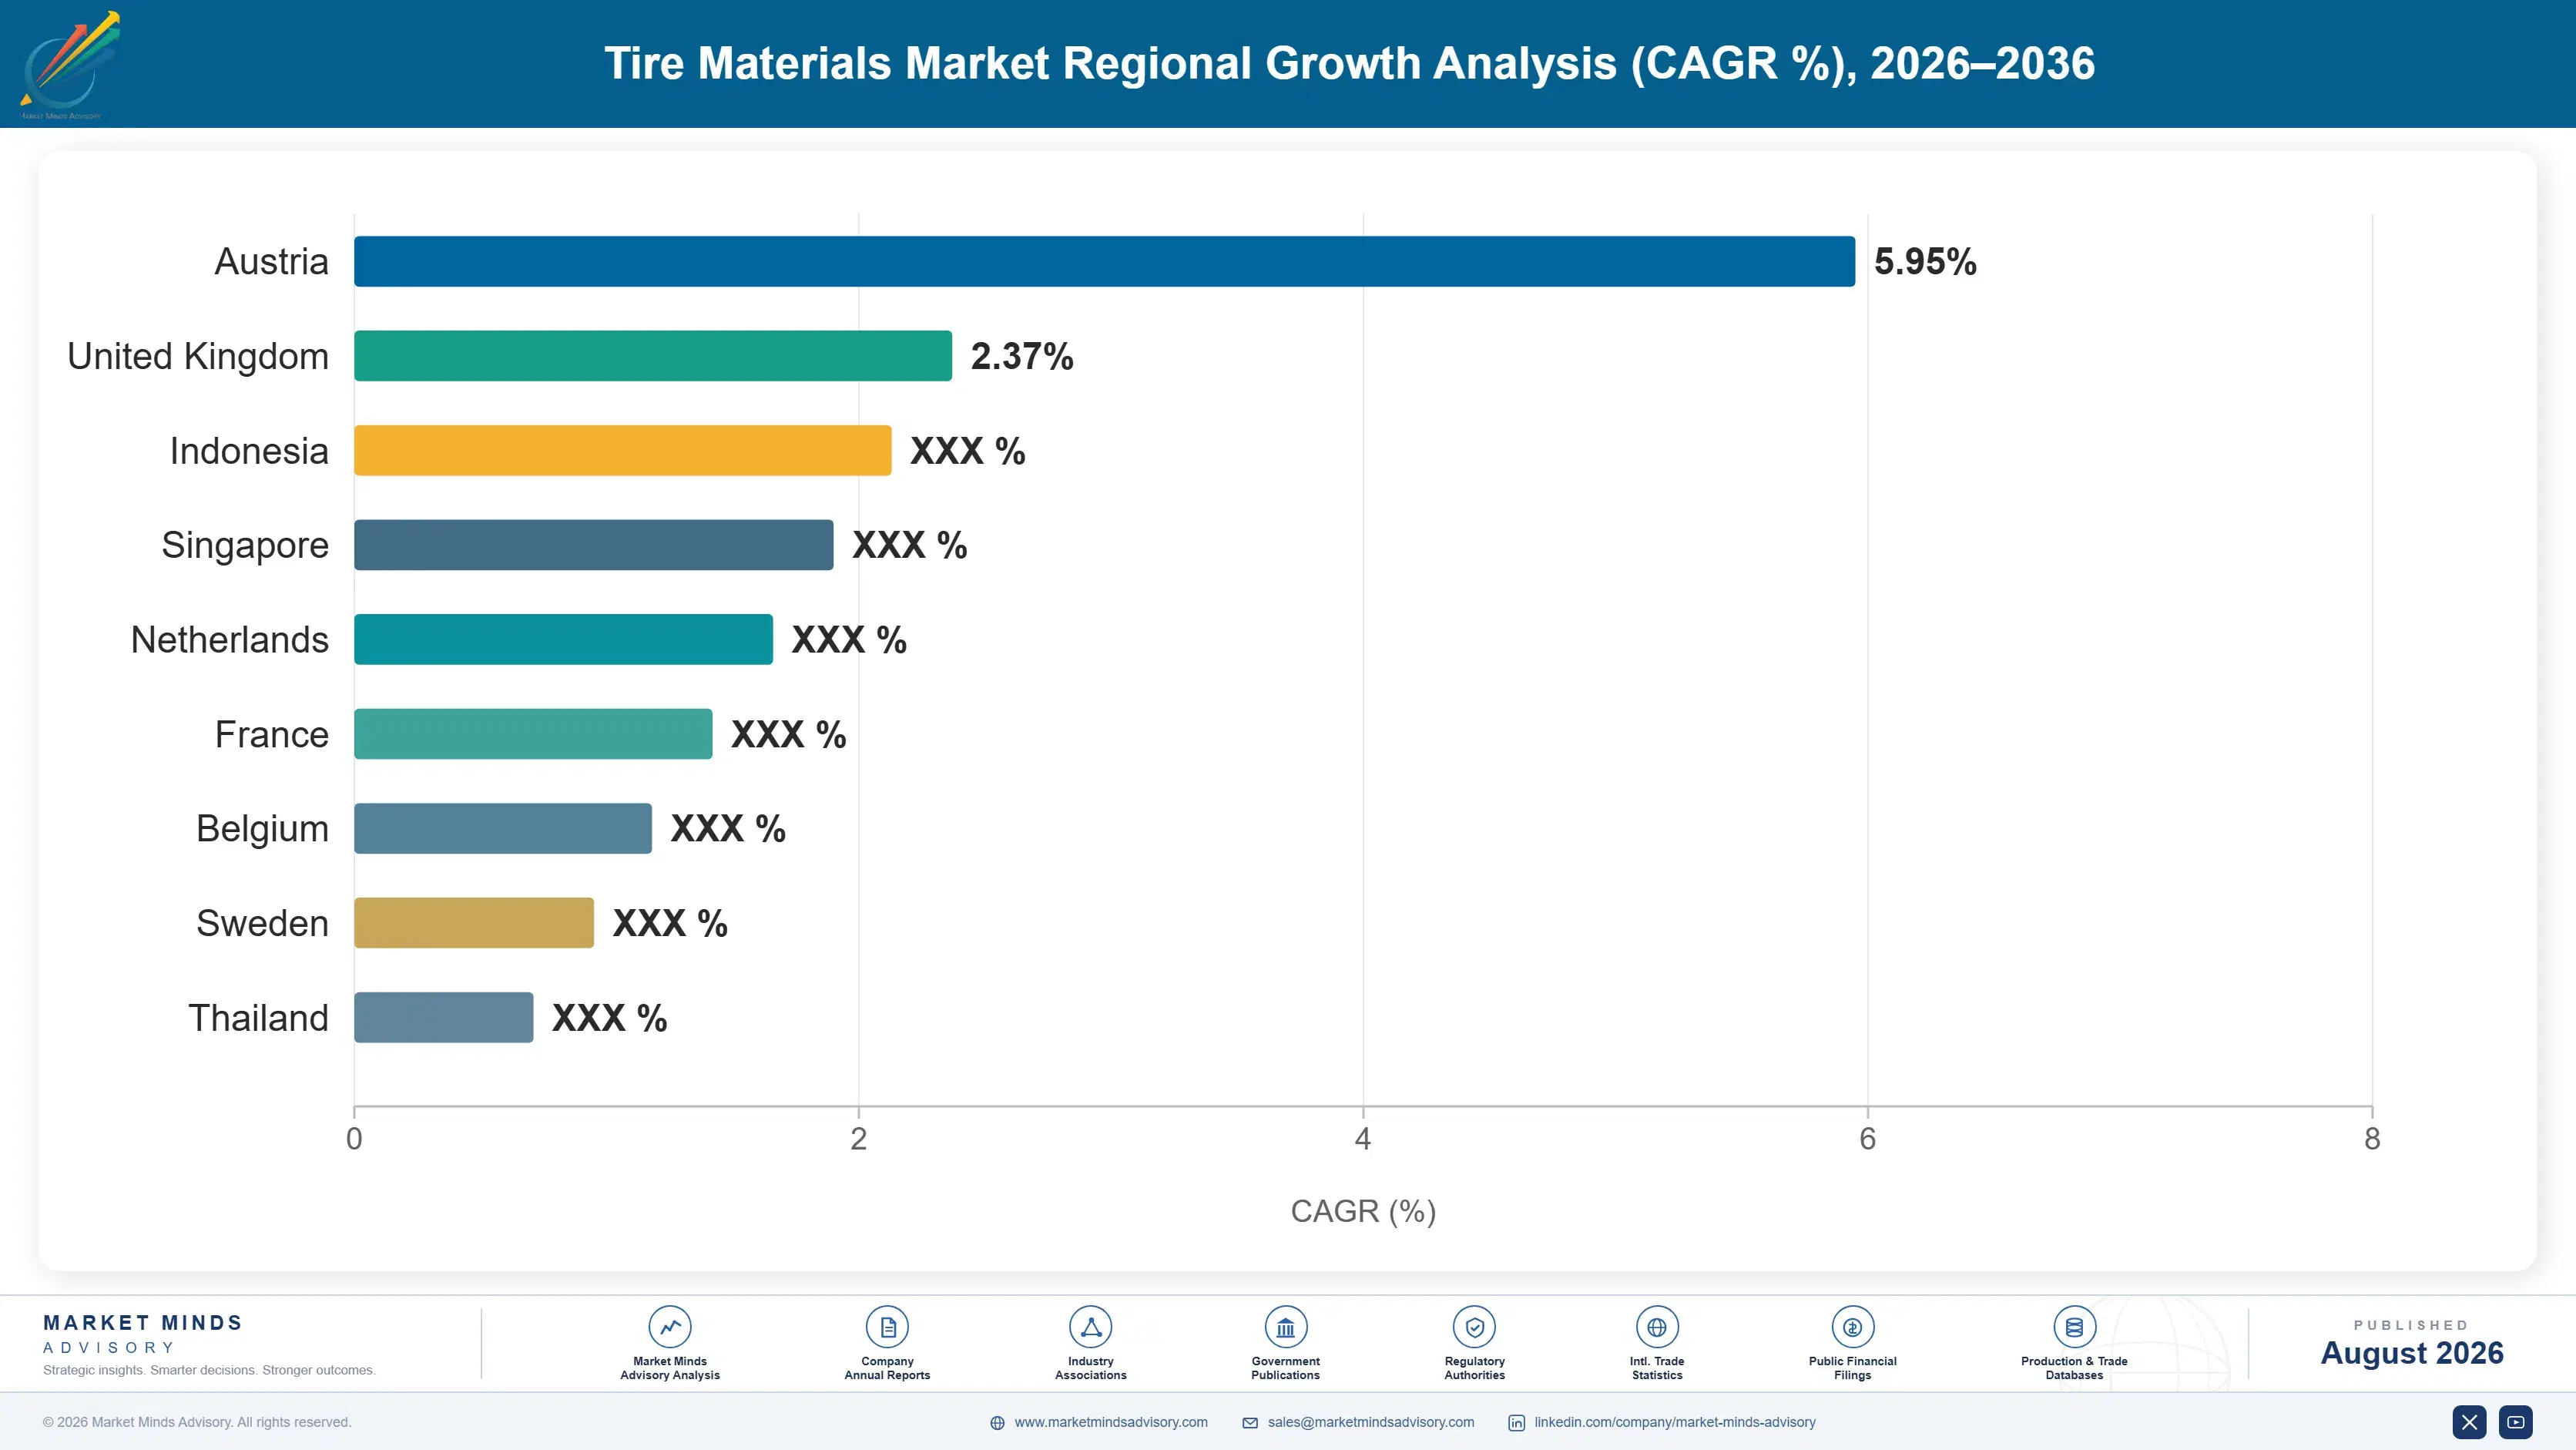
East Asia holds 30% of value on tyre manufacturing scale that no other region approaches. South Asia and Pacific follows at 14%, unusually high because natural rubber production and Indian tyre capacity both sit there. South Asia and Pacific grows fastest of the seven regions covered here.

North America

Tyre manufacturing here serves a large domestic vehicle fleet with replacement demand that is considerably less cyclical than original equipment fitment. Electric vehicle penetration raises material consumption per vehicle through mass and torque, offsetting slower fleet growth. Carbon black and synthetic rubber capacity is well established and integrated with petrochemical supply. Growth at 4.4% reflects mix improvement toward silica content rather than any expansion in tyres produced. Abrasion regulation originating elsewhere will reach fitments here through vehicle platform decisions taken globally rather than through domestic rulemaking. Replacement fitment demand is considerably steadier than original equipment volume, which follows vehicle production cycles and their substantial swings from year to year. Both matter commercially.
Share: 22% | CAGR: 4.4% (2026 to 2036)

Western Europe

Tyre labelling across the region has driven silica adoption further than anywhere, and abrasion regulation originating here will reach fitments well beyond the region through vehicle platform decisions. Natural rubber traceability requirements apply here first and most strictly. Manufacturing capacity has contracted steadily toward higher value fitments. Regional growth of 3.8% is the slowest anywhere on shrinking production volume despite the richest material mix in the world. Compound development capability here is the deepest anywhere, which makes it the natural place for suppliers to build formulation relationships that transfer into other regions. Production volume has contracted toward higher value fitments, which raises material content per tyre while reducing the number of tyres built.
Share: 18% | CAGR: 3.8% (2026 to 2036)
Regional intelligence for 5 additional markets available in the complete report: East Asia, South Asia and Pacific, Latin America, Middle East and Africa, Eastern Europe. Contact sales@marketmindsadvisory.com.
tire-materials-market-trends-country-cagr-analysis-1787639995201

Four Moves Inside the Compound

Abrasion regulation removed the trade that compounders have relied on for eighty years, and electric vehicles raised what every tyre has to carry. What remains available is selling into the formulation problem rather than the ingredient tender, following plants rather than vehicle markets, and solving traceability before it excludes material. Procurement is the wrong function now.

Sell into the formulation problem, not the tender

Abrasion limits removed the compounder's ability to trade wear for grip, which turns a purchasing decision into a development problem across the whole formulation stack. Suppliers arriving with a silica grade and a price are answering a tender. Those arriving with compound development support reach the point where the recipe is being rebuilt, and roughly 30% higher compound cost is far easier to justify inside a solution than inside a quotation. Formulation development is where the decision has moved. Purchasing frames tenders that nobody wins profitably. Development access is the whole lever.
Market Impact: Justifies roughly the 30% higher compound cost premium

Follow tyre plants rather than vehicle markets

Materials are consumed where tyres are built, not where vehicles are sold, and Vietnam grows fastest at 9.4% as manufacturing relocates under trade measures. Suppliers organised around Chinese plant geography are covering capacity that is steadily moving away from them. Plant construction announcements run years ahead of production, which gives ample warning to anybody tracking them rather than tracking automotive registrations in the destination market. Automotive registration data in the destination market is close to useless as an indicator here. Plants consume the materials, not markets. Geography has moved and coverage has not.
Market Impact: Follows the 9.4% Vietnamese manufacturing capacity growth rate

Build traceability before it excludes your material

Roughly 85% of natural rubber comes from smallholders who frequently hold no land title, and deforestation rules demand plot level traceability regardless. Buyers who wait for the requirement to bite will find compliant volume scarce and expensive. Cooperative aggregation with satellite plot mapping costs modestly now and secures supply later, which is a straightforward trade that surprisingly few purchasing organisations have actually made yet. Cooperative aggregation with satellite plot mapping costs modestly now and secures supply later, which is a straightforward trade. Very few purchasing organisations have actually made it.
Market Impact: Secures the 85% of smallholder sourced rubber volume

Position reinforcement against vehicle mass, not tyre size

Electric vehicles carry more mass in the same envelope and wear tread around 25% faster, which raises what reinforcement has to do rather than how much of it fits. Higher tensile steel and aramid deliver the same carrying capacity at lower weight, and weight costs range directly. Suppliers quoting cord on a per kilogram basis are pricing against the wrong measure entirely, since the customer is buying capability per unit of mass. Weight itself costs vehicle range directly. Envelope size has not changed at all. Load rose while the envelope stayed fixed.
Market Impact: Addresses the 25% faster electric vehicle tread wear

Who Controls the Margin Pool

Participation is measured on annual revenue from materials supplied into tyre manufacture, and the top five hold 34%. Concentration is moderate because polymer producers, filler manufacturers and reinforcement specialists are entirely separate businesses competing for different parts of the same bill of materials. The gap to challengers is feedstock position in commodity families and technical capability in the rest, which are entirely different sources of advantage.
Competition runs on three fronts. Petrochemical integration decides synthetic rubber and carbon black cost, where feedstock position sets everything. Technical capability decides silica, silane and functionalised polymer positions, where compound development support matters more than price. And qualification depth decides reinforcement, where consistency takes years to demonstrate. Each front rewards a different capability, and very few participants hold more than one of them properly.

Pressure ahead comes from abrasion regulation reshaping formulations and from manufacturing relocating geographically. Expect technically capable suppliers to gain against commodity producers. Rankings shift on whoever supports the compound rebuild that abrasion limits are forcing across passenger fitments. Concentration should stay moderate given how separate the families remain. Commodity elastomer producers without functionalised polymer capability look most exposed to the formulation changes abrasion limits are forcing through.
tire-materials-market-trends-company-positioning-matrix-1787639995720

Competitive Moat and Risk Dimensions

SINOPEC

Moat: Petrochemical integration and scale

Synthetic rubber production integrated with upstream petrochemical feedstock delivers a cost position that standalone elastomer producers cannot approach, particularly in butadiene derived grades where feedstock is most of the cost. That integration also secures availability through periods when merchant monomer supply tightens, which matters to tyre manufacturers running continuous production.
SINOPEC

Risk: Commodity grade differentiation absence

General purpose synthetic rubber grades meet identical specifications from many suppliers, which leaves competition on delivered cost alone and no defence when a competitor holds better feedstock economics. Moving toward functionalised polymers that abrasion regulation rewards requires development capability quite different from the scale advantages the business currently relies on.
CABOT CORPORATION

Moat: Grade breadth and proximity

Carbon black is expensive to transport relative to its value, so plants located close to tyre manufacturing hold a genuine cost advantage that no distant producer overcomes on price. Grade breadth across tread, sidewall and carcass applications also serves a whole plant rather than one compound, which deepens the commercial relationship considerably.
CABOT CORPORATION

Risk: Silica displacement in passenger tread

Silica and silane systems growing at 7.8% displace carbon black precisely in passenger tread, which is the highest value application in the mix, and abrasion regulation accelerates that displacement further. Defending it requires carbon black grades that close part of the performance gap, and the underlying chemistry limits how far that can go.

Players Tracked

Prominent Players

Sinopec
Cabot Corporation
Evonik
LANXESS
Bekaert

Other Key Players

Orion Engineered Carbons
Birla Carbon
Tokai Carbon
Solvay
PPG Industries
Kordsa
Hyosung Advanced Materials
Teijin
Kolon Industries
Sri Trang Agro-Industry
Halcyon Agri
Zeon Corporation
Asahi Kasei
Arlanxeo
Eastman Chemical

Recent Developments

APRIL 2026

Abrasion limits published for passenger tyre fitments

Regulatory abrasion limits for passenger tyres were published with defined test methodology, converting tread wear from a durability marketing claim into a compliance property that every tread compound must now demonstrate before sale. Manufacturers began reformulating tread across passenger ranges immediately afterwards. Test methodology was published alongside.
Signal: Regulating wear removes the trade that compounders have relied on for eighty years, entirely and everywhere
OCTOBER 2025

Tyre manufacturer commits new capacity to Southeast Asia

A tyre manufacturer committed new production capacity to Southeast Asia rather than expanding Chinese operations, citing trade measures and proximity to natural rubber supply as the decisive factors in the siting decision. Material suppliers without regional presence were left covering the wrong geography. Construction begins within the year.
Signal: Material demand follows the plants rather than the vehicle markets, and those plants keep on moving
JANUARY 2026

Traceability programme maps smallholder rubber plots by satellite

A natural rubber traceability programme began mapping smallholder plots by satellite and linking them through cooperative aggregation, addressing deforestation compliance for growers who hold no formal documentation of land ownership. Cooperative structures carried the verification burden for individual growers. Mapping covered several hundred thousand individual plots.
Signal: Compliance requirements have now arrived at the least documented supply chain anywhere in all industrial materials

Feedstock, Latex and Ore

Butadiene and styrene carry around 68% of synthetic rubber cost, priced from petrochemical crackers no elastomer producer controls. Carbon black feedstock oil absorbs roughly 61% of carbon black cost and follows refinery residue markets closely. Natural rubber is a traded agricultural commodity priced entirely on harvest and weather. Steel rod, energy, silica precursors and processing account for the balance across the remaining families.
Crude oil and natural gas pricing both moved sharply across recent years, per International Energy Agency reporting on oil markets and Cabot Corporation annual reporting for 2025 on feedstock cost commentary. Suppliers passed movements through unevenly, since tyre manufacturers hold considerable purchasing power and materials represent around 62% of their manufacturing cost, which makes every increase highly visible to them. Indexation has spread considerably as a result across most families.

Exposure divides on feedstock rather than on product family. A synthetic rubber producer carries monomer across more than two thirds of cost with pass through resisted by concentrated customers. A carbon black producer carries residue oil on similar proportions with the same customer pressure. A silane supplier carries energy and precursor chemistry on a narrower base, with technical value supporting conversations commodity producers cannot have.
tire-materials-market-trends-cost-volatility-analysis-1787639995914

Index monomer exposure into tyre manufacturer agreements

Butadiene and styrene carry more than two thirds of synthetic rubber cost and move on petrochemical drivers no producer influences at all. Indexation shifts that exposure to where it originates, and tyre manufacturers already accustomed to indexed pricing in carbon black generally accept the same mechanism once it is presented consistently across the portfolio.

Move mix toward functionalised and technical grades

Commodity elastomer and filler grades compete on delivered cost with no defence against better feedstock economics elsewhere. Functionalised polymers and silane systems that abrasion regulation rewards carry technical value supporting genuine pricing conversations, which reduces feedstock exposure per unit of revenue while improving margin at the same time. Investment capability is the obstacle here.

Locate filler capacity close to tyre manufacturing clusters

Carbon black and silica both carry transport cost high relative to value, which gives local production a cost advantage no distant supplier overcomes through pricing. Siting capacity near relocating tyre manufacturing clusters secures both position and margin, and plant announcements provide years of warning to anybody tracking them properly. Announcements give ample warning. Position and margin move together.

Portfolio Architecture for Margin Defence

Margin here follows technical content rather than volume, because tyre manufacturers buy commodity materials against specification and buy technical materials against a formulation problem they cannot solve alone. General purpose synthetic rubber and standard carbon black grades earn margins in the high single digits to mid teens, where feedstock position decides everything and specifications are met identically by many suppliers. Purchasing knows the material is interchangeable and prices it accordingly. Feedstock position decides survival rather than any commercial capability at this level.
Reinforcement cord and specialty carbon black grades do better in the mid teens to high twenties, because qualification depth and consistency take years to demonstrate and tyre manufacturers change reinforcement suppliers with genuine reluctance. Construction validation makes changing supplier genuinely risky rather than merely inconvenient.

Silica, silane and functionalised polymer systems hold the strongest position, reaching into the high thirties, where abrasion regulation and labelling both reward exactly what these materials deliver and no commodity substitute closes the gap. Those margins depend on regulatory pressure continuing, and would compress quickly if abrasion limits were relaxed or labelling schemes weakened materially. Regulatory pressure is doing the selling here, and relaxation would compress these margins quickly.

General Purpose Elastomers and Standard Blacks

Materials meeting identical specifications from many suppliers where feedstock position decides cost. The seven point range reflects integration depth and plant proximity rather than any performance difference at all. Purchasing prices them accordingly.
Gross Margin: 8-15%

Reinforcement and Specialty Filler Grades

Materials where qualification depth and consistency take years to demonstrate properly. The twelve point range reflects technical capability and how deeply the supplier is embedded in tyre construction design. Requalification risk protects incumbents.
Gross Margin: 16-28%

Silica, Silane and Functionalised Systems

Materials delivering what abrasion limits and labelling schemes both reward directly. The twelve point range reflects compound development support depth, which separates suppliers far more than product specification does. Regulation is doing the selling.
Gross Margin: 26-38%
tire-materials-market-trends-portfolio-architecture-1787639996414

High-value Sub-segments and Strategic Watch-out

Silica and Silane Systems

High value and the fastest growth at 7.8%, improving wet grip and rolling resistance together where carbon black cannot. Compound cost runs roughly 30% higher, which regulation is steadily making unavoidable. Compound development support decides who supplies it, since the recipe rebuild happens with somebody in the room.
Gross Margin: 26-38%

Reinforcement Cord and Fabric

High value and growing at 5.6% as electric vehicle mass raises carrying requirements within an unchanged envelope. Qualification depth in cord adhesion keeps the supplier field genuinely narrow. Requalification against construction validation is expensive and risky, which protects incumbent positions considerably. Entry is slow and difficult.
Gross Margin: 20-30%

General Purpose Synthetic Rubber

The volume core, meeting identical specifications from many producers where feedstock integration alone decides who competes. Concentrated tyre manufacturer purchasing removes what little pricing latitude remains. Feedstock integration alone decides who competes, and concentrated tyre purchasing removes what pricing latitude remains. Interchangeability is complete here.
Gross Margin: 8-15%

Natural Rubber Traceability Exposure

The strategic watch-out. Roughly 85% comes from undocumented smallholders facing plot level traceability rules, and the range reflects whether a buyer built verification early or waits for compliant volume to become scarce. Verification built early costs modestly, while waiting means paying scarcity pricing for documented material.
Gross Margin: 4-25%

Locked at Compound Approval

Demand here is genuinely repeating, because a tyre plant runs continuously and consumes the same bill of materials every day until a compound changes. Approval of a formulation is therefore the commercial event, and everything afterwards is delivery against it. Replacement fitment demand is considerably steadier than original equipment volume, which follows vehicle production cycles and their considerable swings. Approval is the commercial event, and delivery afterwards is administration.
Stickiness varies enormously by material family. Reinforcement cord positions hold for years because requalification against construction validation is expensive and risky. Silica and silane positions hold while the compound does. General purpose elastomer and standard black supply reopens on every contract cycle, since equivalent material is available from several producers and purchasing knows it. Purchasing knows exactly which materials are interchangeable.

The buying profile has shifted with regulation. A decade ago compound approval was a technical formality and purchasing ran the commercial relationship. Abrasion limits and labelling have moved the decision back toward compound development, where a supplier who helps rebuild a recipe holds a position purchasing cannot easily reopen. Suppliers calling only on procurement are reaching the wrong function entirely. Compound development is where positions now get built.
tire-materials-market-trends-end-use-penetration-index-1787639996901

Where We Would Put Effort

These are among the four positions where our research anticipates prominent divergence between winners and laggards over the coming forecast period. Each is grounded in the demand model, the regulatory perimeter, and the announced capacity pipeline.
01 / FORMULATION DEVELOPMENT ACCESS

The tender is the wrong conversation now

Abrasion limits removed the compounder's ability to trade wear for grip, which turns what was a purchasing decision into a development problem running across the entire formulation stack at once. Suppliers arriving with a grade and a price are answering a tender that somebody else has already framed. Those arriving with compound development support reach the point where the recipe is genuinely being rebuilt, and roughly 30% higher compound cost is considerably easier to justify inside a solution than inside a quotation.
02 / PLANT GEOGRAPHY FOLLOWING

Materials go where tyres are built

Tyre materials are consumed at the plant rather than in the market where vehicles are eventually sold, and Vietnam grows fastest of any country at 9.4% as manufacturing relocates under trade measures. Suppliers still organised around Chinese plant geography are covering capacity that keeps moving steadily away from them each year. Tyre plant construction announcements run several years ahead of actual production, which gives ample warning to anybody who tracks them rather than watching automotive registration data in the destination market.
03 / TRACEABILITY PREPARATION DISCIPLINE

Compliant volume will get scarce first

Roughly 85% of natural rubber comes from smallholders who frequently hold no formal land title, while deforestation rules demand plot level traceability from that supply chain regardless of its documentation. Buyers who wait for the requirement to bite properly will find compliant volume both scarce and expensive at exactly the moment they need it. Cooperative aggregation combined with satellite plot mapping costs modestly now and secures compliant supply later, which surprisingly few purchasing organisations have actually got round to doing yet.
04 / MASS BASED REINFORCEMENT POSITIONING

Sell capability per kilogram, not kilograms

Electric vehicles carry more mass within the same envelope and wear tread around 25% faster, which raises what the reinforcement must accomplish rather than how much of it physically fits inside. Higher tensile steel and aramid content deliver equivalent carrying capacity at lower weight, and weight costs vehicle range directly on every journey. Suppliers quoting cord on a straightforward per kilogram basis are pricing against entirely the wrong measure, since the customer is actually buying carrying capability per unit of mass carried.

Engagement Snapshot From the Field

A live engagement with an industry participant carrying material or product regulatory and market exposure ahead of a defining policy shift, showing how our research translates into a defensible multi-year portfolio strategy.
MARKET MINDS ADVISORY · CLIENT ENGAGEMENT SUMMARY
Tire Materials Producer Strategic Portfolio Review and Transition Roadmap 2026·Investment Scenario on Tire Materials Exposure Evaluation 2025-26
CLIENT PROFILE
A tyre materials supplier producing synthetic rubber and carbon black across European and Asian operations, serving major tyre manufacturers at annual revenue near 2.1 billion dollars (client-reported, unverified by MMA). Silica and silane capability was limited and commercial coverage followed established plant geography. Compound development support had never been offered to customers. Coverage followed established geography.
STRATEGIC CHALLENGE
Commodity grade margins had compressed against integrated competitors while silica displaced carbon black in the highest value passenger tread applications. Management wanted to know whether to defend commodity position or invest in the technical grades regulation was steadily rewarding. Capital allocation depended on the answer. A decision could not be deferred further.
MMA APPROACH
MMA modelled compound formulation changes required under abrasion limits, quantified silica displacement of carbon black by application, mapped tyre manufacturing capacity relocation against the client's commercial coverage, and assessed natural rubber traceability exposure. Interviews with 47 experts covered tyre compounding, materials supply, plant operations and rubber sourcing. Coverage was benchmarked separately.
KEY FINDINGS
  1. Abrasion limits required formulation changes across the entire stack rather than one ingredient, which opened development conversations the client's commercial model never reached at all.
  2. Silica displacement of carbon black concentrated precisely in passenger tread, the client's highest value application, and regulation was accelerating rather than slowing it.
  3. Commercial coverage followed Chinese plant geography while committed capacity additions were concentrated in Southeast Asia, leaving the fastest growing demand comparatively under-served.
  4. Natural rubber traceability exposure had not been assessed at all, despite deforestation rules applying to material the client purchased for its own compounding operations.
CLIENT PROFILE
A tyre materials supplier producing synthetic rubber and carbon black across European and Asian operations, serving major tyre manufacturers at annual revenue near 2.1 billion dollars (client-reported, unverified by MMA). Silica and silane capability was limited and commercial coverage followed established plant geography. Compound development support had never been offered to customers. Coverage followed established geography.
STRATEGIC CHALLENGE
Commodity grade margins had compressed against integrated competitors while silica displaced carbon black in the highest value passenger tread applications. Management wanted to know whether to defend commodity position or invest in the technical grades regulation was steadily rewarding. Capital allocation depended on the answer. A decision could not be deferred further.
MMA APPROACH
MMA modelled compound formulation changes required under abrasion limits, quantified silica displacement of carbon black by application, mapped tyre manufacturing capacity relocation against the client's commercial coverage, and assessed natural rubber traceability exposure. Interviews with 47 experts covered tyre compounding, materials supply, plant operations and rubber sourcing. Coverage was benchmarked separately.
KEY FINDINGS
  1. Abrasion limits required formulation changes across the entire stack rather than one ingredient, which opened development conversations the client's commercial model never reached at all.
  2. Silica displacement of carbon black concentrated precisely in passenger tread, the client's highest value application, and regulation was accelerating rather than slowing it.
  3. Commercial coverage followed Chinese plant geography while committed capacity additions were concentrated in Southeast Asia, leaving the fastest growing demand comparatively under-served.
  4. Natural rubber traceability exposure had not been assessed at all, despite deforestation rules applying to material the client purchased for its own compounding operations.
RECOMMENDED STRATEGY
Phase 1: Phase one: build compound development capability so the conversation happens at formulation rather than at a purchasing tender nobody wins profitably. Phase 2: Phase two: invest in silane and functionalised polymer grades, since abrasion regulation rewards exactly what they deliver. Commodity grades cannot be defended. Phase 3: Phase three: reallocate commercial coverage toward Southeast Asian plant construction, which is published years ahead of production. Chinese coverage should be reduced accordingly.
OUTCOME
The supplier established compound development support during 2026 and entered formulation discussions it had previously been excluded from (client-reported, unverified by MMA). Silane capability investment was approved, and coverage was reallocated toward relocating manufacturing capacity. Commodity grade promotion was reduced deliberately across the European operations.

Frequently Asked Questions

Foundational context covering the market sizes, CAGR, scope, country, region and competition that inform every finding below. This section is provided to cover basics and most often pre-purchase conversations, answered from the MMA Primary Research Dataset.

What is the current size of the Tire Materials Market?

MMA sizes it at USD 58.0 billion in 2025, rising to USD 61.02 billion in 2026. The figure covers raw materials consumed in tyre manufacture at supplier selling value.

How large will the Tire Materials Market be by 2036?

USD 101.30 billion by 2036, an incremental USD 40.28 billion over the 2026 base and an expansion multiple of 1.66 times. Silica systems carry a disproportionate share.

What is the CAGR for the Tire Materials Market 2026 to 2036?

5.2% in the base case, with a bull case at 6.4% and a bear case at 4.0%. Natural rubber price movement drives most of the spread between them.

Which segment is growing fastest?

Silica and silane systems at 7.8%, half again the market rate of 5.2%. They improve wet grip and rolling resistance together where carbon black cannot.

Who are the major companies in the Tire Materials Market?

Sinopec, Cabot Corporation, Evonik, LANXESS and Bekaert lead on tyre materials revenue. Fifteen further participants are profiled in the full report on the same basis.

Which country is growing fastest?

Vietnam at 9.4%, as tyre manufacturing relocates from China under trade measures and finds natural rubber supply already established in the region at considerable scale.

Report Segmentation Architecture

The full report scope spans multiple orthogonal segmentation dimensions, with cross-tabulated demand data provided for each dimension pair. Coverage extends further to regional breakdowns, trend trajectories, and the competitive detail needed to support segment-level decision-making.

By Material Family

  • Natural Rubber
  • Synthetic Rubber
  • Carbon Black
  • Silica and Silane Systems
  • Reinforcement Cord and Fabric
  • Curing and Protective Chemicals

By End-Use Industry

  • Passenger Vehicle Tyres
  • Truck and Bus Tyres
  • Off-Highway and Agricultural Tyres
  • Two-Wheeler Tyres
  • Aircraft and Specialty Tyres
  • Industrial and Material Handling Tyres

By Commercial Dimension

  • Direct Plant Supply Contracts
  • Indexed Long Term Agreements
  • Spot and Merchant Purchase
  • Traded Commodity Procurement
  • Technical Development Partnerships
  • Distributor and Agent Channels

By Region

  • North America
  • Western Europe
  • East Asia
  • South Asia and Pacific
  • Latin America
  • Middle East and Africa
  • Eastern Europe

Scope, Methodology, and Coverage

Every figure in this report is reproducible from documented input assumptions. The scope below maps the historical period, the forecast horizon, the segmentation dimensions, and the countries covered, alongside the underlying primary and qualitative methodology.
Historical Period
2020 to 2025
Forecast Period
2026 to 2036
Base Year
2025 (USD billions; MMA Primary Research Dataset, August 2026)
Market Definition
Raw materials consumed in tyre manufacture, covering natural rubber, synthetic rubber, carbon black, silica and silane systems, reinforcement cord and fabric, and curing and protective chemicals. Measured at supplier selling value into tyre production. Reclaimed and recycled rubber feedstock, finished tyres, retreading materials and services, tyre manufacturing equipment, and non-tyre rubber goods are excluded from scope.
Quantitative Units
USD billions (current prices); metric tonnes consumed; USD per tonne by material family
Segmentation Dimensions
Material family; end-use industry; commercial dimension; region
Regions Covered
North America, Western Europe, East Asia, South Asia and Pacific, Latin America, Middle East and Africa, Eastern Europe
Countries Covered
United States, Canada, Mexico, Germany, France, Italy, Spain, Finland, China, Japan, South Korea, Taiwan, India, Thailand, Vietnam, Indonesia, Malaysia, Brazil, Saudi Arabia, Poland
Key Companies Profiled
Sinopec, Cabot Corporation, Evonik, LANXESS, Bekaert, Orion Engineered Carbons, Birla Carbon, Tokai Carbon, Solvay, PPG Industries, Kordsa, Hyosung Advanced Materials, Teijin, Kolon Industries, Sri Trang Agro-Industry, Halcyon Agri, Zeon Corporation, Asahi Kasei, Arlanxeo, Eastman Chemical
Quantitative Methodology
Primary survey, n=3,800 respondents, Q4 2025, six countries; demand-side model with trade association cross-validation
Qualitative Methodology
47 expert interviews, Q4 2025; applied to validate demand model assumptions, identify emerging dynamics, and assess competitive positioning
Report Format
PDF and XLSX data workbook (Word format preview document)
Publisher
Market Minds Advisory
Report Code
MMA-2026-CHM-146
Published
August 2026
Contact
sales@marketmindsadvisory.com | www.marketmindsadvisory.com

Purchase the full Tire Materials Market Report (2026 to 2036).

The full report treats tyre materials as a category reshaped by abrasion regulation, which removed the oldest trade-off in rubber compounding and forced formulation change across the whole stack. It sizes all six material families independently through 2036, models silica displacement of carbon black by application, and quantifies natural rubber traceability exposure across smallholder supply. Regional chapters cover all seven regions with tyre manufacturing capacity tracked separately from vehicle demand. Competitive profiling covers 20 participants on one consistent revenue basis. Compound formulation change requirements are modelled by application throughout the analysis.
Six material families sized independently through 2036
Silica displacement of carbon black modelled by tyre application
Natural rubber traceability exposure quantified across smallholder supply chains
Manufacturing capacity relocation tracked separately from vehicle market demand
Electric vehicle material intensity measured against comparable combustion fitments
Twenty participants profiled on one consistent revenue basis

Built For The People Who Decide

From boardroom strategy to bench-side execution, this report is read cover-to-cover by leaders shaping the next decade of their industry, turning demand scenarios, market dynamics and valuation benchmarks into decisions.
CXOs/ Presidents/ VPs/ Managers
M&A and Corporate Development
Strategy Teams and R&D Heads
Procurement and Product Directors
Regulatory and Compliance Leaders
Investor Relations and Equity Analysts