Market Minds Advisory
Thrombocytopenia Treatment Market

Thrombocytopenia Treatment Market: The Competitor Is Less Chemotherapy, Not Another Drug

Most chemotherapy induced thrombocytopenia is managed by cutting the cancer dose rather than raising the platelet count, and that decision never appears anywhere in prescribing data as an untreated patient.

Lead Analyst

Alice Ballenger

Published

September 2026

Make Smarter Decisions with Customized Research Insights

Request a free sample report and evaluate market opportunities, growth trends, and competitive dynamics relevant to your business needs.

2025 MARKET VALUE$2.8BMarket Size 2025
2036 FORECAST VALUE$5.1BBase Case , 2026 to 2036
CAGR 2026 TO 20365.6 %Bull 6.8% / Bear 4.4%
INCREMENTAL OPPORTUNITY$2.1BNet 10- year value creation
EXPANSION MULTIPLE1.72x2036 value over 2026 base
Strategic Levers
M&A Pipeline
Regional Outlook
Country Rankings
Competitive Intelligence
Segmental Deep-dive
Call-Us : 91 93563 13602

Executive Snapshot and Market Trajectory

The largest untreated population in this market does not appear as untreated anywhere. Around 78% of chemotherapy induced thrombocytopenia is handled by reducing or delaying the cancer dose rather than by raising the platelet count, and that decision leaves no prescription record behind it at all.
Which makes the competitive set wrong in almost every commercial plan written for this category. A new agent is not displacing an incumbent drug; it is displacing an oncologist's decision to give less chemotherapy, made quickly at the bedside on a count that arrived that morning. That decision costs nothing, involves no formulary, and is entirely invisible in claims data. Nobody plans against it. Claims data records nothing.
Meanwhile the established class is going generic exactly as it becomes standard of care. Thrombopoietin receptor agonist list prices have fallen roughly 62% following exclusivity loss, so treated patient numbers can rise while value does not. Novel oral agents at 8.4% carry what growth there is. Value has detached from volume, and prevalence is the wrong planning input entirely. Novel mechanisms carry the growth from bases small enough that timing decides everything for now.
Market Definition
Pharmacological therapies raising or maintaining platelet counts in thrombocytopenia, covering thrombopoietin receptor agonists, intravenous immunoglobulin and anti-D, corticosteroids and conventional immunosuppressants, spleen tyrosine kinase and novel oral agents, neonatal Fc receptor antagonists, and rituximab and B-cell directed therapy. Measured at manufacturer net selling value. Excludes platelet transfusion and blood products, splenectomy and surgical procedures, and diagnostic testing.
Base Year Value
$2.8B in 2025 (MMA Primary Research Dataset, August 2026)
Forecast Period
2026 to 2036, eleven discrete annual values
CAGR
5.6% base case. Bull 6.8%. Bear 4.4%.
Fastest Growth Segment
Spleen Tyrosine Kinase and Novel Oral Agents: 8.4% CAGR
Fastest Growth Country
China: 9.8% CAGR
Fastest Growth Region
South Asia and Pacific: 7.6% CAGR
Largest Region
North America: 31% of 2025 global value
Market Leaders
Amgen, Novartis, Sobi, Sanofi, Rigel Pharmaceuticals. Source: MMA Primary Research Dataset, July 2026.
Primary Survey
n=3,800 procurement and R&D decision-makers, Q4 2025, six countries
Methodology
Demand-side build-up, cross-validated against public data, 47 expert interviews

Thrombocytopenia Treatment Market Forecast Scenarios

thrombocytopenia-treatment-market-growth-size-forecast-scenario-1787639952174
Growth ran near 4.6% between 2020 and 2025, and the pattern was volume rising against price falling rather than either moving alone. Thrombopoietin receptor agonists became standard second line therapy in immune thrombocytopenia across most guidelines, which expanded treated patients considerably. Exclusivity loss on the leading oral agent then removed a great deal of that value again, and novel mechanisms arrived from bases too small to offset it.
Base case 5.6% rests on three mechanisms. Novel oral agents grow at 8.4% as spleen tyrosine kinase and Bruton tyrosine kinase inhibitors establish positions in refractory immune thrombocytopenia. Neonatal Fc receptor antagonists grow at 7.6% on antibody clearance mechanisms that suit the disease directly. And China grows fastest of any country at 9.8%, where chemotherapy induced thrombocytopenia carries an approved indication that exists almost nowhere else. Prevalence itself is close to flat everywhere.
The bull case at 6.8% assumes chemotherapy induced thrombocytopenia gaining approved therapy in western markets, which would convert dose reduction decisions into prescriptions across a large oncology population. The bear case at 4.4% is generic thrombopoietin receptor agonist pricing spreading faster than novel agents can establish, leaving a market treating more patients each year for steadily less money.

Competing Against a Dose Reduction

The commercial map of this category is drawn against the wrong opponent. Around 78% of chemotherapy induced thrombocytopenia is managed by reducing or delaying the cancer dose rather than by treating the platelet count, which means a new agent is competing against a clinical decision rather than against another product. That decision costs nothing, needs no formulary approval, and leaves no record any prescribing analysis would detect.
TOP FIVE CONCENTRATION58%Established brands and novel mechanism entrants hold quite different positions
CHEMOTHERAPY POPULATION UNTREATED78%Share receiving dose reduction rather than any platelet raising therapy
TIME TO CONFIRMED DIAGNOSIS4 monthsInterval from presentation to confirmed immune thrombocytopenia diagnosis
PRE-PROCEDURE COURSE LENGTH5 daysDuration of therapy before a scheduled liver disease procedure
PRICE EROSION AFTER EXCLUSIVITY62%Fall in list price following loss of market exclusivity
TREATED ON COUNT ALONE44%Patients started on threshold numbers rather than on bleeding symptoms
Immune thrombocytopenia has a related problem at the front end. There is no confirmatory test, so it remains a diagnosis of exclusion reached around four months after presentation, and roughly 44% of patients start therapy on a platelet threshold rather than on bleeding. Guidelines increasingly call the count alone the wrong trigger. Changing that practice changes the treated population in both directions at once.
Value is meanwhile detaching from volume. Thrombopoietin receptor agonist list prices have fallen roughly 62% since exclusivity loss, so a market treating steadily more patients can generate less revenue each year. Novel oral agents at 8.4% and antibody clearance mechanisms at 7.6% carry what growth exists, both from bases small enough that the arithmetic of the whole category depends on how quickly they establish.
"Nobody is competing with another platelet drug in the oncology setting. They are competing with an oncologist deciding at eight in the morning to give eighty percent of the planned dose, which is free, instant, and leaves no trace anybody can count."
Director, Haematology and Specialty Therapeutics Practice · MMA Healthcare and Life Sciences Practice · August 2026

Market Trends

Dose reduction absorbing chemotherapy induced thrombocytopenia demand invisibly

Around 78% of chemotherapy induced thrombocytopenia is managed by cutting or delaying the cancer dose rather than by raising platelets, which removes the patient from prescribing data entirely while leaving the clinical problem untreated. Commercial plans built on diagnosed prevalence therefore overstate accessible demand considerably. The competitor is a free decision made at the bedside in minutes, and displacing it requires oncology outcome evidence rather than haematology efficacy data alone. Commercial organisations built around haematology call points do not reach the oncologist making that call in the first place. Prevalence based planning overstates it.
Market Impact: China growing fastest at 9.8%

Novel mechanisms arriving as established class loses exclusivity

Thrombopoietin receptor agonist list prices have fallen roughly 62% following exclusivity loss, exactly as spleen tyrosine kinase and Bruton tyrosine kinase inhibitors establish in refractory immune thrombocytopenia at 8.4% growth. Treated patients rise while category value does not, because the volume moving is priced at a fraction of what it once was. Novel agents carry the growth from bases too small to offset the erosion quickly. Procurement authorities in several regions moved to generic supply within a single tender cycle, which removed branded volume faster than anybody had modelled. Novel agents cannot offset that quickly.
Market Impact: Courses run about 5 days

Market Opportunities and Growth Drivers

Approved chemotherapy indications expanding where regulators recognise them

China grows fastest of any country at 9.8% because chemotherapy induced thrombocytopenia carries an approved indication there, supported by recombinant thrombopoietin, which converts dose reduction decisions into treated patients in a way western markets have not managed. The population is enormous and the clinical logic identical everywhere. Regulatory recognition rather than clinical evidence is the difference, and it is the single largest unlocked opportunity in the category. Sponsors pursuing that approval elsewhere are addressing the largest accessible population in the category. Recognition rather than evidence is the whole gap here.
Market Impact: About 44% treated on counts

Procedure linked liver disease courses creating episodic demand

Thrombocytopenia in chronic liver disease is treated for around five days before a scheduled procedure rather than continuously, which is completely different economics from chronic immune thrombocytopenia therapy. The prescriber is a proceduralist working to a scheduled date rather than a haematologist managing a long term condition. That changes the commercial approach entirely, since the decision point is procedure scheduling and the competing option is simply postponing the procedure. Reaching interventional and endoscopy scheduling meets the decision when it is actually made, rather than afterwards. Postponing the procedure is the competing option, and it costs the hospital nothing at all.
Market Impact: Diagnosis takes about 4 months

Market Restraints and Challenges

Threshold based treatment decisions detached from actual bleeding risk

Roughly 44% of immune thrombocytopenia patients start therapy on a platelet count threshold rather than on bleeding, and bleeding risk correlates with the count far more loosely than practice assumes. The root cause is that a number is measurable while bleeding risk is a judgement. Commercially it produces treatment that guidelines increasingly question. Bleeding assessment tools and shared decision frameworks are the mitigations clinical groups are actively developing. Guideline updates have begun recommending bleeding assessment explicitly, which changes the treated population in both directions at once. Practice change moves slowly.
Market Impact: Roughly 78% receive dose reduction

Diagnosis of exclusion delaying therapy by months

Immune thrombocytopenia has no confirmatory test and is reached by excluding other causes, which takes around four months from presentation and leaves patients untreated or treated presumptively throughout. The root cause is the absence of any biomarker, not clinical inattention. Commercially it delays therapy initiation and compresses treated duration. Diagnostic algorithms, specialist referral pathways and emerging autoantibody assays are the approaches under active investigation. Presumptive treatment during that interval is common and rarely recorded as anything else. Emerging autoantibody assays could shorten it considerably, though none has reached routine use yet, and specialist referral remains the practical route.
Market Impact: List prices fell roughly 62%
4 additional market trends, 3 additional growth drivers, and 2 additional restraints and challenges are covered in the full report. Contact sales@marketmindsadvisory.com to access the complete intelligence.

Segment CAGR and Growth Architecture

Six segments split by therapeutic class, because mechanism determines the indication it can serve, the line of therapy it occupies, the exclusivity position it holds and the price it commands. Formulation and dosing variants sit inside each class. Indication and channel dimensions are handled separately within the framework rather than mixed here. Exclusivity position governs everything commercially.
thrombocytopenia-treatment-market-growth-market-share-analysis-1787639952760

Spleen Tyrosine Kinase and Novel Oral Agents

Growing at 8.4%, half again the market rate of 5.6%, spleen tyrosine kinase and Bruton tyrosine kinase inhibitors address refractory immune thrombocytopenia where thrombopoietin receptor agonists have failed, which is a genuinely underserved position rather than a crowded one. Oral administration suits long term management and the mechanisms act on platelet destruction rather than production. Growth comes from a small base and depends on how quickly haematologists move patients through earlier lines, which historically they have done slowly and cautiously. Payer positioning matters more than efficacy here, because a broad label invites assessment against generic therapy while a refractory label changes the comparator to something that has already failed the patient.
CAGR 8.4%

Neonatal Fc Receptor Antagonists

At 7.6% neonatal Fc receptor antagonists accelerate clearance of the autoantibodies driving platelet destruction, which addresses immune thrombocytopenia at its mechanism rather than compensating for it downstream. The class arrived through other autoimmune indications and brings established safety data with it. Administration remains parenteral, which limits it against oral alternatives in long term management, though subcutaneous formats have narrowed that gap considerably and continue to improve on convenience. Payer assessment compares these agents against generic thrombopoietin receptor agonists wherever the label allows it, which makes narrow refractory positioning considerably more valuable than broad indication ambition. Uptake follows haematologist willingness to move patients through lines. Chronic management favours convenience heavily. Convenience decides chronic use.
CAGR 7.6%
Full segment breakdown across 6 segments available in the complete report.

Regional Architecture and Country Demand Map

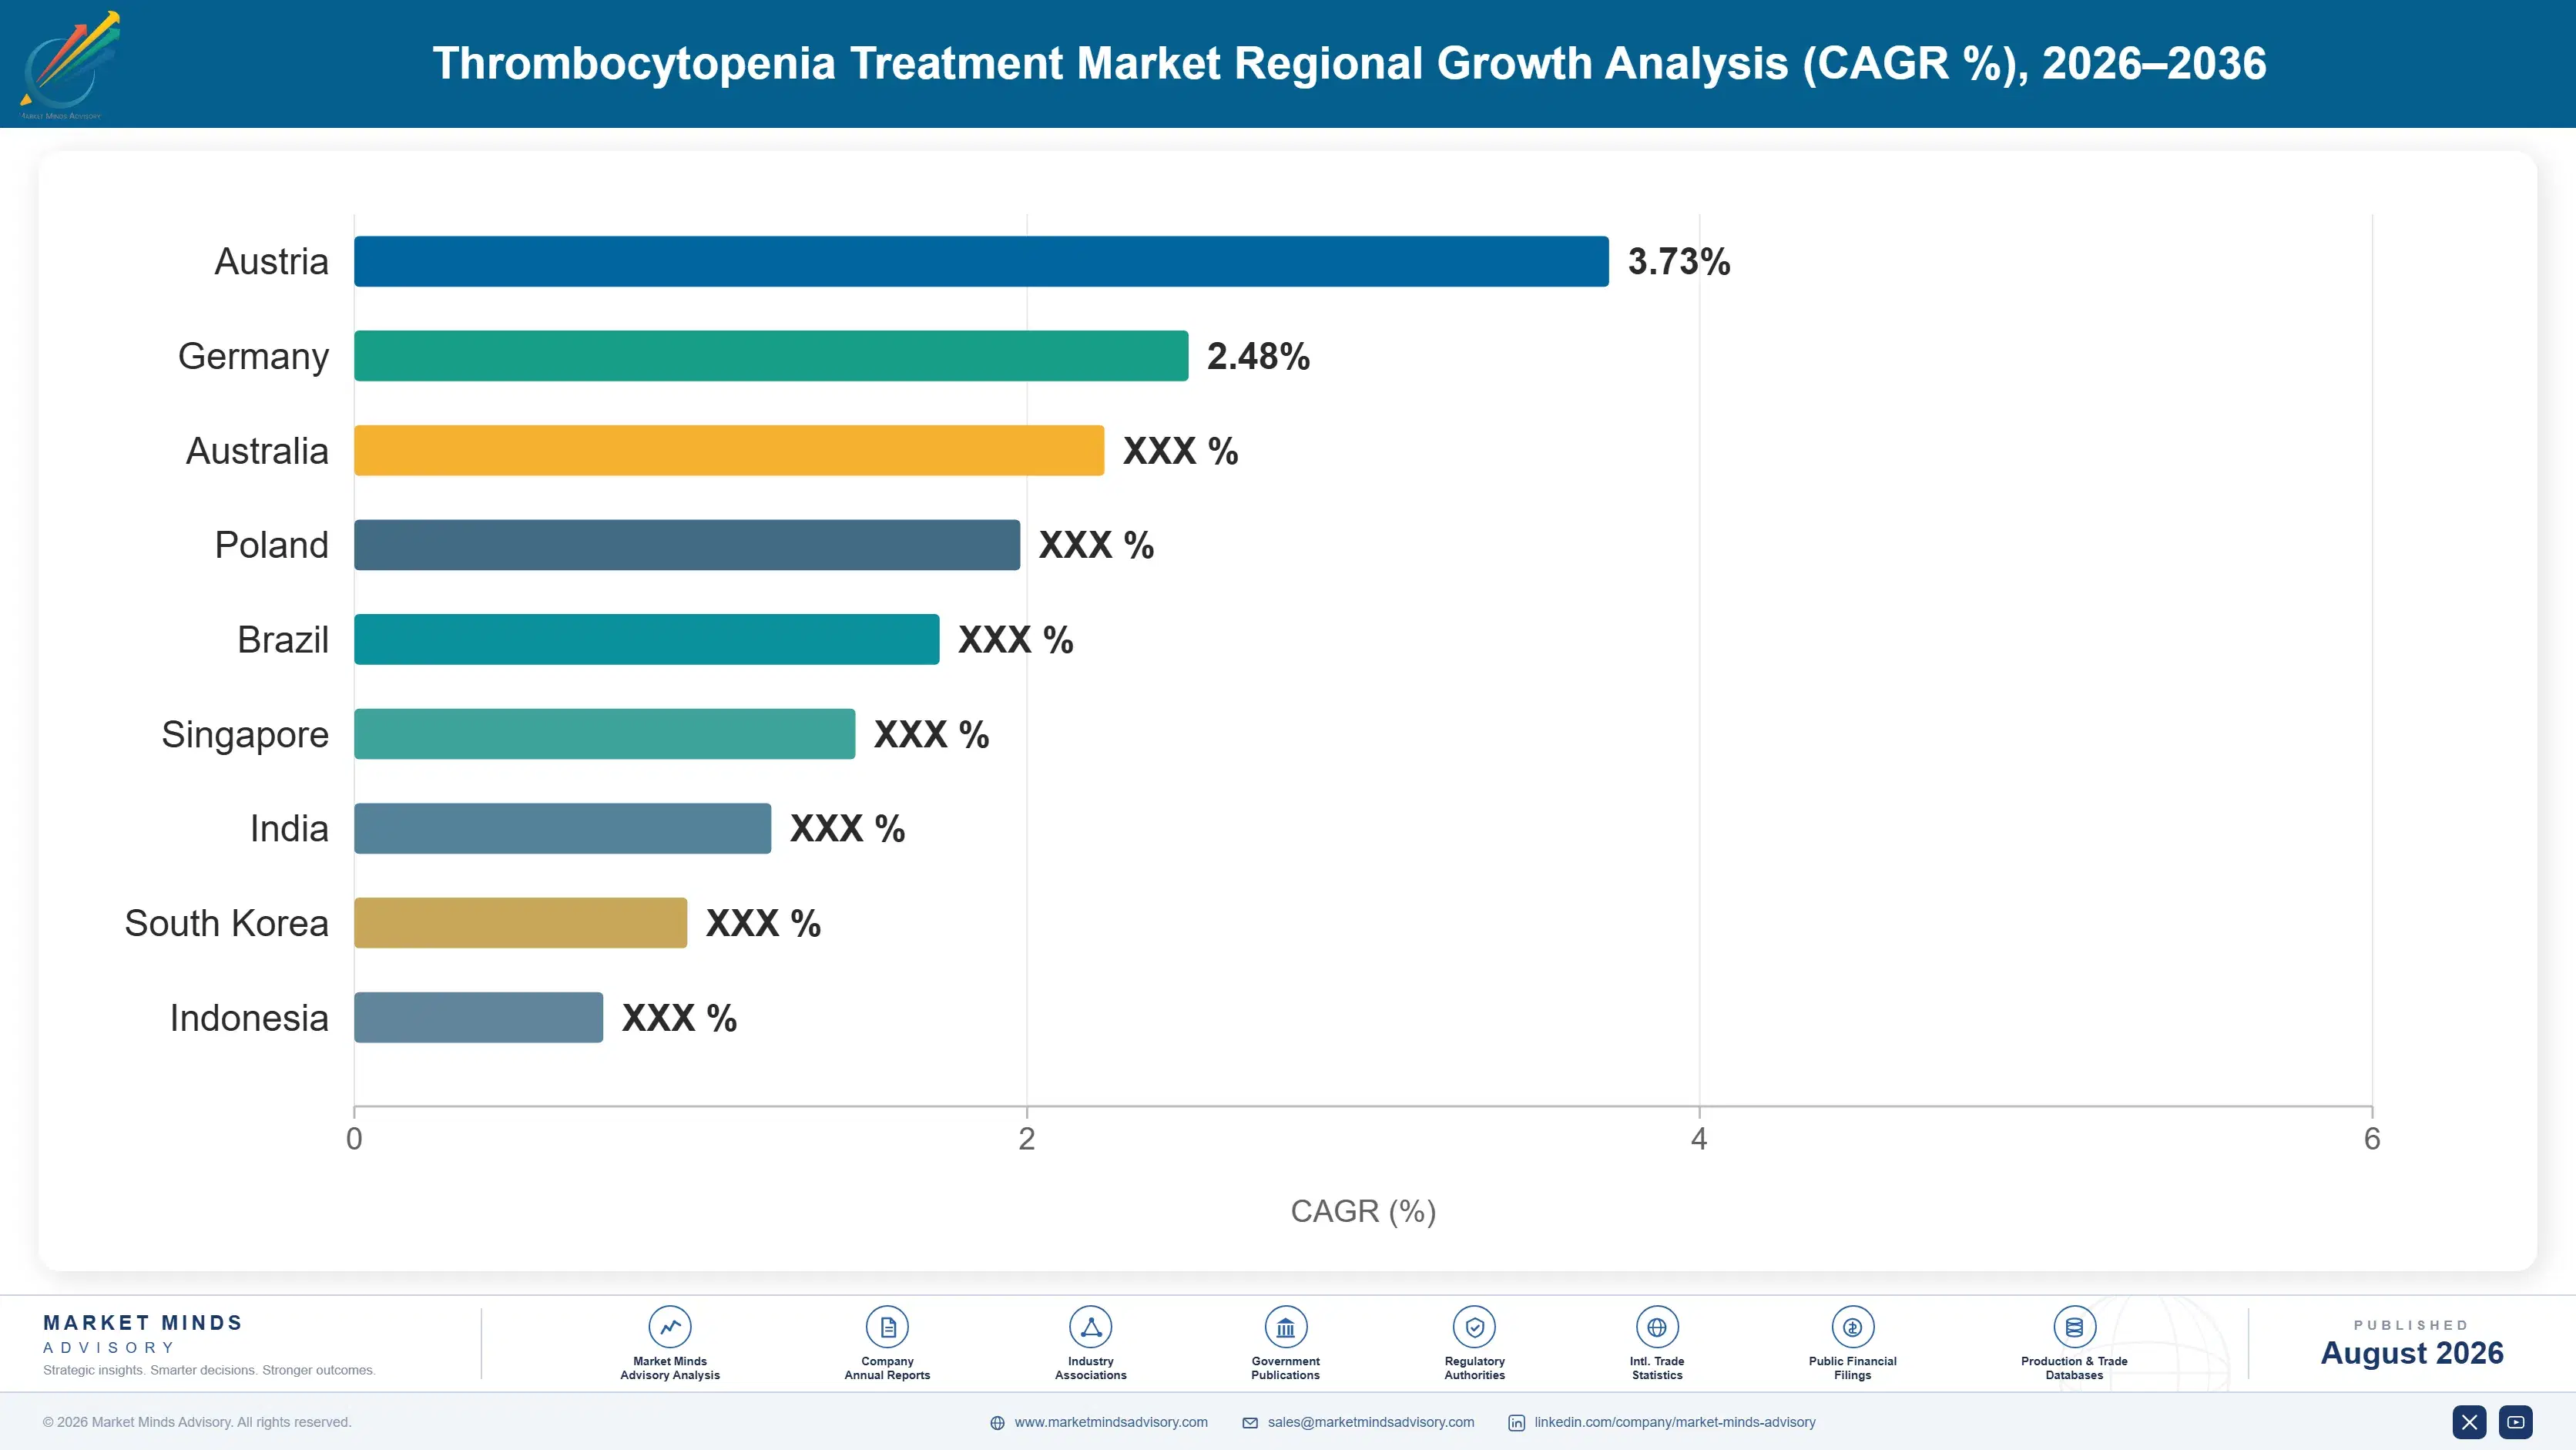
North America holds 31% of value on drug pricing that no other region approaches, despite treating a smaller patient population than East Asia does. East Asia follows at 26% on population scale and approved chemotherapy indications. South Asia and Pacific grows fastest of the seven regions covered here.

North America

Drug pricing rather than patient numbers gives this region its leading share, since branded haematology therapy commands multiples of what the same molecules earn elsewhere. Chemotherapy induced thrombocytopenia has no approved therapy, so oncologists reduce doses and the population never enters prescribing data at all. Exclusivity loss on the leading oral agent has removed considerable value. Growth at 4.6% reflects price erosion offsetting genuine expansion in treated patient numbers. Novel mechanisms are establishing in refractory disease, where the comparator is therapy the patient has already failed rather than cheap generic supply, and that positioning protects considerably more of the price. Prescriber identity splits three ways here. Field organisations rarely cover all three.
Share: 31% | CAGR: 4.6% (2026 to 2036)

Western Europe

Health technology assessment bodies across the region have questioned treatment initiated on platelet thresholds rather than on bleeding, which constrains the treated population more tightly than in North America. Generic thrombopoietin receptor agonist pricing has been adopted quickly by procurement authorities. Novel mechanisms face reimbursement scrutiny on incremental benefit grounds. Regional growth of 4.2% is the slowest anywhere on price pressure and disciplined treatment thresholds together. Prescriber identity varies by indication here as elsewhere, and field organisations built around haematology miss the proceduralists writing liver disease courses entirely. Chemotherapy induced thrombocytopenia has no approved therapy across the region either, so the same dose reduction pattern absorbs a large oncology population invisibly.
Share: 22% | CAGR: 4.2% (2026 to 2036)
Regional intelligence for 5 additional markets available in the complete report: East Asia, South Asia and Pacific, Latin America, Middle East and Africa, Eastern Europe. Contact sales@marketmindsadvisory.com.
thrombocytopenia-treatment-market-growth-country-cagr-analysis-1787639953280

Four Moves Against Invisible Demand

The biggest opportunity here is a population that never appears as untreated, because the answer to a low count was a smaller chemotherapy dose. What remains available is proving oncology outcomes rather than platelet counts, working procedure schedules rather than clinics, and pricing against genericisation honestly. Three prescribers, three different conversations. Coverage rarely reflects that.

Prove oncology outcomes, not platelet counts

Around 78% of chemotherapy induced thrombocytopenia is answered by reducing the cancer dose, so a platelet raising agent must demonstrate that maintaining dose intensity improves cancer outcomes rather than simply that counts rise. Oncologists do not prescribe a haematology endpoint. Evidence generation aimed at dose intensity and tumour response reaches the actual decision, while efficacy data on platelet recovery addresses a question that prescriber never asked. Development spending aimed at platelet recovery answers the wrong question entirely. Oncology outcome evidence is the only argument that reaches an oncologist properly. Haematology data does not.
Market Impact: Addresses the 78% of patients left entirely untreated

Work procedure schedules rather than haematology clinics

Liver disease thrombocytopenia is treated for around five days before a scheduled procedure, and the decision sits with the proceduralist working to a date rather than with any haematologist. Suppliers organised around haematology call points are missing the prescriber entirely. Reaching interventional and endoscopy scheduling reaches the decision at the moment it is made, which is when the procedure is booked rather than when a count is reviewed. Courses run about 5 days and follow whatever the department stocks, which makes formulary presence at procedure level decisive rather than helpful.
Market Impact: Targets the 5 day pre-procedure treatment course volume

Price novel mechanisms against generic reality

Thrombopoietin receptor agonist list prices have fallen roughly 62% since exclusivity loss, which sets the reference every payer now applies to newer agents regardless of mechanism. Pricing a novel oral agent against historic branded levels invites rejection on incremental benefit grounds. Positioning explicitly in refractory disease, where the generic has already failed the patient, is the argument that survives health technology assessment scrutiny intact. Broad label ambition actively undermines the price it was meant to earn. Narrow refractory claims survive health technology assessment intact where broad ones do not. Breadth costs price directly.
Market Impact: Prices realistically against the 62% eroded generic reference

Pursue regulatory recognition of the oncology indication

China grows fastest at 9.8% precisely because chemotherapy induced thrombocytopenia carries an approved indication there and nowhere comparable. The clinical logic is identical in every market, and the difference is regulatory recognition rather than evidence quality or patient need. Sponsors pursuing that approval in western markets are addressing the single largest accessible population in the category, currently absorbed entirely by dose reduction decisions. Evidence quality is not the obstacle, and never has been. Patient need is identical in every market that has not approved it. The population is enormous and entirely accessible in principle.
Market Impact: Follows the 9.8% Chinese approved indication growth rate

Who Controls the Margin Pool

Participation is measured on annual net revenue from thrombocytopenia indications, and the top five hold 58%. Concentration is high because thrombopoietin receptor agonists dominated treatment for a decade under exclusivity. Amgen and Novartis lead through established guideline positions rather than through any current pricing advantage. The gap to challengers is guideline position rather than any pricing advantage, and that position took more than a decade of continuous use to build properly.
Competition runs on three fronts. Guideline position decides second line immune thrombocytopenia, where thrombopoietin receptor agonists remain entrenched. Refractory positioning decides where novel mechanisms establish, since that is where the incumbent has already failed. And price decides everything in markets where generic supply has arrived. Each front rewards a different capability, and very few participants hold more than one of them.

Pressure ahead comes from generic erosion and from novel mechanisms establishing in refractory disease. Expect novel mechanism sponsors to gain share of value while losing on volume. Rankings shift on whoever secures an approved chemotherapy induced indication first. Concentration should fall as novel mechanisms establish. Novel mechanism sponsors gain value share while losing on volume, which is an unusual position and a genuinely uncomfortable one to explain internally.
thrombocytopenia-treatment-market-growth-company-positioning-matrix-1787639953792

Competitive Moat and Risk Dimensions

AMGEN

Moat: Guideline entrenchment and safety data

More than a decade of continuous use in immune thrombocytopenia has built long term safety evidence that newer mechanisms cannot match for many years, and haematologists treating a chronic condition weigh accumulated experience heavily. Guideline position built on that evidence is remarkably difficult to displace, because a challenger must prove not only efficacy but durability across the same timeframe.
AMGEN

Risk: Generic and biosimilar price erosion

Exclusivity loss across the thrombopoietin receptor agonist class has driven list prices down roughly 62%, and procurement authorities in several regions moved to generic supply within a single tender cycle. Volume held while value did not, and no clinical differentiation available to the brand addresses a procurement decision made purely on acquisition cost.
NOVARTIS

Moat: Breadth across thrombocytopenia indications

Positions across immune thrombocytopenia, aplastic anaemia and hepatitis associated disease reach prescribers through several routes rather than one, and a haematologist familiar with the agent in one setting adopts it more readily in another. That breadth also spreads exposure across indications facing quite different pricing and reimbursement pressures at any given moment.
NOVARTIS

Risk: Oral agent exclusivity expiry impact

Loss of exclusivity on the leading oral agent removed considerable value from a franchise that had defined second line treatment for years, and generic supply reached procurement authorities quickly across multiple regions. Rebuilding that value requires novel mechanisms competing against a reference price already reset far below historic branded levels.

Players Tracked

Prominent Players

Amgen
Novartis
Sobi
Sanofi
Rigel Pharmaceuticals

Other Key Players

argenx
UCB
Grifols
Takeda
CSL Behring
Octapharma
Kedrion
3SBio
Hengrui Medicine
Shionogi
Kyowa Kirin
Roche
Teva
Sandoz
Dr Reddys Laboratories

Recent Developments

MARCH 2026

Oral agent approved for refractory immune thrombocytopenia

A novel oral agent received approval for immune thrombocytopenia in patients who had failed prior therapy, positioning explicitly in refractory disease where generic thrombopoietin receptor agonists have already been tried and found insufficient. Payer assessment against that comparator protected considerably more price. Uptake followed haematologist referral patterns.
Signal: Refractory positioning is where a novel mechanism survives payer scrutiny against cheap generic alternatives almost every time
SEPTEMBER 2025

Procurement authority switches to generic supply within one cycle

A national procurement authority moved its entire thrombopoietin receptor agonist supply to generic sourcing within a single tender cycle, removing branded volume immediately and resetting the reference price applied to every subsequent submission. Clinical differentiation played no part in the decision at all. Branded volume did not recover afterwards.
Signal: Procurement decisions made purely on acquisition cost ignore clinical differentiation the brand spent years carefully building
DECEMBER 2025

Guideline update questions treatment on count alone

A haematology guideline update recommended treatment decisions in immune thrombocytopenia be based on bleeding assessment rather than platelet count thresholds alone, which affects roughly 44% of patients currently started on numbers. Bleeding assessment tools were recommended alongside it for routine use. Adoption into national practice is expected to take years.
Signal: Guidelines moving toward bleeding assessment change the treated patient population in both directions at once here

Biologics, Plasma and Trials

Biologic manufacturing carries around 24% of cost for the peptibody and antibody classes, produced in capacity that is expensive to build and slow to qualify. Plasma collection and fractionation absorb roughly 38% of immunoglobulin cost, sourced from donor networks concentrated in a small number of countries. Small molecule synthesis is comparatively cheap at about 9%. Clinical development, regulatory maintenance and distribution account for the balance.
Plasma collection volumes and donor compensation costs both moved sharply across recent years, per Grifols and CSL Behring annual reporting for 2025 on collection cost commentary. Immunoglobulin suppliers passed a considerable part of that through, because supply was genuinely constrained and clinical alternatives in immune thrombocytopenia were limited when counts fell dangerously and quickly. Small molecule producers facing generic competition passed nothing through at all.

Exposure divides on modality rather than on company size. An immunoglobulin supplier carries plasma collection across more than a third of cost with donor availability outside its control entirely. A biologic manufacturer carries capacity and qualification costs that generic entry cannot easily replicate, which is protective. A small molecule producer facing generic competition carries almost no manufacturing exposure and almost no manufacturing defence either.
thrombocytopenia-treatment-market-growth-cost-volatility-analysis-1787639953989

Diversify plasma collection geography ahead of donor constraints

Collection carries more than a third of immunoglobulin cost and concentrates in a small number of countries where donor compensation rules can change with legislation. Widening collection geography costs capital and time but removes an exposure that no formulation change addresses, and supply constraint has repeatedly proved more damaging than price movement. Legislation moves faster than collection capacity.

Position novel mechanisms against refractory disease specifically

Generic reference pricing after roughly 62% erosion applies to any submission a payer assesses on incremental benefit against available therapy. Positioning explicitly where the generic has already failed the patient changes the comparator entirely, which protects price in a way that broader label ambitions actively undermine during assessment. Narrow claims survive assessment intact. Breadth invites the wrong comparator.

Design trials against the endpoint prescribers actually use

Development spending aimed at platelet recovery answers a question oncologists never ask when deciding whether to reduce a chemotherapy dose. Trials measuring maintained dose intensity and tumour outcome cost more and address the actual decision, which is the difference between an approval and a commercially meaningful approval. Approval and commercial approval differ. Endpoint choice decides commercial value.

Portfolio Architecture for Margin Defence

Margin here follows exclusivity position far more than mechanism, because a molecule facing generic supply competes on acquisition cost whatever its clinical merits. Genericised thrombopoietin receptor agonists and corticosteroids earn margins in the mid teens to high twenties, with volume holding while price has reset roughly 62% below historic branded levels. Guideline entrenchment holds the volume while delivering almost nothing to the supplier.
Immunoglobulin and plasma derived therapy sits in the high twenties to low forties, constrained by collection cost across more than a third of the total but protected by supply scarcity that no generic entrant resolves quickly. Donor availability rather than manufacturing capability sets the limit on how much can be supplied. Supply scarcity is the protection here, and no generic entrant resolves it quickly.

Novel mechanisms hold the strongest position, reaching into the high seventies, where refractory positioning gives payers a comparator that has already failed the patient. Those margins depend entirely on holding that narrow indication rather than pursuing broad labels, since a broad label invites assessment against generic therapy and the price collapses toward the reference immediately. Label discipline is worth more than label breadth at this level.

Genericised Agents and Corticosteroids

Molecules facing generic supply where procurement decides on acquisition cost. The twelve point range reflects manufacturing scale and formulation complexity rather than any clinical difference between suppliers. Volume holds while value does not.
Gross Margin: 16-28%

Immunoglobulin and Plasma Derived Therapy

Plasma products constrained by collection cost but protected by genuine supply scarcity. The fourteen point range reflects collection network ownership and fractionation efficiency, which vary considerably between suppliers. Donor availability sets the real limit.
Gross Margin: 28-42%

Novel Mechanism Agents

Oral and antibody clearance mechanisms positioned in refractory disease. The sixteen point range reflects whether the label stayed narrow enough to avoid comparison against generic therapy during payer assessment. Narrow claims protect the price properly.
Gross Margin: 62-78%
thrombocytopenia-treatment-market-growth-portfolio-architecture-1787639954484

High-value Sub-segments and Strategic Watch-out

Novel Oral Agents

High value and the fastest growth at 8.4%, positioned where generic thrombopoietin receptor agonists have already failed. Label breadth is the risk, since a wider claim invites comparison against cheap available therapy. Refractory positioning is the whole defence available. Payers reject broad claims consistently. Discipline matters most.
Gross Margin: 62-78%

Neonatal Fc Receptor Antagonists

High value and growing at 7.6% on autoantibody clearance addressing the disease mechanism directly. Parenteral administration limits it against oral alternatives in long term chronic management despite subcutaneous improvements. Subcutaneous formats have narrowed that gap considerably. Established safety data arrived with the class. Uptake follows line movement.
Gross Margin: 58-74%

Genericised Thrombopoietin Receptor Agonists

The volume core, treating most second line patients at prices roughly 62% below historic branded levels. Guideline entrenchment holds the volume while delivering almost no value to any supplier. Procurement decides on acquisition cost alone. Guideline entrenchment holds volume regardless. Value has gone entirely. Volume has not.
Gross Margin: 16-28%

Chemotherapy Induced Population

The strategic watch-out. Around 78% receive dose reduction instead of therapy, and the range reflects whether a sponsor secures approval with an oncology endpoint or leaves the population entirely untreated. Oncology endpoint evidence is the only route. Dose reduction currently absorbs it entirely. Approval is the gap.
Gross Margin: 0-70%

Chronic, Episodic and Invisible

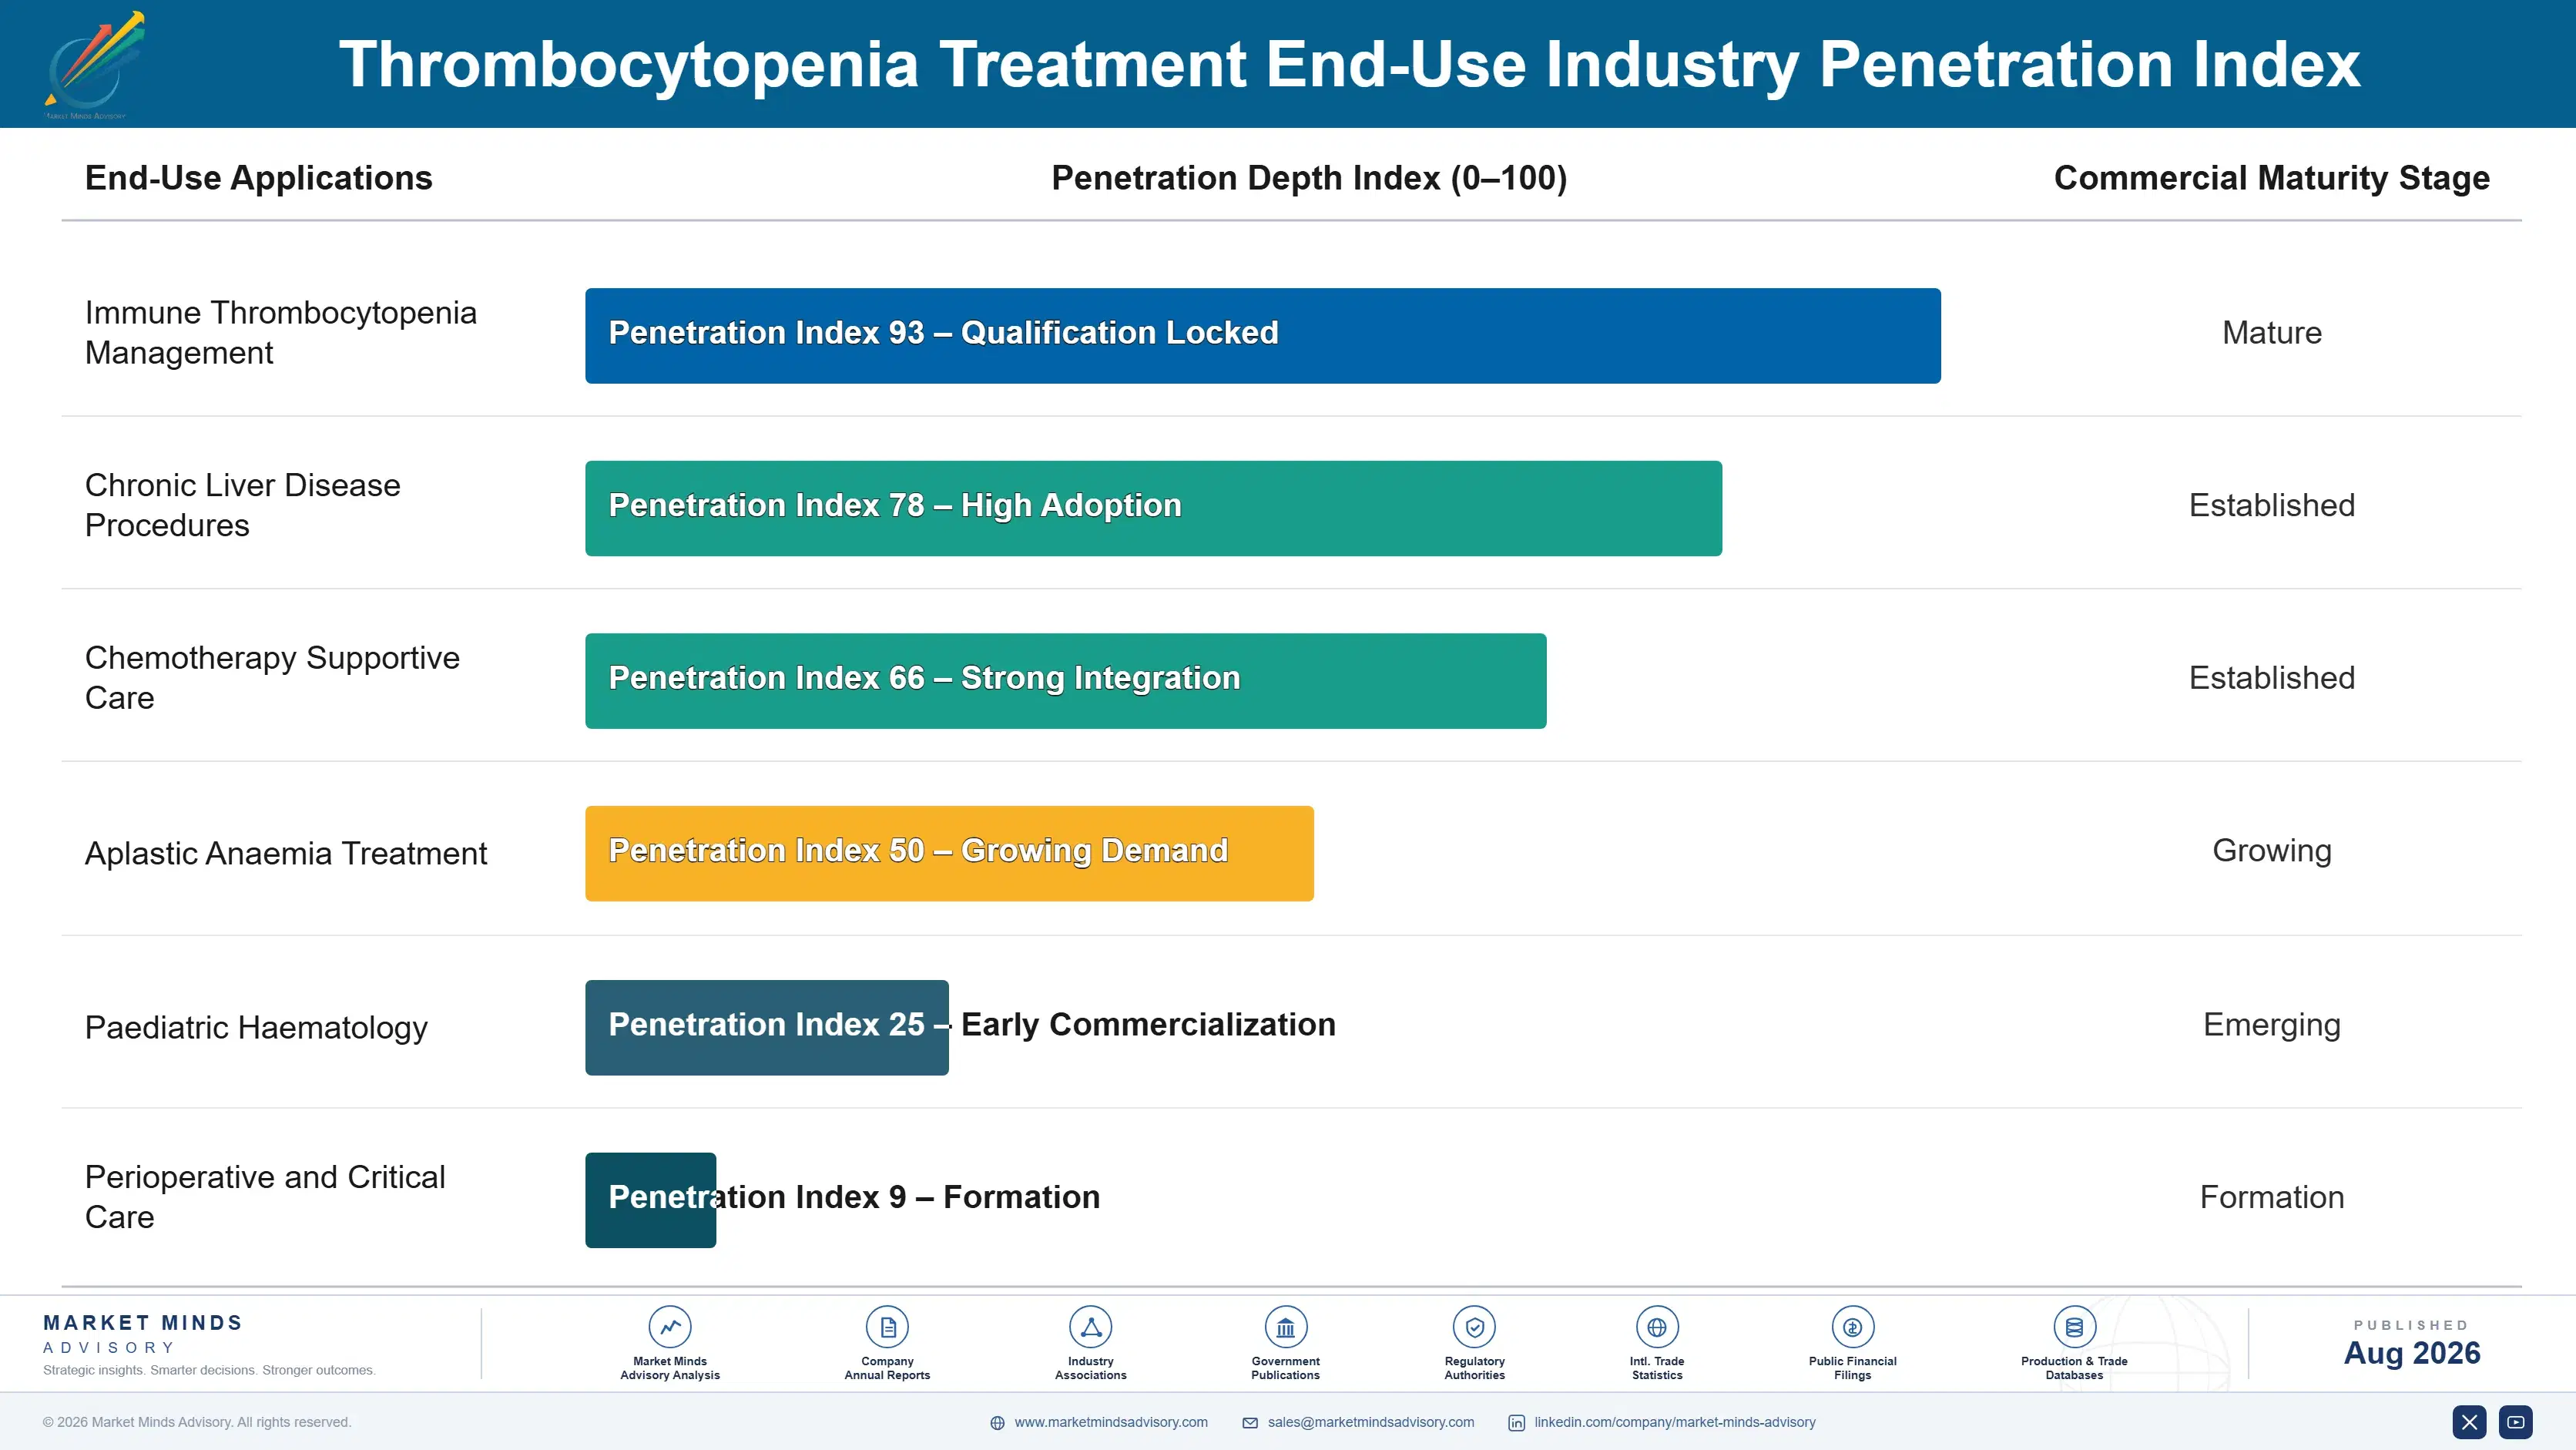
Demand splits three ways and each behaves entirely differently. Immune thrombocytopenia is chronic therapy managed by haematologists over years, which produces genuine annuity revenue per patient. Liver disease thrombocytopenia is a five day course before a scheduled procedure, which is episodic and tied to procedure volume. Chemotherapy induced thrombocytopenia is mostly not demand at all, because the dose gets cut instead. Three patterns, one category.
Stickiness follows the setting closely. A haematologist who has stabilised a patient on a chronic agent changes it only on loss of response or on procurement instruction, so those positions hold for years. Procedure linked prescribing resets with each case and follows whatever the department stocks. Hospital formulary decisions override individual preference completely wherever generic supply exists. Setting rather than molecule decides how long a position holds.

The deciding clinician differs by indication in a way commercial organisation rarely reflects. Haematologists decide chronic immune thrombocytopenia. Proceduralists and endoscopists decide liver disease courses at the point of scheduling. Oncologists decide the chemotherapy population, usually by not prescribing anything. A field organisation built entirely around haematology reaches one of those three. Coverage has not followed the prescriber.
thrombocytopenia-treatment-market-growth-end-use-penetration-index-1787639954975

Where We Would Put Effort

These are among the four positions where our research anticipates prominent divergence between winners and laggards over the coming forecast period. Each is grounded in the demand model, the regulatory perimeter, and the announced capacity pipeline.
01 / ONCOLOGY ENDPOINT EVIDENCE

The dose reduction is the competitor

Around 78% of chemotherapy induced thrombocytopenia is answered by cutting or delaying the cancer dose, which means a platelet raising agent competes against a free clinical decision taken at the bedside rather than against any product on a formulary. Oncologists prescribe against cancer outcomes and never against a haematology efficacy endpoint alone. Evidence aimed at maintained dose intensity and tumour response reaches that decision directly, while platelet recovery data answers a question the prescriber never asked and would not act on.
02 / PROCEDURE CHANNEL ACCESS

The proceduralist writes that prescription

Liver disease thrombocytopenia is treated for about five days before a scheduled procedure, and the decision belongs to the proceduralist working toward a booked date rather than to any haematologist managing a chronic condition. Suppliers organised entirely around haematology call points miss that prescriber completely, and rarely realise the coverage gap exists. Reaching interventional and endoscopy scheduling meets that decision at the moment the procedure is booked, which is considerably earlier in the pathway than the moment any platelet count gets reviewed.
03 / REFRACTORY LABEL DISCIPLINE

A wider label collapses the price

Thrombopoietin receptor agonist list prices have fallen roughly 62% since exclusivity loss, and that reference price now applies to any submission a payer assesses against available therapy on incremental benefit grounds anywhere. Positioning explicitly where the generic has already failed that patient changes the comparator entirely and protects the price throughout the assessment process. Pursuing a broad label invites exactly the comparison that destroys the margin the novel mechanism was developed, funded and priced to earn in the first place.
04 / INDICATION APPROVAL PURSUIT

Recognition, not evidence, is the gap

China grows fastest of any country at 9.8% because chemotherapy induced thrombocytopenia carries an approved indication there and nowhere comparable, supported by recombinant thrombopoietin in routine oncology practice across a very large treated population. The underlying clinical logic is identical across every market, so the difference is regulatory recognition rather than evidence quality or patient need. Sponsors pursuing that approval in western markets are addressing the single largest accessible population anywhere in this category, currently absorbed entirely by dose reduction.

Engagement Snapshot From the Field

A live engagement with an industry participant carrying material or product regulatory and market exposure ahead of a defining policy shift, showing how our research translates into a defensible multi-year portfolio strategy.
MARKET MINDS ADVISORY · CLIENT ENGAGEMENT SUMMARY
Thrombocytopenia Treatment Producer Strategic Portfolio Review and Transition Roadmap 2026·Investment Scenario on Thrombocytopenia Treatment Exposure Evaluation 2025-26
CLIENT PROFILE
A specialty haematology company marketing a thrombopoietin receptor agonist and developing a novel oral agent, selling across North American and European markets at annual revenue near 640 million dollars (client-reported, unverified by MMA). Field organisation was built entirely around haematology call points and hospital formularies. Procedure linked prescribing had never been covered at all. Coverage gaps were unmapped.
STRATEGIC CHALLENGE
Generic entry had removed a substantial part of branded revenue within two tender cycles, and the development agent was being positioned for a broad immune thrombocytopenia label. Management wanted to know whether that breadth would survive payer assessment against generic therapy. Development spending was already committed against the broad claim.
MMA APPROACH
MMA modelled payer assessment outcomes for broad against refractory labels, quantified the chemotherapy induced population absorbed by dose reduction, mapped prescriber identity by indication against the client's field coverage, and assessed procedure linked prescribing routes. Interviews with 47 experts covered haematology, oncology, interventional procedures and payer assessment. Pricing scenarios were modelled separately.
KEY FINDINGS
  1. A broad label would be assessed against generic thrombopoietin receptor agonists on incremental benefit, which modelling suggested would reset the achievable price close to reference levels.
  2. Roughly three quarters of the chemotherapy induced population was being managed by dose reduction, invisible in every prescribing dataset the client used for planning purposes.
  3. Liver disease prescribing sat with proceduralists at the point of scheduling, a call point the client's field organisation had never covered or even mapped properly.
  4. Refractory positioning changed the payer comparator to therapy that had already failed the patient, which modelling indicated would protect substantially more of the price.
CLIENT PROFILE
A specialty haematology company marketing a thrombopoietin receptor agonist and developing a novel oral agent, selling across North American and European markets at annual revenue near 640 million dollars (client-reported, unverified by MMA). Field organisation was built entirely around haematology call points and hospital formularies. Procedure linked prescribing had never been covered at all. Coverage gaps were unmapped.
STRATEGIC CHALLENGE
Generic entry had removed a substantial part of branded revenue within two tender cycles, and the development agent was being positioned for a broad immune thrombocytopenia label. Management wanted to know whether that breadth would survive payer assessment against generic therapy. Development spending was already committed against the broad claim.
MMA APPROACH
MMA modelled payer assessment outcomes for broad against refractory labels, quantified the chemotherapy induced population absorbed by dose reduction, mapped prescriber identity by indication against the client's field coverage, and assessed procedure linked prescribing routes. Interviews with 47 experts covered haematology, oncology, interventional procedures and payer assessment. Pricing scenarios were modelled separately.
KEY FINDINGS
  1. A broad label would be assessed against generic thrombopoietin receptor agonists on incremental benefit, which modelling suggested would reset the achievable price close to reference levels.
  2. Roughly three quarters of the chemotherapy induced population was being managed by dose reduction, invisible in every prescribing dataset the client used for planning purposes.
  3. Liver disease prescribing sat with proceduralists at the point of scheduling, a call point the client's field organisation had never covered or even mapped properly.
  4. Refractory positioning changed the payer comparator to therapy that had already failed the patient, which modelling indicated would protect substantially more of the price.
RECOMMENDED STRATEGY
Phase 1: Phase one: narrow the development label to refractory disease, since a broad claim invites assessment against cheap generic therapy and loses. Phase 2: Phase two: build procedure scheduling coverage for the liver disease indication, where the prescriber is not a haematologist at all. Phase 3: Phase three: design chemotherapy induced development against dose intensity endpoints that oncologists actually use when deciding. Platelet recovery is the wrong measure entirely.
OUTCOME
The company narrowed its development label to refractory immune thrombocytopenia during 2026 and revised pricing assumptions upward accordingly (client-reported, unverified by MMA). Procedure channel coverage was established, and oncology endpoint design work began in the following quarter. Haematology field coverage was rebalanced toward the two neglected prescriber groups.

Frequently Asked Questions

Foundational context covering the market sizes, CAGR, scope, country, region and competition that inform every finding below. This section is provided to cover basics and most often pre-purchase conversations, answered from the MMA Primary Research Dataset.

What is the current size of the Thrombocytopenia Treatment Market?

MMA sizes it at USD 2.8 billion in 2025, rising to USD 2.96 billion in 2026. The figure covers pharmacological platelet raising therapy at manufacturer net selling value.

How large will the Thrombocytopenia Treatment Market be by 2036?

USD 5.10 billion by 2036, an incremental USD 2.14 billion over the 2026 base and an expansion multiple of 1.72 times. Novel mechanisms carry most of that gain.

What is the CAGR for the Thrombocytopenia Treatment Market 2026 to 2036?

5.6% in the base case, with a bull case at 6.8% and a bear case at 4.4%. The spread turns on whether chemotherapy induced thrombocytopenia gains approved therapy in western markets.

Which segment is growing fastest?

Spleen tyrosine kinase and novel oral agents at 8.4%, half again the market rate of 5.6%. They address refractory disease where generic thrombopoietin receptor agonists have already failed.

Who are the major companies in the Thrombocytopenia Treatment Market?

Amgen, Novartis, Sobi, Sanofi and Rigel Pharmaceuticals lead on thrombocytopenia net revenue. Fifteen further participants are profiled in the full report on the same consistent basis.

Which country is growing fastest?

China at 9.8%, where chemotherapy induced thrombocytopenia carries an approved indication supported by recombinant thrombopoietin that exists almost nowhere else, converting dose reduction decisions into treated patients at scale.

Report Segmentation Architecture

The full report scope spans multiple orthogonal segmentation dimensions, with cross-tabulated demand data provided for each dimension pair. Coverage extends further to regional breakdowns, trend trajectories, and the competitive detail needed to support segment-level decision-making.

By Therapeutic Class

  • Thrombopoietin Receptor Agonists
  • Intravenous Immunoglobulin and Anti-D
  • Corticosteroids and Conventional Immunosuppressants
  • Spleen Tyrosine Kinase and Novel Oral Agents
  • Neonatal Fc Receptor Antagonists
  • Rituximab and B-Cell Directed Therapy

By End-Use Industry

  • Immune Thrombocytopenia Management
  • Chronic Liver Disease Procedures
  • Chemotherapy Supportive Care
  • Aplastic Anaemia Treatment
  • Paediatric Haematology
  • Perioperative and Critical Care

By Commercial Dimension

  • Hospital Formulary Supply
  • Retail and Specialty Pharmacy
  • National Tender Procurement
  • Private Insurance Reimbursement
  • Patient Access Programmes
  • Clinical Trial and Named Patient Supply

By Region

  • North America
  • Western Europe
  • East Asia
  • South Asia and Pacific
  • Latin America
  • Middle East and Africa
  • Eastern Europe

Scope, Methodology, and Coverage

Every figure in this report is reproducible from documented input assumptions. The scope below maps the historical period, the forecast horizon, the segmentation dimensions, and the countries covered, alongside the underlying primary and qualitative methodology.
Historical Period
2020 to 2025
Forecast Period
2026 to 2036
Base Year
2025 (USD billions; MMA Primary Research Dataset, August 2026)
Market Definition
Pharmacological therapies raising or maintaining platelet counts in thrombocytopenia, covering thrombopoietin receptor agonists, intravenous immunoglobulin and anti-D, corticosteroids and conventional immunosuppressants, spleen tyrosine kinase and novel oral agents, neonatal Fc receptor antagonists, and rituximab and B-cell directed therapy. Measured at manufacturer net selling value. Platelet transfusion and blood products, splenectomy and surgical procedures, and diagnostic testing are excluded from scope.
Quantitative Units
USD billions (net prices); treated patients; USD per patient year by therapeutic class
Segmentation Dimensions
Therapeutic class; end-use industry; commercial dimension; region
Regions Covered
North America, Western Europe, East Asia, South Asia and Pacific, Latin America, Middle East and Africa, Eastern Europe
Countries Covered
United States, Canada, Mexico, Germany, France, United Kingdom, Italy, Spain, China, Japan, South Korea, Taiwan, India, Australia, Singapore, Brazil, Argentina, Saudi Arabia, South Africa, Poland
Key Companies Profiled
Amgen, Novartis, Sobi, Sanofi, Rigel Pharmaceuticals, argenx, UCB, Grifols, Takeda, CSL Behring, Octapharma, Kedrion, 3SBio, Hengrui Medicine, Shionogi, Kyowa Kirin, Roche, Teva, Sandoz, Dr Reddys Laboratories
Quantitative Methodology
Primary survey, n=3,800 respondents, Q4 2025, six countries; demand-side model with trade association cross-validation
Qualitative Methodology
47 expert interviews, Q4 2025; applied to validate demand model assumptions, identify emerging dynamics, and assess competitive positioning
Report Format
PDF and XLSX data workbook (Word format preview document)
Publisher
Market Minds Advisory
Report Code
MMA-2026-HLT-133
Published
August 2026
Contact
sales@marketmindsadvisory.com | www.marketmindsadvisory.com

Purchase the full Thrombocytopenia Treatment Market Report (2026 to 2036).

The full report treats thrombocytopenia as a category where the largest population never appears as untreated, because the answer to a low count was a smaller chemotherapy dose. It sizes all six therapeutic classes independently through 2036, quantifies the population absorbed by dose reduction, and models payer assessment outcomes for broad against refractory positioning. Regional chapters cover all seven regions with generic pricing tracked separately from treated volume. Competitive profiling covers 20 participants on one consistent net revenue basis. Prescriber identity is mapped by indication and by care setting throughout the analysis.
Six therapeutic classes sized independently through 2036
Chemotherapy population absorbed by dose reduction quantified by market
Payer assessment modelled for broad against refractory label positioning
Prescriber identity mapped by indication and by care setting
Generic price erosion tracked separately from treated patient volume
Twenty participants profiled on one consistent net revenue basis

Built For The People Who Decide

From boardroom strategy to bench-side execution, this report is read cover-to-cover by leaders shaping the next decade of their industry, turning demand scenarios, market dynamics and valuation benchmarks into decisions.
CXOs/ Presidents/ VPs/ Managers
M&A and Corporate Development
Strategy Teams and R&D Heads
Procurement and Product Directors
Regulatory and Compliance Leaders
Investor Relations and Equity Analysts