Market Minds Advisory
Thiamine Market

Thiamine Market: The Volume That Exists Only Because the Molecule Degrades

Roughly thirty percent of every fortification dose exists only to survive processing and shelf life, which means better stability would quietly remove volume the industry currently sells quite profitably each year.

Lead Analyst

Bilal Shaikh

Published

September 2026

Make Smarter Decisions with Customized Research Insights

Request a free sample report and evaluate market opportunities, growth trends, and competitive dynamics relevant to your business needs.

2025 MARKET VALUE$0.4BMarket Size 2025
2036 FORECAST VALUE$0.7BBase Case , 2026 to 2036
CAGR 2026 TO 20364.6 %Bull 5.8% / Bear 3.4%
INCREMENTAL OPPORTUNITY$0.2BNet 10- year value creation
EXPANSION MULTIPLE1.57x2036 value over 2026 base
Strategic Levers
M&A Pipeline
Regional Outlook
Country Rankings
Competitive Intelligence
Segmental Deep-dive
Call-Us : 91 93563 13602

Executive Snapshot and Market Trajectory

A meaningful share of thiamine sold every year is never eaten as intended. Formulators add roughly 30% above label claim because the vitamin degrades through baking, extrusion and storage, and that overage exists purely to survive the journey rather than to nourish anybody at the end of it.
Which makes stability an uncomfortable commercial subject. Encapsulated and stabilised formats grow at 6.9%, half again the market rate of 4.6%, and every point of retention they recover removes overage volume from the total. The industry's own product improvement shrinks the thing it sells, which is why incumbents have promoted it with visible reluctance for years. Better retention shrinks the tonnage that pays for the development.
Supply is the other constraint and it is geographic. Around 85% of world capacity sits in China across an eight step synthesis with difficult effluent, and environmental enforcement has driven prices to roughly 3.4 times normal levels within a single quarter. Buyers holding one qualified source discovered what that costs them. Qualification takes months while enforcement moves prices within weeks, which is the whole exposure in one sentence. Dual sourcing costs more in ordinary quarters.
Market Definition
Thiamine and its salts, derivatives and formulated forms supplied as an ingredient, covering thiamine mononitrate, thiamine hydrochloride, premix and blended formats, encapsulated and stabilised grades, thiamine derivatives including benfotiamine and fursultiamine, and thiamine pyrophosphate and coenzyme forms. Measured at producer selling value. Excludes finished multivitamin products sold to consumers, other B group vitamins, and fortified foods measured at retail.
Base Year Value
$0.4B in 2025 (MMA Primary Research Dataset, August 2026)
Forecast Period
2026 to 2036, eleven discrete annual values
CAGR
4.6% base case. Bull 5.8%. Bear 3.4%.
Fastest Growth Segment
Encapsulated and Stabilised Thiamine: 6.9% CAGR
Fastest Growth Country
Indonesia: 8.4% CAGR
Fastest Growth Region
South Asia and Pacific: 6.6% CAGR
Largest Region
East Asia: 32% of 2025 global value
Market Leaders
DSM-Firmenich, Brother Enterprises, Jiangsu Tianxin Pharmaceutical, Huazhong Pharmaceutical, BASF. Source: MMA Primary Research Dataset, July 2026.
Primary Survey
n=3,800 procurement and R&D decision-makers, Q4 2025, six countries
Methodology
Demand-side build-up, cross-validated against public data, 47 expert interviews

Thiamine Market Forecast Scenarios

thiamine-market-trends-size-forecast-scenario-1787639915499
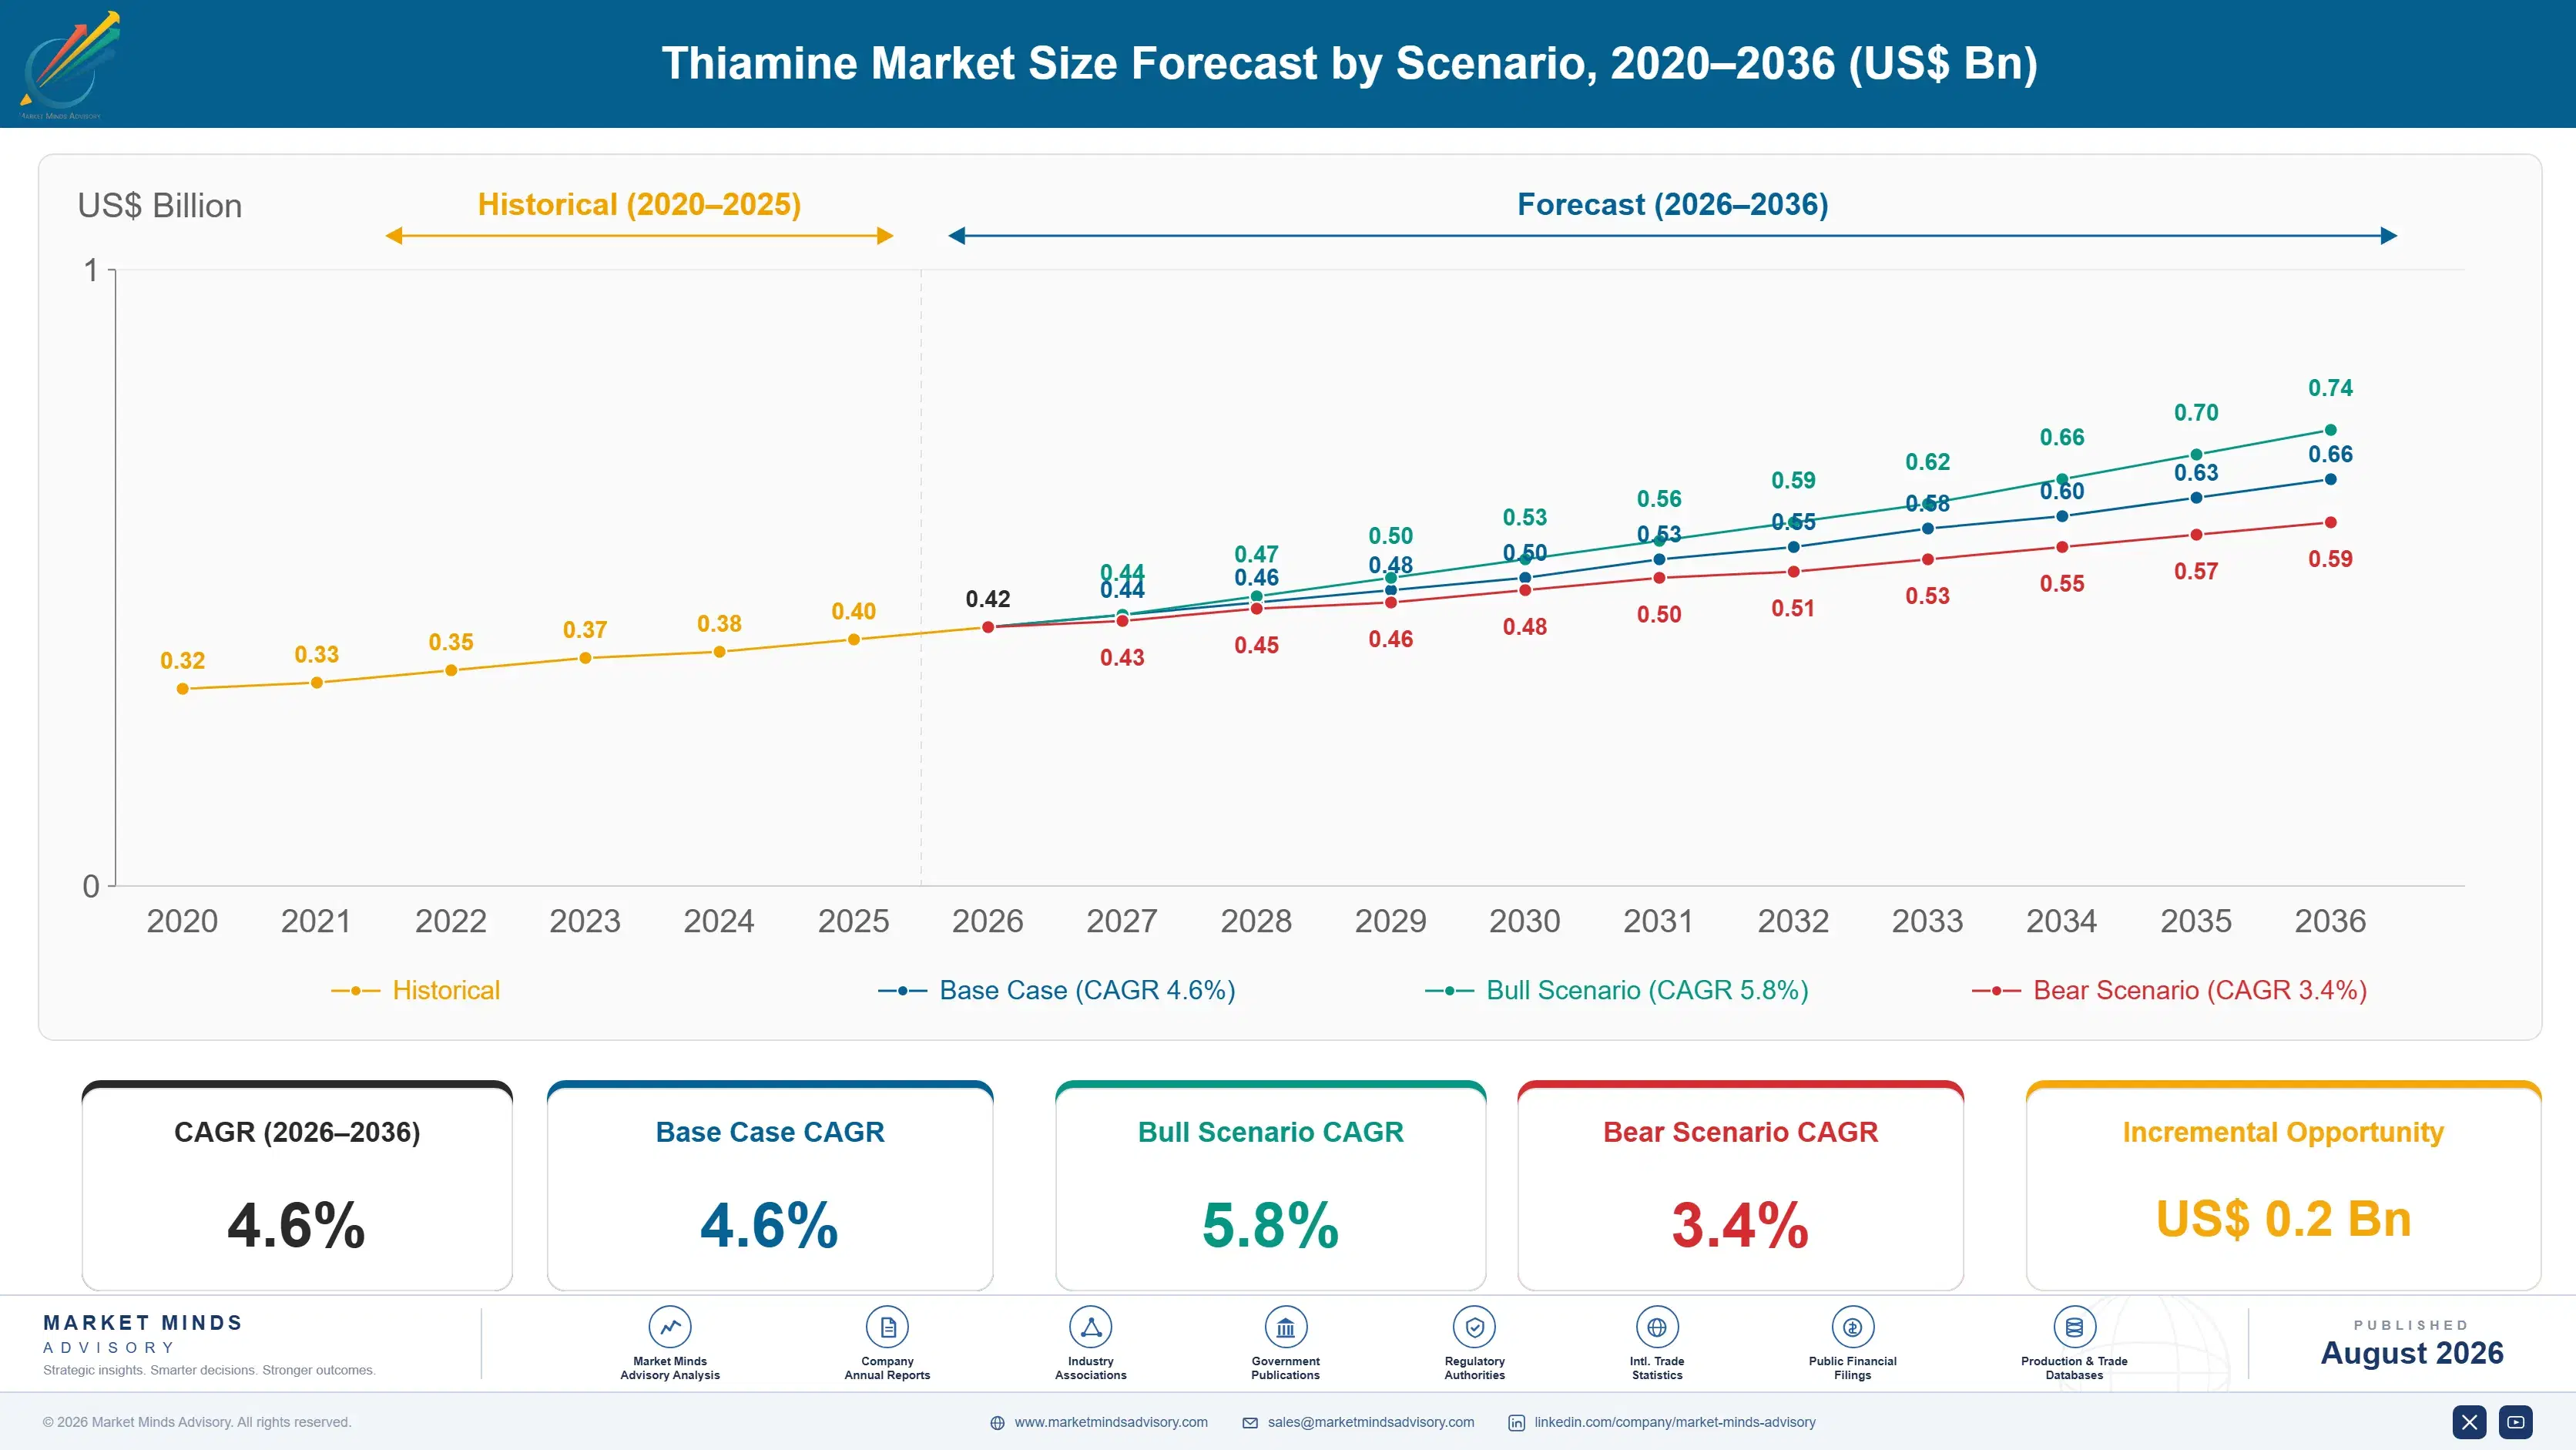
Growth ran near 3.6% between 2020 and 2025 and the volume story was considerably duller than the price story. Fortification mandates across more than 90 countries kept baseline demand steady regardless of price, while Chinese environmental enforcement produced price movements far larger than any change in consumption. Supplement demand grew faster than food fortification, and derivatives outgrew both from a smaller base.
Base case 4.6% rests on three mechanisms. Encapsulated and stabilised formats grow at 6.9% as formulators pursue retention rather than overage. Thiamine derivatives grow at 5.8% on fat soluble absorption advantages in supplements and clinical nutrition. And Indonesia grows fastest of any country at 8.4% on flour fortification enforcement combined with aquaculture and poultry feed volume expanding together. Fortification tonnage itself grows barely at all, so the growth story sits entirely in formats.
The bull case at 5.8% assumes clinical thiamine deficiency recognition widening in hospital protocols, which would pull injectable and pharmaceutical grade demand up sharply from a small base. The bear case at 3.4% is encapsulation succeeding faster than expected, since better retention removes overage volume, and the roughly 30% currently added to survive processing would simply stop being purchased.

Selling the Margin of Degradation

A large part of this market exists because the molecule is fragile. Thiamine degrades through baking, extrusion, retort processing and ordinary warehouse storage, so formulators add roughly 30% above label claim to guarantee the declared figure still holds at the end of shelf life. That overage is real purchased volume, it is entirely rational for the formulator, and it exists only to be destroyed before anybody consumes the product.
TOP FIVE CONCENTRATION68%Production concentrated among a small group of established manufacturers
CHINESE CAPACITY SHARE85%Portion of world production sitting inside one single country
TYPICAL FORMULATION OVERAGE30%Extra dose added to guarantee label claim at expiry
SYNTHESIS STEP COUNT8 stepsReaction stages between starting materials and the finished vitamin
FORTIFICATION MANDATE COUNTRIES92National wheat flour programmes requiring the vitamin by law
ENFORCEMENT PRICE MULTIPLE3.4xLevel prices reached during recent environmental production shutdowns abroad
Which puts the industry in an awkward position on stability. Encapsulated and stabilised formats grow at 6.9%, half again the market rate of 4.6%, and every point of retention they deliver removes overage volume from total demand. A supplier selling better protection is selling less material, and the pricing premium on stabilised grades only partly compensates. Incumbents have promoted it with a reluctance easy to understand and hard to defend.
Supply concentration is the other governing fact. Roughly 85% of world capacity sits in China, produced through an eight step synthesis with effluent that attracts regulatory attention, and enforcement campaigns have driven contract prices to around 3.4 times normal levels inside a single quarter. Buyers who qualified one source on cost found that qualification is exactly what prevents moving.
"About a third of what gets sold is insurance against the molecule falling apart before anybody eats it. Solve the stability problem properly and you have removed a slice of your own market, which explains a great deal about how enthusiastically it has been solved."
Director, Nutrition Ingredients and Fine Chemicals Practice · MMA Chemicals and Materials Practice · August 2026

Market Trends

Stability improvement quietly removing purchased overage volume

Formulators add roughly 30% above label claim to survive processing and shelf life, and encapsulated formats growing at 6.9% recover part of that retention directly. Every point recovered is volume nobody buys again. The pricing premium on stabilised grades compensates only partly, which puts suppliers in the position of selling a product improvement that shrinks their own tonnage. Adoption has accordingly been slower than the technology alone would predict. Formulators asking the retention question properly are the ones driving what adoption there is. Suppliers have little reason to accelerate a transition that costs them tonnage.
Market Impact: Mandates cover 92 separate countries
Environmental enforcement converting supply concentration into price risk

Around 85% of world capacity sits in China across an eight step synthesis with difficult effluent, and enforcement campaigns have pushed contract prices to roughly 3.4 times normal levels within a single quarter. Buyers holding one qualified source cannot move quickly, because qualification for food and pharmaceutical use takes months. Dual sourcing costs more in ordinary conditions and saves a great deal in the quarters that actually matter. Enforcement calendars are reasonably predictable, which makes the exposure manageable for anybody who plans against them. Strategic inventory ahead of those windows costs working capital and saves multiples of it.
Market Impact: Derivatives growing at 5.8% annually

Market Opportunities and Growth Drivers

Flour fortification mandates holding demand independent of price

More than 90 countries require thiamine in wheat flour by law, which makes a substantial share of demand entirely insensitive to price movement. A miller under mandate buys at 3.4 times normal cost rather than not buying at all. Indonesia grows fastest of any country at 8.4% as fortification enforcement tightens alongside feed volume. That regulated base is the reason this market absorbs price shocks without losing consumption. Milling throughput rather than price sets the volume, and throughput moves with population. Enforcement rather than legislation decides whether a mandate produces purchased volume at all.
Market Impact: Roughly 85% capacity in China

Derivative absorption advantages pulling supplement demand upward

Benfotiamine and related fat soluble derivatives achieve considerably higher tissue levels than water soluble thiamine salts, which matters in supplement and clinical nutrition positioning where measurable uptake supports a price several times the base ingredient. Derivatives grow at 5.8% on that argument. Manufacturing is more demanding and the qualified supplier field is narrow, which protects margin in a category where the underlying vitamin is close to a commodity. Growth here follows supplement marketing rather than any legislation, which makes it a different business entirely. Clinical substantiation depth rather than production capacity decides who holds these accounts.
Market Impact: Qualification runs 6 to 9 months

Market Restraints and Challenges

Synthesis route economics resisting any western capacity return

The eight step synthesis carries effluent treatment costs that western environmental compliance makes uneconomic against Chinese production, which is why roughly 85% of capacity sits in one country and shows no sign of moving. The root cause is process chemistry designed decades ago rather than any labour cost difference. Commercially it leaves buyers exposed to a single geography. Fermentation routes and strategic inventory are the mitigations participants are actually pursuing. Neither changes the position quickly, and both require capital nobody has committed yet. Concentration therefore looks durable for years. Buyers should plan around it.
Market Impact: Removes 30% overage from demand

Qualification timelines preventing rapid supplier substitution

Food and pharmaceutical thiamine qualification takes months of documentation, audit and stability testing, so a buyer facing a price at 3.4 times normal cannot simply switch source in the quarter it matters. The root cause is regulatory documentation requirements rather than any technical difference between suppliers. Commercially it converts concentration into pricing power. Pre-qualifying a second source before it is needed is the only mitigation that works. Suppliers offering qualification support ahead of need reach accounts that a competitor currently holds purely on price, because the second source position converts into volume when supply tightens.
Market Impact: Prices reached 3.4 times normal
4 additional market trends, 3 additional growth drivers, and 2 additional restraints and challenges are covered in the full report. Contact sales@marketmindsadvisory.com to access the complete intelligence.

Segment CAGR and Growth Architecture

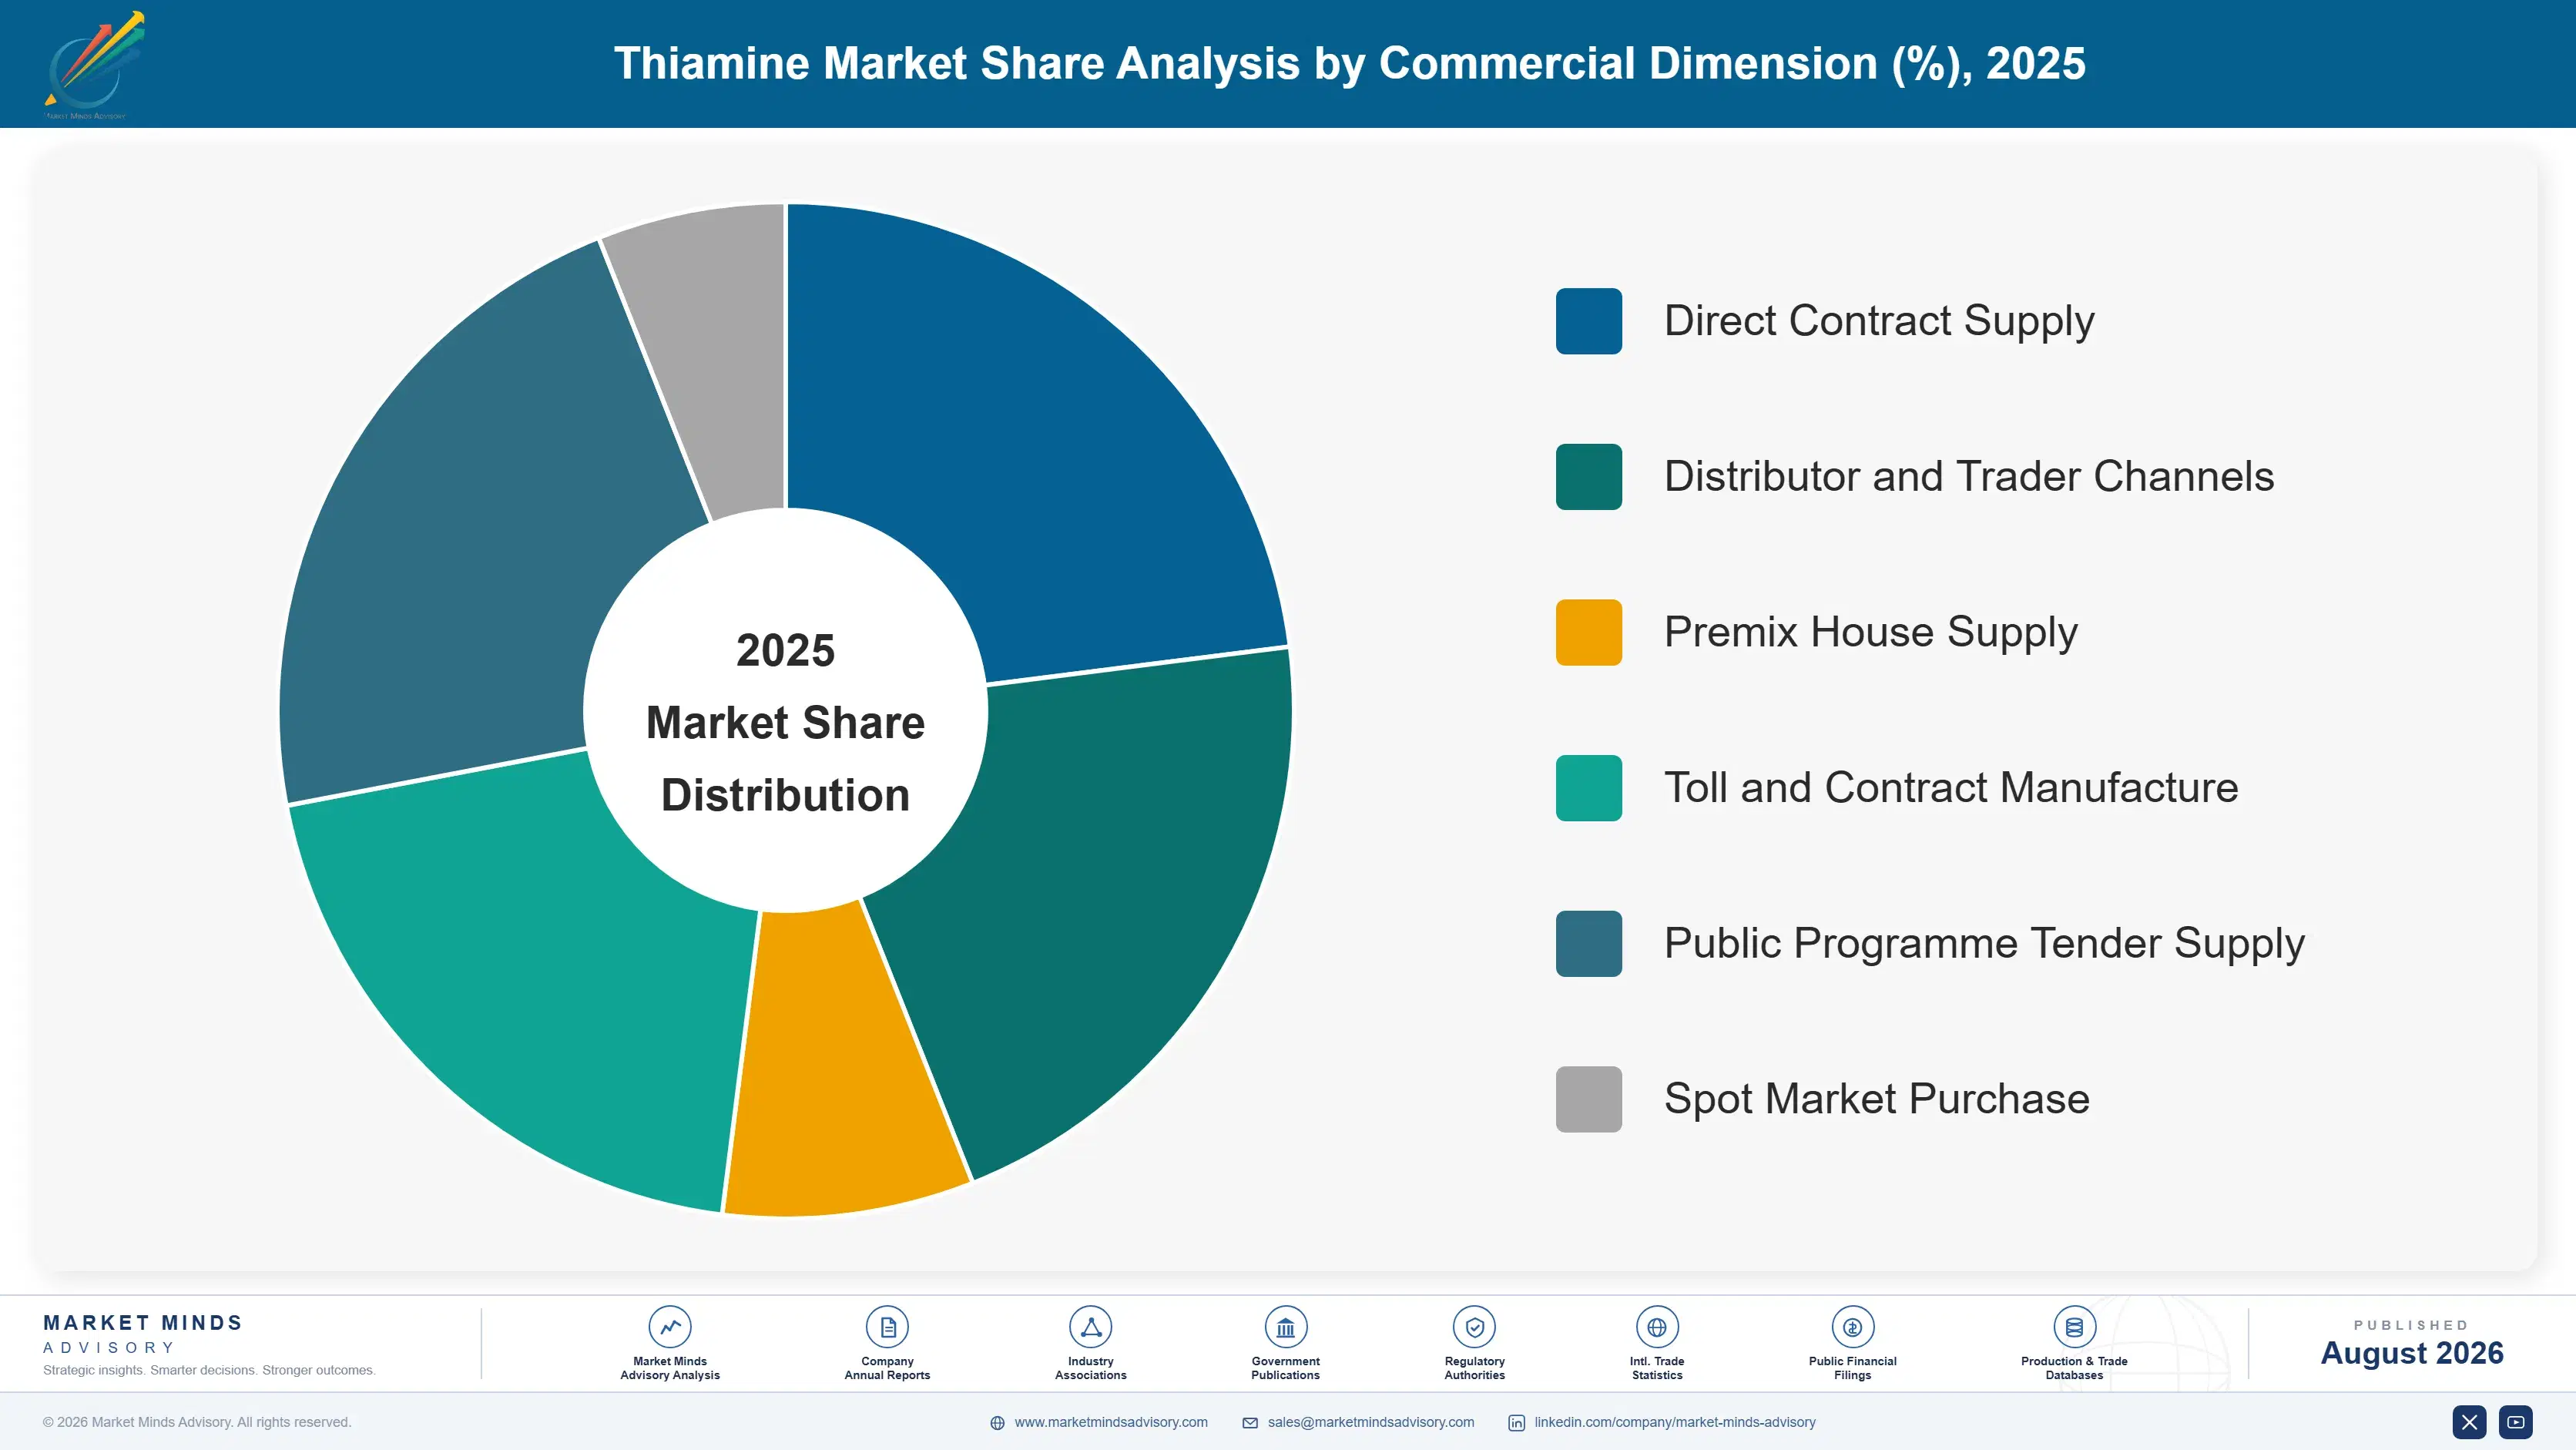
Six segments split by supplied form, because form determines the stability the customer receives, the application it can serve, the regulatory documentation attached and the price it commands. Grade and end-use variants sit inside each form. Application and channel dimensions are handled separately within the framework rather than mixed here. Form determines almost everything commercially here.
thiamine-market-trends-market-share-analysis-1787639916028

Encapsulated and Stabilised Thiamine

Growing at 6.9%, half again the market rate of 4.6%, encapsulated and stabilised formats protect the vitamin through baking, extrusion, retort and storage, recovering retention that formulators currently buy overage to compensate for. The commercial tension is unavoidable: better retention removes purchased volume, and the pricing premium recovers only part of it. Adoption is fastest where processing is harshest and label claim margins are tightest, particularly extruded cereals, retort products and long shelf life beverages sold across warm climates. Suppliers pricing these grades against commodity thiamine rather than against the material a customer stops buying are giving away the economics of their own development entirely. Adoption pace reflects supplier reluctance as much as customer readiness.
CAGR 6.9%

Thiamine Derivatives

At 5.8% benfotiamine, fursultiamine and related fat soluble derivatives achieve tissue levels well above water soluble salts, which supports supplement and clinical nutrition positioning at several times the base ingredient price. Manufacturing is more demanding than salt production and the qualified field is correspondingly narrow, which protects margin in a market where the underlying vitamin trades close to commodity terms. Growth follows supplement demand rather than fortification mandates, so it responds to marketing rather than to legislation. Clinical substantiation depth separates suppliers more than manufacturing capability does, and building that evidence takes years rather than quarters to complete properly. Fursultiamine holds established Japanese positions, while benfotiamine carries most of the western growth on neuropathy and metabolic health claims.
CAGR 5.8%
Full segment breakdown across 6 segments available in the complete report.

Regional Architecture and Country Demand Map

East Asia holds 32% of value on production concentration that no other region approaches, with roughly 85% of world capacity sitting inside China. North America follows at 22% on supplement and fortification consumption together. South Asia and Pacific grows fastest of the seven regions covered.

North America

Supplement consumption per head is the highest anywhere and pulls derivative and stabilised grades well above what fortification alone would justify. Flour enrichment has been mandatory in the United States since the 1940s, which makes that portion of demand entirely price insensitive and remarkably stable year to year. Feed premix volume follows poultry and swine production closely. Growth at 4.0% reflects a mature consumption base with supplement categories doing most of the work. Stabilised grades find their earliest adoption here because formulation staff are asking the retention question, and because label claim enforcement is genuinely rigorous. Enforcement driven price movement reaches buyers here fully, since domestic production is negligible and every kilogram arrives imported.
Share: 22% | CAGR: 4.0% (2026 to 2036)

Western Europe

Fortification mandates are lighter here than in North America, since several countries treat flour enrichment as voluntary rather than compulsory, which leaves supplement and clinical nutrition demand carrying more of the regional total. Pharmaceutical grade thiamine for alcohol withdrawal and clinical deficiency protocols is a small but stable volume. Feed demand is constrained by herd sizes under environmental limits. Regional growth of 3.2% is the slowest anywhere on mature consumption and limited fortification expansion. Derivative demand is growing steadily on absorption evidence, particularly across German and Swiss supplement categories where clinical positioning carries weight with buyers. Import dependence is complete, which means enforcement abroad reaches formulators here with no local buffer of any kind.
Share: 19% | CAGR: 3.2% (2026 to 2036)
Regional intelligence for 5 additional markets available in the complete report: East Asia, South Asia and Pacific, Latin America, Middle East and Africa, Eastern Europe. Contact sales@marketmindsadvisory.com.
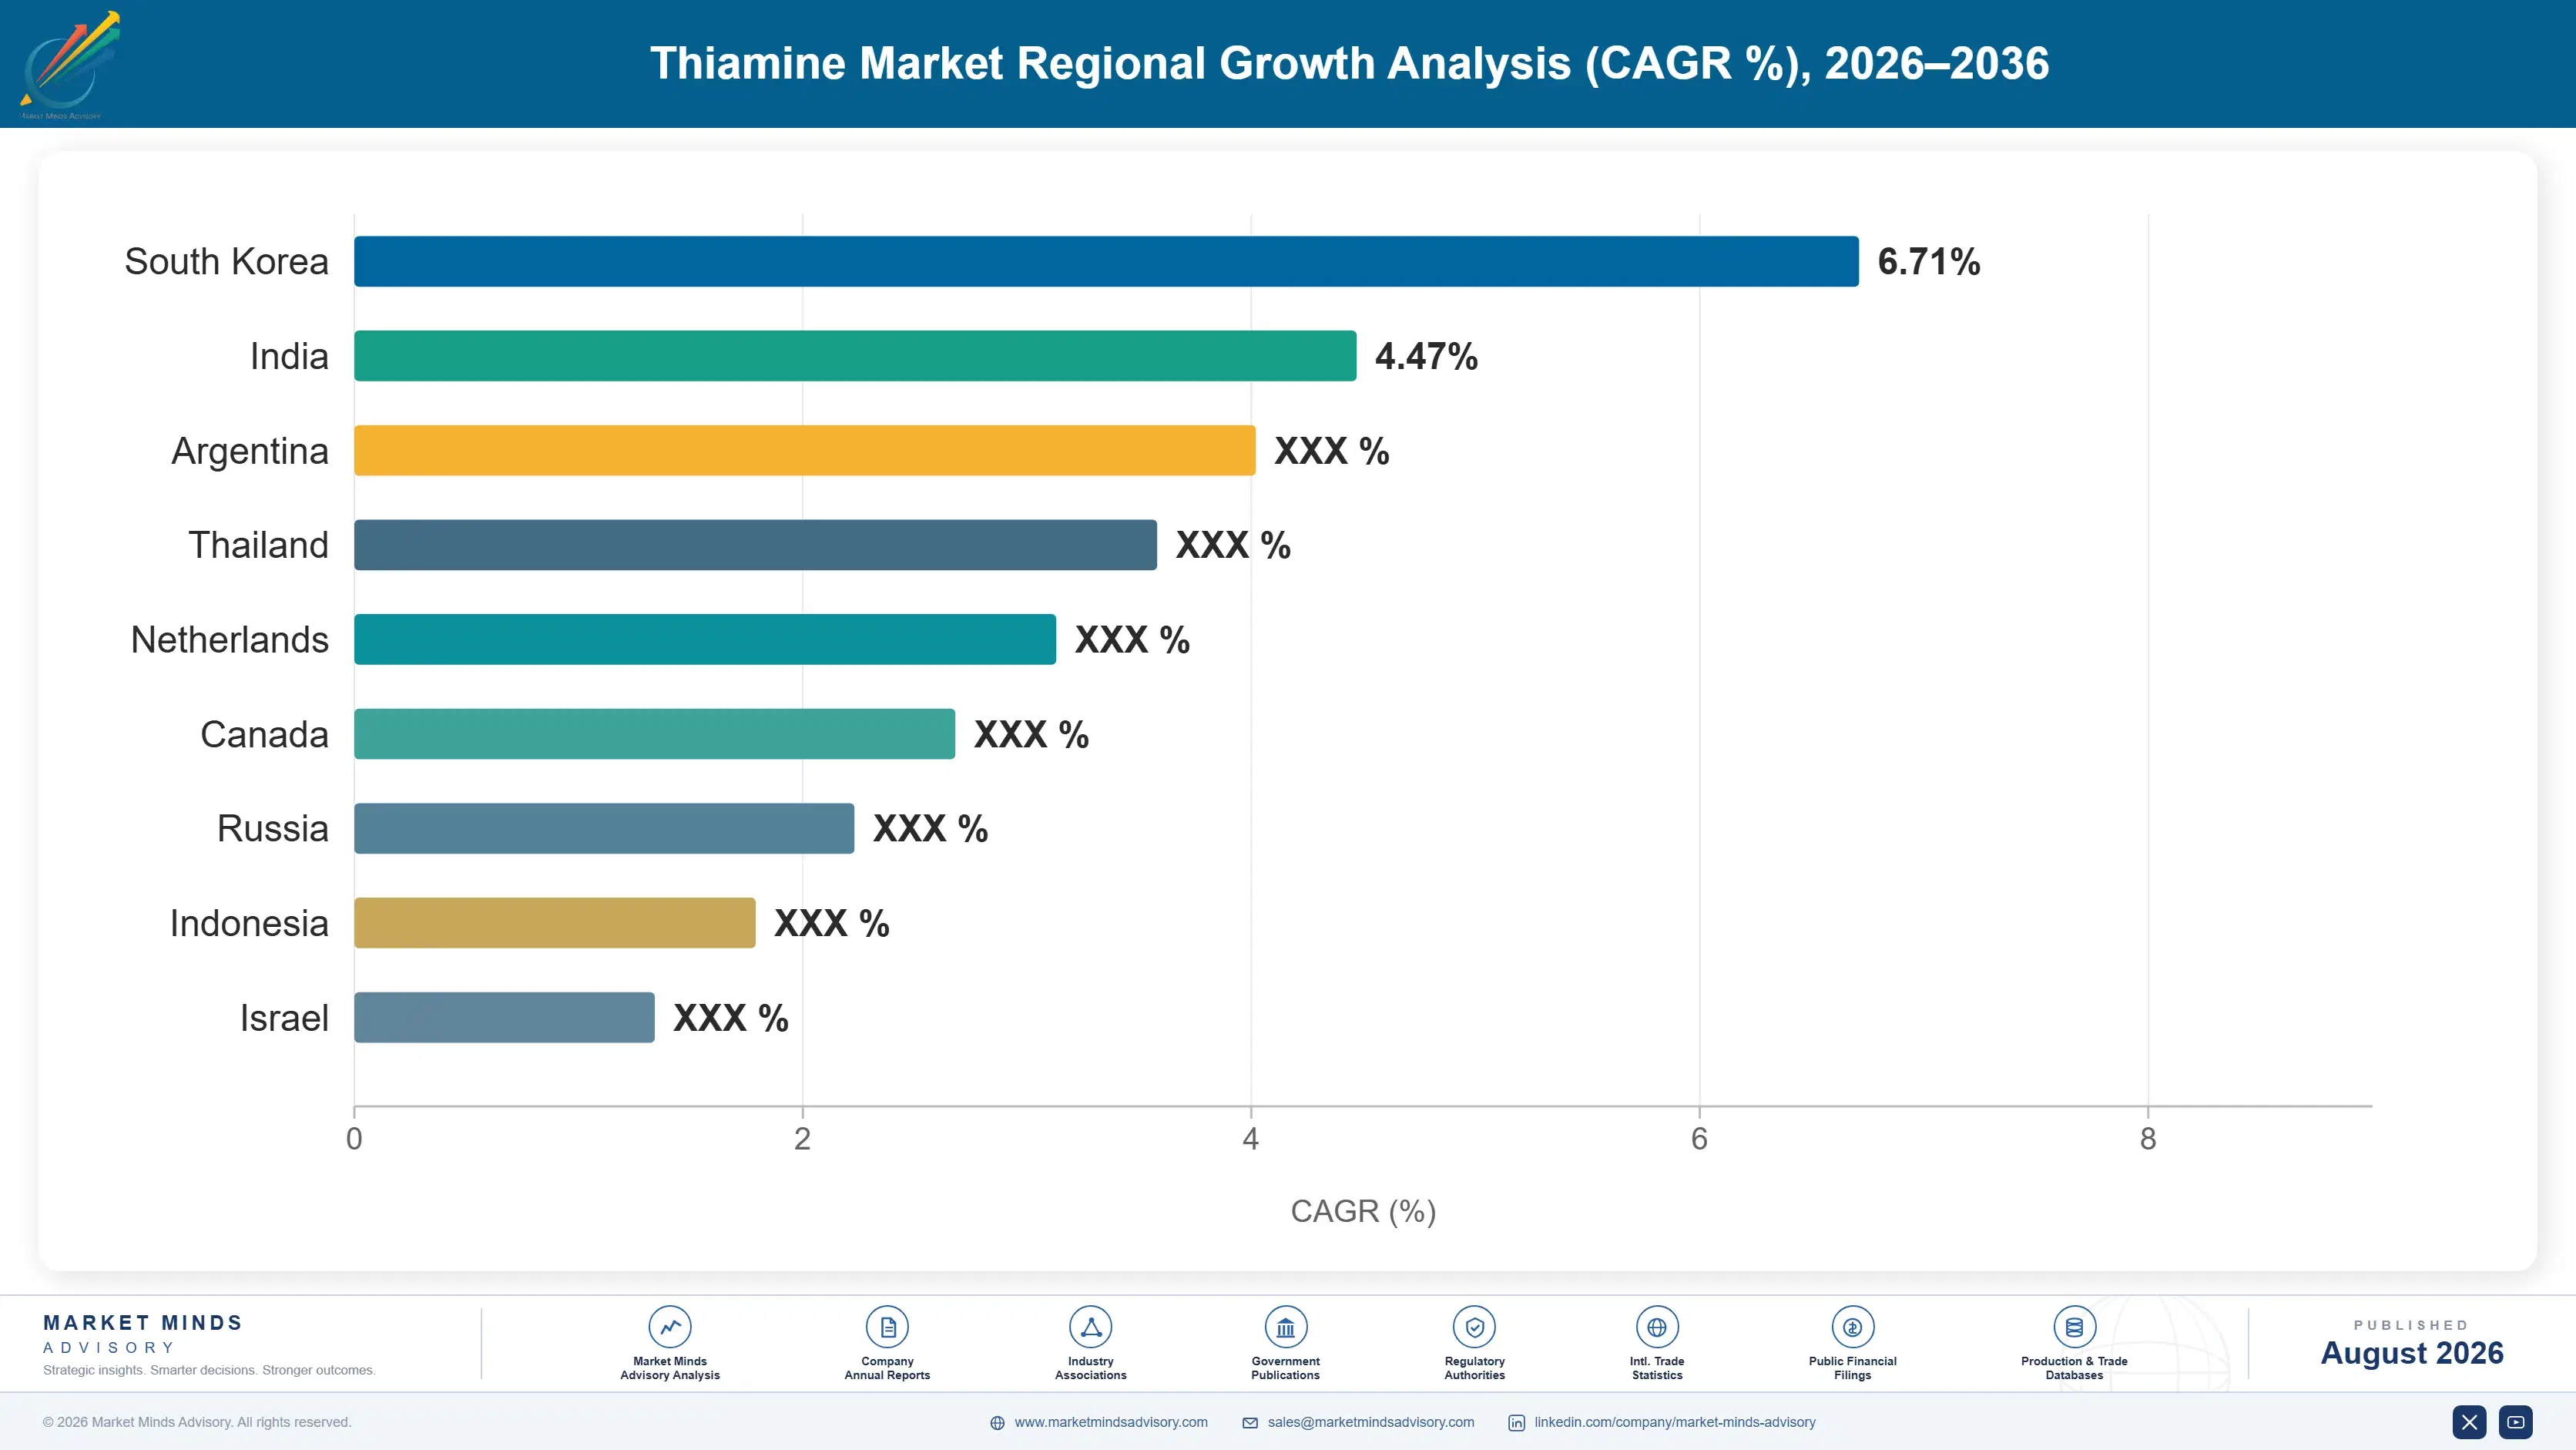
thiamine-market-trends-country-cagr-analysis-1787639916552

Four Moves Around a Fragile Molecule

Demand here is set by mandates that ignore price and by degradation that quietly consumes a third of the dose. What remains available commercially is pricing stability honestly, pre-qualifying second sources before they are needed, and moving mix toward derivatives where the vitamin stops being a commodity. Mandates ignore price entirely. Degradation sets the rest.

Price stabilised grades against overage eliminated

Formulators buy roughly 30% above label claim to survive processing and storage, which means a stabilised grade recovering retention saves them purchased material rather than merely improving quality. Pricing against that saving rather than against base ingredient cost captures considerably more value than a standard specialty premium does. Suppliers pricing stabilised formats at a modest uplift over commodity thiamine are giving away the economics of the improvement they developed. The saving belongs partly to whoever developed the retention, not entirely to the customer. Retention performance is measurable under real process conditions, which makes the higher price defensible.
Market Impact: Captures roughly 30% of the eliminated overage cost

Pre-qualify second sources before enforcement makes it urgent

Qualification takes 6 to 9 months of documentation, audit and stability testing, and enforcement campaigns have pushed prices to around 3.4 times normal inside a single quarter. A buyer qualifying only when the price moves has already lost the option. Suppliers offering qualification support ahead of need reach accounts that a competitor holds on cost alone, because the second source position converts into volume the moment supply tightens anywhere. Documentation cost is modest against the exposure it removes for both parties. Enforcement calendars follow predictable regulatory patterns that reward planning ahead.
Market Impact: Covers the whole 6 to 9 month gap

Move mix toward derivatives where commodity pricing ends

Benfotiamine and fursultiamine achieve tissue levels well above water soluble salts and sell at several times base ingredient price, growing at 5.8% on absorption evidence rather than on legislation. Manufacturing complexity keeps the qualified field narrow. A supplier moving mix toward derivatives escapes commodity pricing on the underlying vitamin without needing scale advantage, which is the only route out available to anybody outside the largest producers. Clinical substantiation depth rather than capacity decides who holds those positions properly. Fursultiamine and benfotiamine hold quite different regional positions, which matters for where a supplier should start building evidence.
Market Impact: Derivative demand growing at 5.8% every single year

Follow fortification enforcement rather than fortification legislation

More than 90 countries mandate thiamine in flour, but demand follows enforcement rather than statute, which is why Indonesia grows at 8.4% while several markets with older mandates grow barely at all. Suppliers tracking enforcement activity and milling compliance rates find demand appearing where legislation has existed unused for years. Public health programme announcements are published well ahead and remarkably few suppliers monitor them systematically. Programme funding decisions are published well ahead of any purchasing following them. Enforcement rather than statute decides whether a mandate produces any purchased volume at all, and the two diverge widely.
Market Impact: Targets the 8.4% Indonesian enforcement driven growth rate

Who Controls the Margin Pool

Participation is measured on annual production capacity for thiamine and its derivatives, and the top five hold 68%. Concentration is high because the eight step synthesis carries effluent treatment economics that only large scale operations absorb. DSM-Firmenich and Brother Enterprises lead through capacity scale and qualification breadth rather than through any formulation advantage. The gap to challengers is a cost position rather than a capability one, which makes it durable while energy and compliance economics hold.
Competition runs on three fronts. Production cost decides commodity salt supply, where Chinese scale sets the reference price everywhere. Qualification breadth decides access to food and pharmaceutical accounts. And formulation capability decides stabilised and derivative positions, where the vitamin escapes commodity pricing entirely. Each front rewards a different capability, and remarkably few participants hold more than one of them properly.

Pressure ahead comes from stabilised formats removing overage volume and from enforcement risk driving buyers toward dual sourcing. Expect formulation capable suppliers to gain against pure producers. Rankings shift on who holds qualified second source positions when the next enforcement campaign arrives unannounced. Concentration should hold, since the synthesis economics that created it have not changed at all.
thiamine-market-trends-company-positioning-matrix-1787639917068

Competitive Moat and Risk Dimensions

DSM-FIRMENICH

Moat: Qualification breadth across regulated applications

Holding food, feed and pharmaceutical qualifications across many jurisdictions lets the business serve accounts that a single grade producer cannot approach, and each qualification took months of documentation and audit to establish. Buyers facing supply disruption move toward suppliers already qualified rather than starting a new process, which converts that breadth into volume precisely when prices move.
DSM-FIRMENICH

Risk: Stabilised formats reducing tonnage

Encapsulated and stabilised grades recover retention that formulators currently buy roughly 30% overage to compensate for, so successful adoption removes purchased volume from the market the company supplies. The pricing premium on stabilised material recovers only part of what the lost tonnage was worth, which makes the improvement genuinely uncomfortable to promote.
BROTHER ENTERPRISES

Moat: Production scale and cost position

Large scale synthesis capacity with effluent treatment already installed sets a cost reference that smaller producers cannot match, particularly given the eight step route's treatment requirements. That position holds through price cycles because buyers under fortification mandates purchase regardless of price, and the lowest cost producer captures volume when margins compress across everybody.
BROTHER ENTERPRISES

Risk: Environmental enforcement production exposure

Enforcement campaigns against the synthesis route have suspended capacity and driven prices to roughly 3.4 times normal within a quarter, and the exposure sits with producers rather than with buyers who simply pay more. Compliance investment reduces but does not remove it, since enforcement standards have tightened repeatedly and show every sign of continuing.

Players Tracked

Prominent Players

DSM-Firmenich
Brother Enterprises
Jiangsu Tianxin Pharmaceutical
Huazhong Pharmaceutical
BASF

Other Key Players

Zhejiang Medicine
North China Pharmaceutical
CSPC Pharmaceutical Group
Balchem
Glanbia Nutritionals
Watson Inc
Prinova Group
Farbest Brands
Merck KGaA
Nutreco
Cargill
ADM
Kerry Group
Lonza
Zagro

Recent Developments

FEBRUARY 2026

Formulator cuts overage after switching to stabilised grade

A cereal manufacturer reduced its thiamine overage substantially after moving to an encapsulated grade that held retention through extrusion, cutting purchased material while maintaining label claim at end of shelf life across its range. Purchased tonnage fell while label compliance held steady throughout the change.
Signal: Product improvement removes supplier tonnage as directly as it improves the customer's own economics in practice
AUGUST 2025

Environmental enforcement suspends capacity and moves contract prices

Enforcement action against effluent treatment at Chinese vitamin production sites suspended capacity for several weeks, moving contract prices sharply upward and leaving single sourced buyers with no qualified alternative available to them. Spot availability disappeared within weeks across most grades entirely. Buyers with one qualified source paid whatever was asked.
Signal: Supply concentration converts into pricing power the moment any enforcement campaign begins anywhere in the country
NOVEMBER 2025

Fortification enforcement tightens across a large milling market

A national fortification programme moved from nominal compliance to active enforcement across its milling sector, converting a mandate that had existed for years into actual purchased thiamine volume for the first time. Suppliers tracking the programme had positioned well ahead of it. Milling compliance rose sharply across two quarters.
Signal: Demand follows enforcement activity rather than legislation, which had existed entirely unused for many years beforehand

Eight Steps and an Effluent Bill

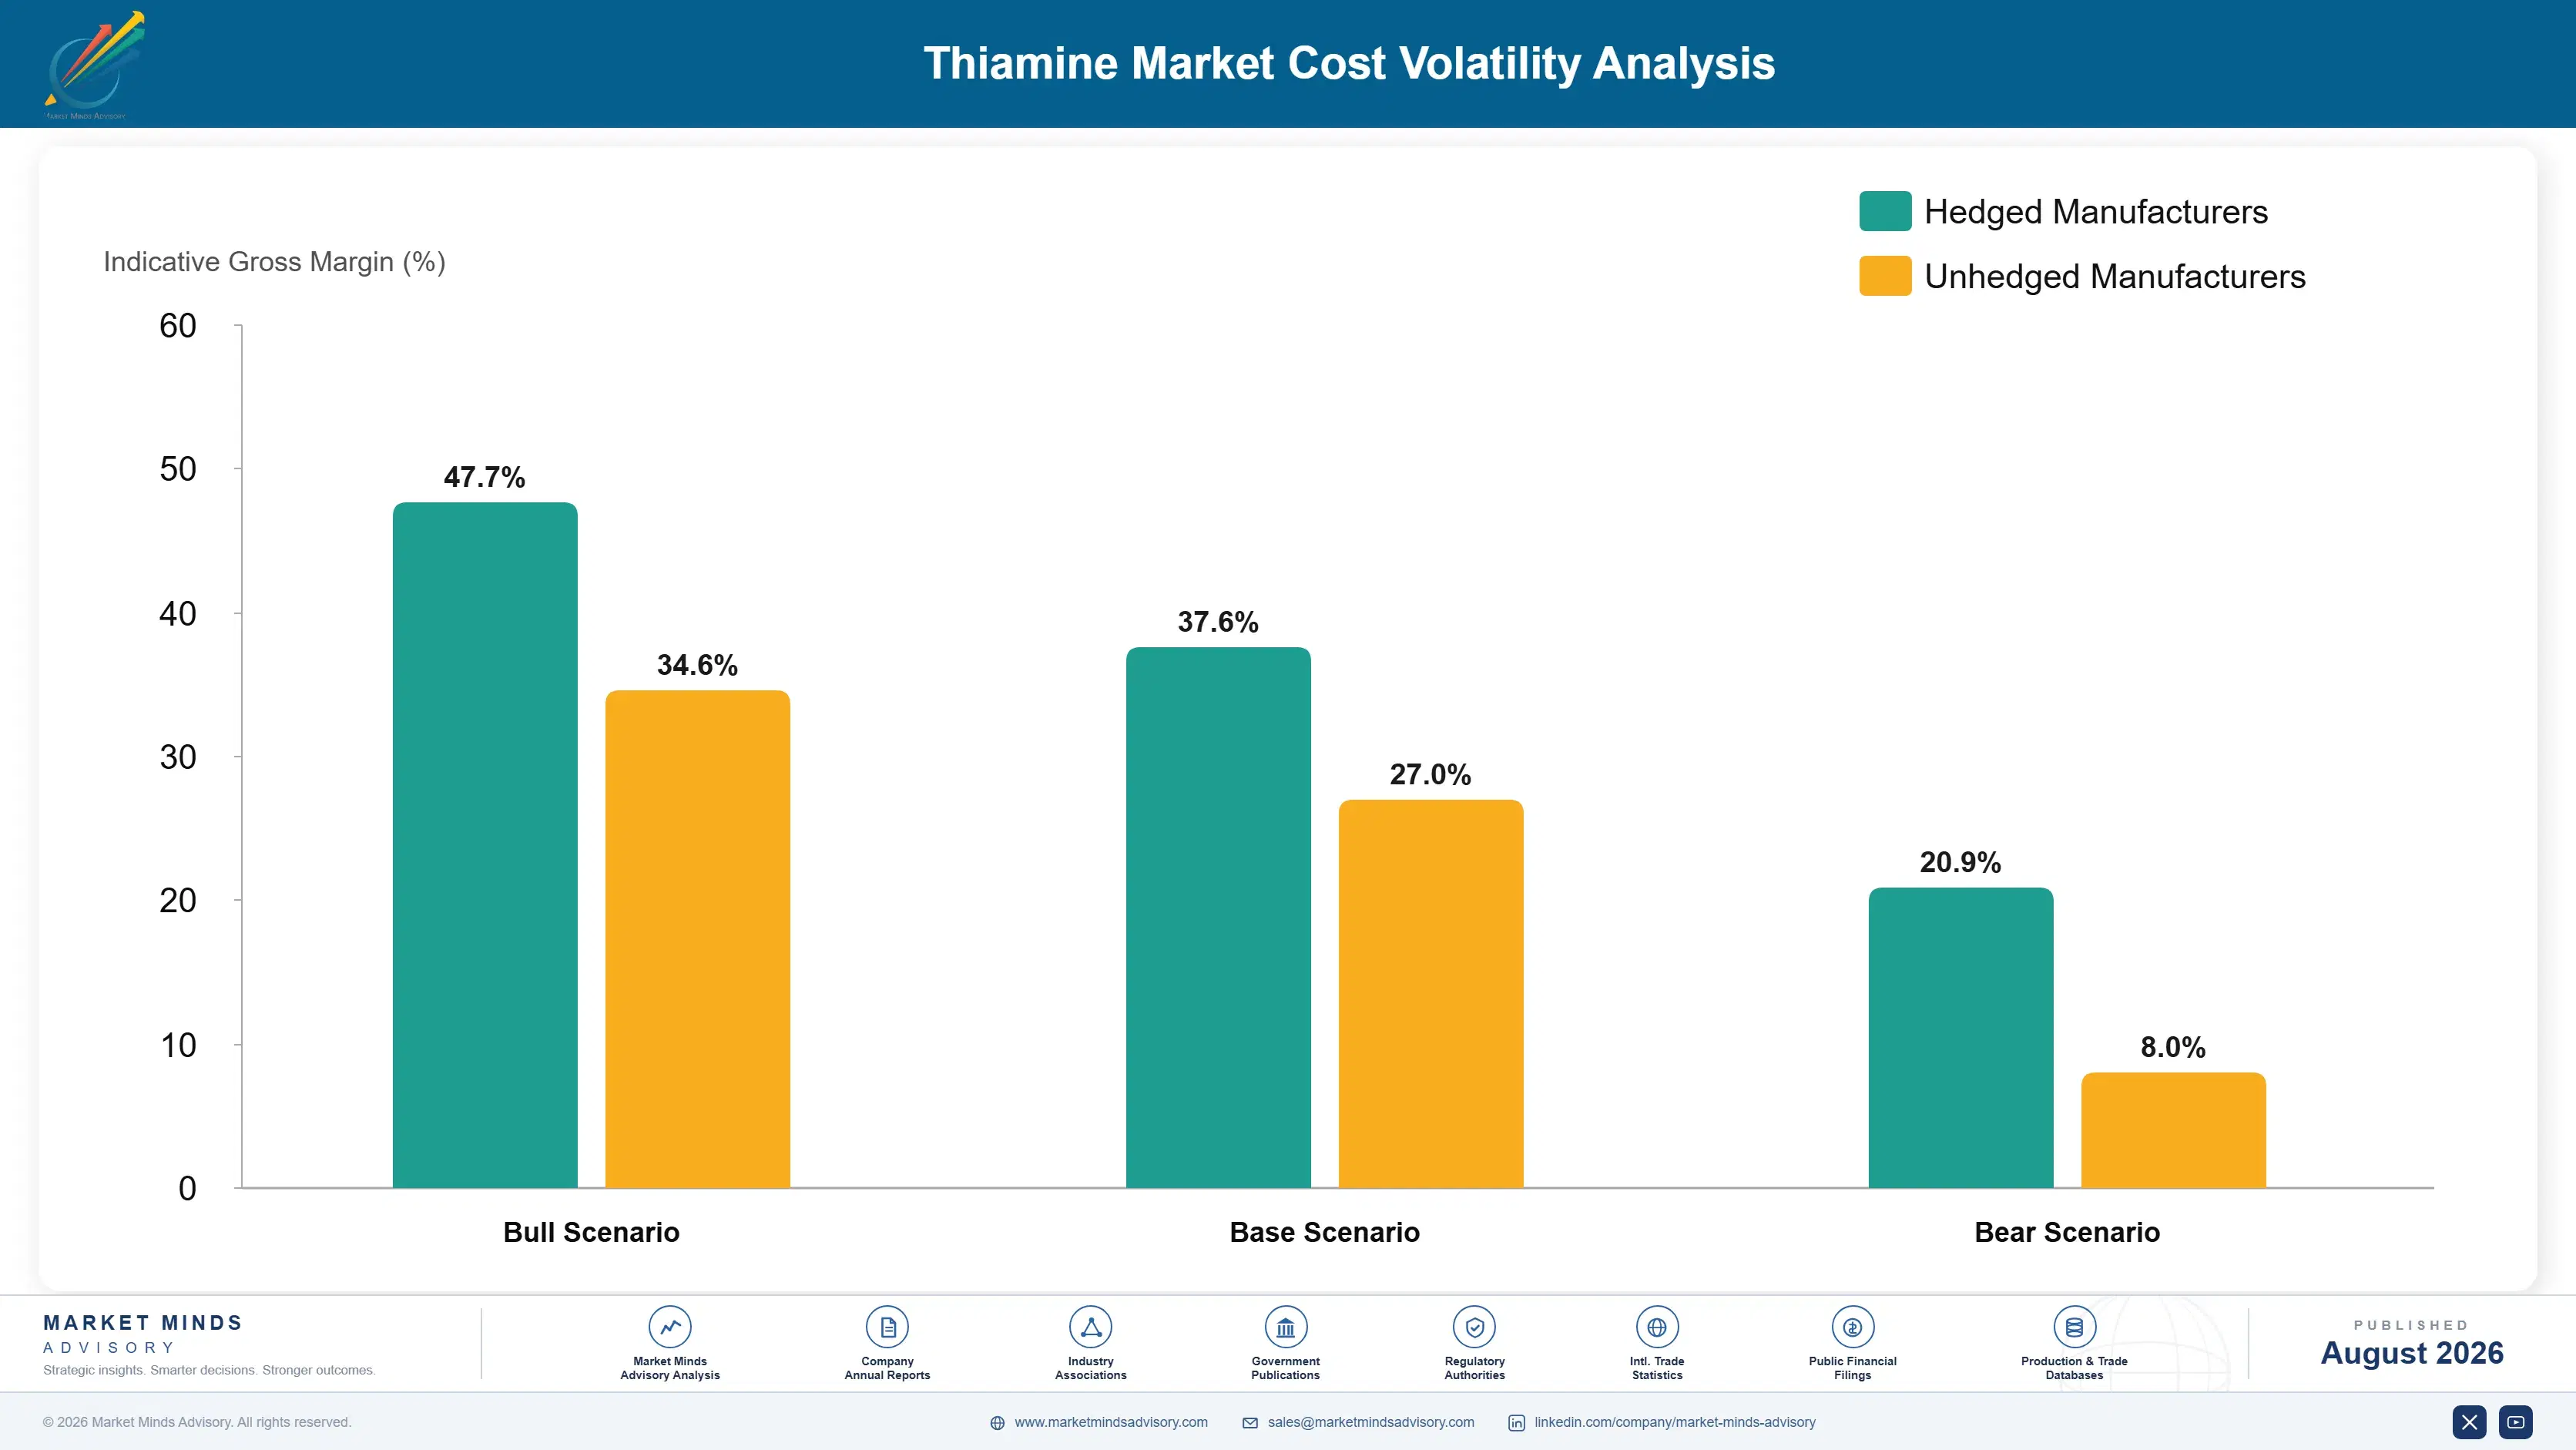
Acrylonitrile, ammonia and carbon disulphide derived intermediates carry around 34% of thiamine production cost, sourced from petrochemical and heavy chemical supply chains no vitamin producer controls. Effluent treatment and environmental compliance absorb roughly 18%, which is unusually high and reflects the eight step route. Energy takes about 14% across reaction and drying stages. Labour, packaging and quality documentation account for the balance.
Chinese energy pricing and intermediate costs both moved sharply across recent years, per published energy market reporting and DSM-Firmenich annual reporting for 2025 on input cost commentary. Producers passed movements through unevenly, because fortification mandate demand accepts price increases that discretionary supplement demand resists, which split the pass through by application rather than by supplier. Fortification buyers absorbed considerably more of the movement than supplement customers did, and that split has persisted since.

Exposure divides on integration and geography. A Chinese producer with intermediate integration carries raw material cost but manages effluent compliance at scale, which is the position everybody else works against. A western producer carries the same chemistry with considerably higher compliance costs and no offsetting scale. A formulator buying finished thiamine carries only purchase price, which moves violently but transparently.
thiamine-market-trends-cost-volatility-analysis-1787639917263

Index intermediate exposure into customer supply agreements

Intermediates carry more than a third of production cost and move on petrochemical drivers no vitamin producer influences at all. Indexation shifts that exposure to where it originates, and fortification customers under mandate accept the mechanism more readily than discretionary buyers do, because they cannot stop purchasing whatever the price does. The mechanism is well understood in chemicals.

Hold strategic inventory ahead of enforcement seasons

Enforcement campaigns have moved prices to roughly 3.4 times normal within a quarter and follow reasonably predictable regulatory calendars. Inventory held ahead of those windows costs working capital and saves multiples of it, which is a trade most buyers accept once they have experienced a disruption at first hand. Working capital is the only real cost involved.

Develop fermentation routes to reduce effluent dependence

Effluent treatment absorbs close to a fifth of production cost precisely because the synthesis route was designed decades ago without it in mind. Biological routes reduce that burden substantially and change where production can economically sit, which matters strategically to any buyer uncomfortable with concentration in one country. Capital requirements remain the obstacle here.

Portfolio Architecture for Margin Defence

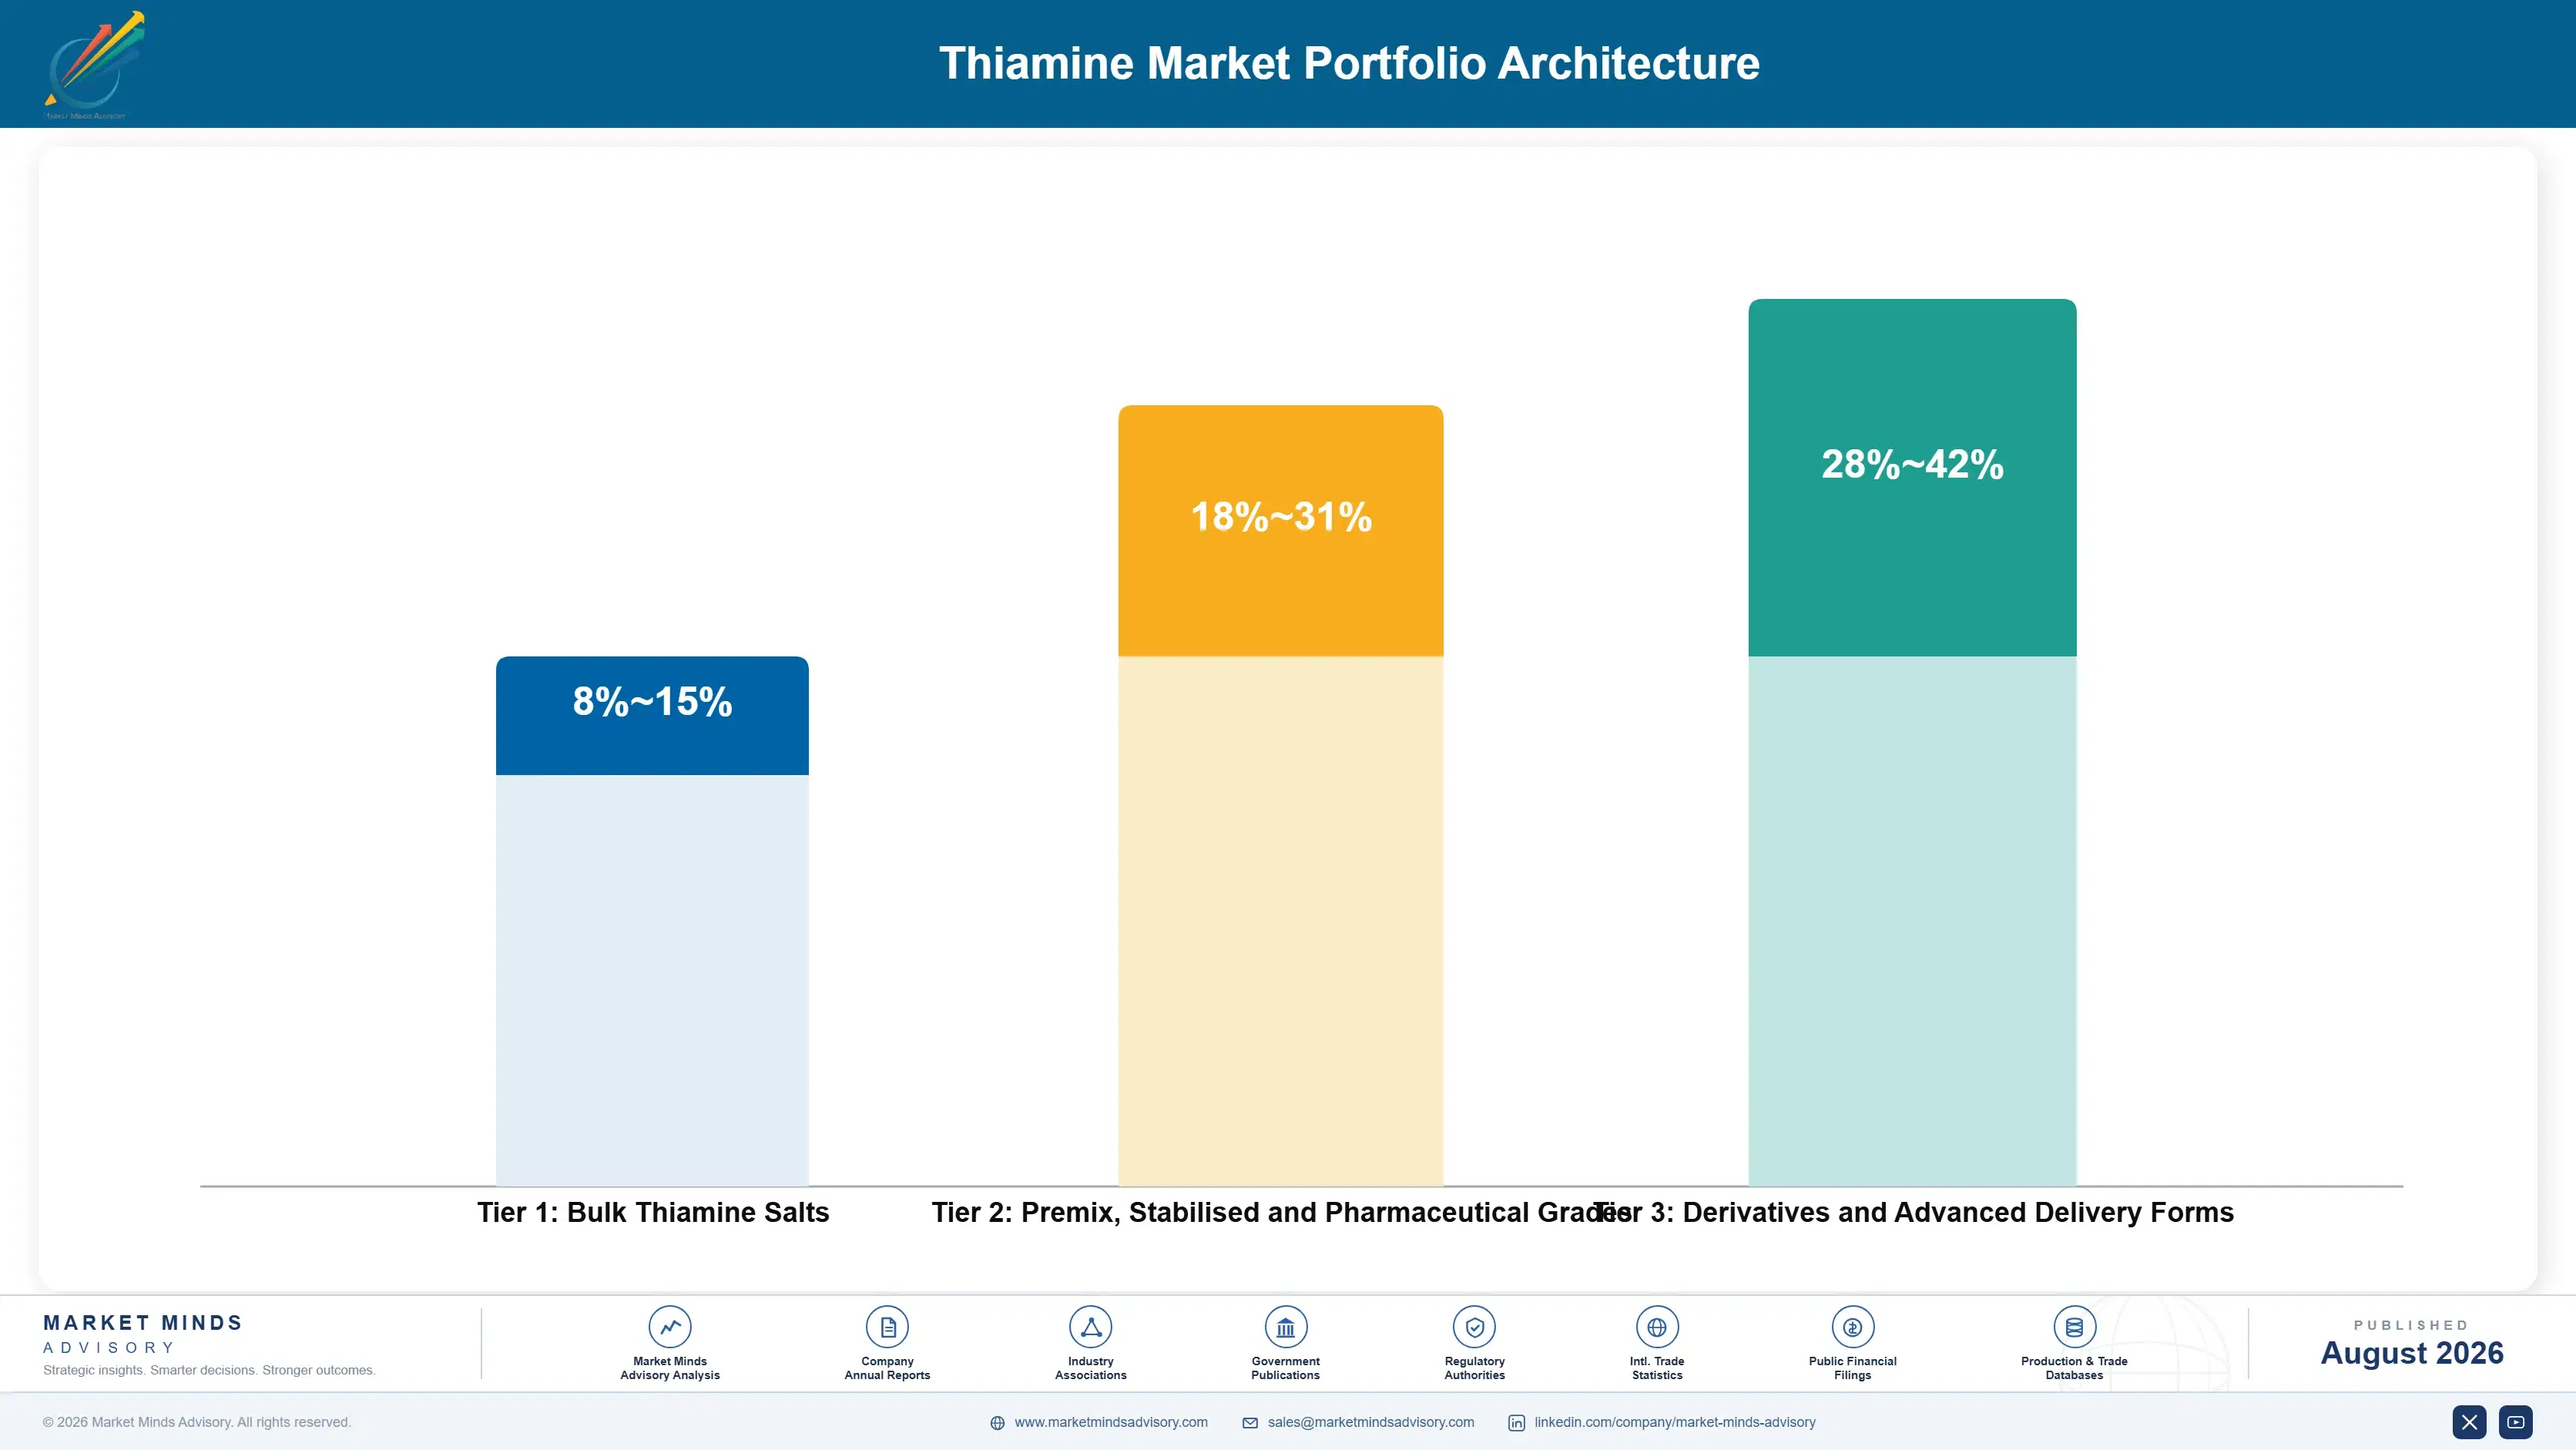
Margin here follows how far the product sits from the base molecule, because commodity thiamine salts compete on production cost alone and Chinese scale sets that reference everywhere. Bulk mononitrate and hydrochloride earn margins in the high single digits to mid teens, with mandate driven demand providing volume stability but no pricing power whatsoever. Volume stability is genuine and worth having, but it converts into no negotiating position whatsoever.
Premix blends, stabilised formats and pharmaceutical grades do considerably better in the high teens to low thirties, because formulation capability, qualification documentation and retention performance all narrow the field of suppliers a customer can actually use. Retention performance is measurable, which makes the premium defensible in a way that documentation alone is not.

Derivatives hold the strongest position, reaching into the low forties, where benfotiamine and fursultiamine sell on absorption evidence at several times base ingredient price. Those margins reflect manufacturing complexity and a narrow qualified field rather than any scale advantage, which is what makes the position available to suppliers outside the largest producers. Clinical substantiation takes years to build and cannot be purchased quickly by anybody arriving late.

Bulk Thiamine Salts

Mononitrate and hydrochloride sold on production cost where Chinese scale sets the price. The seven point range reflects integration depth and effluent treatment position rather than any product difference. Mandate demand provides volume without pricing power.
Gross Margin: 8-15%

Premix, Stabilised and Pharmaceutical Grades

Formulated and qualified grades requiring documentation and retention performance. The thirteen point range reflects the distance between simple premix blending and validated encapsulation, which are quite different capabilities. Documentation depth separates suppliers considerably here.
Gross Margin: 18-31%

Derivatives and Advanced Delivery Forms

Benfotiamine, fursultiamine and coenzyme forms sold on absorption evidence. The fourteen point range reflects clinical substantiation depth and how narrow the qualified manufacturing field is for each derivative. Substantiation cannot be acquired quickly at all.
Gross Margin: 28-42%
thiamine-market-trends-portfolio-architecture-1787639917764

High-value Sub-segments and Strategic Watch-out

Encapsulated and Stabilised Thiamine

High value and the fastest growth at 6.9%, though every point of retention recovered removes overage volume from the total market. Suppliers are improving a product that shrinks their own tonnage, which shapes adoption pace. Pricing against overage eliminated is the only honest resolution available.
Gross Margin: 24-34%

Thiamine Derivatives

High value and growing at 5.8% on absorption evidence rather than legislation. Manufacturing complexity keeps the qualified field narrow, which is the only reliable escape from commodity pricing available to smaller producers. Clinical evidence depth decides who holds the position. Manufacturing complexity narrows the qualified field considerably.
Gross Margin: 28-42%

Bulk Mononitrate for Fortification

The volume core, backed by mandates in more than 90 countries that make demand entirely price insensitive. Stability of volume comes with no pricing power at all, since Chinese production cost sets the reference. Milling throughput rather than price sets annual volume. Chinese production cost sets the reference everywhere.
Gross Margin: 8-15%

Single Source Qualification Exposure

The strategic watch-out. Qualification takes months while enforcement moves prices within weeks, and the range reflects whether a participant holds alternative qualified positions or discovers the gap during the next campaign. Pre-qualification is the only mitigation that actually works. Enforcement moves faster than any qualification process can.
Gross Margin: 6-40%

Mandated, Insensitive and Fragile

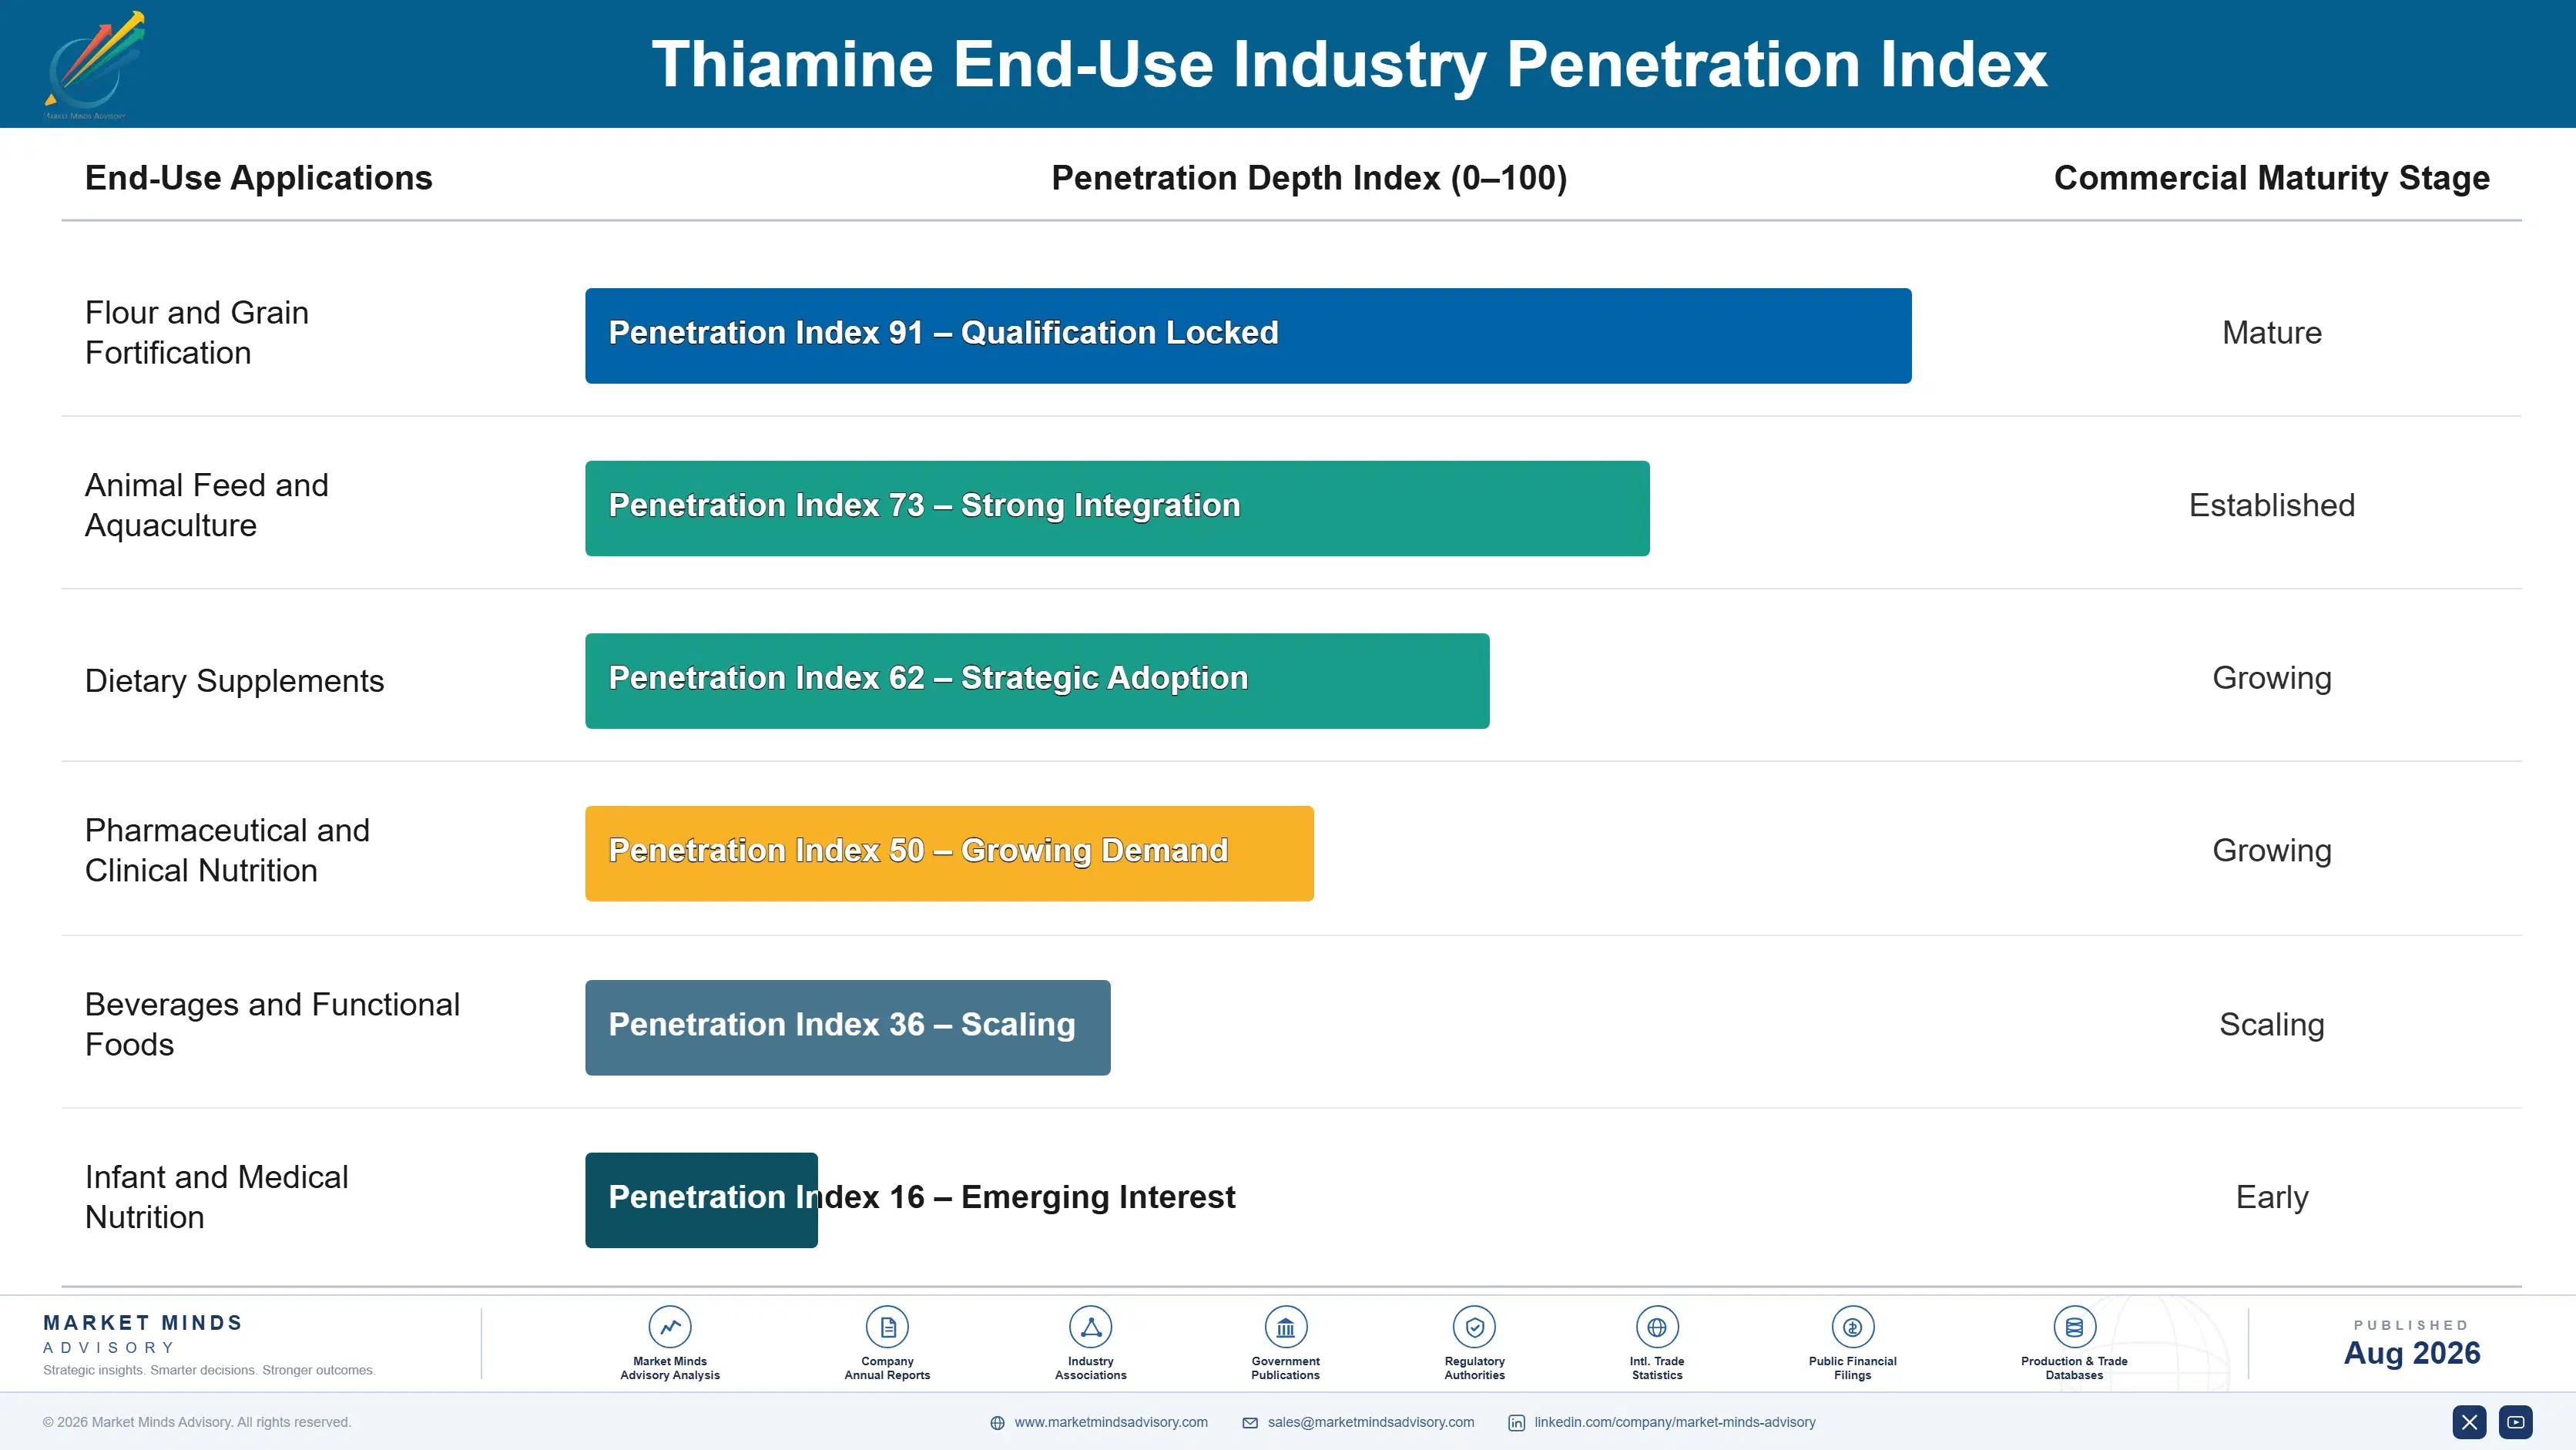
Demand here has an unusual shape because a large part of it is legislated rather than chosen. More than 90 countries require thiamine in wheat flour, so millers purchase at whatever the price does, including at 3.4 times normal during enforcement disruption. That base repeats with milling throughput and responds to nothing else, which makes it the most predictable annuity in nutrition ingredients. Nothing else in nutrition ingredients behaves this way.
Stickiness varies sharply by application. Fortification and feed premix accounts change supplier only on qualification and price, and both are decided by procurement on documented equivalence. Pharmaceutical grade positions hold for years because requalification against a filed specification is expensive. Supplement and derivative positions turn on brand marketing claims and move considerably faster than either.

The buying profile has shifted with formulation sophistication. A decade ago the purchase was tonnage against a specification. Increasingly it involves technical staff assessing retention through actual process conditions, because the overage question is finally being asked properly. That moves the conversation from price per kilogram toward delivered vitamin at end of shelf life, which is a different sale entirely. Price per kilogram is becoming the wrong question.
thiamine-market-trends-end-use-penetration-index-1787639918250

Where We Would Put Effort

These are among the four positions where our research anticipates prominent divergence between winners and laggards over the coming forecast period. Each is grounded in the demand model, the regulatory perimeter, and the announced capacity pipeline.
01 / RETENTION VALUE PRICING

Sell delivered vitamin, not kilograms shipped

Formulators buy roughly 30% above label claim because the molecule degrades through processing and storage, which means a stabilised grade recovering retention saves purchased material rather than merely improving quality for them. Pricing against that material saving captures considerably more value than any standard specialty premium ever manages to, because the customer stops buying tonnage rather than simply receiving better quality. Suppliers offering stabilised formats at a modest uplift over commodity thiamine are handing customers the entire economics of development work they paid for themselves.
02 / SECOND SOURCE POSITIONING

Qualification must precede the price move

Qualification for food and pharmaceutical thiamine takes 6 to 9 months while enforcement campaigns move prices to roughly 3.4 times normal within a single quarter. A buyer starting the qualification process only when prices move has already lost the option entirely, and pays whatever is asked in the meantime. Suppliers offering qualification support ahead of need reach accounts that an incumbent currently holds on cost alone, and that second source position converts into real volume the moment supply tightens anywhere in the world.
03 / DERIVATIVE MIX SHIFT

Escape the commodity through absorption evidence

Benfotiamine and fursultiamine achieve tissue levels well above water soluble salts and sell at several times base ingredient price, growing at 5.8% on clinical absorption evidence rather than on any legislation. Manufacturing complexity keeps the qualified supplier field genuinely narrow, and clinical substantiation takes years rather than quarters to establish properly. Moving mix toward derivatives escapes commodity pricing without requiring any scale advantage at all, which makes it the only realistic route available to producers outside the largest few operators.
04 / ENFORCEMENT DEMAND TRACKING

Follow enforcement, not the statute book

More than 90 countries mandate thiamine in flour, but purchased volume follows enforcement activity rather than legislation, which is why Indonesia grows fastest at 8.4% while markets with far older mandates grow barely at all. Suppliers tracking milling compliance rates and public health programme funding activity find demand appearing in markets where statutes had sat entirely unused for years. Public health programme announcements and funding decisions are published well ahead of purchasing, and almost nobody monitors them systematically at all.

Engagement Snapshot From the Field

A live engagement with an industry participant carrying material or product regulatory and market exposure ahead of a defining policy shift, showing how our research translates into a defensible multi-year portfolio strategy.
MARKET MINDS ADVISORY · CLIENT ENGAGEMENT SUMMARY
Thiamine Producer Strategic Portfolio Review and Transition Roadmap 2026·Investment Scenario on Thiamine Exposure Evaluation 2025-26
CLIENT PROFILE
A vitamin ingredient producer supplying thiamine salts and premix blends to food, feed and supplement manufacturers across European and Asian markets, at annual revenue near 180 million dollars (client-reported, unverified by MMA). Derivative capability was limited and pricing followed Chinese commodity references almost exactly. Stabilised grade development had been completed but commercial positioning remained unresolved.
STRATEGIC CHALLENGE
Commodity salt margins had compressed steadily against Chinese production cost, and the business had developed a stabilised grade it was pricing at a modest premium over bulk material. Management wanted to know whether the stabilised position was worth defending or quietly abandoning. Volume was holding while margin fell steadily each year.
MMA APPROACH
MMA measured actual overage practice across the client's customer base, quantified retention delivered by the stabilised grade under real process conditions, mapped qualification positions against enforcement exposure, and assessed derivative manufacturing requirements. Interviews with 47 experts covered food formulation, feed premix operations, vitamin production and fortification programme administration. Pricing practice was benchmarked separately.
KEY FINDINGS
  1. Customers were adding roughly 30% overage against label claim, and the stabilised grade recovered enough retention to remove a substantial part of that purchased volume.
  2. Stabilised material was priced at a modest premium over commodity thiamine, capturing almost none of the material saving it delivered to the customer directly.
  3. Nearly every major account held a single qualified source, and none had completed alternative qualification despite having experienced enforcement driven price movement previously.
  4. Derivative production required capability the client could develop internally over roughly two years, at margins several times what commodity salt supply was returning.
CLIENT PROFILE
A vitamin ingredient producer supplying thiamine salts and premix blends to food, feed and supplement manufacturers across European and Asian markets, at annual revenue near 180 million dollars (client-reported, unverified by MMA). Derivative capability was limited and pricing followed Chinese commodity references almost exactly. Stabilised grade development had been completed but commercial positioning remained unresolved.
STRATEGIC CHALLENGE
Commodity salt margins had compressed steadily against Chinese production cost, and the business had developed a stabilised grade it was pricing at a modest premium over bulk material. Management wanted to know whether the stabilised position was worth defending or quietly abandoning. Volume was holding while margin fell steadily each year.
MMA APPROACH
MMA measured actual overage practice across the client's customer base, quantified retention delivered by the stabilised grade under real process conditions, mapped qualification positions against enforcement exposure, and assessed derivative manufacturing requirements. Interviews with 47 experts covered food formulation, feed premix operations, vitamin production and fortification programme administration. Pricing practice was benchmarked separately.
KEY FINDINGS
  1. Customers were adding roughly 30% overage against label claim, and the stabilised grade recovered enough retention to remove a substantial part of that purchased volume.
  2. Stabilised material was priced at a modest premium over commodity thiamine, capturing almost none of the material saving it delivered to the customer directly.
  3. Nearly every major account held a single qualified source, and none had completed alternative qualification despite having experienced enforcement driven price movement previously.
  4. Derivative production required capability the client could develop internally over roughly two years, at margins several times what commodity salt supply was returning.
RECOMMENDED STRATEGY
Phase 1: Phase one: reprice stabilised grades against overage eliminated rather than against commodity thiamine, since the saving belongs partly to the developer. Phase 2: Phase two: offer qualification support to single sourced accounts before the next enforcement campaign makes the conversation urgent for them. Phase 3: Phase three: develop derivative production capability, which escapes commodity pricing without requiring any scale advantage at all. Clinical substantiation should begin immediately alongside it.
OUTCOME
The producer repriced its stabilised range against material saved during 2026 and retained volume at the higher level (client-reported, unverified by MMA). Qualification support was offered to major accounts, and derivative development began the following quarter. Commodity salt promotion was reduced deliberately, and the business stopped competing on Chinese reference pricing.

Frequently Asked Questions

Foundational context covering the market sizes, CAGR, scope, country, region and competition that inform every finding below. This section is provided to cover basics and most often pre-purchase conversations, answered from the MMA Primary Research Dataset.

What is the current size of the Thiamine Market?

MMA sizes it at USD 0.42 billion in 2025, rising to USD 0.44 billion in 2026. The figure covers thiamine and its salts, derivatives and formulated forms at producer selling value.

How large will the Thiamine Market be by 2036?

USD 0.69 billion by 2036, an incremental USD 0.25 billion over the 2026 base and an expansion multiple of 1.57 times. Derivatives and stabilised formats carry most of that gain.

What is the CAGR for the Thiamine Market 2026 to 2036?

4.6% in the base case, with a bull case at 5.8% and a bear case at 3.4%. The bear case turns on encapsulation removing the overage volume the market currently sells.

Which segment is growing fastest?

Encapsulated and stabilised thiamine at 6.9%, half again the market rate of 4.6%. Better retention removes the roughly 30% overage formulators currently buy to survive processing.

Who are the major companies in the Thiamine Market?

DSM-Firmenich, Brother Enterprises, Jiangsu Tianxin Pharmaceutical, Huazhong Pharmaceutical and BASF lead on production capacity. Fifteen further participants are profiled in the full report on the same basis.

Which country is growing fastest?

Indonesia at 8.4%, as flour fortification enforcement tightens while aquaculture and poultry feed volume expands at the same time across the country, an unusual combination of regulated and commercial demand rising together.

Report Segmentation Architecture

The full report scope spans multiple orthogonal segmentation dimensions, with cross-tabulated demand data provided for each dimension pair. Coverage extends further to regional breakdowns, trend trajectories, and the competitive detail needed to support segment-level decision-making.

By Supplied Form

  • Thiamine Mononitrate
  • Thiamine Hydrochloride
  • Premix and Blended Formats
  • Encapsulated and Stabilised Thiamine
  • Thiamine Derivatives
  • Thiamine Pyrophosphate and Coenzyme Forms

By End-Use Industry

  • Flour and Grain Fortification
  • Animal Feed and Aquaculture
  • Dietary Supplements
  • Pharmaceutical and Clinical Nutrition
  • Beverages and Functional Foods
  • Infant and Medical Nutrition

By Commercial Dimension

  • Direct Contract Supply
  • Distributor and Trader Channels
  • Premix House Supply
  • Toll and Contract Manufacture
  • Public Programme Tender Supply
  • Spot Market Purchase

By Region

  • North America
  • Western Europe
  • East Asia
  • South Asia and Pacific
  • Latin America
  • Middle East and Africa
  • Eastern Europe

Scope, Methodology, and Coverage

Every figure in this report is reproducible from documented input assumptions. The scope below maps the historical period, the forecast horizon, the segmentation dimensions, and the countries covered, alongside the underlying primary and qualitative methodology.
Historical Period
2020 to 2025
Forecast Period
2026 to 2036
Base Year
2025 (USD billions; MMA Primary Research Dataset, August 2026)
Market Definition
Thiamine and its salts, derivatives and formulated forms supplied as an ingredient, covering thiamine mononitrate, thiamine hydrochloride, premix and blended formats, encapsulated and stabilised grades, thiamine derivatives including benfotiamine and fursultiamine, and thiamine pyrophosphate and coenzyme forms. Measured at producer selling value. Finished multivitamin products sold to consumers, other B group vitamins, and fortified foods measured at retail value are excluded from scope.
Quantitative Units
USD billions (current prices); metric tonnes shipped; USD per kilogram by supplied form
Segmentation Dimensions
Supplied form; end-use industry; commercial dimension; region
Regions Covered
North America, Western Europe, East Asia, South Asia and Pacific, Latin America, Middle East and Africa, Eastern Europe
Countries Covered
United States, Canada, Mexico, Germany, France, United Kingdom, Netherlands, Switzerland, China, Japan, South Korea, India, Indonesia, Vietnam, Australia, Brazil, Argentina, South Africa, Saudi Arabia, Poland
Key Companies Profiled
DSM-Firmenich, Brother Enterprises, Jiangsu Tianxin Pharmaceutical, Huazhong Pharmaceutical, BASF, Zhejiang Medicine, North China Pharmaceutical, CSPC Pharmaceutical Group, Balchem, Glanbia Nutritionals, Watson Inc, Prinova Group, Farbest Brands, Merck KGaA, Nutreco, Cargill, ADM, Kerry Group, Lonza, Zagro
Quantitative Methodology
Primary survey, n=3,800 respondents, Q4 2025, six countries; demand-side model with trade association cross-validation
Qualitative Methodology
47 expert interviews, Q4 2025; applied to validate demand model assumptions, identify emerging dynamics, and assess competitive positioning
Report Format
PDF and XLSX data workbook (Word format preview document)
Publisher
Market Minds Advisory
Report Code
MMA-2026-CHM-145
Published
August 2026
Contact
sales@marketmindsadvisory.com | www.marketmindsadvisory.com

Purchase the full Thiamine Market Report (2026 to 2036).

The full report treats thiamine as a market where a third of the volume exists only because the molecule degrades before anybody consumes it. It sizes all six supplied forms independently through 2036, quantifies formulation overage practice across application types, and models what stabilised formats remove from total demand as retention improves. Regional chapters cover all seven regions with fortification enforcement assessed separately from legislation. Competitive profiling covers 20 participants on one consistent production capacity basis. Overage practice is benchmarked separately by process type and by region throughout the analysis.
Six supplied forms sized independently through 2036
Formulation overage practice quantified across application and process types
Stabilised format retention modelled against total demand removed
Fortification enforcement assessed separately from mandate legislation by country
Qualification timelines mapped against enforcement driven price movement
Twenty participants profiled on one consistent capacity basis

Built For The People Who Decide

From boardroom strategy to bench-side execution, this report is read cover-to-cover by leaders shaping the next decade of their industry, turning demand scenarios, market dynamics and valuation benchmarks into decisions.
CXOs/ Presidents/ VPs/ Managers
M&A and Corporate Development
Strategy Teams and R&D Heads
Procurement and Product Directors
Regulatory and Compliance Leaders
Investor Relations and Equity Analysts