Market Minds Advisory
Thermal Insulation Material Market

Thermal Insulation Material Market: freight radius economics, energy cost position and installed performance

Insulation is mostly trapped air sold by the cubic metre, so the delivered cost of moving it beats almost every other commercial variable and keeps this an industry of regional franchises rather than global brands.

Lead Analyst

Bilal Shaikh

Published

September 2026

Make Smarter Decisions with Customized Research Insights

Request a free sample report and evaluate market opportunities, growth trends, and competitive dynamics relevant to your business needs.

2025 MARKET VALUE$62.0BMarket Size 2025
2036 FORECAST VALUE$115.3BBase Case , 2026 to 2036
CAGR 2026 TO 20365.8 %Bull 7.0% / Bear 4.5%
INCREMENTAL OPPORTUNITY$49.7BNet 10- year value creation
EXPANSION MULTIPLE1.76x2036 value over 2026 base
Strategic Levers
M&A Pipeline
Regional Outlook
Country Rankings
Competitive Intelligence
Segmental Deep-dive
Call-Us : 91 93563 13602

Executive Snapshot and Market Trajectory

Insulation is trapped air with just enough material around it to hold shape, which makes it the most freight-sensitive product in building materials. Beyond roughly 400 kilometres the haulage cost exceeds what the product is worth, so this remains an industry of regional plants rather than of global brands.
Growth concentrates in aerogel and vacuum insulation panels, expanding at 8.7%, where thermal performance per millimetre of thickness matters more than cost per square metre, which is exactly the situation in retrofit work and in industrial process duty. East Asia holds 30% of value, the largest regional share, because Chinese construction volume remains the largest anywhere and because regional building energy codes have tightened considerably faster than most observers ever expected them to.
The supplier base is fragmented by geography rather than by technology, with the top five holding 31% of production volume, and it divides between mineral wool majors, foam producers and specialist technical insulation houses. Competition runs on delivered cost inside a freight radius rather than on declared thermal performance. Building renovation policy is the force now determining where the demand growth actually appears at all.
Market Definition
Thermal insulation material comprises products supplied to reduce heat transfer in buildings, industrial process equipment and technical applications, spanning glass wool, stone wool, expanded and extruded polystyrene, polyurethane and polyisocyanurate foam, aerogel and vacuum insulation panels, and cellular glass, calcium silicate and technical insulation classes. Sizing covers material sold to distributors, contractors and manufacturers at realised delivered price. Acoustic-only products, fire protection boards without thermal function, insulated glazing units, installation labour and services, and refrigeration or building equipment all fall outside scope.
Base Year Value
$62.0B in 2025 (MMA Primary Research Dataset, August 2026)
Forecast Period
2026 to 2036, eleven discrete annual values
CAGR
5.8% base case. Bull 7.0%. Bear 4.5%.
Fastest Growth Segment
Aerogel and Vacuum Insulation Panels: 8.7% CAGR
Fastest Growth Country
India: 8.6% CAGR
Fastest Growth Region
South Asia and Pacific: 8.1% CAGR
Largest Region
East Asia: 30% of 2025 global value
Market Leaders
Rockwool, Saint-Gobain, Knauf Insulation, Owens Corning and Kingspan lead on insulation production volume across mineral, foam and technical classes. Source: MMA Primary Research Dataset, July 2026.
Primary Survey
n=3,800 procurement and R&D decision-makers, Q4 2025, six countries
Methodology
Demand-side build-up, cross-validated against public data, 47 expert interviews

Thermal Insulation Material Market Forecast Scenarios

thermal-insulation-material-market-size-forecast-scenario-1787310881104
Growth of 4.8% across 2020 to 2025 was driven mostly by energy prices rather than construction volume. New building activity fell through 2020 and recovered unevenly, while European energy costs through 2022 turned retrofit from a policy aspiration into a household decision. Producers with advantaged energy positions gained ground over the same period, since melting and curing costs moved sharply against everybody else.
The base case at 5.8% rests on three mechanisms. Building energy codes keep tightening across every major construction market, and each revision raises the insulation thickness required per square metre rather than merely encouraging it. Renovation of existing stock is where policy now concentrates, and retrofit uses more insulation per building than new construction. And industrial process insulation demand grows steadily as energy efficiency becomes a documented and audited cost line.
The bull case at 7.0% turns on European renovation programmes reaching their stated rates, since the stock upgrade rate would need to roughly double from today's 1.2% and every point of increase carries large volume behind it. The bear case at 4.5% turns on construction. A sustained residential downturn across China, Europe and North America together would remove volume faster than retrofit demand can replace it.

Thermal insulation: freight radius against energy cost

Two constraints define this market and both are physical rather than commercial. Insulation is mostly air, so a truck fills with volume long before it reaches weight, and beyond roughly 400 kilometres haulage costs more than the product is worth. And making it is energy intensive, with melting and curing accounting for around 24% of delivered cost, which is why 2022 reordered the European competitive position.
TOP FIVE CONCENTRATION31%Share of global insulation production volume held collectively
PROCESS ENERGY COST SHARE24% of COGSPortion of delivered cost from melting and curing energy
BUILDING APPLICATION SHARE68% of volumeLargest single application by consumed insulation volume globally
ECONOMIC DELIVERY RADIUS400 kmDistance beyond which shipping low density product fails
TYPICAL RETROFIT PAYBACK6 yearsPeriod over which building owners recover upgrade spending
EXISTING STOCK UPGRADE RATE1.2% annuallyShare of standing building stock improved each year
Those two constraints together explain the industry structure. Plants sit close to construction demand, the top five hold only 31% of global volume, and a regional producer with cheap energy and a well-placed works beats a much larger competitor two countries away. Brand matters a great deal less in this business than most participants would like to believe, and the numbers make that plain.
Demand divides by whether performance or price governs. Building envelope work takes 68% of volume and is decided almost entirely on delivered cost per unit of thermal resistance achieved. Retrofit work where thickness is constrained, and industrial process duty at high temperature, pay considerably more per cubic metre, because the available alternatives simply do not perform at all.
"Everybody in this industry quotes declared thermal conductivity, which is measured on a perfect specimen in a laboratory and bears only a loose relationship to what a wall actually achieves once a contractor has finished with it. The producers worth dealing with talk about installed performance, and there are very few of them."
Director, Building Materials and Energy Efficiency Practice · MMA Construction a

Market Trends

Renovation policy shifting demand from new build to retrofit

Building energy policy has moved decisively from new construction standards toward upgrading existing stock, because the standing building population dwarfs annual completions and consumes most of the energy. Retrofit work uses considerably more insulation per building than new construction does, since walls, roofs and floors all get treated at once rather than being built correctly first time. The existing stock upgrade rate sits near 1.2% annually and every policy programme aims to raise it. Producers organised around distributor and contractor channels rather than housebuilder accounts capture this demand far more effectively.
Market Impact: Governs 68% of insulation volume
Thickness-constrained applications pulling premium material adoption

Retrofitting an existing wall, insulating a pipe inside a congested plant or upgrading a facade without moving the window line all impose a thickness limit that conventional material cannot meet at the required thermal resistance. Aerogel blankets and vacuum insulation panels deliver several times the performance per millimetre and command pricing that reflects it, because the alternative is not cheaper material but an unachievable design. Volumes remain small against mineral wool and foam. Growth at 8.7% comes almost entirely from applications where the binding constraint is dimensional rather than economic.
Market Impact: Delivers 7.1% annual industrial gro

Market Opportunities and Growth Drivers

Building energy codes tightening across every major construction market

Envelope performance requirements have been revised upward repeatedly across European, North American, Chinese and Indian building codes, and each revision raises the insulation thickness required per square metre rather than simply recommending improvement. That makes the demand regulatory rather than discretionary, which is exactly why insulation volume holds up considerably better than construction activity through downturns. Code enforcement has also tightened considerably, with measured performance verification replacing declared compliance across several jurisdictions. Building applications already account for fully 68% of global thermal insulation volume measured across every material class in use.
Market Impact: Caps delivery radius near 400 kilom

Industrial process insulation demand rising with energy cost documentation

Process plants have begun treating heat loss as a measured cost line rather than an accepted engineering condition, largely because energy prices through 2022 made the arithmetic impossible to ignore. Insulation surveys on refineries, chemical plants and district heating networks routinely identify losses with payback periods under two years, which passes any capital screen. Technical insulation for high temperature duty pays considerably more per cubic metre than building material, and the qualified supplier field is far narrower. Industrial demand grows at 7.1% annually as a direct result of that reappraisal.
Market Impact: Costs 6 year payback credibility

Market Restraints and Challenges

Freight economics limiting the addressable radius for every plant

A truck loaded with insulation fills by volume long before it approaches weight limits, so haulage cost per cubic metre is high and beyond roughly 400 kilometres it exceeds the value of the product itself. The root cause is that low density is the whole point of the material and cannot be engineered away without destroying thermal performance. Commercially this caps every plant's addressable market geographically and prevents scale advantages travelling. Producers are responding with compressed packaging, regional plant networks, higher density technical products that ship better and licensing arrangements in distant markets.
Market Impact: Lifts upgrade rate above 1.2% annua

Installed performance gap undermining the credibility of declared values

Declared thermal conductivity is measured on a perfect laboratory specimen, while an installed wall carries compression, gaps, thermal bridging and moisture that no datasheet reflects. The root cause is that installation quality varies enormously and nobody has yet been made commercially accountable for the difference. Commercially this makes building owners openly sceptical of performance claims and slows any willingness to pay for better material at all. Participants are responding with installed system warranties, contractor training programmes, prefabricated insulated panels that remove site variability entirely, and measured post-installation verification on completed work.
Market Impact: Grows 8.7% annually through 2036
4 additional market trends, 2 additional growth drivers, and 3 additional restraints and challenges are covered in the full report. Contact sales@marketmindsadvisory.com to access the complete intelligence.

Segment CAGR and Growth Architecture

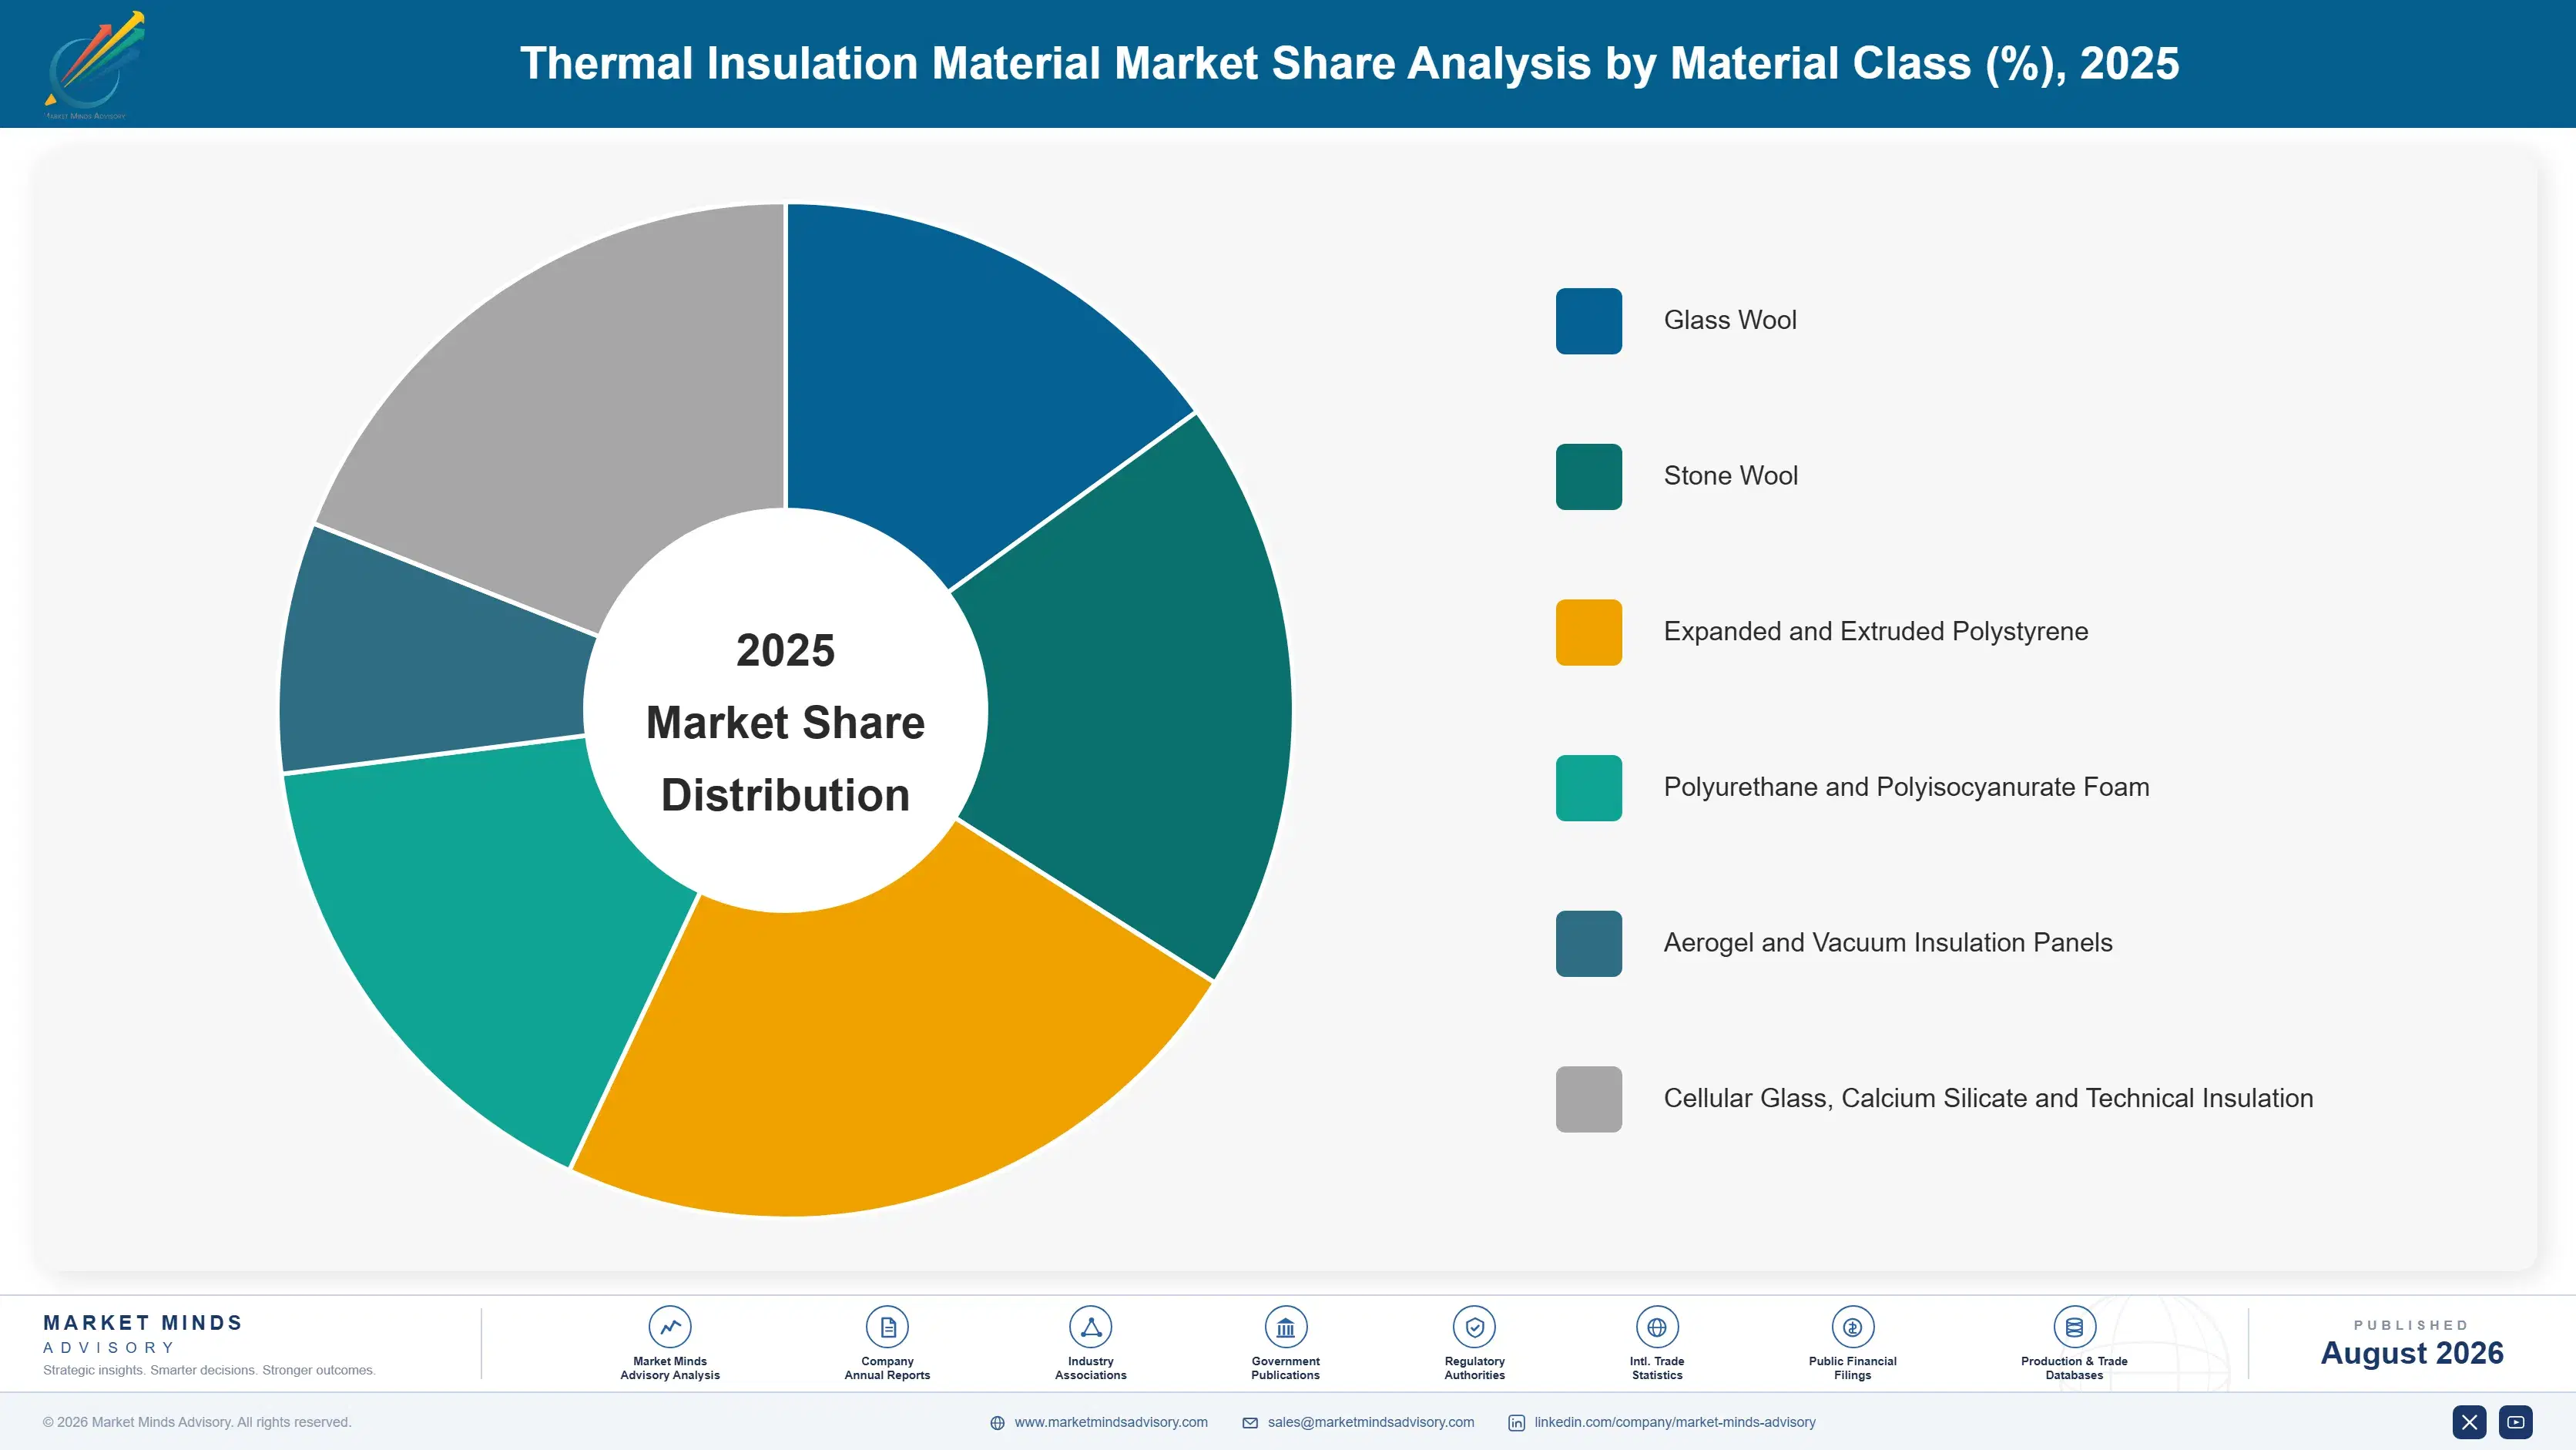
Segmentation follows the material class, because each one carries a distinct thermal performance per millimetre, fire behaviour, temperature limit, moisture tolerance and manufacturing cost structure. Six classes cover the whole market, running from the mineral wools and commodity foams that dominate volume through technical products to aerogel and vacuum panels at the performance edge.
thermal-insulation-material-market-market-share-analysis-1787310881677

Aerogel and Vacuum Insulation Panels

Expanding at 8.7%, a full 1.50 times the market rate, on materials delivering several times the thermal resistance per millimetre that mineral wool or foam can achieve, which matters wherever thickness rather than cost turns out to be the binding constraint. Retrofitting an existing facade without moving the window line, insulating pipework inside a congested plant, and upgrading building services in occupied premises all fall into that category. Pricing reflects the absence of any alternative rather than the manufacturing cost, since the competing option is usually a design that simply cannot be built at all. Volumes stay small when measured against mineral wool, and the qualified supplier field remains genuinely narrow everywhere.
CAGR 8.7%

Cellular Glass, Calcium Silicate and Technical Insulation

Growing at 7.1% annually on materials engineered specifically for industrial process duty, where the operating temperature, compressive strength, moisture resistance and fire behaviour govern selection rather than cost per unit of thermal resistance. Refineries, chemical plants, cryogenic storage and district heating networks between them consume most of the volume, and each application specifies its material on properties that ordinary building insulation cannot deliver at all. Realised pricing runs at several times building material levels, reflecting both the manufacturing cost involved and a supplier field narrow enough that project engineers have genuinely limited options. Demand here tracks industrial capital spending and energy efficiency programmes rather than any construction cycle at all.
CAGR 7.1%
Full segment breakdown across 6 segments available in the complete report.

Regional Architecture and Country Demand Map

Insulation plants have to sit inside a freight radius of roughly 400 kilometres from the construction demand that each of them serves, which makes the geographic picture a fairly straightforward reflection of where the building activity and the energy regulation happen to coincide with one another.

East Asia

Thirty percent of global value here, comfortably the largest regional share, because Chinese construction volume remains the largest anywhere despite the recent residential downturn, and because regional building energy codes have tightened considerably faster than most observers expected them to. Japanese and Korean demand is smaller in volume but technically demanding, with high performance and thin profile products taking an unusually large share, given how constrained urban retrofit work has become there. Chinese producers dominate domestic supply almost completely and compete on delivered cost within provincial freight radii. Growth of 6.7% runs above the global rate, supported by code tightening and by industrial insulation demand rather than by construction volume itself.
Share: 30% | CAGR: 6.7% (2026 to 2036)

North America

Twenty-four percent of global value here, weighted toward residential glass wool and foam board, commercial roofing insulation, and a substantial industrial and mechanical insulation business alongside them. Energy code adoption varies considerably from state to state and province to province, which produces distinctly uneven demand and it rewards producers who track that regulatory geography unusually closely. Plant networks here are organised around the freight radius rather than around any notion of a national footprint, and the largest producers here each operate a dozen or more separate works. Growth of 5.2% here reflects steady renovation activity alongside industrial insulation demand rising as heat loss becomes a documented and measured cost line.
Share: 24% | CAGR: 5.2% (2026 to 2036)
Regional intelligence for 5 additional markets available in the complete report: Western Europe, South Asia and Pacific, Latin America, Middle East and Africa, Eastern Europe. Contact sales@marketmindsadvisory.com.
thermal-insulation-material-market-country-cagr-analysis-1787310882181

Where insulation margin genuinely survives

Four commercial positions separate producers earning something real from those hauling low density product around a region at whatever the nearest competing works allows. Each one of them rests on something that sheer scale cannot deliver: installed performance evidence, technical product capability, plant geography, or else an energy position secured before anybody else realised they needed one.

Contract on installed performance rather than declared values

Declared thermal conductivity is measured on a perfect laboratory specimen, and building owners have long since learned that a finished wall achieves considerably less once compression, gaps and thermal bridging are all accounted for. Producers offering measured installed performance, with system warranties and post-installation verification rather than a datasheet, realise roughly 24% above competitors quoting declared values. The verification cost involved is modest and the contractor training pays for itself quickly. Most producers avoid the commitment precisely because it would expose the gap between laboratory numbers and what buildings actually achieve.
Market Impact: Realises roughly 24% above declared

Build technical and industrial insulation capability deliberately

Industrial process duty specifies material on operating temperature, compressive strength and moisture behaviour rather than on cost per unit of thermal resistance, and the qualified supplier field is far narrower as a result. Producers with genuine technical insulation capability realise roughly 2 times building material pricing per cubic metre, on volumes that grow with industrial capital spending rather than housing cycles. The capability is product development and project engineering support, not additional melting capacity. Most building insulation producers still treat industrial work as an afterthought and end up pricing it accordingly.
Market Impact: Realises roughly 2 times building m

Place plants inside the freight radius before competitors do

Haulage exceeds product value beyond roughly 400 kilometres, which makes plant location the single most important commercial decision in this industry and one that cannot be revisited afterwards. Producers established inside a construction market hold roughly 20% delivered cost advantage over competitors shipping from outside it, regardless of any difference in manufacturing efficiency. Greenfield capacity in a growing market is worth considerably more than incremental capacity in a saturated one. Several large producers have kept investing in mature regions while conceding faster growing markets entirely to local entrants who arrived first.
Market Impact: Holds roughly 20% delivered cost ad

Secure advantaged energy for melting and curing operations

Melting and curing carry roughly 24% of delivered cost, and the gap between advantaged industrial energy and European spot pricing during 2022 exceeded the entire margin on a cubic metre of mineral wool. Producers with contracted or advantaged energy run roughly 18% below exposed competitors, and that gap decides who keeps operating through a price spike. Several European lines closed permanently through 2022 rather than idling and waiting for prices to ease. Energy position should therefore govern both siting and contracting decisions well ahead of labour cost or logistics convenience.
Market Impact: Runs roughly 18% below energy-expos

Who Controls the Margin Pool

Concentration is low for such a capital-intensive industry, with the top five holding 31% of global insulation production volume, the basis on which every participant here is assessed. Rockwool and Saint-Gobain lead through plant networks positioned inside multiple construction markets rather than through any technology advantage, while the remaining field spans foam producers, regional mineral wool operators, Chinese volume manufacturers and specialist technical insulation houses.
Competition currently runs on delivered cost inside a freight radius, energy position and channel relationships rather than on declared thermal performance, which is broadly comparable within each material class. Distributor and contractor relationships decide most building volume, and they are considerably stickier than product specifications. Technical insulation capability has become a genuine differentiator as industrial energy efficiency spending has risen.

Emerging pressure comes from two directions at once. Fire performance regulation continues shifting specification from foam toward mineral wool in several applications, which reprices positions built on organic chemistry. And energy cost divergence between regions has become permanent enough that European producers face a cost position their plant networks were never designed around, favouring producers with advantaged energy wherever they happen to sit.
thermal-insulation-material-market-company-positioning-matrix-1787310882705

Competitive Moat and Risk Dimensions

ROCKWOOL

Moat: Plant network and fire performance

A plant network positioned inside many separate construction markets gives Rockwool a delivered cost position competitors cannot replicate without building comparable works, and stone wool's fire performance has become steadily more valuable as facade regulation tightened after several high-profile failures. Both advantages rest on physical assets and material chemistry rather than on anything a competitor can price against directly.
ROCKWOOL

Risk: Melting energy cost exposure

Stone wool melting is genuinely energy intensive, and European energy costs through 2022 demonstrated how quickly that exposure can exceed the entire margin on a cubic metre of product. The plant network that provides the delivered cost advantage also fixes the company's energy geography, and works cannot be relocated toward cheaper power when regional pricing diverges permanently.
SAINT-GOBAIN

Moat: Distribution reach and product breadth

Ownership of building materials distribution alongside insulation manufacture gives Saint-Gobain channel access that competitors must negotiate for, and breadth across glass wool, foam and technical products lets it serve a whole specification rather than one line. In a market decided by contractor and distributor relationships, that combination is worth considerably more than any thermal performance claim.
SAINT-GOBAIN

Risk: Foam regulatory specification risk

A broad position across organic foam products carries exposure as fire performance regulation continues shifting facade and cavity specification toward mineral materials in several jurisdictions. Each revision removes addressable applications rather than repricing them, and converting foam capacity toward mineral wool is a plant replacement decision rather than a product reformulation.

Players Tracked

Prominent Players

Rockwool
Saint-Gobain
Knauf Insulation
Owens Corning
Kingspan

Other Key Players

BASF
Johns Manville
Paroc
URSA
Recticel
Aspen Aerogels
Cabot
Armacell
Beijing New Building Materials
TechnoNICOL
Huamei Energy-Saving Technology
Dow
Covestro
Soprema
Ravago

Recent Developments

JANUARY 2025

Producer commits to installed performance warranty programme

An insulation manufacturer launched a full system warranty covering measured installed thermal performance rather than the declared material values normally quoted, backed by mandatory contractor training and post-installation verification, on the explicit basis that building owners had grown openly sceptical of laboratory measured conductivity figures.
Signal: Installed performance accountability is no
MAY 2025

European line closure follows sustained energy cost divergence

A mineral wool producer permanently closed one of its European melting lines, citing an energy cost position that no longer supported continued operation against imported and regionally advantaged supply, and confirming that the capacity would not be restarted even if regional energy prices eased again.
Signal: Energy cost divergence between the regions
SEPTEMBER 2025

Refinery insulation survey identifies rapid payback opportunities

A large refinery completed a detailed thermal survey of its process piping and vessels, identifying heat loss with payback periods under two years right across a substantial portion of the whole site and prompting a multi-year technical insulation replacement programme covering several separate process units.
Signal: Industrial heat loss is now becoming a doc

Melting energy and feedstock cost exposure

Melting and curing energy accounts for roughly 24% of delivered cost, with gas and electricity dominating mineral wool production and steam carrying foam. Raw materials contribute about 27%, split between glass batch and basalt for mineral products and styrene, polyol and isocyanate for the foams. Binder and additives add 9%, conversion labour 11%, packaging 7%, with freight and working capital carrying the remaining 22%.
Energy was the defining exposure of the forecast history and remains so. European industrial gas and electricity prices through 2022 reached levels the IEA documented as unprecedented, which pushed several mineral wool lines below cash cost and closed some permanently. Rockwool Annual Report 2022 recorded energy cost pressure across its European operations, and Kingspan Annual Report 2022 noted raw material and energy cost recovery lagging across insulation product lines.

The competitive disadvantage mechanism runs through energy geography rather than through operating efficiency. Producers on exposed European power and gas cannot close a gap that reached several multiples during the spike, whatever they do about furnace efficiency. Those without freight-optimised plant placement also carry haulage costs rivals avoid. European mineral wool producers frequently carry both disadvantages, which is why capacity has closed there while additions concentrated elsewhere.
thermal-insulation-material-market-cost-volatility-analysis-1787310882899

Contract energy supply on multi-year terms before capacity commitments

Melting and curing carry nearly a quarter of delivered cost, and 2022 demonstrated that an exposed energy position can exceed the entire margin on a cubic metre of product. Multi-year energy contracting, and treating energy geography as a siting criterion rather than a running cost, decides which lines survive the next divergence in regional pricing.

Compress packaging to extend the profitable delivery radius

Trucks fill by volume long before weight, so every percentage point of compression achieved in packaging directly extends the radius a plant can serve profitably. Compression equipment and packaging redesign cost very little against a new works, and together they convert freight distance from a hard commercial boundary into an ordinary cost line instead.

Shift product mix toward higher density technical insulation

Technical and industrial insulation ships considerably better than low density building product because value per cubic metre is far higher, which loosens the freight constraint that governs everything else. It also carries realised pricing at roughly twice building material levels, so the mix shift improves both the addressable delivery radius and the realised margin simultaneously.

Portfolio Architecture for Margin Defence

Margin architecture separates by whether the customer is buying thermal resistance per dollar or a property that only one material class delivers, which is not at all how most producers organise their internal reporting. Commodity glass wool and foam board sold into residential envelope work earns whatever the nearest competing works allows, because many products meet the code requirement identically.
Value climbs where a property other than thermal resistance governs. Fire-rated mineral wool for facade and cavity applications defends pricing through regulation that competitors using organic chemistry cannot satisfy at all. Technical insulation for high temperature and cryogenic duty sits higher again, since operating temperature and compressive strength narrow the qualified field to a handful of materials.

The highest value pools concentrate where thickness constraints or extreme service conditions leave the customer with no real alternative, which describes aerogel, vacuum panels and specialist technical products. Those pools are small in volume and quite disproportionate in realised margin. The commercial tension is that commodity building volume keeps melting furnaces loaded, which the economics absolutely require, while funding almost none of the development that opens anything above it.

Volume / Commodity-Adjacent Tier

Commodity glass wool, expanded polystyrene and foam board supplied into residential envelope work through distribution, where several products meet the code requirement identically and delivered cost inside the freight radius decides everything.
Gross Margin: 18-26%

Premium / Certified Tier

Fire-rated stone wool, polyisocyanurate board and certified system assemblies for facade, roofing and commercial applications. Regulatory performance and system approvals defend pricing here. The ten-point range reflects board supply against certified system positions.
Gross Margin: 30-40%

Sustainability / Regulatory / Next-Generation Tier

Aerogel blankets, vacuum insulation panels, cellular glass and specialist technical insulation for thickness-constrained and extreme service duty. Absent alternatives defend pricing very strongly. The fourteen-point range reflects established technical products against emerging aerogel economics.
Gross Margin: 44-58%
thermal-insulation-material-market-portfolio-architecture-1787310883400

High-value Sub-segments and Strategic Watch-out

Aerogel and vacuum panels for constrained retrofit

High value and genuinely high growth together here, because the competing option is usually a design that cannot physically be built rather than simply a cheaper material, which removes delivered price from the conversation almost entirely here. Realised margin reflects that position very directly indeed.
Gross Margin: 44-58%

Technical insulation for industrial process duty

Strong realised value on steady growth, because operating temperature, compressive strength and moisture behaviour narrow the qualified field to a handful of materials that project engineers cannot easily substitute between once a plant is running. Service history matters a great deal more than price here.
Gross Margin: 38-50%

Commodity glass wool and foam board

The volume core of this entire market, keeping melting furnaces and foam lines properly loaded while earning whatever the nearest competing works permits on products that meet the building code requirement identically. Necessary for basic asset economics, but this tier funds nothing whatsoever above itself.
Gross Margin: 18-26%

Energy cost exposure across the plant network

The strategic watch-out running right across this whole portfolio, given that melting and curing together carry fully 24% of the delivered cost and that the regional energy divergence seen during 2022 exceeded the entire realised margin on a single cubic metre of mineral product outright.
Gross Margin: 14-40%

How insulation demand actually behaves

Demand is regulation-driven, channel-mediated and geographically captive at once. Building codes set the quantity required rather than encouraging it, which makes volume more stable than construction activity suggests, and the specification is usually written by an architect who never appears in the transaction. What decides the sale is which product the distributor stocks and the contractor will install, inside a freight radius limiting the field to a few.
Stickiness sits with the channel and the certification rather than the material. Commodity board and roll are loosest, substituted between deliveries on price with no consequence beyond a merchant switching supplier. Certified system assemblies sit tighter, because approval covers a specific combination of components that cannot be mixed. Technical insulation for high temperature duty is stickiest of all, since a plant engineer who has watched a material perform for a decade rarely experiments.

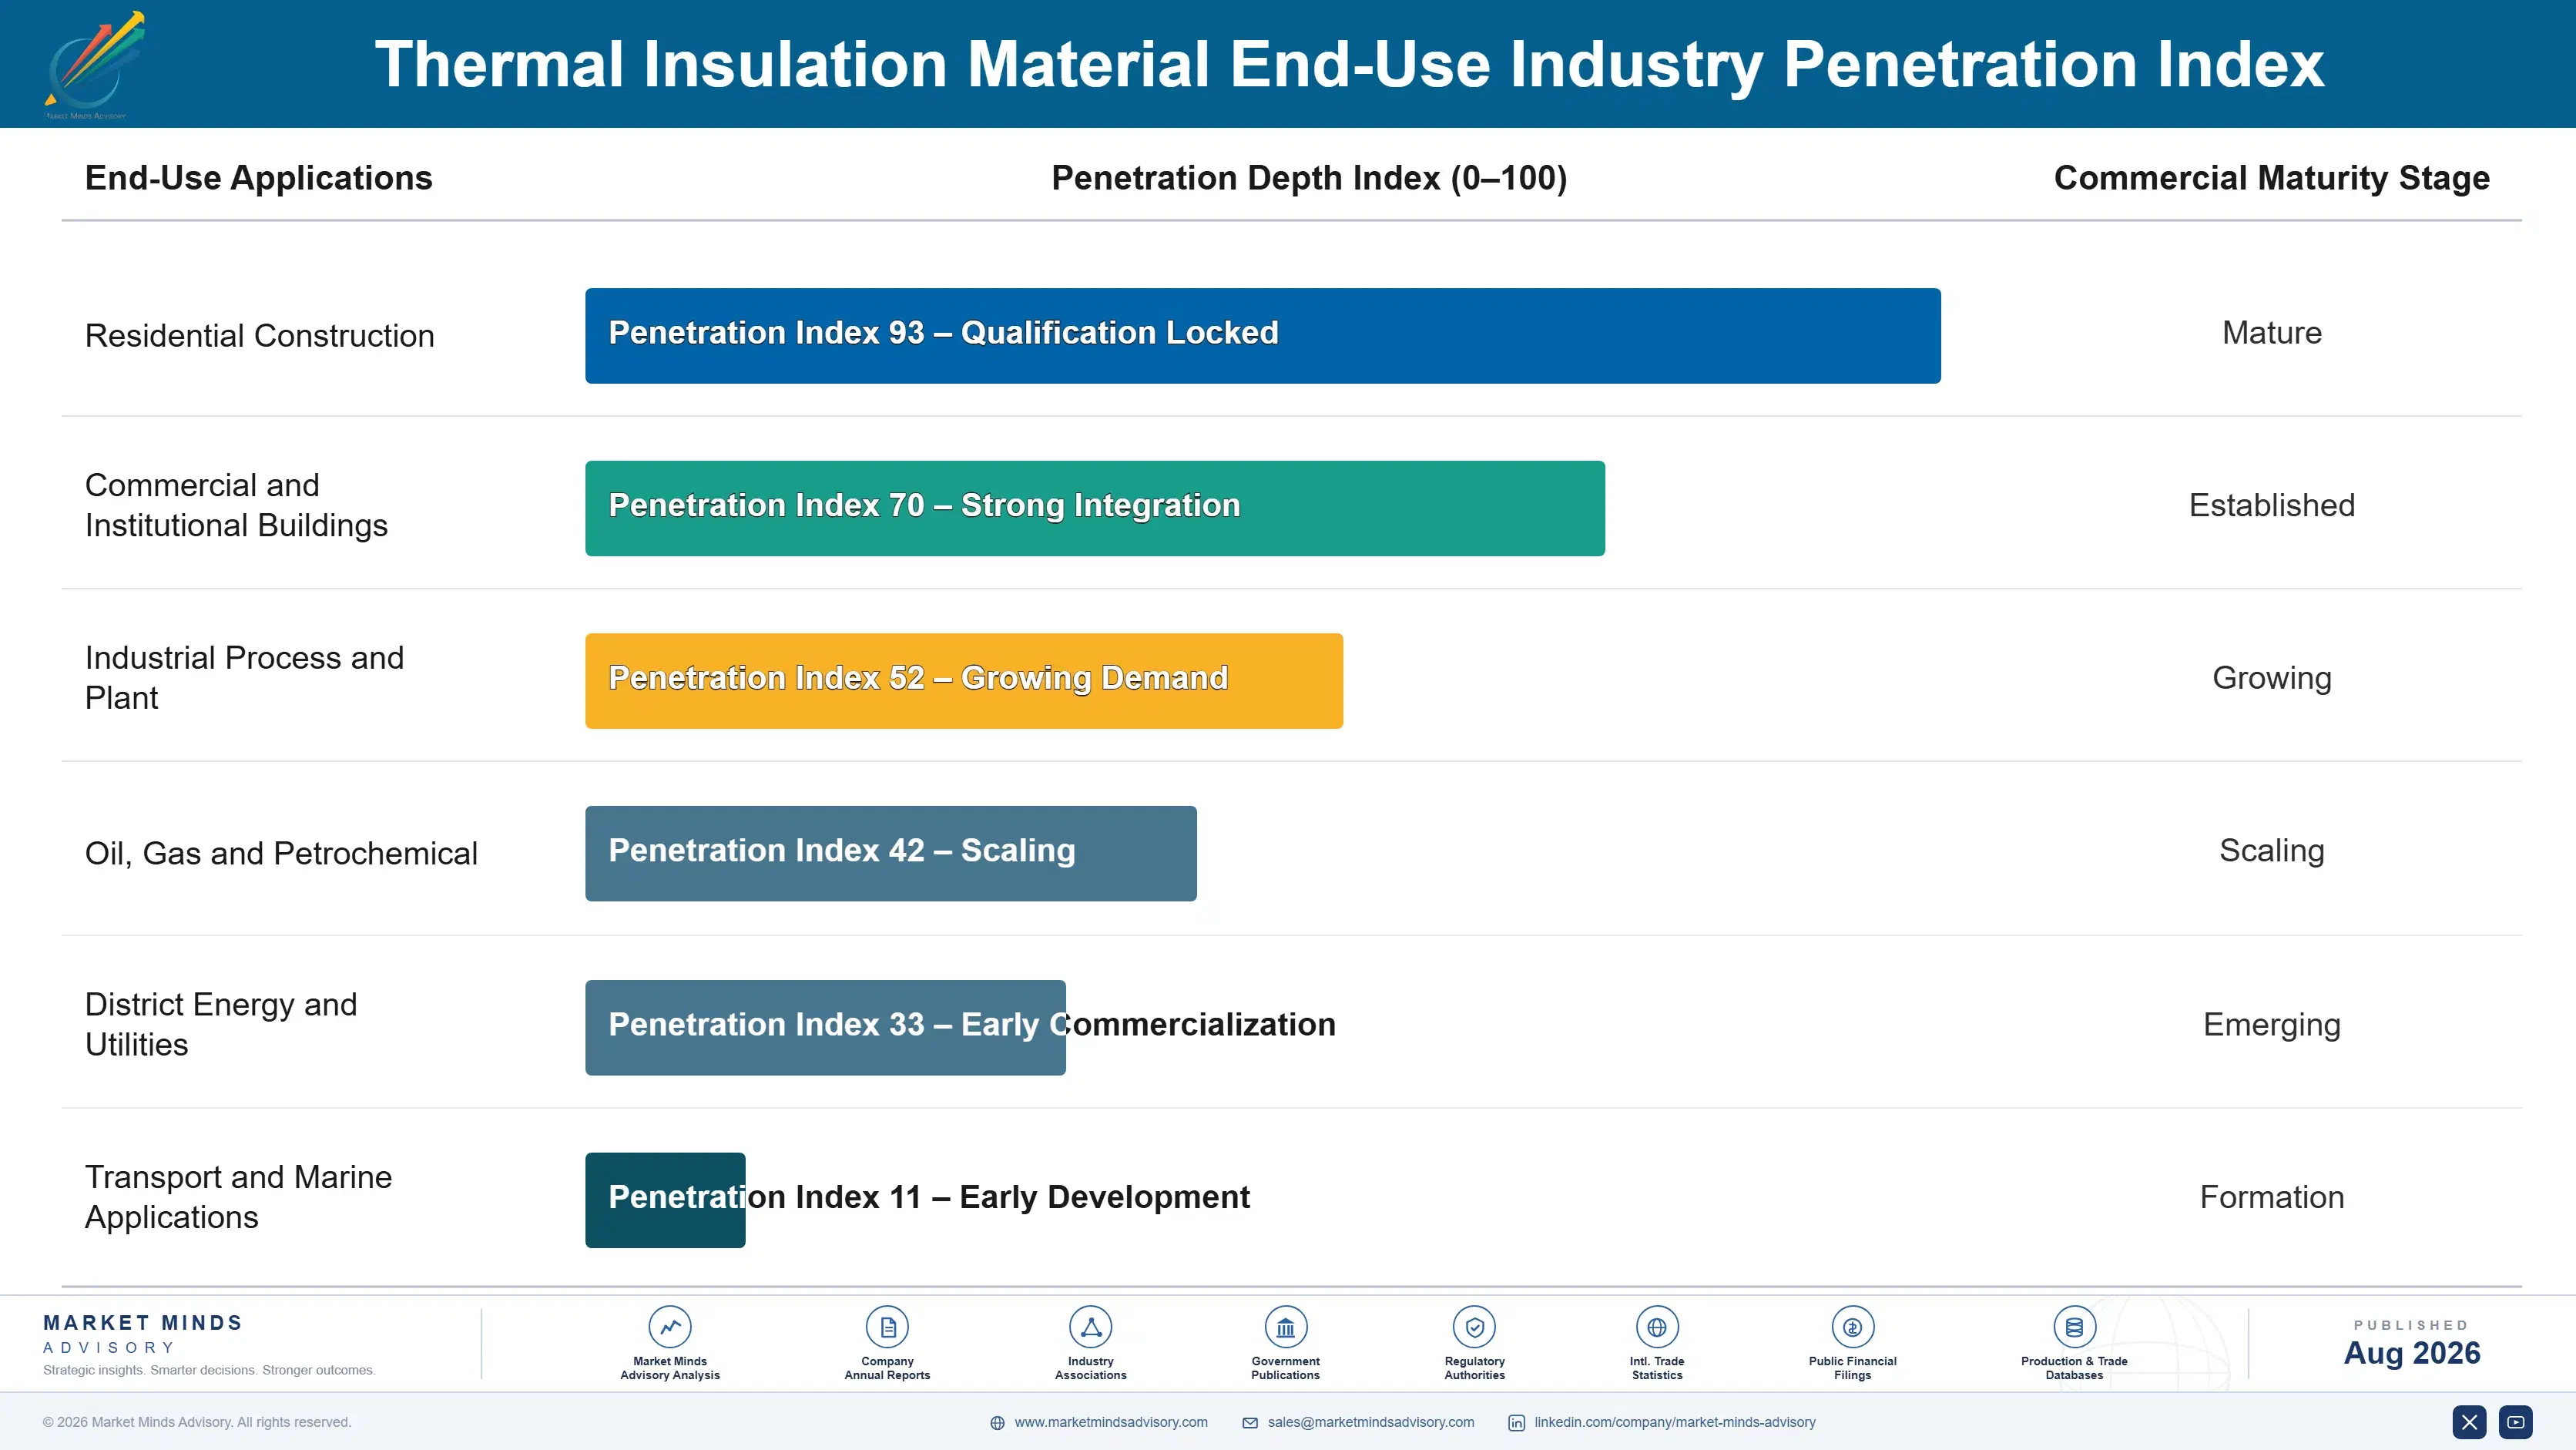
The buyer profile splits between channels in ways that defeat a single commercial model. Residential and commercial building volume moves through builders merchants and distributors buying on price, availability and merchandising. Industrial and technical insulation is specified by plant engineering on operating temperature and service history, and bought through contractors who follow the specification rather than shopping it around.
thermal-insulation-material-market-end-use-penetration-index-1787310883887

What we would actually do here

These are among the four positions where our research anticipates prominent divergence between winners and laggards over the coming forecast period. Each is grounded in the demand model, the regulatory perimeter, and the announced capacity pipeline.
01 / INSTALLED PERFORMANCE ACCOUNTABILITY

Warrant the wall, not the laboratory specimen

Declared thermal conductivity is measured on a perfect specimen, and building owners have worked out that a finished wall achieves considerably less once compression, gaps and thermal bridging are counted. Producers offering measured installed performance with system warranties and post-installation verification realise roughly 24% above competitors quoting declared values. Verification costs very little and the contractor training pays for itself quickly, and most producers avoid making that commitment precisely because it would expose the gap they have quietly relied upon.
02 / TECHNICAL INSULATION CAPABILITY

Take the industrial work seriously for once

Industrial process duty specifies material on operating temperature, compressive strength and moisture behaviour rather than cost per unit of thermal resistance, which narrows the qualified supplier field considerably. Producers with genuine technical capability realise roughly 2 times building material pricing per cubic metre, on volumes that follow industrial capital spending rather than housing cycles. The capability is product development and project engineering support rather than more melting capacity, and most building insulation producers treat this work as an afterthought entirely.
03 / FREIGHT RADIUS POSITIONING

Site the next plant where the growth actually is

Haulage exceeds product value beyond roughly 400 kilometres, which makes plant location the single most consequential commercial decision available in this industry and one that nobody ever revisits afterwards. Producers already established inside a construction market hold roughly 20% delivered cost advantage over competitors shipping in from outside it, whatever their relative manufacturing efficiency happens to be. Several large producers have kept adding capacity in mature regions while conceding faster growing markets entirely to local entrants who simply arrived there first and stayed.
04 / ENERGY COST POSITION

Treat energy geography as a siting decision

Melting and curing carry roughly 24% of delivered cost, and the gap between advantaged energy and European spot pricing during 2022 exceeded the entire margin on a cubic metre of mineral wool. Producers with contracted or advantaged energy run roughly 18% below exposed competitors, and that difference alone decided which lines kept running through the spike and which closed. Several European lines closed permanently rather than idling through it, which is what a permanent cost gap looks like in practice.

Engagement Snapshot From the Field

A live engagement with an industry participant carrying material or product regulatory and market exposure ahead of a defining policy shift, showing how our research translates into a defensible multi-year portfolio strategy.
MARKET MINDS ADVISORY · CLIENT ENGAGEMENT SUMMARY
Thermal Insulation Material Producer Strategic Portfolio Review and Transition Roadmap 2026·Investment Scenario on Thermal Insulation Material Exposure Evaluation 2025-26
CLIENT PROFILE
A regional insulation manufacturer operating three mineral wool and foam board plants across Europe, supplying builders merchants, roofing contractors and a smaller industrial insulation business. Insulation revenue approached EUR 480 million annually (client-reported, unverified by MMA), roughly eighty percent of it commodity glass wool and foam board sold through distribution on delivered price within regional freight radii.
STRATEGIC CHALLENGE
Margins had collapsed through the energy spike and had not recovered, and management attributed the shortfall to imported product rather than to its own energy position. Industrial insulation opportunities were being lost without anybody establishing why. A proposed capacity expansion at the highest energy cost plant was under active consideration.
MMA APPROACH
We rebuilt delivered cost by customer location and by plant energy contract rather than at company level, quantified the freight radius over which each works was genuinely competitive, and reconstructed eleven lost industrial insulation opportunities through interviews with plant engineering functions rather than the purchasing contacts the client normally dealt with. Installed performance was measured independently against declared values on four projects.
KEY FINDINGS
  1. Margin collapse traced almost entirely to the energy contract position at two plants rather than to imported product, whose landed cost had barely moved across the period.
  2. The proposed expansion sat at the plant with the worst energy position, and would have added commodity capacity into a radius already served by three competitors.
  3. Nine of eleven lost industrial opportunities failed on absent project engineering support rather than on product capability, delivered price or lead time in any respect.
  4. Measured installed performance fell well short of declared values on all four projects examined, and no commercial process existed anywhere to address that gap.
CLIENT PROFILE
A regional insulation manufacturer operating three mineral wool and foam board plants across Europe, supplying builders merchants, roofing contractors and a smaller industrial insulation business. Insulation revenue approached EUR 480 million annually (client-reported, unverified by MMA), roughly eighty percent of it commodity glass wool and foam board sold through distribution on delivered price within regional freight radii.
STRATEGIC CHALLENGE
Margins had collapsed through the energy spike and had not recovered, and management attributed the shortfall to imported product rather than to its own energy position. Industrial insulation opportunities were being lost without anybody establishing why. A proposed capacity expansion at the highest energy cost plant was under active consideration.
MMA APPROACH
We rebuilt delivered cost by customer location and by plant energy contract rather than at company level, quantified the freight radius over which each works was genuinely competitive, and reconstructed eleven lost industrial insulation opportunities through interviews with plant engineering functions rather than the purchasing contacts the client normally dealt with. Installed performance was measured independently against declared values on four projects.
KEY FINDINGS
  1. Margin collapse traced almost entirely to the energy contract position at two plants rather than to imported product, whose landed cost had barely moved across the period.
  2. The proposed expansion sat at the plant with the worst energy position, and would have added commodity capacity into a radius already served by three competitors.
  3. Nine of eleven lost industrial opportunities failed on absent project engineering support rather than on product capability, delivered price or lead time in any respect.
  4. Measured installed performance fell well short of declared values on all four projects examined, and no commercial process existed anywhere to address that gap.
RECOMMENDED STRATEGY
Phase 1: Phase one: renegotiate energy contracts at both exposed plants and cancel the proposed expansion at the highest energy cost works immediately. Phase 2: Phase two: build project engineering support for industrial insulation and pursue the technical specifications where genuine product capability already existed. Phase 3: Phase three: introduce measured installed performance verification alongside contractor training across the three largest distribution and roofing contractor accounts in the portfolio.
OUTCOME
The client cancelled the expansion and renegotiated energy supply at both exposed plants. Industrial insulation revenue rose by roughly a third within twelve months, and realised margin across the group improved by 16% (client-reported, unverified by MMA) against the prior year on comparable volume shipped.

Frequently Asked Questions

Foundational context covering the market sizes, CAGR, scope, country, region and competition that inform every finding below. This section is provided to cover basics and most often pre-purchase conversations, answered from the MMA Primary Research Dataset.

What is the current size of the Thermal Insulation Material Market?

The market is valued at USD 62.0 billion in 2025, rising to USD 65.60 billion in 2026. Sizing covers material sold to distributors, contractors and manufacturers at realised delivered price.

How large will the Thermal Insulation Material Market be by 2036?

The market reaches USD 115.29 billion by 2036, an increase of USD 49.69 billion across the forecast period. That represents an expansion multiple of 1.76 times the 2026 base.

What is the CAGR for the Thermal Insulation Material Market 2026 to 2036?

The base case CAGR is 5.8% across 2026 to 2036. The bull case reaches 7.0% on faster renovation programmes, while the bear case sits at 4.5% under a sustained construction downturn.

Which segment is growing fastest?

Aerogel and vacuum insulation panels grow fastest at 8.7%, a full 1.50 times the market rate. They serve applications where thickness rather than cost is the binding design constraint.

Who are the major companies in the Thermal Insulation Material Market?

Rockwool, Saint-Gobain, Knauf Insulation, Owens Corning and Kingspan lead on production volume, holding 31% collectively. The remaining field is largely regional producers and specialist technical houses.

Which country is growing fastest?

India grows fastest at 8.6%, driven by construction expanding faster than anywhere else alongside building codes moving from voluntary guidance toward enforceable requirements across major cities.

Report Segmentation Architecture

The full report scope spans multiple orthogonal segmentation dimensions, with cross-tabulated demand data provided for each dimension pair. Coverage extends further to regional breakdowns, trend trajectories, and the competitive detail needed to support segment-level decision-making.

By Material Class

  • Glass Wool
  • Stone Wool
  • Expanded and Extruded Polystyrene
  • Polyurethane and Polyisocyanurate Foam
  • Aerogel and Vacuum Insulation Panels
  • Cellular Glass, Calcium Silicate and Technical Insulation

By End-Use Industry

  • Residential Construction
  • Commercial and Institutional Buildings
  • Industrial Process and Plant
  • Oil, Gas and Petrochemical
  • District Energy and Utilities
  • Transport and Marine Applications

By Customer Type and Channel

  • Builders Merchants and Distribution
  • Insulation and Roofing Contractors
  • Housebuilders and Developers
  • Industrial Plant Owners
  • Mechanical Insulation Contractors
  • Original Equipment Manufacturers

By Region

  • North America
  • Western Europe
  • East Asia
  • South Asia and Pacific
  • Latin America
  • Middle East and Africa
  • Eastern Europe

Scope, Methodology, and Coverage

Every figure in this report is reproducible from documented input assumptions. The scope below maps the historical period, the forecast horizon, the segmentation dimensions, and the countries covered, alongside the underlying primary and qualitative methodology.
Historical Period
2020 to 2025
Forecast Period
2026 to 2036
Base Year
2025 (USD billions; MMA Primary Research Dataset, August 2026)
Market Definition
The market comprises materials supplied to reduce heat transfer in buildings, industrial plant and technical applications, spanning glass wool, stone wool, expanded and extruded polystyrene, polyurethane and polyisocyanurate foam, aerogel and vacuum insulation panels, and cellular glass, calcium silicate and technical insulation classes. Sizing captures material revenue at realised delivered price across residential construction, commercial and institutional buildings, industrial process and plant, oil, gas and petrochemical, district energy and utilities, and transport and marine applications. Acoustic-only products, fire protection boards without thermal function, insulated glazing units, installation labour and contracting services, and refrigeration or building services equipment all fall outside scope.
Quantitative Units
USD billions (current prices); insulation shipped annually in millions of cubic metres; USD per cubic metre at realised delivered price
Segmentation Dimensions
By Material Class; By End-Use Industry; By Customer Type and Channel; By Region
Regions Covered
North America, Western Europe, East Asia, South Asia and Pacific, Latin America, Middle East and Africa, Eastern Europe
Countries Covered
USA, Canada, Mexico, UK, Germany, France, Italy, Spain, Netherlands, Belgium, Sweden, Denmark, Poland, Romania, Czech Republic, Hungary, Turkey, China, Japan, South Korea, Taiwan, India, Singapore, Malaysia, Thailand, Vietnam, Indonesia, Australia, Brazil, Mexico, Chile, Colombia, Saudi Arabia, UAE, Qatar, Egypt, South Africa, and additional markets relevant to this sector
Key Companies Profiled
Rockwool, Saint-Gobain, Knauf Insulation, Owens Corning, Kingspan, BASF, Johns Manville, Paroc, URSA, Recticel, Aspen Aerogels, Cabot, Armacell, Beijing New Building Materials, TechnoNICOL, Huamei Energy-Saving Technology, Dow, Covestro, Soprema, Ravago.
Quantitative Methodology
Primary survey, n=3,800 respondents, Q4 2025, six countries; demand-side model with trade association cross-validation
Qualitative Methodology
47 expert interviews, Q4 2025; applied to validate demand model assumptions, identify emerging dynamics, and assess competitive positioning
Report Format
PDF and XLSX data workbook (Word format preview document)
Publisher
Market Minds Advisory
Report Code
MMA-2026-CON-599
Published
August 2026
Contact
sales@marketmindsadvisory.com | www.marketmindsadvisory.com

Purchase the full Thermal Insulation Material Market Report (2026 to 2036).

The full report sizes the thermal insulation material market across six material classes, six end-use industries, six customer channels and seven regions, with annual forecasts to 2036 in revenue and cubic metres shipped. It rebuilds delivered cost by customer distance and by plant energy contract rather than at company level, which is the analysis that establishes where each works is genuinely competitive. Twenty participants are assessed on a consistent production volume basis, with plant energy positions mapped separately from installed capacity. Installed performance is measured against declared values across representative building projects.
Six material classes sized and forecast annually to 2036
Delivered cost rebuilt by customer distance and plant energy
Twenty participants assessed on consistent production volume basis
Plant energy positions mapped separately from installed capacity
Installed performance measured against declared laboratory values throughout
Freight radius competitiveness mapped works by works

Built For The People Who Decide

From boardroom strategy to bench-side execution, this report is read cover-to-cover by leaders shaping the next decade of their industry, turning demand scenarios, market dynamics and valuation benchmarks into decisions.
CXOs/ Presidents/ VPs/ Managers
M&A and Corporate Development
Strategy Teams and R&D Heads
Procurement and Product Directors
Regulatory and Compliance Leaders
Investor Relations and Equity Analysts