Market Minds Advisory
Therapeutic Drug Monitoring Market

Therapeutic Drug Monitoring Market: Measured Where Toxicity Was Visible, Not Where It Helps Most

Only a couple of dozen medicines are routinely monitored anywhere, and they were chosen because an overdose was visibly obvious rather than because measurement adds the most clinical value there.

Lead Analyst

Alice Ballenger

Published

September 2026

Make Smarter Decisions with Customized Research Insights

Request a free sample report and evaluate market opportunities, growth trends, and competitive dynamics relevant to your business needs.

2025 MARKET VALUE$2.2BMarket Size 2025
2036 FORECAST VALUE$4.7BBase Case , 2026 to 2036
CAGR 2026 TO 20367.2 %Bull 8.4% / Bear 6.0%
INCREMENTAL OPPORTUNITY$2.3BNet 10- year value creation
EXPANSION MULTIPLE2.00x2036 value over 2026 base
Strategic Levers
M&A Pipeline
Regional Outlook
Country Rankings
Competitive Intelligence
Segmental Deep-dive
Call-Us : 91 93563 13602

Executive Snapshot and Market Trajectory

Around 24 medicines are routinely monitored, and the list was assembled by which drugs killed people visibly rather than by where measurement changes outcomes most. Variability between patients is universal, but only drugs with obvious toxicity ever attracted the assay development that monitoring requires.
The clearest gap is biologic therapy. Roughly 30% of patients lose response to anti-TNF treatment, frequently through sub-therapeutic levels or anti-drug antibodies that a test would identify, and the assay costs around 3% of a month of the drug. Adoption is patchy because no single budget captures the saving from stopping a therapy that has quietly stopped working. The laboratory budget pays and the pharmacy budget saves, which stalls it.
Turnaround undermines much of what is already done. Around 41% of levels come back after the next dose has been given, which makes them a record rather than a decision input. A vancomycin result arriving late is clinically worthless whatever its analytical quality, and hospital laboratories batch these assays for entirely sensible operational reasons. Batching is operationally correct and clinically self defeating at once. Laboratories batch for sensible operational reasons. Analytics are beside the point.
Market Definition
Testing services, instruments, assays and software used to measure drug concentrations and guide individualised dosing, covering antibiotics and antifungals, immunosuppressants, biologics and anti-drug antibodies, antiepileptics, cardiac and psychiatric drugs, and oncology and antiretroviral agents. Measured at supplier and laboratory selling value. Excludes general clinical chemistry unrelated to drug levels, toxicology and drugs of abuse screening, pharmacogenomic testing, and clinical trial bioanalysis services.
Base Year Value
$2.2B in 2025 (MMA Primary Research Dataset, August 2026)
Forecast Period
2026 to 2036, eleven discrete annual values
CAGR
7.2% base case. Bull 8.4%. Bear 6.0%.
Fastest Growth Segment
Biologics and Anti-Drug Antibodies: 10.8% CAGR
Fastest Growth Country
Turkey: 11.4% CAGR
Fastest Growth Region
South Asia and Pacific: 9.2% CAGR
Largest Region
North America: 32% of 2025 global value
Market Leaders
Roche Diagnostics, Abbott, Siemens Healthineers, Thermo Fisher Scientific, Danaher. Source: MMA Primary Research Dataset, July 2026.
Primary Survey
n=3,800 procurement and R&D decision-makers, Q4 2025, six countries
Methodology
Demand-side build-up, cross-validated against public data, 47 expert interviews

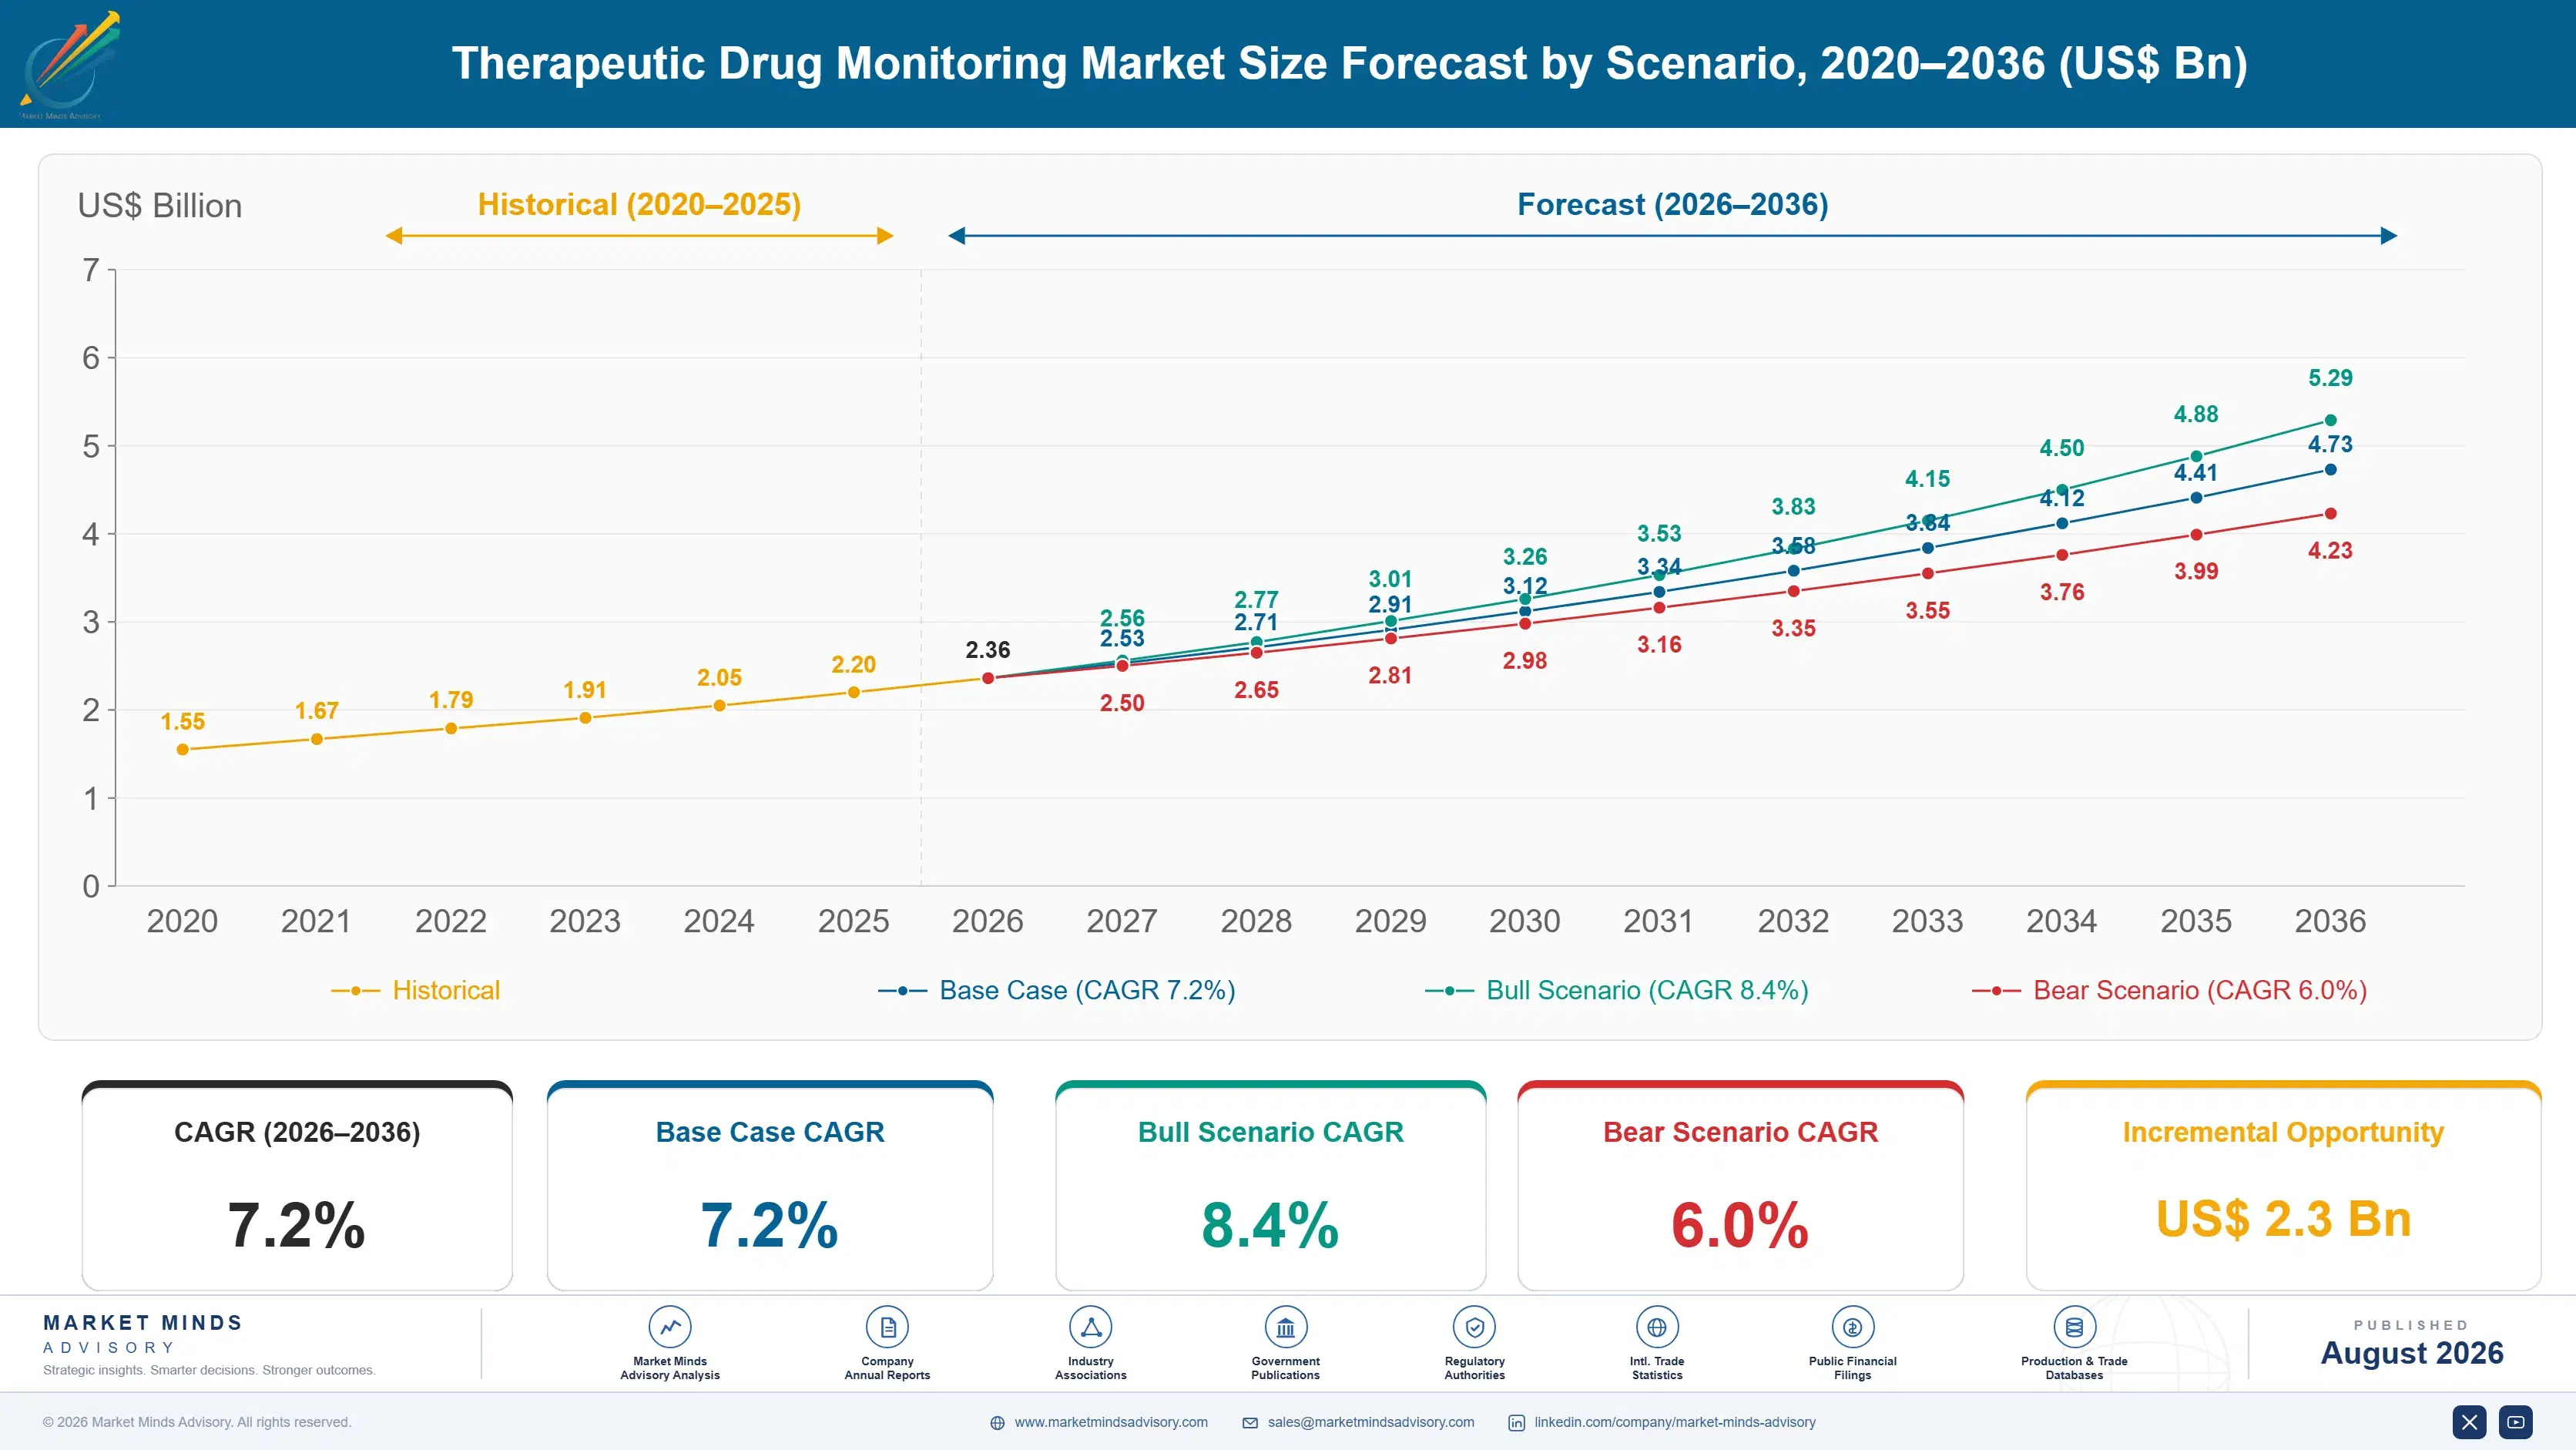
Therapeutic Drug Monitoring Market Forecast Scenarios

therapeutic-drug-monitoring-market-size-forecast-scenario-1787639878544
Growth ran near 6.0% between 2020 and 2025, with established drug classes growing slowly and biologic monitoring expanding from a small base. Vancomycin guidelines moved toward area under curve dosing requiring two levels and modelling software, while most hospitals continued using single trough measurements because the operational burden of the better method exceeded what pharmacy staffing could absorb.
Base case 7.2% rests on three mechanisms. Biologics and anti-drug antibody testing grows at 10.8% as gastroenterology and rheumatology adopt proactive monitoring for therapies where roughly 30% of patients lose response. Oncology and antiretroviral monitoring grows at 9.4% on narrow index agents and adherence assessment. And Turkey grows fastest of any country at 11.4% on a very large transplant programme driving immunosuppressant monitoring. Only one of the three involves established drug classes.
The bull case at 8.4% assumes rapid turnaround testing reaching wards, which would convert results currently arriving after the next dose into genuine dosing decisions. The bear case at 6.0% is continued laboratory batching and unchanged budget structures, leaving biologic monitoring adoption patchy and much of established testing producing records rather than clinical actions. Structure rather than evidence decides which case arrives.

The List Was Written by Toxicity

The set of drugs anybody measures was determined by history rather than by clinical logic. Around 24 medicines are routinely monitored, and they earned that position because overdose produced deafness, seizures, arrhythmia or graft failure that clinicians could see. Pharmacokinetic variability between individuals is universal and applies just as much to drugs whose under-dosing quietly reduces efficacy, and none of those ever attracted assay development.
TOP FIVE CONCENTRATION52%Instrument platforms and assay menus concentrate the supplier field
BIOLOGIC RESPONSE LOSS30%Patients losing response to antibody therapy over treatment
RESULTS AFTER NEXT DOSE41%Levels returned too late to influence the following administration
ASSAY COST AGAINST THERAPY3%Test price relative to a month of biologic treatment
MEDICINES ROUTINELY MONITORED24Drugs with established therapeutic monitoring in everyday clinical practice
MODEL BASED DOSING ADOPTION19%Hospitals using model based dosing rather than single trough levels
The most obvious consequence sits in biologic therapy. Roughly 30% of patients lose response to anti-TNF treatment, frequently because drug levels have fallen below the therapeutic threshold or because anti-drug antibodies have developed, both of which a test identifies clearly. The assay costs around 3% of a month of the therapy. Adoption remains patchy largely because the budget paying for the test is not the budget that saves the drug cost.
Where monitoring is established, timing frequently defeats it. Around 41% of levels are returned after the next dose has already been administered, which turns a decision input into a retrospective record. Hospital laboratories batch these assays because running them individually is uneconomic, and that entirely sensible operational choice removes most of the clinical value the test was intended to deliver in the first place.
"A vancomycin level that arrives after the next infusion is an expensive way of documenting what already happened. The assay quality argument this industry keeps having is irrelevant next to whether the number reaches the prescriber while the decision is still open."
Director, Diagnostics and Laboratory Medicine Practice · MMA Healthcare and Life Sciences Practice · August 2026

Market Trends

Biologic monitoring expanding where response loss is measurable

Roughly 30% of patients lose response to anti-TNF therapy, and testing distinguishes sub-therapeutic drug levels from anti-drug antibody development, which point to entirely different clinical actions. Growth at 10.8% follows that clarity rather than any general enthusiasm for monitoring. The assay costs around 3% of a month of therapy, which makes the economics obvious in aggregate and invisible to whichever department actually holds the testing budget in most health systems. Presenting the case to health system finance rather than laboratory management is what actually resolves it, and that is a different sales motion entirely.
Market Impact: Turkey growing fastest at 11.4%

Turnaround failure converting decisions into retrospective records

Around 41% of drug levels return after the next dose has been administered, which reduces a clinical decision input to documentation of something already done. Laboratories batch these assays because individual runs are uneconomic, and that operational logic is sound in isolation while destroying most of the value the test exists to create. Rapid turnaround platforms and ward based testing address it directly, and adoption has been slower than the clinical case alone would suggest. Suppliers competing on precision and interference are improving a property that was never the binding constraint on clinical usefulness here.
Market Impact: Only 19% use model based dosing

Market Opportunities and Growth Drivers

Large transplant programmes driving immunosuppressant monitoring volume

Turkey grows fastest of any country at 11.4% on one of the largest living donor transplant programmes anywhere, which generates immunosuppressant monitoring volume for the life of every graft rather than for a treatment course. Tacrolimus and ciclosporin have narrow therapeutic windows where under-dosing risks rejection and over-dosing damages the kidney, which makes measurement genuinely non-optional. That demand is recurring, predictable and entirely independent of any diagnostic technology cycle. Graft volume rather than any diagnostic purchasing cycle governs how that demand develops over time. Measurement is genuinely non-optional here. Rejection risk decides it.
Market Impact: Test costs about 3% of therapy

Model based dosing guidelines moving ahead of hospital practice

Vancomycin guidelines now favour area under curve dosing requiring two levels and Bayesian modelling rather than a single trough, and only around 19% of hospitals have adopted it because the operational burden exceeds what pharmacy staffing readily absorbs. That gap between guideline and practice creates demand for software and service that removes the workload rather than adding to it. Vendors selling calculation without workflow relief are asking a stretched department for more work. Software automating sampling prompts, calculation and documentation is what converts a guideline into actual practice. Workload is the constraint.
Market Impact: Batching delays 41% of results

Market Restraints and Challenges

Budget separation preventing obviously economic biologic testing

An assay costing around 3% of a month of biologic therapy identifies patients whose treatment has stopped working, yet adoption stays patchy because the laboratory budget pays and the pharmacy budget saves. The root cause is departmental accounting rather than any clinical disagreement. Commercially it means an economically obvious test fails to spread. Health system level economic analysis and cross budget commissioning are the mitigations, and both require somebody above departmental level to act. Nobody at departmental level can resolve it alone. Somebody above departmental level has to act on it.
Market Impact: Around 30% lose therapy response

Laboratory batching removing clinical value from timely results

Around 41% of levels are returned after the next dose has been given because laboratories batch assays that are uneconomic to run individually, which is operationally correct and clinically self defeating. The root cause is a mismatch between laboratory economics and dosing intervals. Commercially it caps the value of established monitoring regardless of analytical quality. Rapid platforms, ward based testing and scheduled run timing aligned to dosing rounds are the practical mitigations available. Scheduling runs to coincide with ward dosing rounds recovers most of that value at essentially no cost, and remarkably few laboratories have tried it.
Market Impact: Around 41% return too late
4 additional market trends, 3 additional growth drivers, and 2 additional restraints and challenges are covered in the full report. Contact sales@marketmindsadvisory.com to access the complete intelligence.

Segment CAGR and Growth Architecture

Six segments are split by monitored drug class, because class determines the assay technology required, the clinical specialty ordering the test, the turnaround the decision needs and whether monitoring is established or emerging. Platform and format variants sit inside each class. Care setting and channel are handled separately in the framework. Adoption maturity differs sharply by class.
therapeutic-drug-monitoring-market-market-share-analysis-1787639879104

Biologics and Anti-Drug Antibodies

Growing at 10.8%, half again the market rate of 7.2%, this covers measurement of antibody therapy concentrations and anti-drug antibody development, where roughly 30% of patients lose response and testing distinguishes between two causes requiring entirely different clinical responses. The assay costs around 3% of a month of therapy, which makes the system level economics obvious while leaving them invisible to whichever department holds the testing budget. Gastroenterology and rheumatology adoption is uneven for exactly that reason rather than any clinical doubt. Clinical specialties rather than laboratory management decide whether this testing happens at all, which most diagnostic suppliers have not organised around. The clinical case is not in dispute anywhere.
CAGR 10.8%

Oncology and Antiretroviral Agents

At 9.4% this covers narrow therapeutic index oncology agents where toxicity and efficacy sit close together, alongside antiretroviral monitoring used partly for concentration and partly as an objective adherence measure that patient report cannot provide. Both applications require turnaround aligned to clinic visits rather than to laboratory batching schedules. Assay development for newer targeted agents lags their clinical introduction considerably, which leaves several drugs with genuine variability and no routine measurement available to prescribers anywhere. Turnaround aligned to clinic visits matters more here than laboratory batching efficiency, and the two pull in opposite directions in almost every hospital. Assay development for newer targeted agents lags their clinical introduction considerably, which leaves genuine variability unmeasured.
CAGR 9.4%
Full segment breakdown across 6 segments available in the complete report.

Regional Architecture and Country Demand Map

North America holds 32% of value on laboratory infrastructure, biologic therapy volume and transplant activity, with monitoring more established across specialties than in any other region. Western Europe follows at 24% and South Asia and Pacific grows fastest of the seven regions. All shares hold in band.

North America

Laboratory infrastructure and biologic therapy volume are both larger here than anywhere, which supports established monitoring across specialties and gives the region its leading share. Budget separation between laboratory and pharmacy is nonetheless as obstructive here as elsewhere, which keeps biologic monitoring adoption uneven despite obvious system level economics. Model based vancomycin dosing has advanced further than in most markets. Growth at 6.4% reflects a mature base with expansion concentrated in biologic and oncology applications. Clinical specialties rather than laboratory purchasing decide biologic adoption, which most suppliers have yet to organise commercial coverage around. Model based vancomycin dosing has advanced further here than in most markets, though it remains a minority of hospitals.
Share: 32% | CAGR: 6.4% (2026 to 2036)

Western Europe

Publicly funded systems make cross budget economics easier to demonstrate in principle and slower to act on in practice, since commissioning decisions move at institutional rather than clinical pace. Transplant programmes are substantial and immunosuppressant monitoring is well established throughout. Biologic monitoring adoption varies widely between national systems and between hospitals within them. Growth of 5.8% is the slowest anywhere on mature established testing and constrained laboratory budgets across most systems. Cross budget commissioning is possible in principle and slow in practice, which leaves obviously economic testing waiting on institutional decisions. Transplant programmes are substantial and immunosuppressant monitoring is thoroughly established across every national system. Biologic monitoring adoption varies widely between systems and between hospitals within them.
Share: 24% | CAGR: 5.8% (2026 to 2036)
Regional intelligence for 5 additional markets available in the complete report: East Asia, South Asia and Pacific, Latin America, Middle East and Africa, Eastern Europe. Contact sales@marketmindsadvisory.com.
therapeutic-drug-monitoring-market-country-cagr-analysis-1787639879626

Four Moves Toward the Decision

A result arriving after the dose is documentation, and an economically obvious test that no single budget benefits from does not spread. Everything worth doing here shortens turnaround to the decision, moves the economic argument above departmental level, or develops assays for drugs nobody currently measures at all. All three are addressable now. Timing and structure decide it.

Sell turnaround rather than analytical performance

Around 41% of levels are returned after the next dose has been given, which makes them records rather than decisions regardless of how good the assay is analytically. Rapid platforms, ward based testing and run scheduling aligned to dosing rounds all address that directly. Suppliers competing on precision and interference are improving a property that was never the binding constraint, while the one that is goes largely unaddressed by anybody. Scheduling runs against ward dosing rounds costs almost nothing and recovers a large share of that lost value immediately. Few laboratories have tried.
Market Impact: Recovers the 41% of results returned too late

Take the biologic economics above departmental budgets

An assay costing around 3% of a month of therapy identifies the roughly 30% of patients whose biologic treatment has stopped working, and adoption stalls because laboratory budgets pay while pharmacy budgets save. Presenting the case to health system finance rather than to laboratory management reaches somebody who sees both numbers. That is a different sales motion entirely and it is the only one that resolves the obstruction. Departmental accounting is the obstruction, and no amount of clinical evidence resolves an accounting problem. Health system finance sees both numbers and can act.
Market Impact: Addresses the 30% of patients losing therapy response

Remove workload rather than adding calculation

Only around 19% of hospitals have adopted model based vancomycin dosing despite guidelines favouring it, because two levels and Bayesian modelling exceed what pharmacy staffing readily absorbs. Software that automates sampling prompts, calculation and documentation removes work rather than creating it. Vendors offering a calculator are asking a stretched department to do more, which is why guideline adoption has moved so much more slowly than guideline publication did. Guideline publication moved years ago and practice did not follow, which tells you where the constraint actually sits. Pharmacy rather than laboratory is the customer.
Market Impact: Reaches the 81% not yet adopting the method

Develop assays for drugs with variability but no toxicity

Only around 24 medicines are routinely monitored and they were selected by visible toxicity rather than by measurement value, which leaves drugs with genuine pharmacokinetic variability and quiet under-dosing entirely unmeasured. Assay development for those agents opens applications with no incumbent at all. It requires clinical evidence generation alongside the assay, which is slower than menu extension and produces a considerably more defensible position. Clinical evidence generation runs alongside the assay development, which is slower and produces a far more defensible commercial position afterwards. No incumbent exists in those applications at all.
Market Impact: Extends well beyond the 24 currently monitored drugs

Who Controls the Margin Pool

Participation is measured on annual revenue from drug monitoring assays, instruments and related software, and the top five hold 52%. Concentration is moderate because immunoassay menus run on installed analyser platforms while mass spectrometry and specialist biologic assays sit with different suppliers. Roche Diagnostics and Abbott lead through installed platform position rather than through any advantage in assay chemistry. The gap to challengers is installed base rather than assay chemistry.
Competition runs on three fronts. Installed analyser base decides which assays a laboratory can run without new capital, which settles most established class volume. Specialist assay capability decides biologic and mass spectrometry applications. And software and workflow decide whether model based dosing gets adopted at all, which very few diagnostic suppliers address. Clinical specialty access has become a fourth front, and laboratory relationships do not provide it.

Pressure ahead comes from biologic monitoring expanding and from turnaround becoming a purchasing criterion rather than an operational detail. Expect suppliers combining assay and workflow software to gain against pure assay vendors. Rankings shift on who solves turnaround inside the dosing interval first. Concentration should hold while platforms anchor menus.
therapeutic-drug-monitoring-market-company-positioning-matrix-1787639880183

Competitive Moat and Risk Dimensions

ROCHE DIAGNOSTICS

Moat: Installed platform and menu breadth

A very large installed analyser base combined with broad assay menus means a laboratory can add monitoring tests without new capital or additional validation, which is the practical constraint on what most laboratories actually offer. That installed position took decades to build and cannot be attacked by a superior individual assay from a supplier without a platform in the room.
ROCHE DIAGNOSTICS

Risk: Specialist assay displacement

Biologic and anti-drug antibody testing and mass spectrometry applications sit outside the immunoassay platform that anchors the position, and those are the segments growing fastest. Defending that requires capability the platform advantage does not provide, and specialist suppliers have built clinical relationships in exactly those specialties over several years.
THERMO FISHER SCIENTIFIC

Moat: Mass spectrometry and specialist assays

Mass spectrometry capability alongside specialist assay development reaches applications where immunoassay cross reactivity or sensitivity is insufficient, including several immunosuppressant and oncology agents. That capability requires instrumentation and method development depth that immunoassay platform suppliers do not hold, and clinical laboratories running it develop considerable operational commitment to the approach.
THERMO FISHER SCIENTIFIC

Risk: Laboratory workflow complexity

Mass spectrometry demands skilled operators and longer sample preparation, which works against the turnaround improvement this market increasingly needs and limits adoption to laboratories with the staff to run it. That constraint is operational rather than analytical, and it favours simpler platforms wherever clinical requirements allow them to be used instead.

Players Tracked

Prominent Players

Roche Diagnostics
Abbott
Siemens Healthineers
Thermo Fisher Scientific
Danaher

Other Key Players

bioMerieux
Bio-Rad Laboratories
Sysmex
Randox Laboratories
DiaSorin
Waters Corporation
Shimadzu
Agilent Technologies
Chromsystems
Recipe Chemicals
Sebia
Grifols
R-Biopharm
Theradiag
Prometheus Laboratories

Recent Developments

MARCH 2026

Health system funds biologic monitoring from combined budget

A health system funded proactive biologic drug monitoring from a combined pharmacy and laboratory budget after analysis showed avoided therapy costs exceeding assay costs several times over, resolving a departmental accounting obstruction rather than any clinical disagreement. Clinical evidence had been available for years beforehand.
Signal: The obstruction was accounting rather than evidence, and it needed authority above departments to fix now
SEPTEMBER 2025

Hospital moves antibiotic assays to align with dosing rounds

A hospital laboratory rescheduled antibiotic assay runs to align with ward dosing rounds rather than batching for laboratory efficiency, reducing the proportion of results arriving after the next dose had already been administered to patients. No new instrumentation was purchased at any point. Timing improved measurably.
Signal: Scheduling rather than technology recovered most of the clinical value being lost at essentially no cost
DECEMBER 2025

Pharmacy department declines model based dosing on staffing grounds

A pharmacy department declined to implement model based vancomycin dosing despite guideline support, citing the additional sampling, calculation and documentation workload against staffing that could not absorb it at current levels. Clinical support for the method was not in dispute. Staffing was the whole objection.
Signal: Guidelines change practice only where somebody removes the work they create for the department in practice

Reagents, Instruments and Evidence

Antibodies, calibrators and reagent materials carry around 32% of assay cost, with specialist biologic and anti-drug antibody reagents priced well above established immunoassay materials. Instrument manufacture and placement account for about 21%. Clinical validation, regulatory submission and evidence generation take around 17%, which is far higher for new monitoring applications than for menu extensions. Distribution, service and support absorb the balance.
Reagent antibody supply and specialist material costs rose across recent years alongside broader life science supply pressures, per published diagnostics sector reporting and Roche and Thermo Fisher annual reporting for 2025 on reagent and instrument cost commentary. Suppliers developing assays for drugs without established monitoring carry evidence generation costs that menu extensions on existing platforms avoid entirely. That gap shapes which suppliers can economically pursue new applications.

Exposure divides on assay novelty rather than on scale. An established immunoassay carries reagent cost against a platform already placed. A new monitoring application carries clinical evidence generation before any revenue exists, which is a development investment rather than a cost of sales. Mass spectrometry suppliers carry instrument and method development cost against laboratories that must also find skilled operators to run it.
therapeutic-drug-monitoring-market-cost-volatility-analysis-1787639880379

Extend menus on placed platforms before developing new applications

An assay running on an installed analyser reaches a laboratory without capital approval or platform validation, which is the practical constraint on what most laboratories offer. Menu extension therefore converts development spending into revenue far faster than a new monitoring application does, whatever the eventual clinical value of the latter turns out to be. Capital approval is the barrier.

Generate health system economic evidence alongside clinical data

Clinical evidence persuades clinicians and departmental budgets still block adoption where laboratory pays and pharmacy saves. Economic analysis at health system level addresses the actual obstruction, and generating it alongside the clinical work costs far less than doing it afterwards once adoption has already stalled somewhere. Adoption stalls without it. It costs far less done early.

Bundle workflow software with assay supply deliberately

Model based dosing adoption sits near a fifth of hospitals because the method creates work rather than removing it, and software that automates sampling prompts and documentation changes that calculation. Bundling it with assay supply improves both adoption and retention, and it reaches pharmacy rather than only laboratory. Retention improves alongside adoption. Pharmacy becomes the customer.

Portfolio Architecture for Margin Defence

Margin here follows whether an assay runs on a placed platform or requires its own, because a test added to an installed analyser reaches the laboratory without capital approval. Established immunoassay drug levels earn margins in the mid teens to mid twenties, where menus are broadly comparable across platforms and laboratories negotiate reagent pricing against volume commitments. Analytical differences rarely decide anything there. Platform placement decides menu availability.
Mass spectrometry and specialist immunosuppressant assays do better in the mid twenties to mid thirties, because analytical requirements exclude simpler platforms and laboratories running them develop operational commitment that makes switching genuinely disruptive rather than merely inconvenient. Skilled operators are scarce, which limits how widely these methods spread. Operational commitment builds around the method.

Biologic monitoring and integrated dosing software hold the strongest position, reaching into the low forties, where specialist assay capability and workflow integration together reach clinical specialties rather than laboratory purchasing. Those margins reflect clinical relationship and evidence position rather than any advantage in reagent cost or instrument manufacturing. Clinical specialties rather than laboratories decide those purchases entirely. Evidence position rather than reagent cost sets the price.

Established Immunoassay Drug Levels

Routine assays running on placed analysers with broadly comparable menus across platforms. The nine point range reflects volume commitment and platform position rather than any analytical difference between suppliers. Volume decides pricing.
Gross Margin: 15-24%

Mass Spectrometry and Specialist Assays

Applications where immunoassay sensitivity or cross reactivity is insufficient for the clinical requirement. The ten point range reflects method development depth and how committed the laboratory is operationally. Switching is genuinely disruptive.
Gross Margin: 25-35%

Biologic Monitoring and Dosing Software

Specialist assays and workflow software reaching clinical specialties rather than laboratory purchasing. The eleven point range reflects evidence position and how deeply the software has entered clinical routine. Specialties decide adoption.
Gross Margin: 31-42%
therapeutic-drug-monitoring-market-portfolio-architecture-1787639880881

High-value Sub-segments and Strategic Watch-out

Biologic and Anti-Drug Antibody Testing

High value and the fastest growth at 10.8%, distinguishing sub-therapeutic levels from antibody development in the roughly 30% of patients who lose response to antibody therapy over time. Specialties rather than laboratories decide adoption. Budget structure rather than evidence limits it. Economics are obvious in aggregate.
Gross Margin: 33-42%

Model Based Dosing Software

High value and growing as guidelines outpace practice, with only around 19% of hospitals adopting because the method creates work. Software removing that workload reaches pharmacy rather than laboratory. Removing work rather than adding calculation is the requirement. Guidelines moved years before practice did. Pharmacy holds the constraint.
Gross Margin: 30-40%

Established Immunoassay Levels

The volume core, running on placed analysers with comparable menus where laboratories negotiate reagent pricing against volume and analytical differences rarely decide anything at all. Volume commitment decides reagent pricing throughout. Platform replacement cycles rather than clinical ones govern change. Menus are broadly comparable across suppliers.
Gross Margin: 15-24%

Turnaround Value Exposure

The strategic watch-out. Around 41% of results arrive after the next dose, and the range reflects whether a supplier addresses timing or continues competing on analytical performance alone. Timing rather than analytics limits clinical value. Scheduling recovers most of it cheaply. Analytics were never the constraint.
Gross Margin: 13-40%

Two Budgets and a Dosing Round

Demand arises from clinical protocols rather than from purchasing decisions, and the protocols were written around drugs whose toxicity was visible. Established monitoring follows patient volume in transplant, infection and epilepsy care almost mechanically. Biologic monitoring follows specialty adoption decisions that stall on budget structure. Neither responds to a diagnostic supplier's commercial effort in any direct way at all. Protocols rather than purchasing govern it.
Stickiness follows platform placement and clinical routine. An assay running on an installed analyser stays until the platform is replaced, which happens on capital cycles rather than clinical ones. Specialist mass spectrometry methods hold because laboratories build operational commitment around them. Software entering pharmacy workflow holds longest, because removing it returns work that staff have stopped doing. Software holds longest of all.

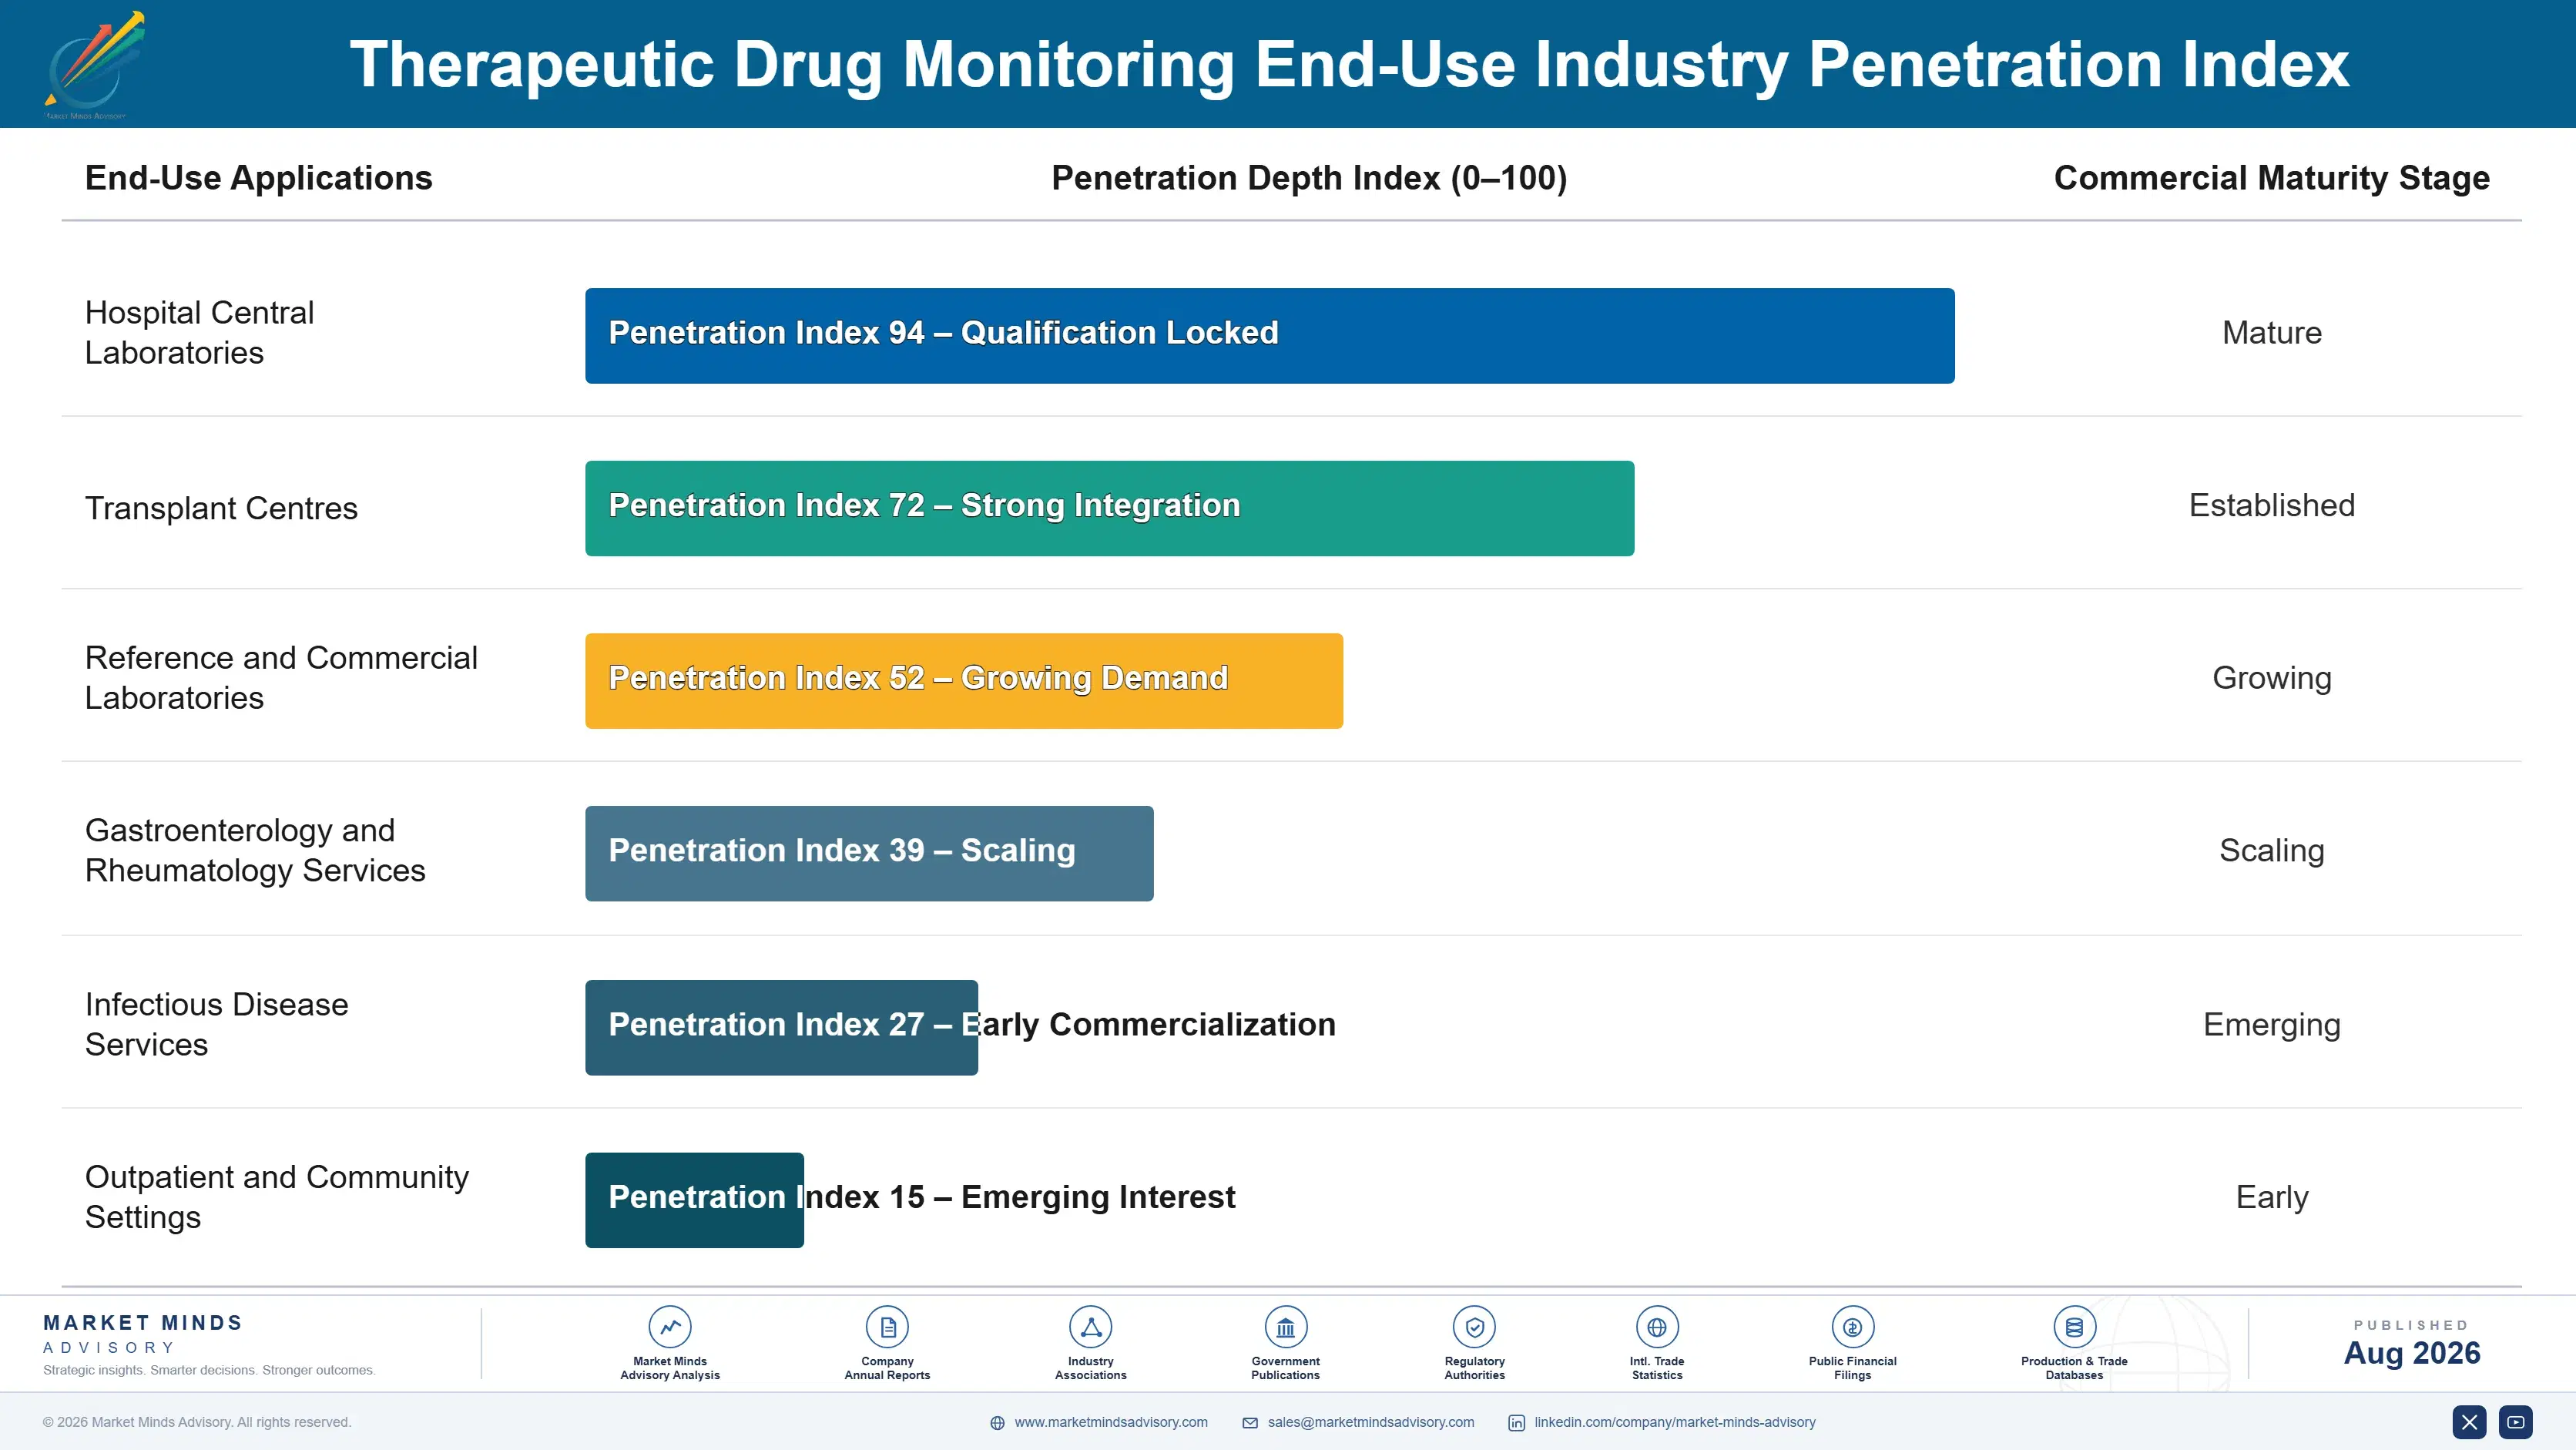
The deciding functions differ sharply between established and emerging applications. Laboratory management decides platform and menu for routine testing. Clinical specialties decide whether biologic monitoring happens at all, and pharmacy decides whether model based dosing is workable. A supplier addressing only laboratory purchasing reaches the decision maker for existing volume and nobody who controls growth. Most suppliers reach only laboratory purchasing.
therapeutic-drug-monitoring-market-end-use-penetration-index-1787639881397

Where We Would Put Effort

These are among the four positions where our research anticipates prominent divergence between winners and laggards over the coming forecast period. Each is grounded in the demand model, the regulatory perimeter, and the announced capacity pipeline.
01 / TURNAROUND CAPABILITY SELLING

A late result is only documentation

Around 41% of all drug levels are returned after the next dose has already been administered, which reduces what should be a clinical decision input to a retrospective record, whatever the analytical quality sitting behind it. Rapid platforms, ward based testing and run scheduling aligned to ward dosing rounds all address that directly and rather cheaply. Suppliers still competing on precision and interference are refining a property that was never the binding constraint on the clinical value this testing delivers.
02 / ECONOMIC ARGUMENT ELEVATION

Take it above the department that pays

An assay costing around 3% of a month of biologic therapy identifies the roughly 30% of patients whose treatment has quietly stopped working, and adoption still stalls simply because laboratory budgets pay for it while pharmacy budgets capture the resulting saving. Presenting that case to health system finance rather than to laboratory management reaches somebody who can actually see both of those numbers at once. It is a different sales motion entirely and the only one that actually resolves the obstruction.
03 / WORKFLOW BURDEN REMOVAL

Guidelines create work somebody must absorb

Only around 19% of hospitals have adopted model based vancomycin dosing despite guidelines favouring it, because two separate levels and Bayesian modelling demand rather more from pharmacy staffing than most departments can readily absorb. Software that automates the sampling prompts, the calculation and the documentation removes work rather than adding any more to it. Vendors offering only a calculator are asking an already stretched department to do more, which explains rather neatly why practice has trailed guideline publication by several years.
04 / UNMONITORED DRUG DEVELOPMENT

The list is short for historical reasons

Around 24 medicines in total are routinely monitored and they were selected because overdose produced visible harm rather than because measurement adds most value, which leaves a range of drugs with real pharmacokinetic variability and quiet under-dosing entirely unmeasured today. Assay development in those areas opens applications where no incumbent supplier exists at all today. That requires clinical evidence generation alongside the assay development itself, which is considerably slower than menu extension on an existing platform and correspondingly more defensible afterwards.

Engagement Snapshot From the Field

A live engagement with an industry participant carrying material or product regulatory and market exposure ahead of a defining policy shift, showing how our research translates into a defensible multi-year portfolio strategy.
MARKET MINDS ADVISORY · CLIENT ENGAGEMENT SUMMARY
Therapeutic Drug Monitoring Producer Strategic Portfolio Review and Transition Roadmap 2026·Investment Scenario on Therapeutic Drug Monitoring Exposure Evaluation 2025-26
CLIENT PROFILE
A diagnostics supplier providing therapeutic drug monitoring assays across established drug classes to hospital laboratories in European and Asian markets, at annual revenue near 140 million euros (client-reported, unverified by MMA). Biologic monitoring assays were absent and no dosing software existed within the portfolio. Specialty relationships did not exist. Turnaround was not measured. Software was absent.
STRATEGIC CHALLENGE
Established assay volumes were growing slowly while specialist competitors were winning biologic monitoring business the client could not serve, and laboratory customers repeatedly cited turnaround problems the client considered outside its responsibility entirely. A portfolio decision was pending. Laboratory customers repeatedly cited timing problems the business considered somebody else's responsibility entirely.
MMA APPROACH
MMA measured what proportion of the client's assay results reached prescribers before the next dose, sized biologic monitoring demand within the client's customer base, examined why proactive biologic testing had stalled at specific hospitals, and assessed model based dosing adoption against pharmacy staffing. Interviews with 47 experts covered laboratory medicine, hospital pharmacy and clinical specialties.
KEY FINDINGS
  1. A substantial share of the client's results arrived after the next dose had been given, which laboratories treated as normal and clinicians treated as the main reason monitoring underperformed.
  2. Biologic monitoring had stalled at every hospital examined because laboratory budgets paid while pharmacy budgets captured the saving, and nobody had presented the case above departmental level.
  3. Pharmacy departments wanted model based dosing and could not staff it, which meant guideline adoption depended entirely on somebody supplying software that removed the additional workload.
  4. Clinical specialties rather than laboratory management decided whether biologic monitoring happened, and the client's commercial organisation had no relationships in gastroenterology or rheumatology.
CLIENT PROFILE
A diagnostics supplier providing therapeutic drug monitoring assays across established drug classes to hospital laboratories in European and Asian markets, at annual revenue near 140 million euros (client-reported, unverified by MMA). Biologic monitoring assays were absent and no dosing software existed within the portfolio. Specialty relationships did not exist. Turnaround was not measured. Software was absent.
STRATEGIC CHALLENGE
Established assay volumes were growing slowly while specialist competitors were winning biologic monitoring business the client could not serve, and laboratory customers repeatedly cited turnaround problems the client considered outside its responsibility entirely. A portfolio decision was pending. Laboratory customers repeatedly cited timing problems the business considered somebody else's responsibility entirely.
MMA APPROACH
MMA measured what proportion of the client's assay results reached prescribers before the next dose, sized biologic monitoring demand within the client's customer base, examined why proactive biologic testing had stalled at specific hospitals, and assessed model based dosing adoption against pharmacy staffing. Interviews with 47 experts covered laboratory medicine, hospital pharmacy and clinical specialties.
KEY FINDINGS
  1. A substantial share of the client's results arrived after the next dose had been given, which laboratories treated as normal and clinicians treated as the main reason monitoring underperformed.
  2. Biologic monitoring had stalled at every hospital examined because laboratory budgets paid while pharmacy budgets captured the saving, and nobody had presented the case above departmental level.
  3. Pharmacy departments wanted model based dosing and could not staff it, which meant guideline adoption depended entirely on somebody supplying software that removed the additional workload.
  4. Clinical specialties rather than laboratory management decided whether biologic monitoring happened, and the client's commercial organisation had no relationships in gastroenterology or rheumatology.
RECOMMENDED STRATEGY
Phase 1: Phase one: address turnaround through run scheduling support and rapid platform options, since timing rather than analytics limits the clinical value delivered. Phase 2: Phase two: build biologic monitoring capability and present the economics to health system finance rather than to laboratory purchasing. Departments cannot resolve it. Phase 3: Phase three: bundle dosing software that removes pharmacy workload rather than offering calculation that adds to it. Pharmacy is the buyer.
OUTCOME
The supplier introduced scheduling support and dosing software during 2026, reporting improved result timeliness across participating hospitals (client-reported, unverified by MMA). Biologic assay development was funded, and commercial coverage of clinical specialties was established alongside laboratory relationships. Turnaround became a stated commercial claim. Laboratory relationships were retained.

Frequently Asked Questions

Foundational context covering the market sizes, CAGR, scope, country, region and competition that inform every finding below. This section is provided to cover basics and most often pre-purchase conversations, answered from the MMA Primary Research Dataset.

What is the current size of the Therapeutic Drug Monitoring Market?

MMA sizes it at USD 2.16 billion in 2025, rising to USD 2.32 billion in 2026. The figure covers assays, instruments, services and software for drug level measurement at supplier selling value.

How large will the Therapeutic Drug Monitoring Market be by 2036?

USD 4.65 billion by 2036, an incremental USD 2.33 billion over the 2026 base and an expansion multiple of 2.00 times. Biologic monitoring accounts for a disproportionate share.

What is the CAGR for the Therapeutic Drug Monitoring Market 2026 to 2036?

7.2% in the base case, with a bull case at 8.4% and a bear case at 6.0%. The spread turns on turnaround improvement and on budget structures allowing biologic monitoring.

Which segment is growing fastest?

Biologics and anti-drug antibody testing at 10.8%, half again the market rate of 7.2%. Around 30% of patients lose response to antibody therapy and testing identifies why.

Who are the major companies in the Therapeutic Drug Monitoring Market?

Roche Diagnostics, Abbott, Siemens Healthineers, Thermo Fisher Scientific and Danaher lead on monitoring revenue, and fifteen further participants are profiled in the full report. Basis is monitoring revenue.

Which country is growing fastest?

Turkey at 11.4%, on one of the largest living donor transplant programmes anywhere, which generates immunosuppressant monitoring demand for the functioning life of every graft.

Report Segmentation Architecture

The full report scope spans multiple orthogonal segmentation dimensions, with cross-tabulated demand data provided for each dimension pair. Coverage extends further to regional breakdowns, trend trajectories, and the competitive detail needed to support segment-level decision-making.

By Monitored Drug Class

  • Antibiotics and Antifungals
  • Immunosuppressants
  • Biologics and Anti-Drug Antibodies
  • Antiepileptics
  • Cardiac and Psychiatric Drugs
  • Oncology and Antiretroviral Agents

By End-Use Industry

  • Hospital Central Laboratories
  • Transplant Centres
  • Reference and Commercial Laboratories
  • Gastroenterology and Rheumatology Services
  • Infectious Disease Services
  • Outpatient and Community Settings

By Commercial Dimension

  • Reagent Supply Contracts
  • Instrument Placement Agreements
  • Reference Laboratory Send-Out Services
  • Dosing Software Licensing
  • Group Purchasing Arrangements
  • Distributor and Dealer Channels

By Region

  • North America
  • Western Europe
  • East Asia
  • South Asia and Pacific
  • Latin America
  • Middle East and Africa
  • Eastern Europe

Scope, Methodology, and Coverage

Every figure in this report is reproducible from documented input assumptions. The scope below maps the historical period, the forecast horizon, the segmentation dimensions, and the countries covered, alongside the underlying primary and qualitative methodology.
Historical Period
2020 to 2025
Forecast Period
2026 to 2036
Base Year
2025 (USD billions; MMA Primary Research Dataset, August 2026)
Market Definition
Testing services, instruments, assays and software used to measure drug concentrations and guide individualised dosing, covering antibiotics and antifungals, immunosuppressants, biologics and anti-drug antibodies, antiepileptics, cardiac and psychiatric drugs, and oncology and antiretroviral agents. Measured at supplier and laboratory selling value. General clinical chemistry unrelated to drug levels, toxicology and drugs of abuse screening, pharmacogenomic testing, and clinical trial bioanalysis services are excluded from scope.
Quantitative Units
USD billions (current prices); tests performed annually; USD per test by drug class
Segmentation Dimensions
Monitored drug class; care setting; commercial dimension; region
Regions Covered
North America, Western Europe, East Asia, South Asia and Pacific, Latin America, Middle East and Africa, Eastern Europe
Countries Covered
United States, Canada, Germany, United Kingdom, France, Italy, Spain, Netherlands, China, Japan, South Korea, Taiwan, India, Australia, Thailand, Brazil, Mexico, Turkey, Saudi Arabia, Poland
Key Companies Profiled
Roche Diagnostics, Abbott, Siemens Healthineers, Thermo Fisher Scientific, Danaher, bioMerieux, Bio-Rad Laboratories, Sysmex, Randox Laboratories, DiaSorin, Waters Corporation, Shimadzu, Agilent Technologies, Chromsystems, Recipe Chemicals, Sebia, Grifols, R-Biopharm, Theradiag, Prometheus Laboratories
Quantitative Methodology
Primary survey, n=3,800 respondents, Q4 2025, six countries; demand-side model with trade association cross-validation
Qualitative Methodology
47 expert interviews, Q4 2025; applied to validate demand model assumptions, identify emerging dynamics, and assess competitive positioning
Report Format
PDF and XLSX data workbook (Word format preview document)
Publisher
Market Minds Advisory
Report Code
MMA-2026-HLT-132
Published
August 2026
Contact
sales@marketmindsadvisory.com | www.marketmindsadvisory.com

Purchase the full Therapeutic Drug Monitoring Market Report (2026 to 2036).

The full report examines why monitoring covers so few drugs and why much of what is measured arrives too late to matter, because both facts limit this market more than any technology does. It sizes all six drug classes independently through 2036, quantifies result timeliness against dosing intervals, and models the budget structures blocking economically obvious biologic testing. Regional chapters cover all seven regions with laboratory infrastructure assessed alongside clinical adoption. Competitive profiling covers 20 participants on one consistent revenue basis. Specialty decision routes are mapped by application.
Six monitored drug classes sized independently through 2036
Result timeliness quantified against clinical dosing intervals
Budget structures blocking biologic monitoring adoption analysed by system
Model based dosing adoption assessed against pharmacy staffing capacity
Unmonitored drugs with pharmacokinetic variability identified and assessed
Twenty participants profiled on one consistent revenue basis

Built For The People Who Decide

From boardroom strategy to bench-side execution, this report is read cover-to-cover by leaders shaping the next decade of their industry, turning demand scenarios, market dynamics and valuation benchmarks into decisions.
CXOs/ Presidents/ VPs/ Managers
M&A and Corporate Development
Strategy Teams and R&D Heads
Procurement and Product Directors
Regulatory and Compliance Leaders
Investor Relations and Equity Analysts