Market Minds Advisory
Therapeutic Apheresis Market

Therapeutic Apheresis Market: Therapeutic Apheresis Market: A Blood Bank Procedure That Became A Manufacturing Step

Every cell therapy begins with a leukapheresis collection, and whether that manufacturing run succeeds depends on a procedure performed in rooms that were never built to feed a production line.

Lead Analyst

Published

September 2026

Make Smarter Decisions with Customized Research Insights

Request a free sample report and evaluate market opportunities, growth trends, and competitive dynamics relevant to your business needs.

2025 MARKET VALUE$2.5BMarket Size 2025
2036 FORECAST VALUE$6.1BBase Case , 2026 to 2036
CAGR 2026 TO 20368.4 %Bull 9.6% / Bear 7.2%
INCREMENTAL OPPORTUNITY$3.4BNet 10- year value creation
EXPANSION MULTIPLE2.24x2036 value over 2026 base
Strategic Levers
M&A Pipeline
Regional Outlook
Country Rankings
Competitive Intelligence
Segmental Deep-dive
Call-Us : 91 93563 13602

Executive Snapshot and Market Trajectory.

A therapeutic procedure quietly became a manufacturing input. Cell and gene therapies start with a leukapheresis collection, and the cells that collection yields determine whether the production run works at all, which places quality expectations on rooms that were never designed for them. A failed collection costs the patient weeks.
East Asia takes 33% of value because Japan reimburses therapeutic apheresis across a far wider set of indications than Western systems do and performs it at several times the per-capita rate, while Japanese manufacturers built the column and membrane technology that serves it. Leukapheresis and cell collection grows at 12.6%, half again the market rate of 8.4%, on cell therapy manufacturing demand. Technology followed reimbursement here.
Concentration is high at 63% and the evidence base is thinner than procedure volume implies. Society category assignments grade indications by evidence strength, and a substantial share of what is performed sits in the weaker categories where recommendations rest on case series rather than on trials. Nobody in this field pretends otherwise, and the procedures continue regardless. A reimbursement review deciding graded recommendations are insufficient would remove volume no product could recover.
Market Definition
The market covers devices, disposable sets, columns and consumables used to perform therapeutic apheresis, including therapeutic plasma exchange, lipoprotein apheresis, extracorporeal photopheresis, leukapheresis and cell collection, red cell exchange, and immunoadsorption and selective removal. Replacement fluids including albumin and plasma, cell therapy manufacturing beyond collection, haemodialysis and continuous renal replacement therapy, and blood donor collection for transfusion supply are excluded. Apheresis nursing services fall outside scope.
Base Year Value
$2.5B in 2025 (MMA Primary Research Dataset, August 2026)
Forecast Period
2026 to 2036, eleven discrete annual values
CAGR
8.4% base case. Bull 9.6%. Bear 7.2%.
Fastest Growth Segment
Leukapheresis and Cell Collection: 12.6% CAGR
Fastest Growth Country
India: 10.4% CAGR
Fastest Growth Region
South Asia and Pacific: 10.0% CAGR
Largest Region
East Asia: 33% of 2025 global value
Market Leaders
Terumo BCT, Fresenius Kabi, Baxter, Asahi Kasei Medical, Haemonetics. Source: MMA Analysis based on disclosed apheresis and extracorporeal therapy revenue, company annual reports 2025.
Primary Survey
n=3,800 procurement and R&D decision-makers, Q4 2025, six countries
Methodology
Demand-side build-up, cross-validated against public data, 47 expert interviews

Therapeutic Apheresis Market Forecast Scenarios

therapeutic-apheresis-market-size-forecast-scenario-1787689997377
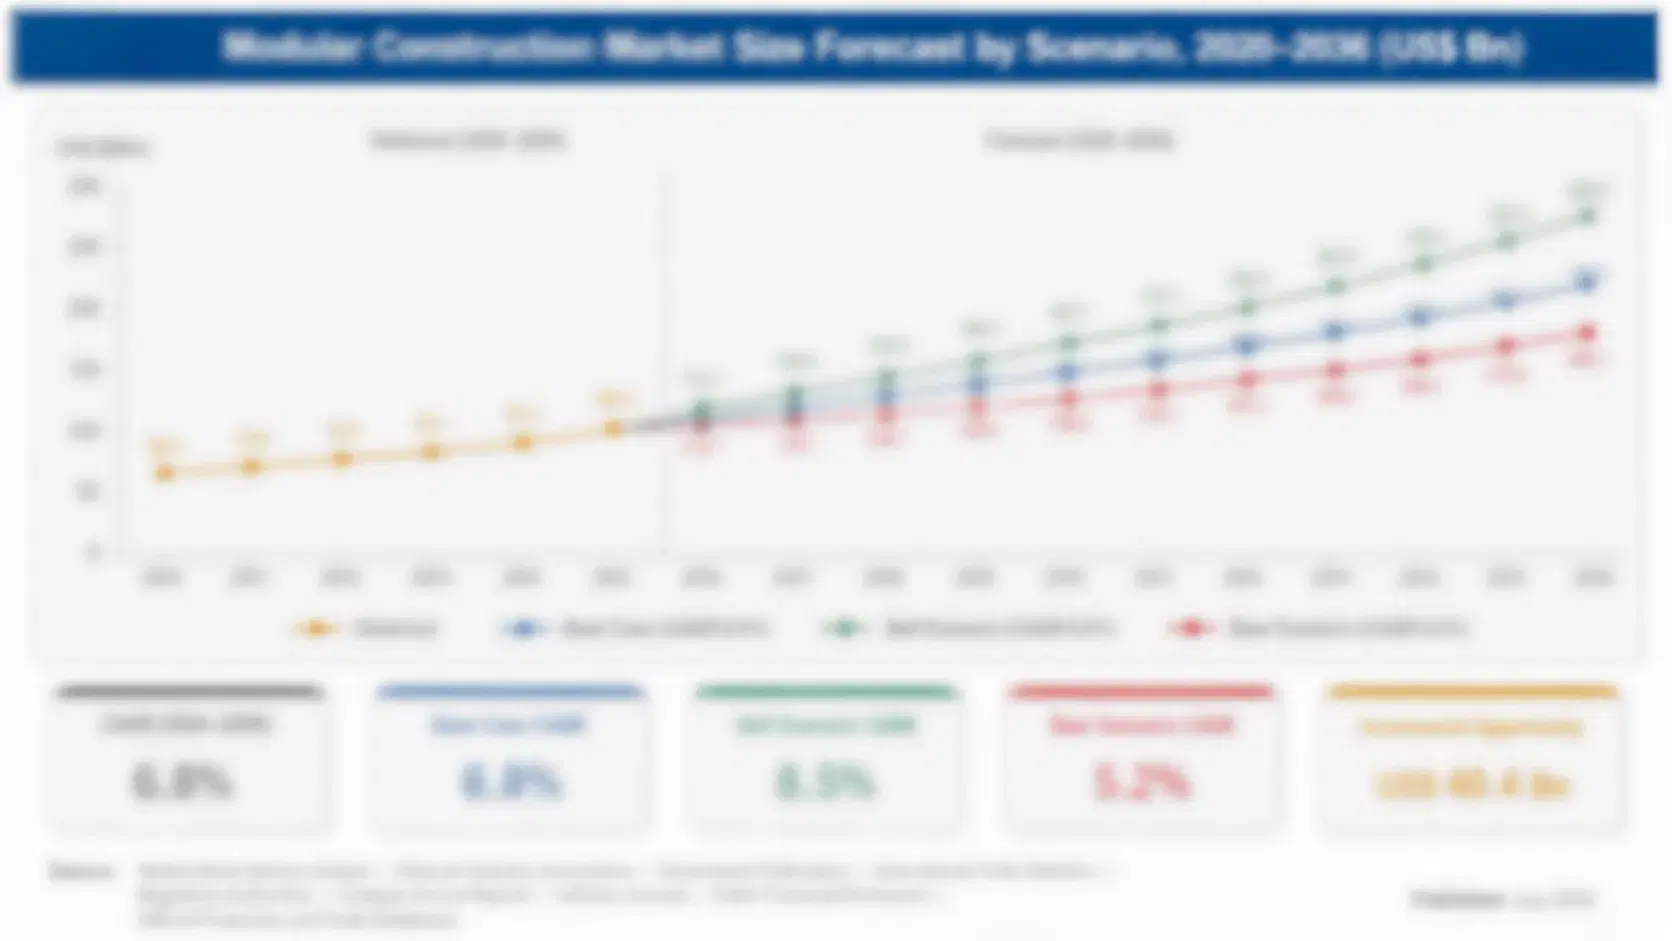
Growth from 2020 to 2025 ran at 7.2% and cell therapy manufacturing changed the character of demand more than volume did. Approved cell therapies moved leukapheresis from an occasional research collection into a scheduled manufacturing step with documentation requirements attached. Conventional plasma exchange volumes grew steadily on neurological and haematological indications. Japanese consumption remained the largest and most stable component throughout the entire period.
The 8.4% base case rests on three mechanisms. Cell therapy approvals keep expanding and each one converts collection capacity into a supply chain constraint rather than a clinical service. Immunoadsorption keeps taking share from plasma exchange because removing a specific antibody avoids the replacement fluid cost and volume load that whole plasma exchange requires. And Asian and Indian capacity keeps expanding as tertiary centres install apheresis for indications previously referred elsewhere or untreated.
The bull case at 9.6% turns on cell therapies reaching commercial volumes across several approved products simultaneously, which would multiply collection demand at every treating centre. The bear case at 7.2% is evidence review narrowing reimbursed indications in the weaker society categories, which would remove procedure volume that currently rests on graded recommendations rather than on trial data.

Collection As A Production Step

The most consequential change here was not clinical. When cell therapies reached approval, the leukapheresis collection that starts every one of them became a manufacturing step rather than a procedure, and roughly 7% of collections still yield material insufficient for the production run that follows. A failed collection means a patient waits weeks for another attempt while their disease progresses. Sites built as clinical services are now audited as suppliers.
FIVE-FIRM CONCENTRATION63%Share of apheresis and extracorporeal therapy revenue held by leaders
PROCEDURE CONSUMABLE COST$680Typical disposable set and column cost per apheresis procedure
TOP CONSUMING COUNTRYJapan 24%Japanese share of global therapeutic apheresis value consumed annually
WEAKER EVIDENCE CATEGORIES46%Procedure volume performed under lower graded society recommendations
COLLECTION FAILURE RATE7%Cell therapy collections yielding insufficient material for manufacturing
TRAINED OPERATOR SHORTFALL3 in 10Apheresis centre posts reported unfilled across surveyed institutions
Japan explains far more of this market than population would suggest. Japanese reimbursement covers therapeutic apheresis across a considerably wider range of indications than Western systems fund, and per-capita procedure rates run several times higher as a result. Japanese manufacturers built the selective columns and membranes that serve those indications, so demand and technology concentrate together for reimbursement reasons.
The evidence position deserves stating plainly. Society category assignments grade indications by evidence strength, and roughly 46% of procedure volume sits in the weaker categories where recommendations rest on case series and clinical reasoning rather than on randomised data. Practitioners are entirely open about this. It nonetheless leaves a meaningful share of the market exposed to any reimbursement review that decides graded recommendations are no longer sufficient justification for funding.
"The moment a collection became the first step in someone's manufacturing process, the apheresis room stopped being a clinic and became a supplier. Almost nobody running one has been told that yet."
Director, Extracorporeal Therapies and Cell Collection Practice · MMA Medical Devices Practice · August 2026

Market Trends

Cell Therapy Turns Collection Into A Supply Chain Step

An approved cell therapy begins with leukapheresis, and the cell yield and composition that collection delivers determine whether manufacturing succeeds, with roughly 7% of collections producing insufficient material. That converts a clinical procedure into a scheduled supply input with documentation, chain of identity and quality expectations attached. Collection centres built as hospital services are being audited by manufacturers as suppliers, which requires processes and record keeping they never held. Growth at 12.6% follows approvals directly, and each new therapy adds collection demand at every treating centre. Nobody planned that transition.
Market Impact: Consumes 24% of global value
Selective Removal Displaces Whole Plasma Exchange

Immunoadsorption removes a specific antibody or protein and returns the patient's own plasma, which avoids the albumin or donor plasma replacement that whole exchange requires along with its cost, availability constraints and volume load. Growth at 10.4% follows that argument, which is as much about replacement fluid supply as about clinical selectivity. Columns cost considerably more per procedure and the total including replacement fluid frequently favours them. Centres that calculated the full procedure cost rather than the consumable price reached that conclusion far sooner than others did. Consumable price comparison misleads reliably.
Market Impact: Anchors 54% of stronger evidence

Market Opportunities and Growth Drivers

Japanese Reimbursement Sustains Uniquely Broad Indication Coverage

Japan funds therapeutic apheresis across a considerably wider set of indications than Western health systems reimburse, and performs procedures at several times the per-capita rate as a direct consequence. Japan alone accounts for roughly 24% of global consumption on a small share of world population. Domestic manufacturers built selective columns and membranes specifically to serve those indications, which means technology development followed reimbursement rather than the other way round. Western suppliers entering the region without column technology find the conversation ends quickly. Technology followed reimbursement rather than the reverse. Column technology is the entry ticket.
Market Impact: Leaves 3 in 10 posts unfilled

Neurological Indication Volume Grows Steadily Across Systems

Plasma exchange for neurological conditions including myasthenic crisis, Guillain-Barre syndrome and neuromyelitis optica represents the most consistently reimbursed part of this market across Western systems, resting on the strongest evidence categories available. Volume grows with diagnosis and with neurology capacity rather than with any change in practice. That makes it the predictable base underneath a market whose growth segments are considerably less stable, and it supports the installed device base that newer modalities subsequently run on at the same centres. Newer modalities run on that same installed base afterward. Predictability makes it the base.
Market Impact: Exposes 46% of procedure volume

Market Restraints and Challenges

Trained Operator Scarcity Limits Centre Throughput

Apheresis requires trained nursing operators and roughly three in ten centre posts are reported unfilled across surveyed institutions, which caps procedure volume regardless of device availability or clinical demand. Root cause is that apheresis nursing is a specialised skill with limited training pathways and no obvious career progression in most hospitals. The commercial impact is that selling additional devices into a centre that cannot staff the ones it has achieves nothing. Mitigation runs through simpler automated devices and manufacturer-funded training, both of which help modestly. Neither approach solves the underlying training pipeline.
Market Impact: Fails 7% of therapy collections

Weaker Evidence Categories Carry Reimbursement Exposure

Roughly 46% of procedure volume is performed under lower graded society recommendations resting on case series and clinical reasoning rather than randomised data. Root cause is that apheresis indications are frequently rare enough that adequately powered trials were never feasible to run. The commercial impact is that a substantial share of the market depends on payers continuing to accept graded recommendations as sufficient justification. Mitigation means registry building and outcome collection, which several societies pursue and which no manufacturer funds at meaningful scale. Trials were frequently never feasible to run.
Market Impact: Avoids 3 litres replacement fluid
3 additional market trends, 4 additional growth drivers, and 2 additional restraints and challenges are covered in the full report. Contact sales@marketmindsadvisory.com to access the complete intelligence.

Segment CAGR and Growth Architecture

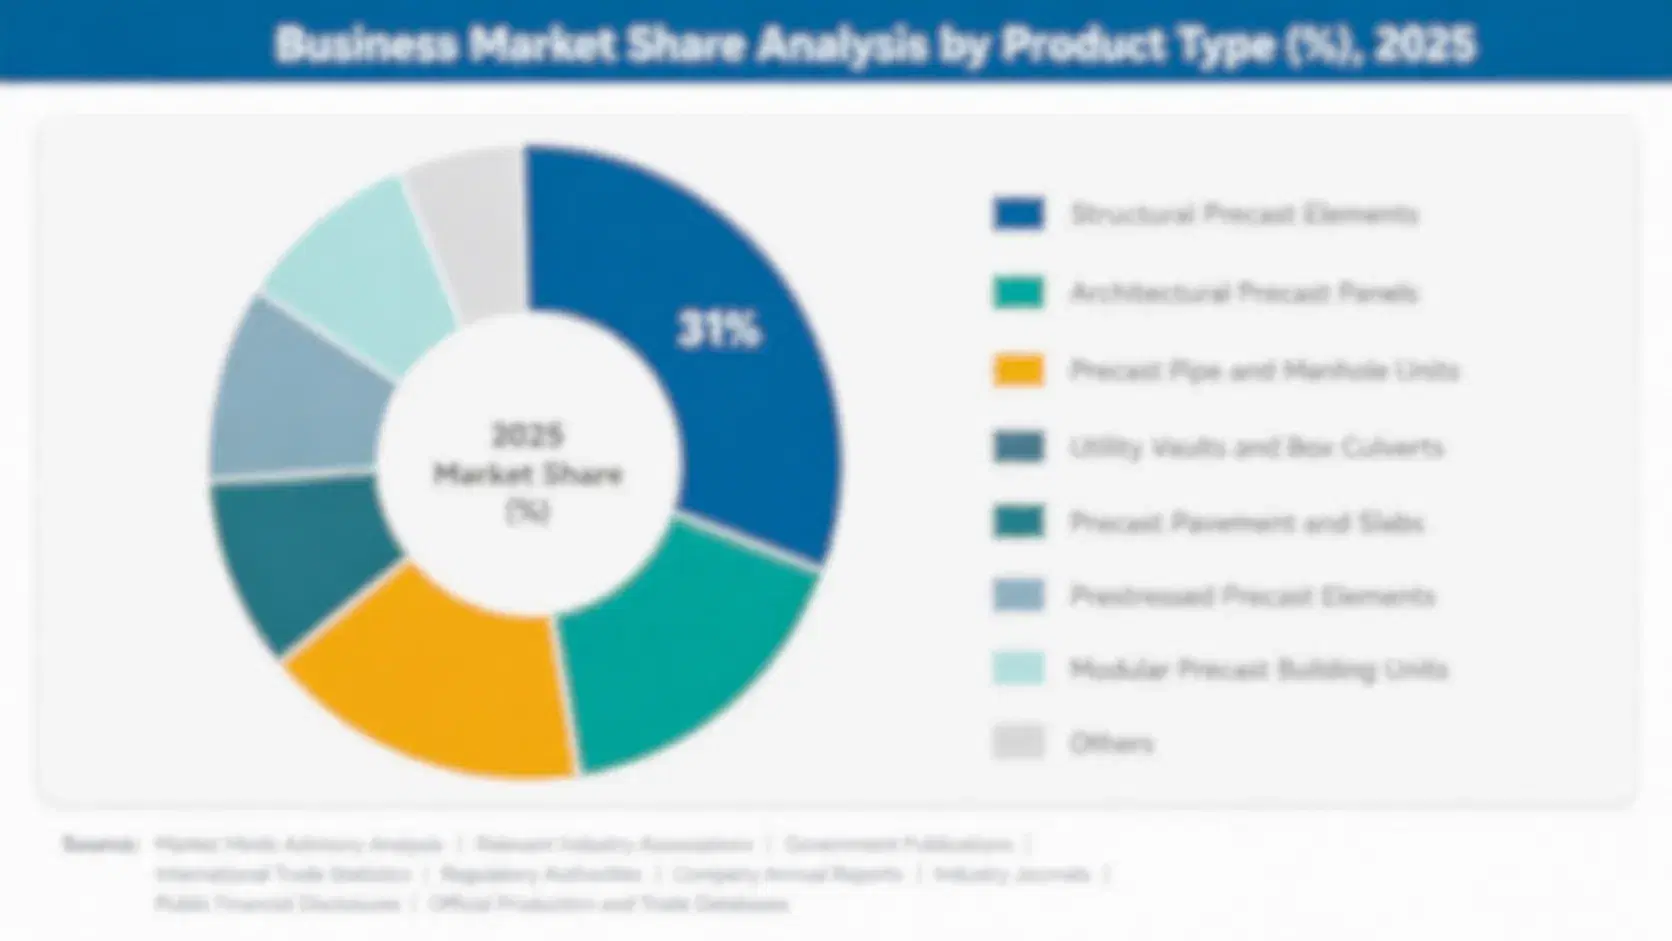
Segmentation follows therapeutic modality: what component is removed and by what mechanism, rather than which disease is treated or where the procedure happens. Six modalities cover the market without overlap, from plasma exchange through to selective immunoadsorption. Clinical indication and purchasing route are treated separately, since both cut across every modality. Both cut across all six modalities listed.
therapeutic-apheresis-market-market-share-analysis-1787689997638

Leukapheresis and Cell Collection

Every approved cell therapy begins with a leukapheresis collection, and the yield and composition that collection produces determine whether the subsequent manufacturing run succeeds, with roughly 7% failing to deliver sufficient material. Growth at 12.6%, half again the market rate of 8.4%, follows therapy approvals directly rather than any change in apheresis practice. What makes this segment genuinely different is that the customer is now a manufacturer auditing a supplier rather than a hospital buying a device. Collection centres built as clinical services hold neither the documentation practice nor the chain of identity systems that role requires of them. That is a persuasion problem rather than a technical one. Nobody prepared them for it.
CAGR 12.6%

Immunoadsorption and Selective Removal

Removing a specific antibody or protein and returning the patient's own plasma avoids the albumin or donor plasma that whole exchange consumes, which matters for cost, for availability and for the volume load a patient receives. Growth at 10.4% rests on that argument as much as on clinical selectivity. Columns cost considerably more per procedure and the total procedure cost including replacement fluid frequently favours them regardless. Centres comparing consumable prices rather than full procedure economics have consistently reached the wrong conclusion, which is a persuasion problem rather than a product one. Centres that calculated full procedure economics reached the conclusion far sooner than those comparing consumable prices alone. The comparison is straightforward.
CAGR 10.4%
Full segment breakdown across 6 segments available in the complete report.

Regional Architecture and Country Demand Map

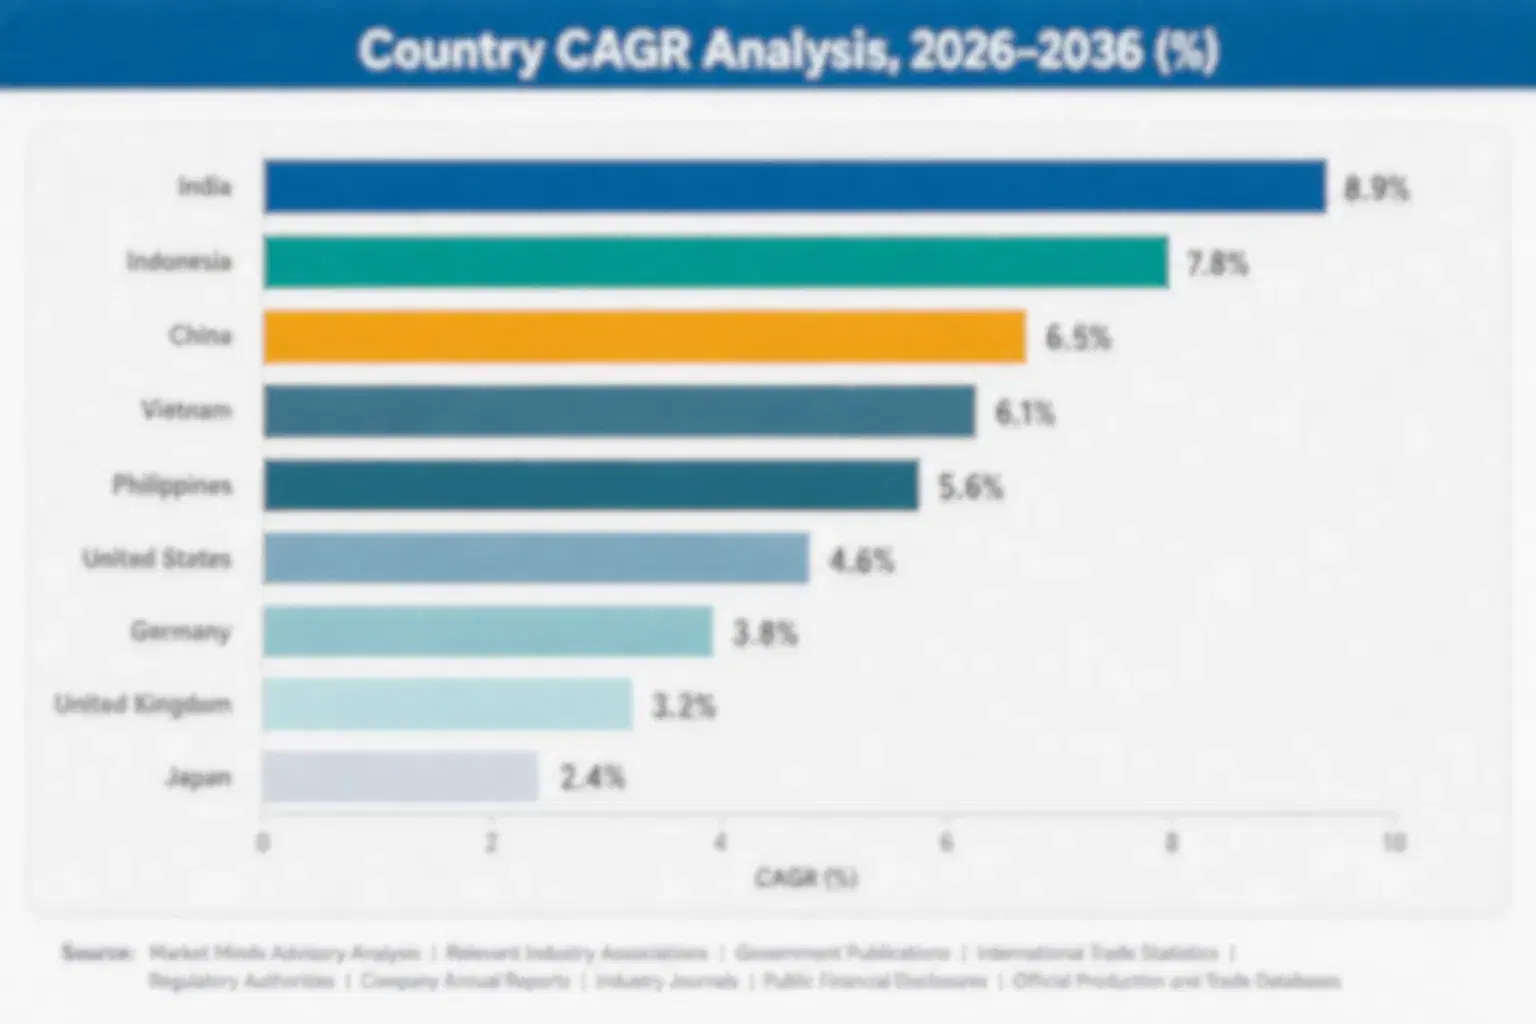
Geography follows reimbursement breadth rather than disease prevalence, which is broadly comparable across populations. East Asia leads because Japan funds a far wider indication set than anywhere else, while Western systems reimburse narrowly and South Asia grows fastest from a small base. Reimbursement breadth shapes everything downstream of it.

North America

American demand splits between conventional plasma exchange for neurological and haematological indications and a rapidly growing cell collection business feeding cell therapy manufacturing. Reimbursement follows society evidence categories closely, which constrains procedure volume in the weaker categories more tightly than Japanese practice does. Cell therapy collection has grown fastest and has brought manufacturer auditing into hospital apheresis units for the first time. Canadian provision is centralised through provincial programmes with narrower indication coverage. Mexican activity is limited and concentrated in private tertiary centres serving patients who fund treatment directly. Manufacturer auditing has entered hospital apheresis units for the first time, which is a party device companies have never had to satisfy before.
Share: 26% | CAGR: 8.0% (2026 to 2036)

Western Europe

European reimbursement is narrower than Japanese coverage and generally follows evidence categories with health technology assessment applied to newer indications. German apheresis practice is the most developed in the region, with lipoprotein apheresis for severe hypercholesterolaemia reimbursed more widely than elsewhere. French and Italian centres perform substantial neurological plasma exchange volume. Nordic systems apply strict indication criteria. Cell therapy collection is growing at accredited centres, and European manufacturers have limited column technology positions relative to their Japanese competitors, which shapes what regional suppliers can actually offer. European suppliers hold limited column technology positions relative to Japanese competitors, which shapes what regional manufacturers can actually offer customers. Column positions are limited here.
Share: 21% | CAGR: 6.8% (2026 to 2036)
Regional intelligence for 5 additional markets available in the complete report: East Asia, South Asia and Pacific, Latin America, Middle East and Africa, Eastern Europe. Contact sales@marketmindsadvisory.com.
therapeutic-apheresis-market-country-cagr-analysis-1787689997905

Serving A Supplier, Not A Clinic

Roughly 7% of cell therapy collections fail, about three in ten apheresis posts sit unfilled, and 46% of volume rests on weaker evidence categories. Four levers work on collection quality, staffing, procedure economics and evidence rather than on device specification, which the installed base already fixes. Device specification decides almost none of this. Nobody is comparing platforms.

Supply Collection Quality Systems, Not Just Devices

Roughly 7% of cell therapy collections yield material insufficient for manufacturing, and each failure means a patient waits weeks while disease progresses. Collection centres built as clinical services lack the documentation, chain of identity and process control that a manufacturer auditing a supplier expects to find. A device company supplying those systems alongside the hardware becomes part of the customer's quality infrastructure rather than a piece of equipment in the room. That position is considerably harder to displace than any device specification ever was. Very few suppliers offer it. That position is durable.
Market Impact: Addresses the 7% cell therapy collection failure rate

Fund Operator Training Where Posts Sit Unfilled

Around three in ten apheresis centre posts are reported unfilled, which caps procedure volume regardless of how many devices a centre owns. Selling additional hardware into an understaffed unit achieves nothing at all. Manufacturers funding training programmes and simplifying device operation expand the volume their installed base can actually deliver, which is the only route to growth at an existing account. The investment is education headcount rather than product development, and remarkably few suppliers treat it as a commercial programme. Roughly 3 in 10 posts are unfilled and no amount of hardware changes that.
Market Impact: Fills the 3 in 10 unfilled operator posts

Sell Total Procedure Cost Against Replacement Fluid

Immunoadsorption columns cost considerably more per procedure than an exchange set, and the total including albumin or donor plasma frequently favours them because selective removal returns the patient's own plasma. Centres comparing consumable prices rather than full procedure economics reach the wrong conclusion consistently. Building that calculation from a customer's own replacement fluid consumption converts a price objection into a cost argument. Growth at 10.4% is already following it wherever anybody has bothered to construct the comparison properly for a purchasing committee. Purchasing committees respond to it immediately. The arithmetic is simple enough.
Market Impact: Offsets around 3 litres of replacement fluid volume

Fund Registry Evidence For Weaker Category Indications

Roughly 46% of procedure volume rests on lower graded society recommendations built from case series rather than trials, which leaves it exposed to any payer deciding graded recommendations are insufficient. Societies pursue registry building and no manufacturer funds it at meaningful scale. A supplier supporting outcome collection in the indications its own devices serve protects a substantial share of its own installed volume. The cost is modest against a trial programme and the protective effect covers the whole category rather than one product. No manufacturer funds this at scale today.
Market Impact: Protects the whole 46% of exposed procedure volume

Who Controls the Margin Pool

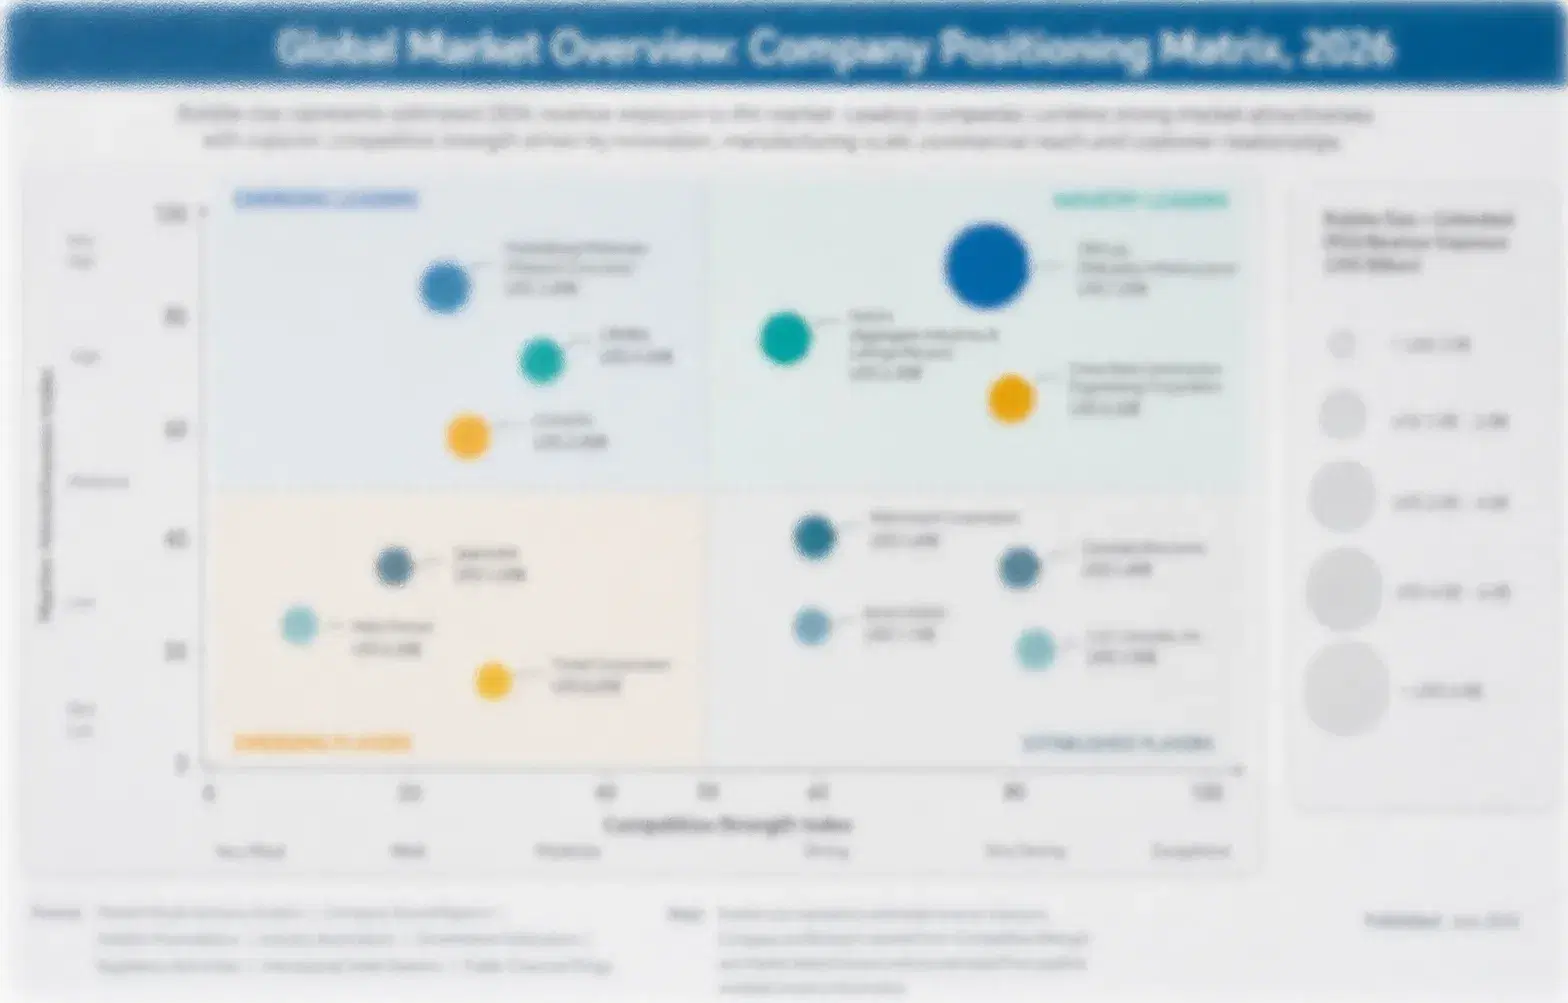
Measured on disclosed apheresis and extracorporeal therapy revenue, the five leading suppliers hold a CR5 of 63%, which is high and reflects a specialised field with substantial regulatory and clinical barriers to entry. Terumo BCT and Fresenius lead on installed device base globally, while Asahi Kasei and Kaneka hold column technology positions that Western competitors have never matched at any point. Barriers here are clinical and regulatory rather than commercial.
Three contests define activity. Device platform selection competes on installed base and operator familiarity, and rarely reopens once a centre is equipped. Column and selective removal competes on technology that concentrates in Japanese manufacturers. Cell collection increasingly competes on quality systems and manufacturer auditability, which is a pharmaceutical supply discipline rather than a device one. A supplier strong in one of those three contests frequently has nothing transferable to the others.

Pressure comes from cell therapy manufacturers specifying collection requirements directly to hospitals, which brings a new party into decisions device companies previously made with clinicians alone. Rankings shift wherever collection quality rather than device capability decides a centre's suitability, and that criterion did not exist five years ago. That criterion did not exist five years ago.
therapeutic-apheresis-market-company-positioning-matrix-1787689998171

Competitive Moat and Risk Dimensions

TERUMO BCT

Moat: Installed Platform And Operator Familiarity

Terumo BCT platforms are installed across a large share of apheresis centres worldwide and operators trained on them stay with them, since retraining a scarce specialised workforce is something no unit undertakes willingly. Platform decisions rarely reopen once a centre is equipped and staffed. A competitor faces both a replacement decision and a retraining burden on scarce staff.
TERUMO BCT

Risk: Column Technology Position Gap

Selective removal and immunoadsorption depend on column chemistry where Japanese manufacturers hold positions built over decades and Western competitors have never matched. That segment grows at 10.4% while conventional exchange grows considerably slower. Platform installed base provides access to the centre and does not supply the technology the fastest growing modality actually requires.
ASAHI KASEI MEDICAL

Moat: Selective Column Chemistry Depth

Asahi Kasei developed selective removal columns to serve Japanese reimbursed indications that no other health system funds as broadly, which produced technology and clinical evidence competitors had no reason to build. That depth transfers wherever selective modalities gain reimbursement elsewhere. Entering column chemistry means development timelines measured in years against decades of clinical use.
ASAHI KASEI MEDICAL

Risk: Reimbursement Concentration Dependency

A technology position built around indications that essentially one health system reimburses broadly carries obvious concentration risk, since Japanese pricing revisions reduce reimbursement periodically and predictably. Expanding elsewhere requires health technology assessment in systems that fund apheresis narrowly. The strength and the exposure are the same fact viewed from two directions entirely.

Players Tracked

Prominent Players

Terumo BCT
Fresenius Kabi
Baxter
Asahi Kasei Medical
Haemonetics

Other Key Players

Kaneka Medix
B. Braun
Nikkiso
Therakos
Miltenyi Biotec
Cerus
Grifols
Octapharma
Toray Medical
Kawasumi Laboratories
Infomed
Medica SpA
Bellco
Aferetica
Diamed

Recent Developments

MARCH 2025

Cell therapy manufacturer audits hospital collection sites as suppliers

A cell therapy manufacturer began formal supplier auditing of hospital apheresis collection sites, a quality programme decision rather than any commercial transaction. Collection yield and documentation had proved variable enough to affect manufacturing success, and the sites involved had been established as clinical services rather than as production inputs.
Signal: Hospital apheresis units are being treated as suppliers now, which requires systems those units were never built to hold.
JULY 2025

Japanese pricing revision reduces reimbursement across apheresis columns

A Japanese pricing revision reduced reimbursement across selective apheresis column categories, a regulatory pricing decision rather than any corporate event. Japan accounts for roughly 24% of global consumption in this market, so the revision affects reported value considerably more than it affects the number of procedures performed.
Signal: Value in this market can fall while procedure volume rises, which makes revenue a poor measure of clinical activity.
NOVEMBER 2025

Apheresis society expands registry collection for lower category indications

An apheresis society expanded registry outcome collection covering indications carrying lower evidence category assignments, an academic and professional initiative rather than any commercial agreement. Payers have increasingly questioned whether graded recommendations built from case series justify continued funding of those procedures. Registries answer that directly.
Signal: Registry evidence is becoming a reimbursement defence, and no manufacturer is funding it at any meaningful scale.

What A Procedure Costs

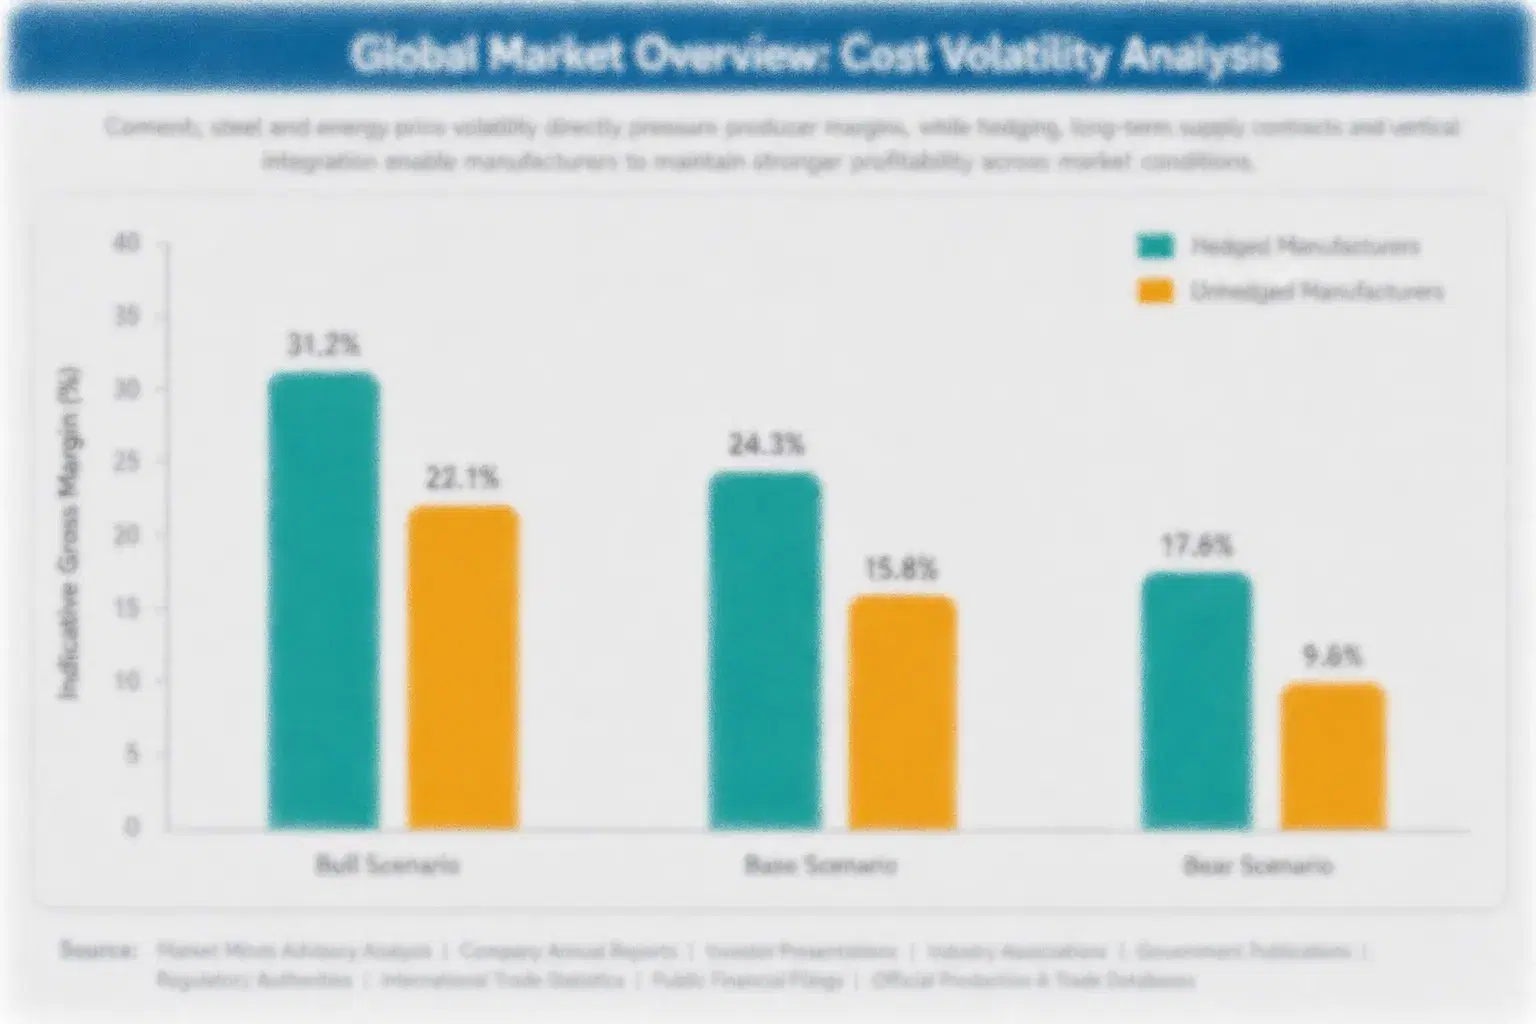
Disposables dominate and devices barely register. Single-use tubing sets, separation chambers, anticoagulant and, for selective modalities, the adsorption column together run 58 to 66% of procedure revenue, with columns the largest element wherever they are used. Device hardware is placed or sold at modest margin and recovered through consumable consumption across its life. Replacement fluid sits outside this market entirely and frequently exceeds everything in it per procedure.
The volatility that matters is medical polymer and sterile conversion. Specialised tubing polymer and separation chamber production moved sharply through 2021 and 2022 alongside broader polymer and energy pricing, and ethylene oxide sterilisation capacity tightened in several markets following facility restrictions. Terumo and Fresenius disclosures describe input and sterilisation cost pressure across that period. Suppliers with contracted sterilisation slots and polymer supply continued shipping. Others faced allocation that hospitals absorbed by deferring procedures.

Exposure divides by modality and manufacturing position. Conventional exchange set producers carry polymer and sterile conversion cost against pricing that hospitals negotiate annually. Column manufacturers carry adsorbent chemistry and considerably better margins protected by technology position. Suppliers whose devices are placed rather than sold carry capital on their own balance sheets and recover it only if consumable volume materialises.
therapeutic-apheresis-market-cost-volatility-analysis-1787689998446

Contract sterilisation capacity across disposable ranges

Ethylene oxide capacity tightened in several markets after facility restrictions, and suppliers relying on spot slots faced allocation that hospitals absorbed by deferring procedures. Contracted capacity costs commitment through quiet periods and prevents an outage in products used for time-critical treatment. A hospital that cannot obtain sets qualifies an alternative supplier and rarely returns afterward.

Model placement returns against customer staffing reality

Devices placed rather than sold recover capital only through consumable volume, and roughly three in ten apheresis posts sit unfilled at customer centres. A placement into an understaffed unit ties up capital against volume that never materialises. Assessing staffing before placing equipment is unglamorous diligence that several suppliers have learned to do only after writing off installed assets.

Separate column economics from disposable set pricing

Adsorption columns carry technology-protected margins while conventional exchange sets are negotiated annually against comparable competitors. Managing both inside one pricing conversation lets set pressure reach column pricing that faces no equivalent competition. Suppliers separating the two commercially preserve margin that a blended negotiation steadily erodes without anybody noticing it happen. Blended negotiation erodes it invisibly.

Portfolio Architecture for Margin Defence

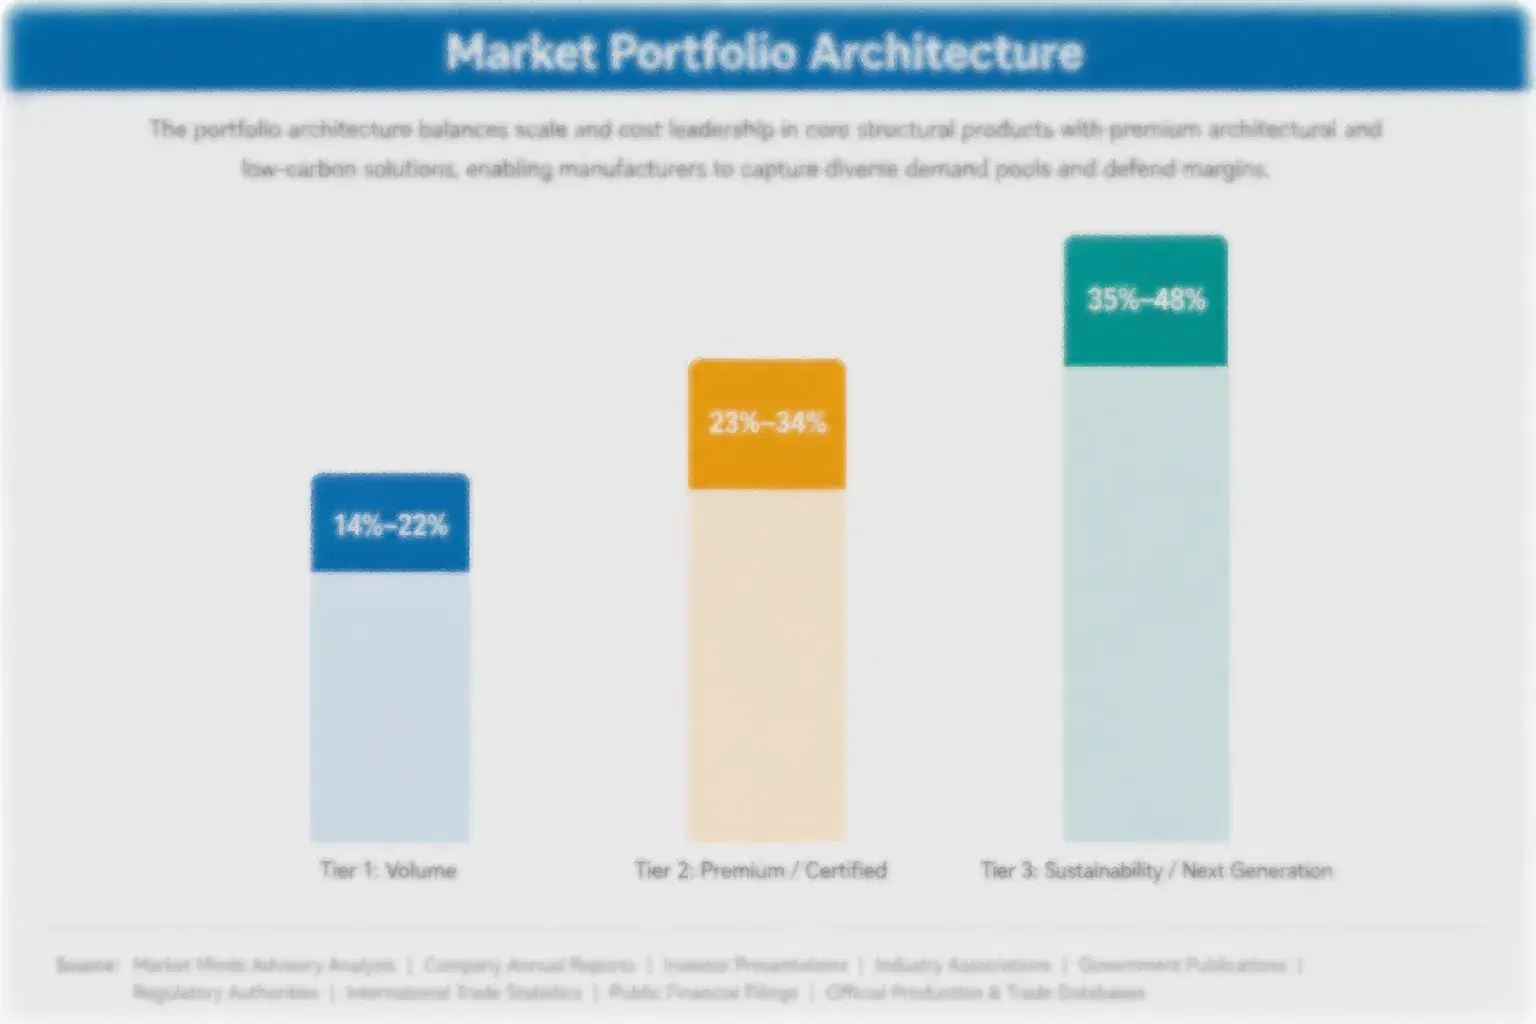
Margin follows technology protection rather than clinical importance. Conventional exchange sets are negotiated annually against comparable competitors and earn accordingly. Cell collection disposables earn better because manufacturer qualification limits switching. Photopheresis earns well on a closed system position. Adsorption columns earn most, protected by chemistry that Western competitors never developed because no health system outside Japan reimbursed the indications broadly enough to justify it.
The tension is that the protected position depends on one country's reimbursement decisions. Column technology exists because Japan funds selective apheresis widely, and Japanese pricing revisions reduce that reimbursement periodically and predictably. Expanding elsewhere means health technology assessment in systems that fund apheresis narrowly and assess new modalities sceptically. The strongest margin pool in this market is also the most geographically concentrated one.

High-value pools sit in three places. Adsorption columns wherever selective modalities gain reimbursement outside Japan. Cell collection disposables at centres qualified by therapy manufacturers, where switching requires requalification. And quality system provision to collection sites, which is not a product at all and makes a supplier part of the customer's compliance infrastructure. None of the three is where most suppliers have historically concentrated their commercial organisation or their development spending.

Volume / Commodity-Adjacent

Conventional plasma exchange disposable sets and standard tubing negotiated annually against comparable competitor products. The 7-point range separates suppliers with contracted sterilisation capacity and integrated polymer conversion from those exposed to spot allocation and external manufacturing entirely.
Gross Margin: 32-39%

Premium / Certified

Cell collection disposables, photopheresis consumables and closed system products where manufacturer qualification or system design limits substitution. The 7-point spread separates suppliers qualified by cell therapy manufacturers from those supplying general collection sets without that qualification.
Gross Margin: 45-52%

Sustainability / Regulatory / Next-Generation

Selective adsorption columns and collection quality system provision. The 26-point range is very wide because column chemistry commands technology-protected pricing in Japan while quality system services are sold at consulting rather than product economics elsewhere.
Gross Margin: 48-74%
therapeutic-apheresis-market-portfolio-architecture-1787689998723

High-value Sub-segments and Strategic Watch-out

Selective Adsorption Columns

Highest margin in the market, protected by chemistry Western competitors never developed because no system outside Japan reimbursed those indications broadly. The risk is concentration, since Japanese pricing revisions reduce reimbursement periodically and expansion requires assessment in sceptical health systems. Concentration is the exposure. Japan decides it.
Gross Margin: 71-74%

Qualified Cell Collection Disposables

Strong value with the fastest growth at 12.6%, protected because a cell therapy manufacturer qualifies a collection set and requalification is expensive and disruptive. The risk is that collection failures at roughly 7% attract manufacturer scrutiny that reaches the disposable supplier as well. Scrutiny reaches suppliers too.
Gross Margin: 49-52%

Conventional Exchange Sets

The volume core, negotiated annually against comparable competitors where clinical performance is broadly equivalent across suppliers. Manufacturers hold the line because these sets carry the installed device base through which columns and collection products reach the same centres afterward. Access is the actual value here.
Gross Margin: 33-36%

Weaker Category Dependent Volume

The strategic watch-out. Roughly 46% of procedure volume rests on lower graded society recommendations built from case series rather than randomised evidence. The risk is a payer review deciding graded recommendations no longer justify funding, which would remove volume no product improvement could recover. Nobody is funding evidence.
Gross Margin: 40-43%

Devices Placed, Disposables Consumed

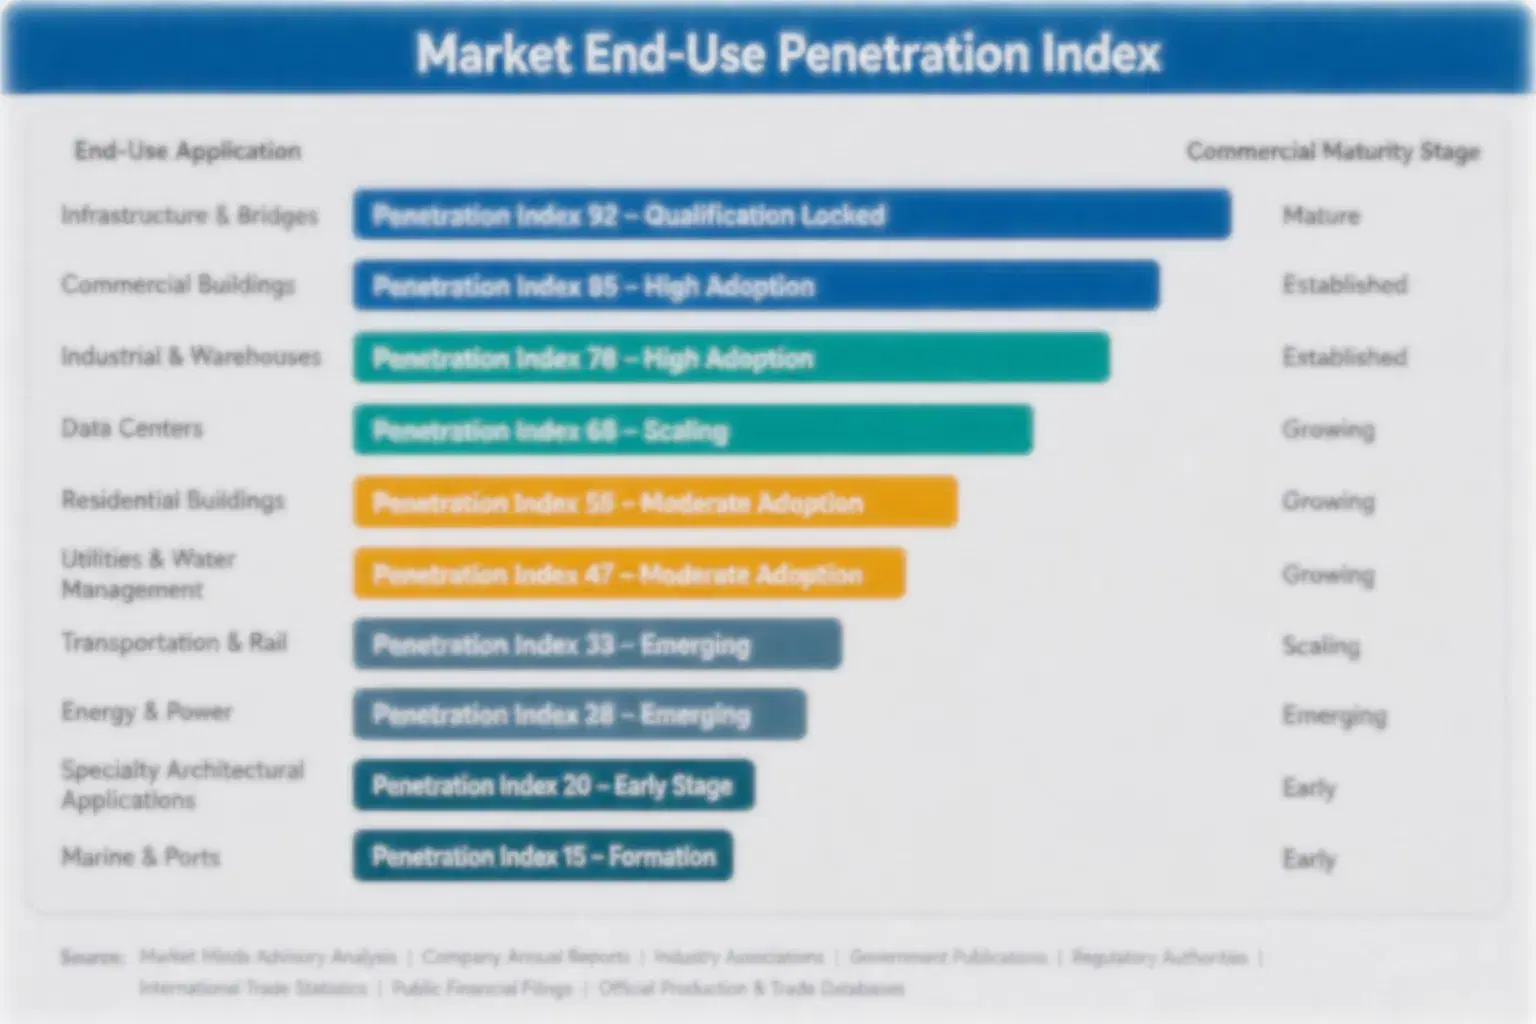
The economics run on consumables rather than hardware. A device is placed or sold at modest margin and every procedure performed on it consumes a disposable set costing several hundred dollars, which means revenue follows procedure volume at a centre for the equipment's whole life. An installed platform is therefore an annuity, which is why suppliers place devices at their own risk.
Stickiness is unusually strong and rests on people rather than contracts. Apheresis operators are scarce and specialised, and a centre will not retrain staff onto a different platform while it struggles to fill three in ten posts. Cell collection sets qualified by a therapy manufacturer are effectively fixed, since requalification is expensive and disruptive to a supply chain feeding patients. Conventional exchange sets move at annual negotiation where clinical performance is equivalent.

A new decision maker arrived recently and most suppliers have not adjusted. Cell therapy manufacturers now specify collection requirements directly to hospitals and audit those sites as suppliers, which means a pharmaceutical quality function influences choices that device companies previously settled with clinicians alone. Calling on unit managers misses a party deciding whether a centre gets used at all.
therapeutic-apheresis-market-end-use-penetration-index-1787689998991

What Changed And Who Noticed

These are among the four positions where our research anticipates prominent divergence between winners and laggards over the coming forecast period. Each is grounded in the demand model, the regulatory perimeter, and the announced capacity pipeline.
01 / COLLECTION QUALITY PROVISION

The apheresis room is now a supplier

Roughly 7% of cell therapy collections yield material insufficient for the manufacturing run that follows, and each failure means a patient waits weeks longer while their disease continues progressing. Collection centres established as clinical services hold neither the documentation, chain of identity nor process control that a manufacturer auditing a supplier expects to find. A device company supplying those systems alongside its hardware becomes part of the customer's quality infrastructure, which is considerably harder to displace than any device specification.
02 / OPERATOR TRAINING INVESTMENT

Devices in an unstaffed unit do nothing

Around three in ten apheresis centre posts are reported unfilled across surveyed institutions, which caps procedure volume regardless of how many devices a centre already owns or wants. Selling further hardware into an already understaffed unit achieves precisely nothing at all for either of the parties involved. Manufacturers that fund training programmes and simplify device operation expand the volume their existing installed base can actually deliver, and that remains the only genuine route to growth at an account already fully equipped.
03 / PROCEDURE ECONOMICS SELLING

Compare total cost, not consumable price

Immunoadsorption columns cost considerably more per procedure than a conventional exchange set, while the total cost including albumin or donor plasma frequently favours them because selective removal returns the patient's own plasma. Centres that compare consumable prices rather than full procedure economics reach the wrong conclusion with striking consistency. Building that calculation directly from a customer's own replacement fluid consumption converts a price objection into a cost argument, and growth at 10.4% already follows it wherever anybody bothers constructing it.
04 / EVIDENCE BASE PROTECTION

Half the volume rests on graded opinion

Roughly 46% of procedure volume is performed under lower graded society recommendations built from case series and clinical reasoning rather than from randomised data anybody could cite. Societies pursue registry building to address exactly that, and no manufacturer funds the work at any meaningful scale despite the exposure sitting squarely on their own installed volume. A supplier supporting outcome collection in the specific indications its own devices serve therefore protects a substantial share of its own market at genuinely modest cost.

Engagement Snapshot From the Field

A live engagement with an industry participant carrying material or product regulatory and market exposure ahead of a defining policy shift, showing how our research translates into a defensible multi-year portfolio strategy.
MARKET MINDS ADVISORY · CLIENT ENGAGEMENT SUMMARY
Therapeutic Apheresis Producer Strategic Portfolio Review and Transition Roadmap 2026·Investment Scenario on Therapeutic Apheresis Exposure Evaluation 2025-26
CLIENT PROFILE
An apheresis device manufacturer supplying platforms and disposable sets across 29 markets, with reported revenue of 196 million dollars (client-reported, unverified by MMA). Roughly 74% came from conventional plasma exchange disposables negotiated annually with hospital purchasing. The company had placed devices widely at its own capital risk and its commercial organisation called on apheresis unit managers and hospital procurement exclusively.
STRATEGIC CHALLENGE
Disposable revenue at several placed accounts had run well below the volume modelled at installation, and the company had lost two cell collection opportunities without understanding why. Management planned further device placements to grow volume. Nobody had examined whether placed devices were actually being used, or who decided cell collection site selection.
MMA APPROACH
MMA compared procedure volumes at placed accounts against staffing levels at those centres, which the company had never collected. Fourteen expert interviews with apheresis nurses, unit managers and cell therapy manufacturer quality staff established what governs both throughput and collection site selection. The analysis separated device availability from actual operating capacity, which management had treated as equivalent.
KEY FINDINGS
  1. Placed devices at underperforming accounts sat idle for substantial periods because those centres could not staff the operators required to run them at all.
  2. Both lost cell collection opportunities were decided by therapy manufacturer quality staff auditing the site, whom the company had never met or contacted.
  3. Collection documentation and chain of identity practice at client sites fell short of what auditing manufacturers expected, and no supplier was helping them close it.
  4. Funding operator training modelled greater disposable volume growth than further device placement would deliver (client-reported, unverified by MMA). Placement had been the assumed answer.
CLIENT PROFILE
An apheresis device manufacturer supplying platforms and disposable sets across 29 markets, with reported revenue of 196 million dollars (client-reported, unverified by MMA). Roughly 74% came from conventional plasma exchange disposables negotiated annually with hospital purchasing. The company had placed devices widely at its own capital risk and its commercial organisation called on apheresis unit managers and hospital procurement exclusively.
STRATEGIC CHALLENGE
Disposable revenue at several placed accounts had run well below the volume modelled at installation, and the company had lost two cell collection opportunities without understanding why. Management planned further device placements to grow volume. Nobody had examined whether placed devices were actually being used, or who decided cell collection site selection.
MMA APPROACH
MMA compared procedure volumes at placed accounts against staffing levels at those centres, which the company had never collected. Fourteen expert interviews with apheresis nurses, unit managers and cell therapy manufacturer quality staff established what governs both throughput and collection site selection. The analysis separated device availability from actual operating capacity, which management had treated as equivalent.
KEY FINDINGS
  1. Placed devices at underperforming accounts sat idle for substantial periods because those centres could not staff the operators required to run them at all.
  2. Both lost cell collection opportunities were decided by therapy manufacturer quality staff auditing the site, whom the company had never met or contacted.
  3. Collection documentation and chain of identity practice at client sites fell short of what auditing manufacturers expected, and no supplier was helping them close it.
  4. Funding operator training modelled greater disposable volume growth than further device placement would deliver (client-reported, unverified by MMA). Placement had been the assumed answer.
RECOMMENDED STRATEGY
Phase 1: Phase one: suspend further device placement and assess customer staffing before committing capital to any additional installed equipment anywhere. Idle assets earn nothing. Phase 2: Phase two: fund apheresis operator training at accounts where unfilled posts rather than device availability are constraining procedure volume. Hardware is not the constraint. Phase 3: Phase three: develop collection quality system support and engage cell therapy manufacturer quality functions, who decide which sites get used.
OUTCOME
Placement was suspended and staffing assessment introduced before any capital commitment. Training funded at six accounts produced disposable volume growth well above the placement programme it replaced (client-reported, unverified by MMA). Quality system support was developed and the company was subsequently qualified as a collection site partner by one cell therapy manufacturer.

Frequently Asked Questions

Foundational context covering the market sizes, CAGR, scope, country, region and competition that inform every finding below. This section is provided to cover basics and most often pre-purchase conversations, answered from the MMA Primary Research Dataset.

What is the current size of the Therapeutic Apheresis Market?

The market was worth 2.5 billion dollars in 2025, covering plasma exchange, lipoprotein apheresis, photopheresis, cell collection, red cell exchange and immunoadsorption. It reaches 2.71 billion dollars in 2026.

How large will the Therapeutic Apheresis Market be by 2036?

MMA forecasts 6.07 billion dollars by 2036, an increase of 3.36 billion dollars over the 2026 base. That represents an expansion multiple of 2.24 times across the forecast period.

What is the CAGR for the Therapeutic Apheresis Market 2026 to 2036?

The base case compounds at 8.4% annually. MMA's bull case reaches 9.6% if several cell therapies reach commercial volumes, while the bear case sits at 7.2% on narrowed reimbursement in weaker evidence categories.

Which segment is growing fastest?

Leukapheresis and cell collection, at 12.6%, half again the market rate of 8.4%. Every approved cell therapy begins with a collection, which turned a procedure into a manufacturing step.

Who are the major companies in the Therapeutic Apheresis Market?

Terumo BCT, Fresenius Kabi, Baxter, Asahi Kasei Medical and Haemonetics lead on disclosed apheresis and extracorporeal therapy revenue. Kaneka Medix, Nikkiso, Therakos and Miltenyi Biotec hold strong modality positions.

Which country is growing fastest?

India at 10.4%, driven by tertiary centres installing apheresis capability for indications previously referred abroad or left untreated. Japan remains by far the largest consuming market.

Report Segmentation Architecture

The full report scope spans multiple orthogonal segmentation dimensions, with cross-tabulated demand data provided for each dimension pair. Coverage extends further to regional breakdowns, trend trajectories, and the competitive detail needed to support segment-level decision-making.

By Therapeutic Modality

  • Therapeutic Plasma Exchange
  • Lipoprotein Apheresis
  • Extracorporeal Photopheresis
  • Leukapheresis and Cell Collection
  • Red Cell Exchange
  • Immunoadsorption and Selective Removal

By End-Use Industry

  • Hospital Apheresis Units
  • Academic Medical Centres
  • Blood Centre Collection Sites
  • Cell Therapy Treating Centres
  • Nephrology and Dialysis Services
  • Neurology Specialist Centres

By Commercial Dimension

  • Device Placement Agreement
  • Capital Equipment Purchase
  • Disposable Supply Contract
  • Manufacturer Qualified Collection
  • Public Tender Procurement
  • Reimbursement Listed Procedure

By Region

  • North America
  • Western Europe
  • East Asia
  • South Asia and Pacific
  • Latin America
  • Middle East and Africa
  • Eastern Europe

Scope, Methodology, and Coverage

Every figure in this report is reproducible from documented input assumptions. The scope below maps the historical period, the forecast horizon, the segmentation dimensions, and the countries covered, alongside the underlying primary and qualitative methodology.
Historical Period
2020 to 2025
Forecast Period
2026 to 2036
Base Year
2025 (USD billions; MMA Primary Research Dataset, August 2026)
Market Definition
Scope covers devices, single-use disposable sets, adsorption columns and consumables used to perform therapeutic apheresis, spanning therapeutic plasma exchange, lipoprotein apheresis for severe hypercholesterolaemia, extracorporeal photopheresis, leukapheresis and mononuclear cell collection including collection performed to supply cell therapy manufacturing, red cell exchange, and immunoadsorption and selective removal using adsorption columns. Replacement fluids including human albumin and donor plasma, cell therapy manufacturing steps after collection, haemodialysis and continuous renal replacement therapy, and blood donor collection performed to supply transfusion services are excluded. Apheresis nursing services and patient transport fall outside the boundary.
Quantitative Units
USD billions (current prices); procedures performed; disposable sets consumed; columns used; collection failure rate
Segmentation Dimensions
By Therapeutic Modality; By End-Use Industry; By Commercial Dimension; By Region
Regions Covered
North America, Western Europe, East Asia, South Asia and Pacific, Latin America, Middle East and Africa, Eastern Europe
Countries Covered
Japan, USA, Germany, China, South Korea, India, France, Italy, UK, Brazil, Canada, Australia, Turkey, Poland, Saudi Arabia
Key Companies Profiled
Terumo BCT, Fresenius Kabi, Baxter, Asahi Kasei Medical, Haemonetics, Kaneka Medix, B. Braun, Nikkiso, Therakos, Miltenyi Biotec, Cerus, Grifols, Octapharma, Toray Medical, Kawasumi Laboratories, Infomed, Medica SpA, Bellco, Aferetica, Diamed
Quantitative Methodology
Primary survey, n=3,800 respondents, Q4 2025, six countries; demand-side model with trade association cross-validation
Qualitative Methodology
47 expert interviews, Q4 2025; applied to validate demand model assumptions, identify emerging dynamics, and assess competitive positioning
Report Format
PDF and XLSX data workbook (Word format preview document)
Publisher
Market Minds Advisory
Report Code
MMA-2026-MED-156
Published
August 2026
Contact
sales@marketmindsadvisory.com | www.marketmindsadvisory.com

Purchase the full Therapeutic Apheresis Market Report (2026 to 2036).

The full report runs to 175 pages and covers all six therapeutic modality segments, seven regions and 20 profiled companies in detail. It includes the complete segment CAGR set, regional procedure volume and reimbursement coverage data, and collection quality requirement analysis across cell therapy manufacturing programmes. Company profiles carry evaluation on disclosed apheresis and extracorporeal therapy revenue, with moat and risk assessment for the top five suppliers. The competitive section extends to 15 tracked corporate and regulatory developments across 2024 and 2025, each with commercial interpretation. Primary research inputs include a quantitative survey of 3,800 respondents and 47 expert interviews conducted in Q4 2025.
Six therapeutic modality segments with individual CAGR forecasts
Seven regional markets with procedure volume and reimbursement data
Twenty company profiles on consistent revenue evaluation basis
Fifteen tracked corporate and regulatory developments with interpretation notes
Collection quality requirements mapped across cell therapy programmes
Evidence category exposure analysis by indication and national market

Built For The People Who Decide

From boardroom strategy to bench-side execution, this report is read cover-to-cover by leaders shaping the next decade of their industry, turning demand scenarios, market dynamics and valuation benchmarks into decisions.
CXOs/ Presidents/ VPs/ Managers
M&A and Corporate Development
Strategy Teams and R&D Heads
Procurement and Product Directors
Regulatory and Compliance Leaders
Investor Relations and Equity Analysts