Market Minds Advisory
Textile Recycling Market

Textile Recycling Market: Extended Producer Responsibility Rules Reshape Fiber Recovery Economics

Extended producer responsibility mandates and fast-fashion sustainability pressure keep textile recycling volume climbing across mandatory collection regions nationwide, forcing fiber recyclers to defend contamination-prone feedstock economics while chasing chemical recycling scale.

Lead Analyst

Bilal Shaikh

Published

September 2026

Make Smarter Decisions with Customized Research Insights

Request a free sample report and evaluate market opportunities, growth trends, and competitive dynamics relevant to your business needs.

2025 MARKET VALUE$6.2BMarket Size 2025
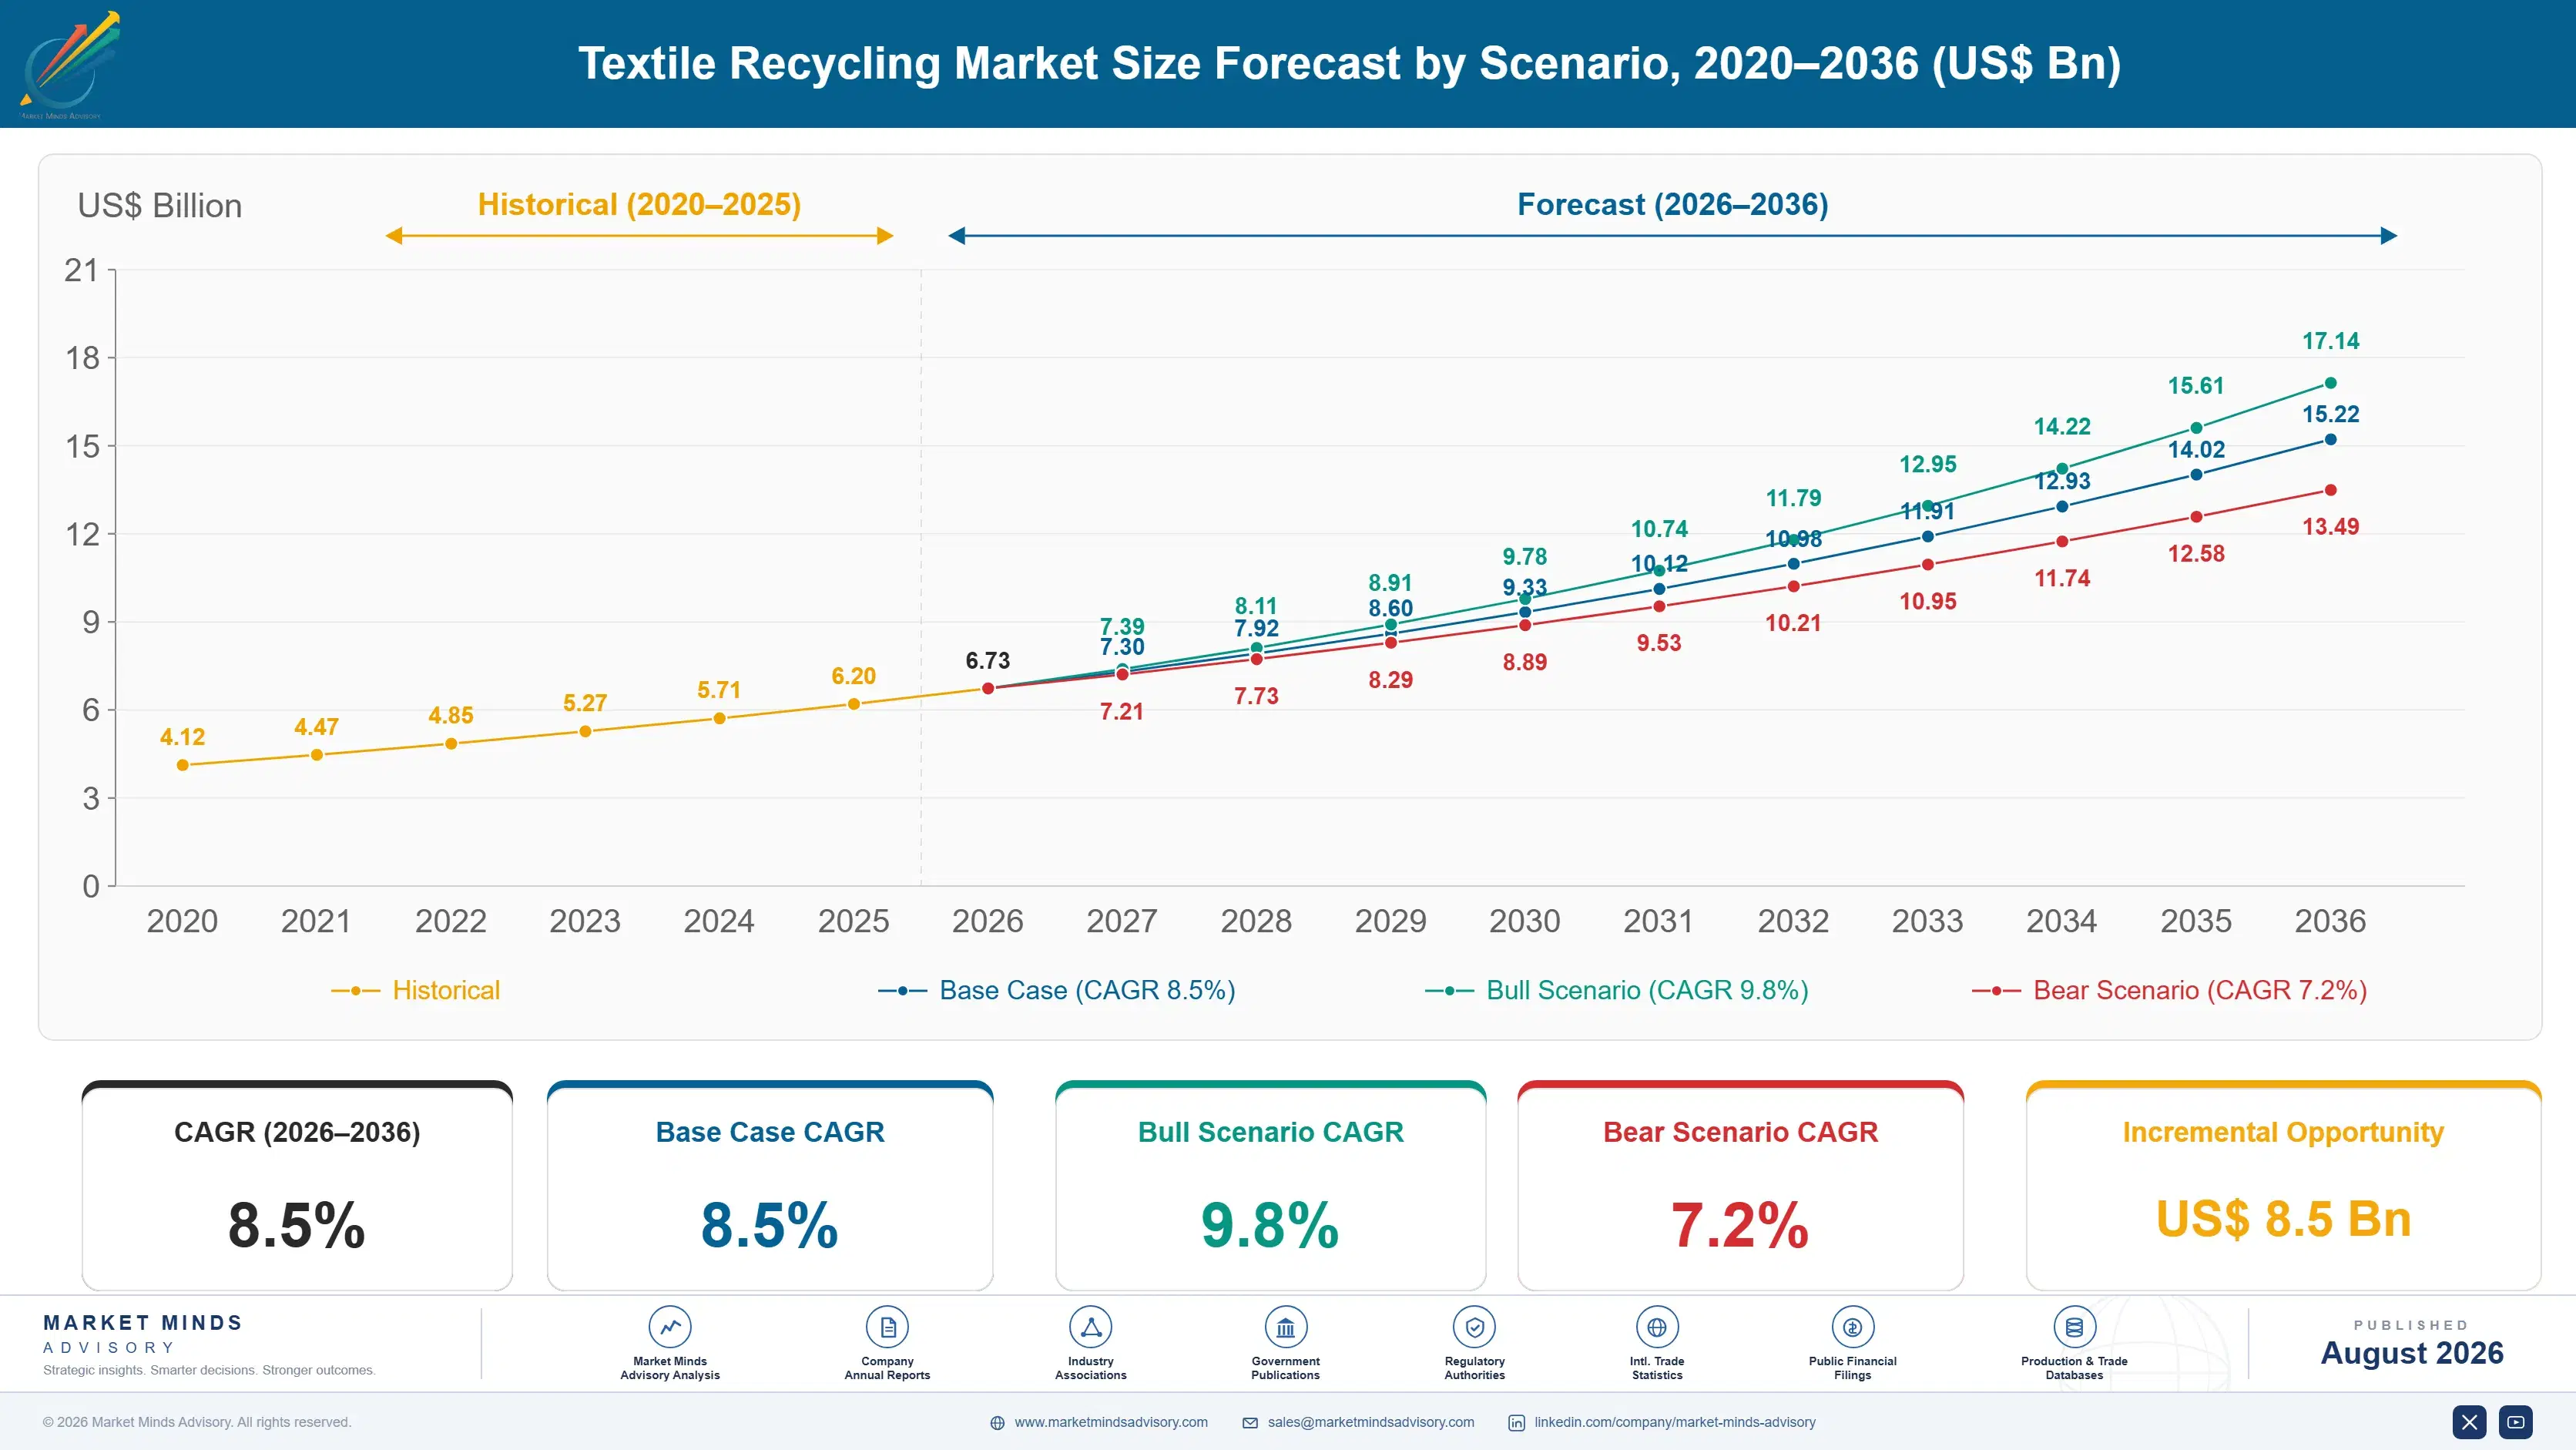
2036 FORECAST VALUE$15.2BBase Case , 2026 to 2036
CAGR 2026 TO 20368.5 %Bull 9.8% / Bear 7.2%
INCREMENTAL OPPORTUNITY$8.5BNet 10- year value creation
EXPANSION MULTIPLE2.26x2036 value over 2026 base
Strategic Levers
M&A Pipeline
Regional Outlook
Country Rankings
Competitive Intelligence
Segmental Deep-dive
Call-Us : 91 93563 13602

Executive Snapshot and Market Trajectory

Textile recycling demand is accelerating on extended producer responsibility mandates and fast-fashion sustainability pressure, pulling volume toward mechanical and increasingly chemical fiber recovery even as contamination and blended-fabric sorting challenges persist industry-wide. Volume growth stays strong across most tracked collection channels. That momentum continues broadly.
European Union member states leading extended producer responsibility implementation continue driving the fastest collection volume growth, while chemical fiber-to-fiber recycling technology investment is accelerating as mechanical recycling alone cannot process blended synthetic-natural fabric compositions that dominate fast-fashion output. Brand sustainability commitments and consumer resale platform growth provide a secondary demand pull, though genuine closed-loop fiber-to-fiber recycling at commercial scale remains limited to a handful of pioneering facilities. Purification technology investment remains a key differentiator.
The competitive field remains fragmented between traditional mechanical recyclers processing primarily post-industrial waste and a growing number of chemical recycling technology developers targeting post-consumer textile waste at commercial scale. Contamination rates and sorting infrastructure gaps remain the industry's most persistent operational challenge across nearly every recycling pathway. Buyers increasingly demand documented traceability and recycled content certification. Certification gaps are becoming a genuine competitive differentiator that will likely widen.
Market Definition
This market covers mechanical and chemical recycling of post-consumer and post-industrial textile waste into reusable fiber, yarn, or polymer feedstock. It excludes textile collection and sorting services sold as standalone offerings, finished recycled textile products, and textile reuse or resale without fiber processing.
Base Year Value
$6.2B in 2025 (MMA Primary Research Dataset, August 2026)
Forecast Period
2026 to 2036, eleven discrete annual values
CAGR
8.5% base case. Bull 9.8%. Bear 7.2%.
Fastest Growth Segment
Chemical Fiber-to-Fiber Recycling: 13.0% CAGR
Fastest Growth Country
France: 10.5% CAGR
Fastest Growth Region
South Asia and Pacific: 10.5% CAGR
Largest Region
Western Europe: 26% of 2025 global value
Market Leaders
[object Object]
Primary Survey
n=3,800 procurement and R&D decision-makers, Q4 2025, six countries
Methodology
Demand-side build-up, cross-validated against public data, 47 expert interviews

Textile Recycling Market Forecast Scenarios

textile-recycling-market-trends-size-forecast-scenario-1787639099429
Textile recycling demand grew steadily between 2020 and 2025 as early extended producer responsibility regulations took effect in France and brand sustainability commitments expanded, though commercial-scale chemical recycling technology remained largely at pilot stage throughout most of the period. Currency and trade policy shifts across major textile-producing regions added further planning complexity. Overall category momentum remained strong throughout this window.
The base case assumes continued extended producer responsibility rollout across additional European Union member states sustaining collection volume growth, accelerating chemical recycling technology commercialization as pilot facilities scale toward commercial capacity, and growing brand demand for recycled content to meet sustainability commitments and regulatory recycled-content mandates. Mechanical recycling should continue serving as the practical near-term solution for natural fiber and post-industrial waste streams while chemical recycling matures for blended synthetic fabrics.
A bull scenario hinges on faster chemical recycling technology commercialization enabling blended-fabric processing at meaningful scale, while the bear risk centers on contamination and sorting infrastructure gaps constraining feedstock quality faster than technology can adapt to process degraded material. Either outcome would meaningfully reshape which recyclers command premium feedstock contracts. Producers are watching both trajectories closely.

Fiber Recovery Economics and Contamination Cost Dynamics

Textile recycling economics hinge on feedstock quality more than processing technology, since contaminated or blended-fabric input material can render otherwise viable chemical recycling infrastructure commercially unworkable regardless of capital invested. Producers without documented sorting capability increasingly find themselves confined to the lowest-margin end of the category.
MARKET CONCENTRATIONCR5 32%Highly fragmented field across mechanical and chemical recyclers
AVERAGE SELLING PRICE$0.80-3.50/kgReflects wide spread between commodity and recycled fiber grades
TOP PRODUCING COUNTRY SHAREFrance 18%Reflects earliest regulatory mandate implementation and infrastructure investment
CAPACITY UTILIZATION58%Reflects early-stage chemical recycling capacity still ramping up
TRADE INTENSITY35%Substantial recycled fiber exported to textile manufacturers worldwide
FEEDSTOCK COST SHARE22% of COGSCollection and sorting labor inputs dominate total production cost
Regulatory divergence between regions is reshaping commercial strategy, with European producers investing heavily in collection and sorting infrastructure to meet extended producer responsibility mandates, while producers elsewhere continue relying primarily on voluntary brand take-back programs and resale platform partnerships. This divergence means recyclers increasingly specialize by regulatory environment rather than pursuing a single global commercial strategy. Several producers are pursuing dual regional strategies to serve both mandate-driven and voluntary customer segments simultaneously.
Feedstock costs remain dominated by collection and sorting labor rather than raw material acquisition, since post-consumer textile waste itself carries minimal or negative cost while labor-intensive sorting to remove contamination and separate fiber blends drives most processing expense. Producers with automated sorting technology defend margin more effectively than those relying entirely on manual sorting labor. Long-term collection contracts help smooth some of this labor cost volatility for larger, well-capitalized producers.
"Everyone talks about textile recycling like it is a technology problem. It is mostly a sorting problem. Chemical recycling breakthroughs mean nothing if the feedstock walking through the door is contaminated garbage."
Senior Analyst, Sustainable Materials and Circular Economy Practice · MMA Chemicals and Materials Practice · August 2026

Market Trends

Extended Producer Responsibility Mandates Expand Across Europe

France's pioneering extended producer responsibility scheme for textiles, requiring brands to fund collection and recycling infrastructure, is increasingly serving as a regulatory template other European Union member states are adopting or actively considering as the bloc moves toward mandatory separate textile waste collection across all member states. This regulatory expansion is fundamentally reshaping collection volume economics, since brands funding mandatory recycling infrastructure create predictable revenue streams for recyclers that voluntary take-back programs never provided at comparable scale. Several countries outside the European Union are studying similar frameworks for potential adoption.
Market Impact: Sustains 30 percent of demand
Chemical Recycling Technology Approaches Commercial Scale

Chemical fiber-to-fiber recycling technology developers are moving from pilot facilities toward commercial-scale production, finally addressing the blended synthetic-natural fabric compositions that mechanical recycling alone cannot effectively process into usable fiber. Several companies have announced first commercial-scale facilities targeting operational status within the next few years, representing a meaningful inflection point after years of pilot-stage development that struggled to attract the capital required for commercial scale-up. Major fashion brands are increasingly signing offtake agreements with these emerging chemical recyclers. These emerging offtake agreements are expected to become the industry standard financing mechanism within a few years.
Market Impact: Adds 6-9 percent volume growth

Market Opportunities and Growth Drivers

Fast-Fashion Sustainability Commitments Sustain Demand Growth

Major fast-fashion and apparel brands continue publicly committing to recycled content targets and circular economy initiatives, sustaining demand for recycled fiber regardless of underlying regulatory mandate timelines across different markets. These voluntary commitments increasingly convert into binding offtake agreements as brands seek to secure recycled content supply ahead of tightening regulatory requirements and consumer scrutiny over sustainability claims. Brands with credible circular economy programs increasingly use recycled content sourcing as a genuine competitive differentiator in marketing, reinforcing commercial pressure to secure reliable recycled fiber supply chains. That marketing advantage is expected to strengthen further as consumer awareness continues rising.
Market Impact: Affects 45 percent of feedstock

Resale Platform Growth Expands Collection Infrastructure

Rapidly growing secondhand resale platforms are building collection and sorting infrastructure originally designed for resale logistics that increasingly doubles as textile recycling feedstock collection capacity for items unsuitable for resale. This infrastructure overlap reduces the capital investment recyclers would otherwise need to build dedicated collection networks from scratch, accelerating feedstock availability for both mechanical and chemical recycling pathways. Several resale platforms have already announced direct partnerships with recycling companies to process unsellable inventory rather than sending it to landfill. This partnership model is expected to expand considerably across the wider resale industry.
Market Impact: Leaves 60 percent uncollected

Market Restraints and Challenges

Blended Fabric Contamination Limits Processing Efficiency

Modern textiles increasingly combine multiple fiber types, such as cotton-polyester blends, in a single garment, creating separation challenges that neither mechanical nor most current chemical recycling technology can fully resolve at commercial scale and reasonable cost. The root cause is that fast-fashion manufacturing prioritizes cost and performance over end-of-life recyclability, embedding fiber blends and non-textile components like zippers and elastic that complicate downstream processing considerably. Recyclers and technology developers are collaborating with brands on design-for-recycling guidelines, though changing garment design practices industry-wide takes considerably longer than deploying new recycling technology alone.
Market Impact: Covers 35 percent of volume

Collection Infrastructure Gaps Constrain Feedstock Supply

Many regions lack adequate textile collection infrastructure outside a handful of pioneering European markets, leaving substantial volumes of discarded textiles in general municipal waste streams rather than reaching recycling facilities capable of processing them into usable fiber. The root cause traces to historically low economic value of used textiles relative to other recyclable materials like metal or cardboard, discouraging municipal investment in dedicated collection infrastructure. Extended producer responsibility regulation is beginning to address this gap by mandating brand-funded collection systems, though rollout across additional regions remains gradual and uneven. Progress varies considerably by country.
Market Impact: Adds 40 percent chemical recycling capacity
3 additional market trends, 3 additional growth drivers, and 4 additional restraints and challenges are covered in the full report. Contact sales@marketmindsadvisory.com to access the complete intelligence.

Segment CAGR and Growth Architecture

Textile recycling is segmented by processing technology, spanning mechanical fiber recovery through chemical fiber-to-fiber processing, each serving distinct feedstock quality requirements and output applications across the recycled fiber value chain tracked in this report. Buyer selection typically balances feedstock quality against processing cost and available capacity across each pathway. Documentation depth varies by tier.
textile-recycling-market-trends-market-share-analysis-1787639099986

Chemical Fiber-to-Fiber Recycling

Chemical fiber-to-fiber recycling breaks down textile waste at the molecular level, separating blended fabric compositions into pure polymer or cellulose feedstock that can be respun into new fiber matching virgin material quality, addressing the blended-fabric limitation that mechanical recycling cannot overcome. This segment commands premium pricing given the specialized chemical processing infrastructure and technology licensing required, though production remains concentrated among a handful of technology developers moving from pilot to commercial scale. Demand growth here outpaces the broader category as fashion brands increasingly specify chemically recycled content to meet tightening regulatory recycled-content requirements. Several producers are expanding capacity ahead of confirmed offtake volume. Betting on continued regulatory momentum across the wider European Union.
CAGR 13.0%

Mechanical Fiber Recovery for Natural Fibers

Mechanical fiber recovery processes natural fiber textile waste, primarily cotton and wool, through shredding and carding into reusable fiber suitable for lower-grade applications such as insulation, industrial wiping cloths, and blended yarn spinning, representing the most mature and commercially established recycling pathway in the category. This segment benefits from decades of established processing infrastructure and relatively low capital requirements compared with chemical recycling alternatives. Growth here tracks steadily with overall collection volume expansion, driven primarily by extended producer responsibility mandate rollout rather than any distinct technology breakthrough. Producers serving this segment increasingly invest in improved sorting technology to reduce contamination and expand the range of natural fiber compositions they can accept for processing into higher-value applications.
CAGR 9.0%
Full segment breakdown across 5 segments available in the complete report.

Regional Architecture and Country Demand Map

Western Europe leads on extended producer responsibility regulatory maturity and collection infrastructure concentrated heavily in France today. South Asia and Pacific posts the fastest growth given rapidly expanding textile manufacturing waste streams and export capacity. East Asia follows closely on fiber processing manufacturing scale. Regional shares vary.

North America

The United States anchors regional demand through its large textile waste volume and growing brand sustainability commitments, though extended producer responsibility regulation remains far less developed than in Europe. Circ and other domestic chemical recycling developers maintain pilot and early commercial-scale facilities targeting post-consumer textile waste. Canada contributes steady demand tied to its own growing circular economy policy discussions. Voluntary brand take-back programs remain the primary collection mechanism here, given the absence of comprehensive mandatory collection regulation. Several major retailers have announced in-store collection programs specifically to feed recycled content into upcoming product lines ahead of anticipated state-level regulatory action. That trend is expected to accelerate over the next several years.
Share: 22% | CAGR: 9.0% (2026 to 2036)

Western Europe

France anchors this region through its pioneering extended producer responsibility scheme for textiles, the most mature regulatory framework globally, funding substantial collection and sorting infrastructure investment. Germany and the Netherlands contribute significant chemical recycling technology development, home to several leading pilot and early commercial-scale facilities. European Union-wide mandatory separate textile collection requirements are pushing additional member states to build comparable infrastructure. The region's regulatory leadership gives it a durable advantage in collection volume and policy-driven demand visibility. Several producers are pursuing dual mechanical and chemical recycling capability simultaneously to meet the region's increasingly demanding recycled-content documentation requirements. Consolidation among smaller regional producers is likely to continue. Overall demand trends remain firmly in place.
Share: 26% | CAGR: 7.5% (2026 to 2036)
Regional intelligence for 5 additional markets available in the complete report: East Asia, South Asia and Pacific, Latin America, Middle East and Africa, Eastern Europe. Contact sales@marketmindsadvisory.com.
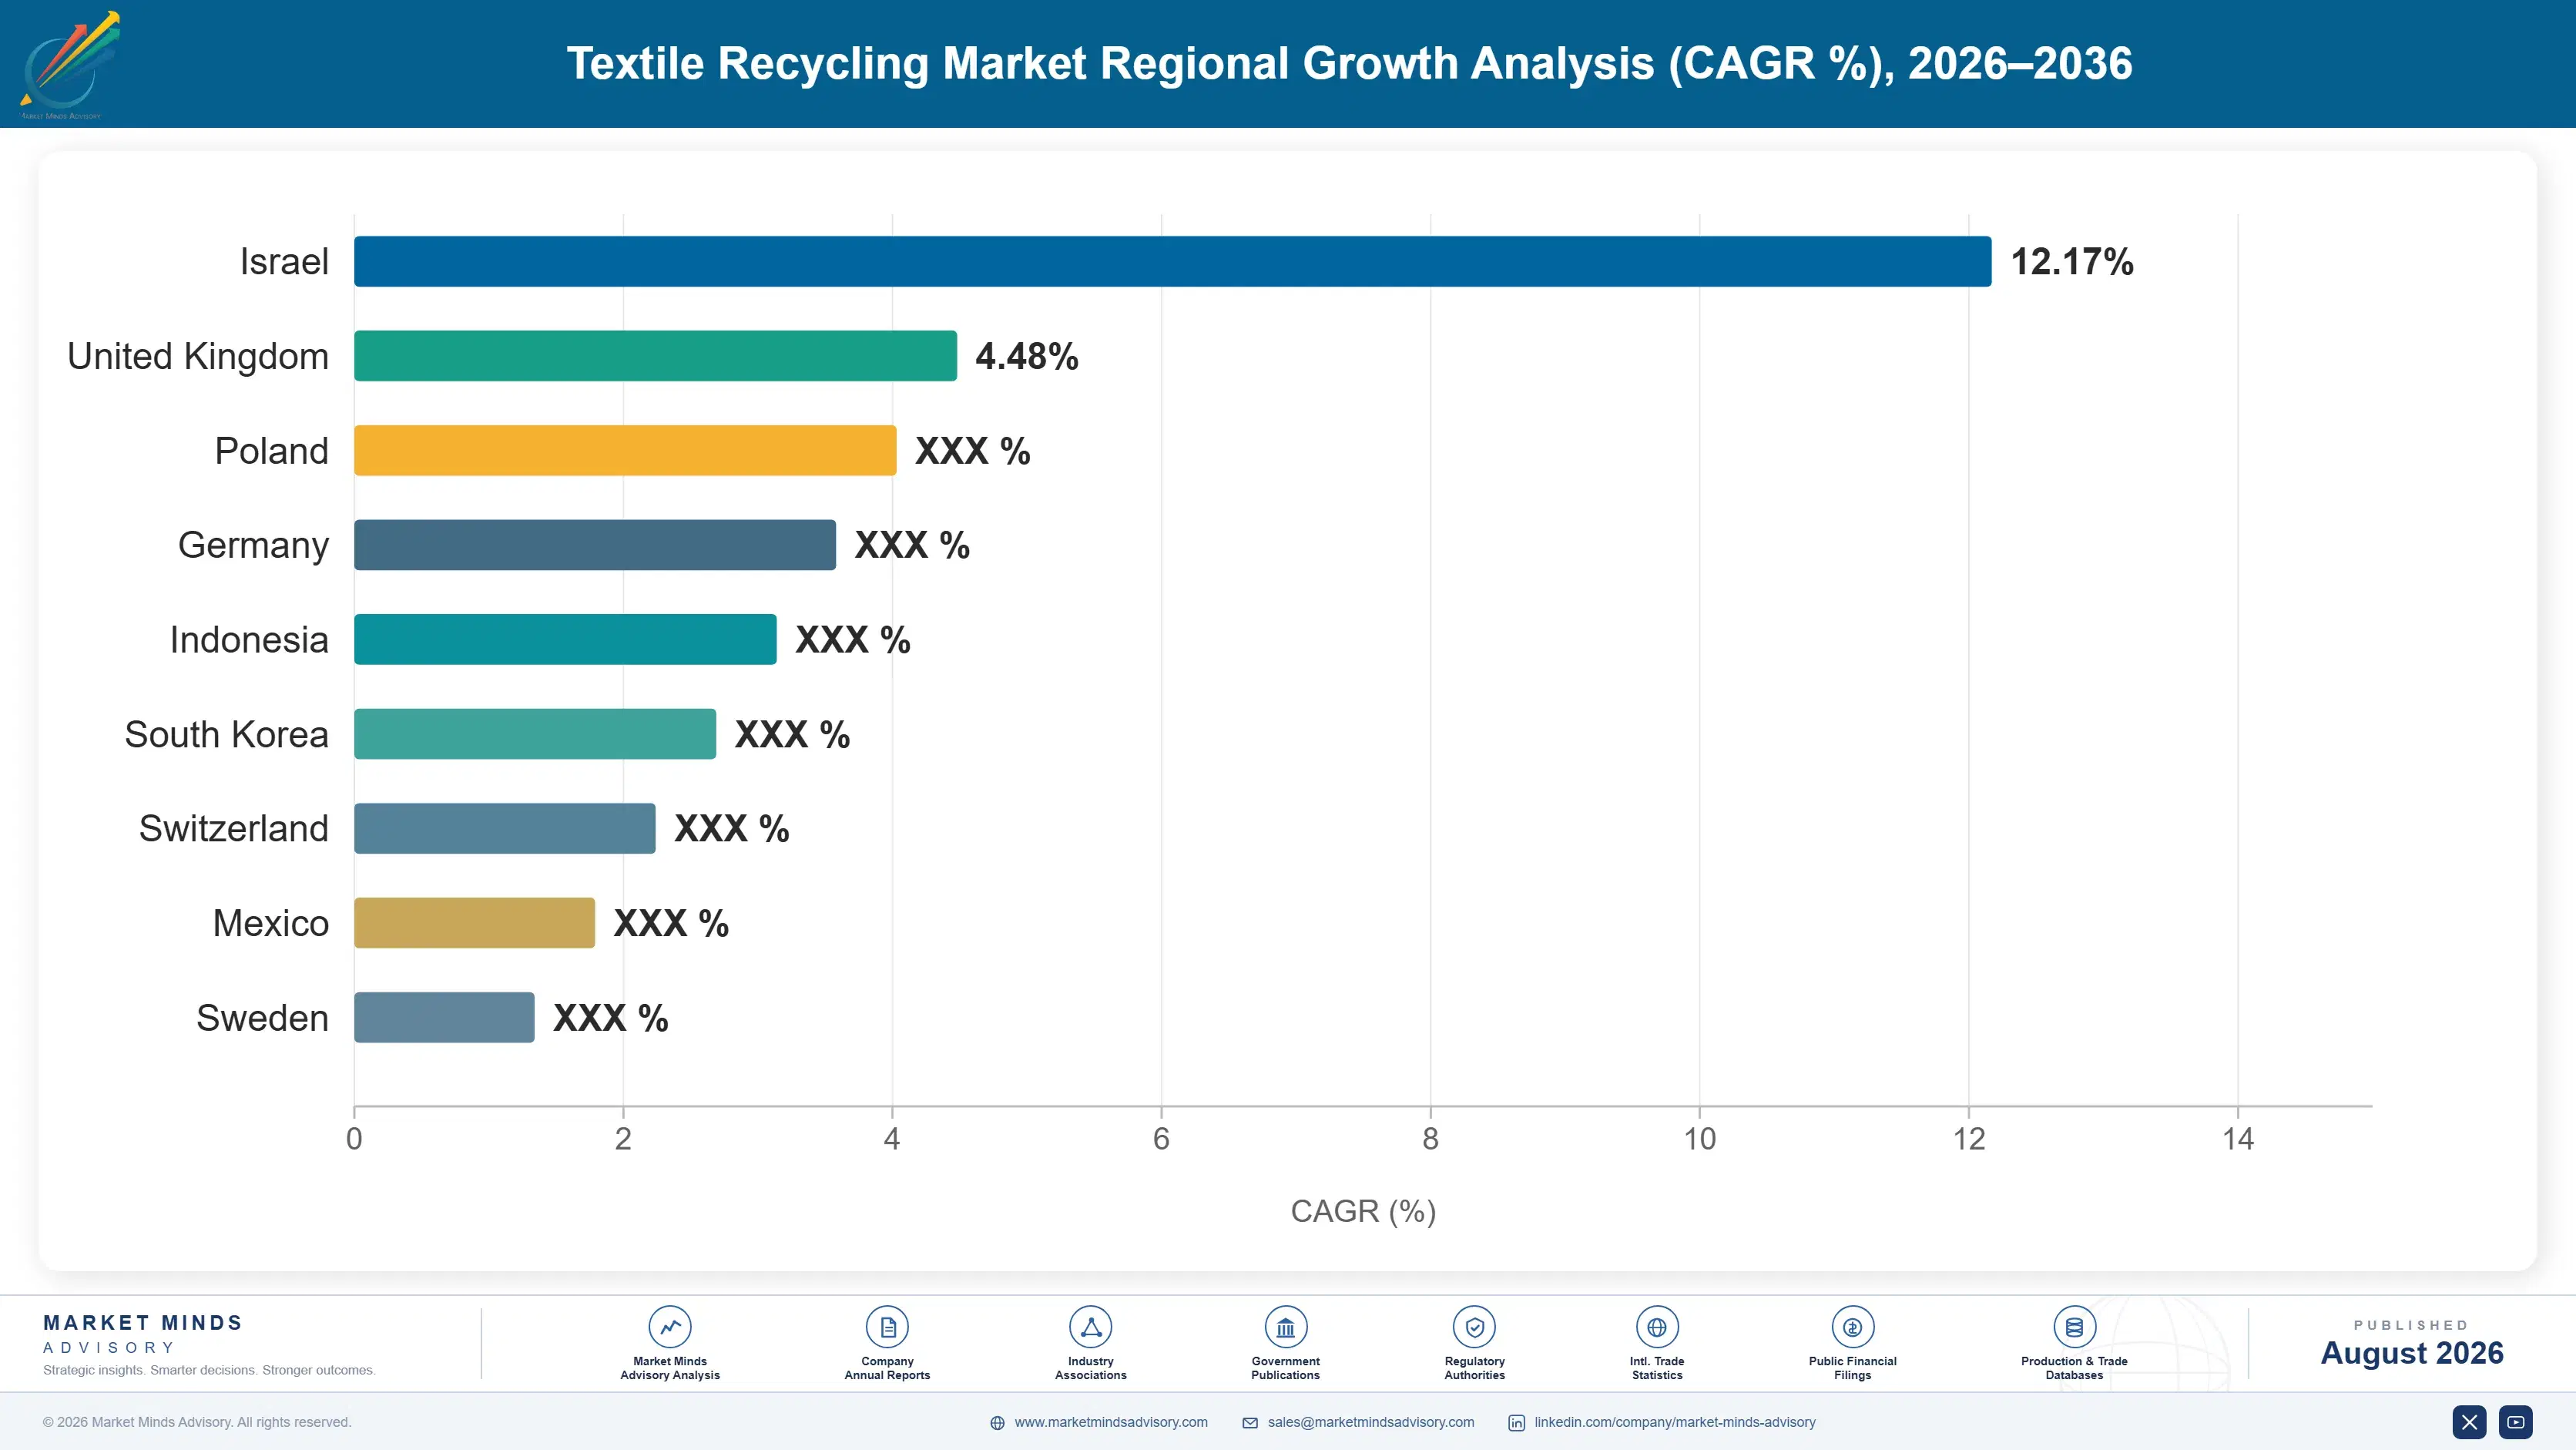
textile-recycling-market-trends-country-cagr-analysis-1787639100526

Chemical Recycling Scale and Brand Partnership Priorities

Producers building durable margin advantage in textile recycling are concentrating investment around four commercial levers: chemical recycling capacity scaling, sorting technology automation, brand offtake agreement development, and regional collection infrastructure investment, each addressing a distinct segment and margin profile. Distribution priorities vary considerably depending on whether a producer competes primarily in mandate-driven or voluntary demand markets.

Scale Chemical Recycling Capacity Ahead of Demand

Producers investing in commercial-scale chemical recycling capacity capture pricing well above mechanical recycling output, converting blended-fabric feedstock that would otherwise be landfilled into 3 to 5 times more revenue per ton processed into pure fiber-grade output. This capacity requires substantial upfront capital investment, but producers who commit early gain preferential positioning with brands increasingly qualifying suppliers well ahead of full regulatory recycled-content rollout. Several leading technology developers have already announced commercial facility expansions specifically to defend this margin advantage. Extraction and processing yield improvements of even 10 percent can meaningfully shift a producer's overall margin profile.
Market Impact: Adds 3 to 5 times revenue per ton processed

Automate Sorting Technology to Reduce Contamination

Producers investing in automated near-infrared sorting technology capture meaningfully cleaner feedstock than competitors relying on manual sorting labor, directly improving downstream processing yield and reducing contamination-related production losses by roughly 25 percent. This automation requires meaningful capital investment, but producers who commit early position themselves to serve the highest-value chemical recycling feedstock requirements that manual sorting cannot reliably meet. Several producers report automated sorting has become a genuine prerequisite for securing premium brand offtake contracts. Roughly 30 percent of premium brand buyers now require documented automated sorting before signing offtake agreements.
Market Impact: Reduces contamination-related processing losses by roughly 25 percent

Secure Brand Offtake Agreements Ahead of Mandates

Producers securing multi-year brand offtake agreements before regulatory recycled-content mandates take effect capture better pricing and more predictable volume commitments than those negotiating after mandates create urgent brand demand and compress producer negotiating leverage. This channel investment requires dedicated commercial relationship-building resources, but producers who establish these relationships early lock in supply agreements before competitors can access the same brand accounts. Roughly 40 percent of major apparel brands have already signed early offtake commitments. Early movers report meaningfully stronger negotiating position than latecomers facing urgent compliance deadlines. This advantage compounds meaningfully as mandate deadlines approach across the industry.
Market Impact: Captures 10 to 18 percent higher contract pricing

Build Regional Collection Infrastructure Early On

Producers investing directly in collection and sorting infrastructure across underserved regions capture feedstock other recyclers cannot access, while avoiding the transportation cost and logistics complexity that constrain competitors sourcing feedstock from distant collection networks. Local presence also builds brand trust with customers increasingly seeking supply chain transparency and traceability documentation. This lever requires substantial capital investment and multi-year infrastructure development timelines in most target regions. Roughly 20 percent of target-region brands already cite supply chain diversification as a stated sourcing priority. Local collection presence also shortens transportation timelines meaningfully for downstream processors.
Market Impact: Captures 15 to 20 percent regional feedstock share

Who Controls the Margin Pool

Textile recycling concentration sits at a low CR5 of 32 percent, reflecting genuine fragmentation between traditional mechanical recyclers with decades of operating history and a growing field of venture-backed chemical recycling technology developers still scaling from pilot to commercial capacity. The gap between technology developers with proven commercial-scale output and those still at pilot stage is widening as brand offtake agreements increasingly favor demonstrated production capability.
Current competitive activity centers on scaling chemical recycling capacity, automating sorting technology, and securing brand offtake agreements ahead of regulatory recycled-content mandates. Several mechanical recyclers are also pursuing partnerships or acquisitions of chemical recycling technology developers to capture more of the value chain, a move that smaller standalone technology developers generally cannot match given limited operating capital.

Emerging pressure is building from East Asian and South Asian producers scaling mechanical recycling capacity aggressively to capture export share amid rising global brand demand for recycled content. Rankings could shift meaningfully if an Asian producer secures a marquee Western brand chemical recycling partnership currently associated with an established European technology developer. European developers without a clear response strategy risk losing meaningful export volume over time.
textile-recycling-market-trends-company-positioning-matrix-1787639101057

Competitive Moat and Risk Dimensions

RENEWCELL

Moat: Chemical Recycling Technology Lead

Early commercial-scale chemical recycling technology deployment and established brand offtake relationships give this producer preferential positioning with fashion brands increasingly qualifying suppliers well ahead of full regulatory recycled-content rollout across major markets. That trust compounds with each successful commercial production milestone and renewed brand offtake agreement.
RENEWCELL

Risk: Commercial Scale-Up Risk

This producer's transition from pilot to full commercial-scale production carries meaningful execution risk, leaving less financial cushion than diversified competitors if scale-up timelines slip further than currently expected or brand offtake volume disappoints. Management has signaled openness to additional capital raises to address this execution risk.
LENZING AG

Moat: Integrated Fiber Manufacturing Scale

Substantial integrated fiber manufacturing capacity and established textile industry relationships give this producer a durable cost and distribution advantage over smaller standalone recycling technology developers lacking comparable manufacturing scale or customer relationships. That scale advantage has proven difficult for smaller international rivals to replicate at comparable production cost.
LENZING AG

Risk: Slower Innovation Adoption Pace

This producer's larger organizational scale and established manufacturing processes create meaningful lag in adopting emerging chemical recycling technology compared with nimbler venture-backed startups, a gap that could widen further if technology innovation accelerates faster than internal adoption cycles. Management has indicated plans to accelerate technology adoption through targeted acquisitions.

Players Tracked

Prominent Players

Worn Again Technologies
Renewcell
Circ
Lenzing AG
Infinited Fiber Company

Other Key Players

Ambercycle
Evrnu
Recover Textile Systems
Martex Fiber Southern Corp
Unifi Inc
Wieland Textiles
Södra Group
Aquafil S.p.A.
Prevented Ocean Plastic
I:CO GmbH
SOEX Group
Refashion
Reju SAS
Tex-Tech Industries
Green Story Inc

Recent Developments

SEPTEMBER 2025

Renewcell Expands Commercial-Scale Production Capacity

Renewcell announced expansion of its commercial-scale chemical recycling facility to meet growing brand offtake demand ahead of tightening European Union recycled-content requirements, adding capacity dedicated primarily to blended-fabric feedstock processing. The expansion represents the company's largest single capital investment in commercial production infrastructure to date.
Signal: Signals confidence in sustained brand demand growth ahead of continued regulatory mandate rollout. European regulatory trends support this continued positioning.
JANUARY 2025

Lenzing AG Announces Chemical Recycling Technology Partnership

Lenzing AG announced a technology partnership with a specialized chemical recycling developer to integrate recycled cellulose feedstock into its fiber manufacturing operations, reducing reliance on virgin wood pulp as its primary feedstock source. The partnership reflects growing recognition that recycled feedstock security matters as much as manufacturing scale itself.
Signal: Signals growing integrated fiber manufacturer interest in capturing more of the broader recycling value chain overall.
APRIL 2025

Circ Signs Multi-Year Brand Offtake Agreement

Circ signed a multi-year recycled fiber supply agreement with a major global apparel brand, securing recurring volume ahead of full commercial-scale production readiness as the brand works toward its recycled-content sustainability commitments. Financial terms were not disclosed, though the agreement reportedly spans multiple years of committed volume.
Signal: Signals accelerating brand confidence in emerging chemical recycling technology commercial viability. Rival technology developers are likely pursuing similar brand conversations.

Collection Labor and Sorting Technology Cost Pressure

Collection and sorting labor represents roughly 22 percent of finished recycled fiber cost of goods sold, with the balance split across processing energy, chemical inputs for chemical recycling pathways, and packaging costs. Most collection infrastructure remains labor-intensive across all regions, with automated sorting technology adoption still limited to a handful of well-capitalized producers investing ahead of broader industry adoption.
The 2022 to 2023 period saw notable labor cost inflation affecting collection and sorting operations across developed markets, directly compressing margins for recyclers dependent on manual sorting given the labor-intensive nature of contamination removal and fiber-type separation. Several producers reported labor cost increases exceeding 15 percent during the tightest months, according to company annual reports and industry labor market data covering the period. Costs have since stabilized but remain above pre-2022 levels.

Smaller recyclers without automated sorting technology face a genuine competitive disadvantage against larger producers who can invest in near-infrared sorting equipment and reduce dependence on manual labor. This exposure varies meaningfully by geography, with European producers generally securing better automation financing given deeper capital markets access, while smaller producers elsewhere often rely entirely on manual sorting given limited investment capital.
textile-recycling-market-trends-cost-volatility-analysis-1787639101355

Automated Sorting Technology Investment

Investing in near-infrared and other automated sorting technology reduces dependence on manual labor and improves feedstock purity consistency, though it requires substantial upfront capital investment that only larger, well-capitalized producers can typically justify pursuing at scale. Producers that automate early typically secure meaningfully better feedstock quality than manual-sorting competitors. Payback periods typically run three to five years.

Regional Collection Network Partnerships

Partnering with existing municipal or resale platform collection infrastructure reduces the capital investment recyclers would otherwise need to build dedicated collection networks from scratch, though it requires careful coordination and revenue-sharing arrangements with partner organizations. Several successful partnerships already demonstrate meaningfully improved feedstock volume for participating recyclers. Terms typically run three to five years.

Shared Regional Sorting Cost Consortiums

Smaller recyclers pooling investment in shared automated sorting facilities can access technology closer to that available to larger integrated producers, spreading fixed capital costs across multiple participants while improving each member's effective feedstock quality. Early participants also report improved feedstock consistency alongside better pricing terms. This approach particularly benefits smaller regional recyclers. Delivery reliability also improves.

Portfolio Architecture for Margin Defence

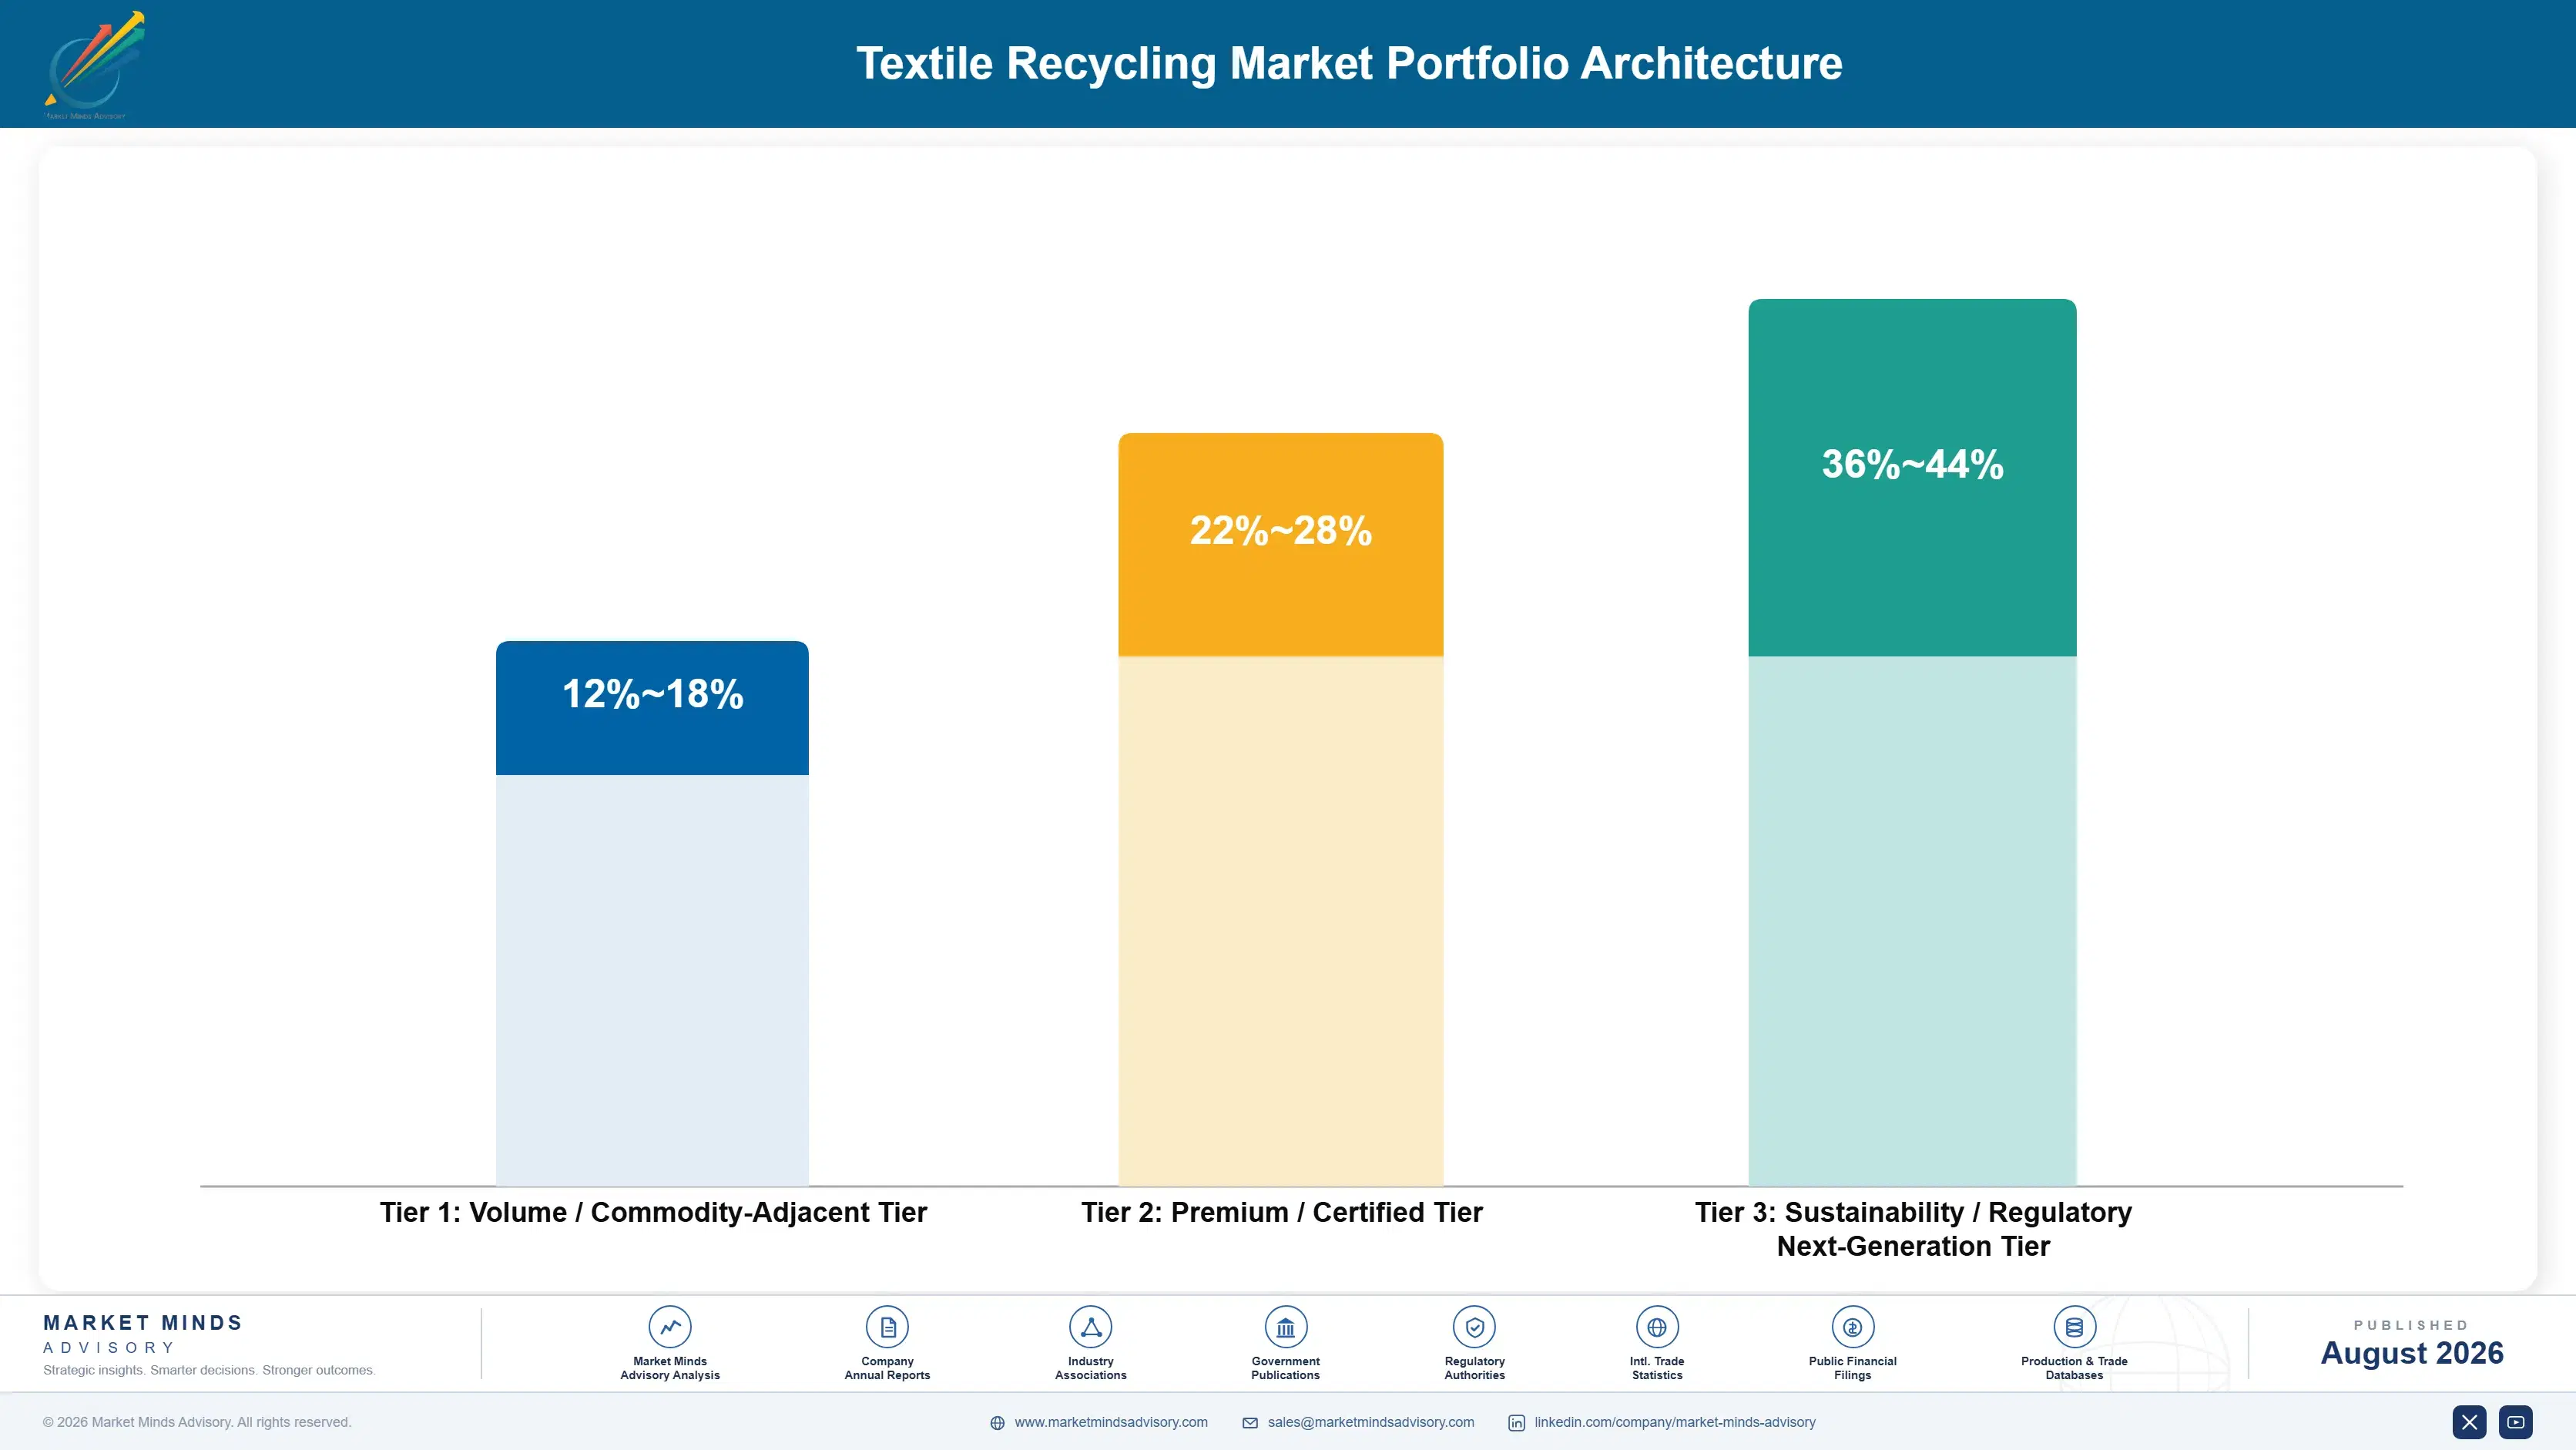
MMA's three-tier portfolio architecture separates low-grade mechanical downcycling from certified mechanical fiber recovery and next-generation chemical fiber-to-fiber recycling, with gross margins ranging from the low teens for downcycled output to well above 38 percent for chemically recycled fiber matching virgin quality. Producers positioned across multiple tiers capture more total margin than single-tier specialists. Segment-level margin data is drawn from MMA Estimate, derived from primary survey data covering 47 expert interviews.
The tension between volume and premium runs through the entire category: mechanical downcycling sustains high-volume low-value applications like insulation and wiping cloths at thin margins, while chemical fiber-to-fiber recycling sacrifices addressable volume for materially better unit economics among brands seeking virgin-quality recycled content. Mid-sized recyclers attempting to straddle both tiers often lack the technology capital to compete effectively on either end, losing price competitiveness in downcycling while falling short of chemical recycling quality benchmarks.

High-value margin pools concentrate in chemical recycling and certified mechanical fiber recovery, both commanding premiums the downcycling channel cannot match. Producers under-invested in chemical recycling capacity risk ceding the category's most profitable share to better-capitalized technology developers. Building dedicated chemical processing and certification capability requires patient capital and technical expertise, favoring larger, more established producers.

Volume / Commodity-Adjacent Tier

Mechanical downcycling into low-value applications such as insulation and industrial wiping cloths, competing primarily on price and volume rather than fiber quality or brand certification. Producers rely on volume scale to defend thin margins.
Gross Margin: 12-18%

Premium / Certified Tier

Certified mechanical fiber recovery producing documented recycled content for spinning and blended yarn applications, commanding a meaningful step-up in contract price over downcycled output. Buyers pay for documented traceability, not price alone.
Gross Margin: 22-28%

Sustainability / Regulatory / Next-Generation Tier

Chemical fiber-to-fiber recycling producing virgin-quality recycled fiber for premium brand applications, commanding the category's highest margins but requiring extensive processing infrastructure and certification investment. Only a handful of producers currently meet all requirements.
Gross Margin: 36-44%
textile-recycling-market-trends-portfolio-architecture-1787639102186

High-value Sub-segments and Strategic Watch-out

Chemical Fiber-to-Fiber Recycling

The highest-margin, fastest-growing pool in the category, driven by regulatory recycled-content mandates and brand offtake demand, though production remains concentrated among a handful of technology developers moving from pilot to commercial scale. Waitlists at leading technology developers already extend well past a year. Demand keeps rising steadily.
Gross Margin: 36-44%

Certified Mechanical Fiber Recovery

A high-value pool growing at a steady pace, driven by extended producer responsibility mandate rollout across additional markets, with margins holding above downcycling rates across most established regions tracked. Producers serving both channels manage genuinely distinct cost structures. Growth here outpaces the volume tier by a wide margin.
Gross Margin: 22-28%

Mechanical Downcycling for Low-Value Applications

The volume core of the category, carrying the thinnest margins but the largest absolute revenue base, funding many recyclers' investment into higher-margin certified and chemical recycling product lines over time. Most recyclers still depend on this tier for baseline cash flow. Volume alone rarely funds meaningful reinvestment.
Gross Margin: 12-16%

Recyclers Without Chemical Processing Capability

A strategic watch-out segment: recyclers dependent entirely on mechanical processing risk accelerated share loss as brands increasingly specify chemically recycled content, a gap several better-capitalized rivals are already closing through technology investment. Several are already pursuing partnership to close this capability gap. A handful already discuss acquisition.
Gross Margin: 14-18%

Regulatory Lock-In and Brand Contract Renewal

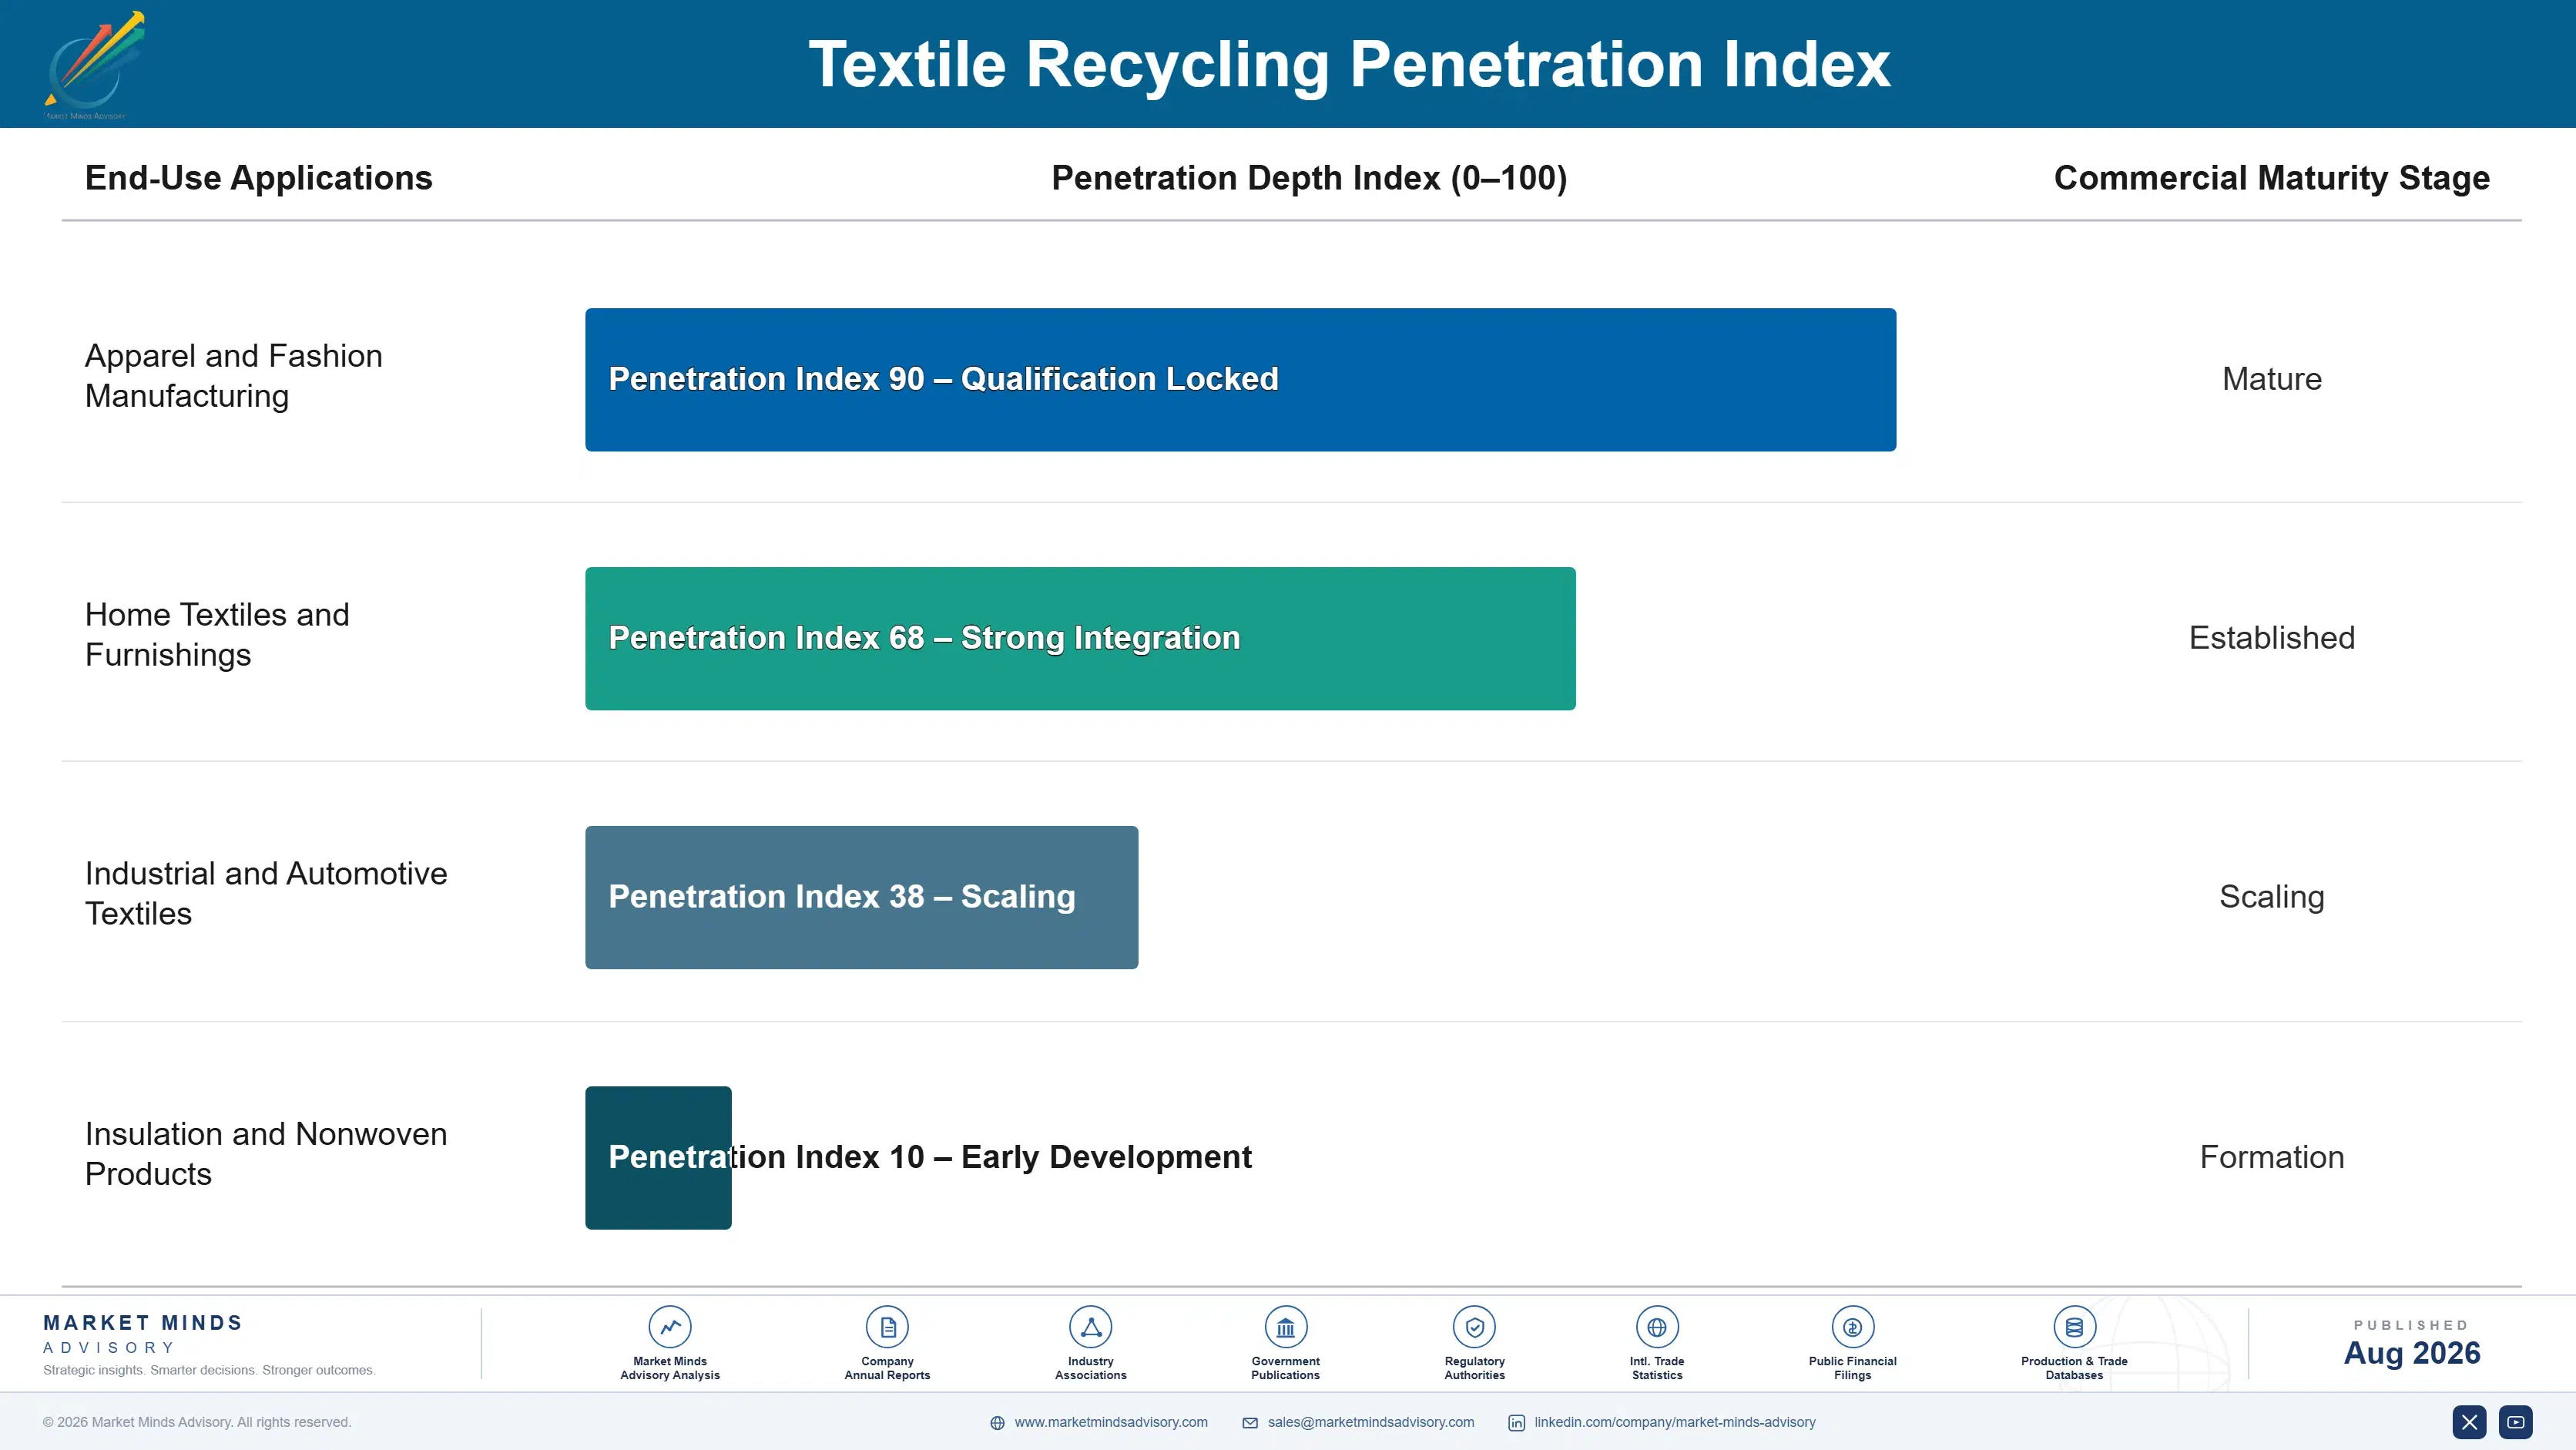
Textile recycling demand carries meaningful annuity characteristics once a recycler secures a brand offtake agreement or regulatory-mandated collection contract, since brands rarely switch recycling partners mid-contract given the sustainability reporting continuity and supply chain documentation already established with an incumbent. Extended producer responsibility mandates reinforce this stickiness further, since brand-funded collection systems typically operate under multi-year regulatory compliance frameworks rather than short-term commercial arrangements.
Adoption stickiness varies by end-use vertical. Brands under regulatory recycled-content mandates show the deepest stickiness once a recycler clears qualification, since switching risks disrupting compliance documentation. Voluntary sustainability commitment brands show moderate stickiness, balancing marketing value against price. Resale platforms and smaller brands show the least stickiness currently, still evaluating multiple recycling partners before committing to long-term relationships.

Buyer profiles are shifting generationally as sustainability credentials extend from voluntary marketing claims into binding regulatory requirements. Younger procurement teams inside brands increasingly treat documented recycled content traceability as a baseline qualification requirement rather than a differentiator, a shift that favors chemical recycling technology developers over traditional mechanical-only recyclers. Legacy procurement teams remain more conservative, still weighting cost above documented sustainability credentials in most purchasing decisions.
textile-recycling-market-trends-end-use-penetration-index-1787639102725

Where Textile Recyclers Should Focus Next

These are among the four positions where our research anticipates prominent divergence between winners and laggards over the coming forecast period. Each is grounded in the demand model, the regulatory perimeter, and the announced capacity pipeline.
01 / CHEMICAL RECYCLING INVESTMENT

Prioritize chemical recycling capacity ahead of mandate rollout

Producers that delay chemical recycling capacity investment genuinely risk missing the steepest phase of regulatory recycled-content demand, since brand qualification cycles already run twelve to eighteen months from initial engagement to signed offtake agreement across most major fashion brands. Early movers are already converting pilot success into commercial-scale contracts before capacity becomes the binding constraint industrywide and universally expected, an advantage that compounds meaningfully. Waiting until mandate demand fully materializes effectively means competing for capacity that faster-moving rivals have already secured well in advance.
02 / SORTING AUTOMATION PRIORITY

Automate sorting technology ahead of labor cost escalation

Producers without automated sorting technology remain genuinely exposed to the kind of labor cost volatility that compressed margins meaningfully in 2022 and 2023 across developed markets and their downstream processing operations nationwide, where timing genuinely matters. Investing in automation now measurably reduces that exposure while also improving feedstock quality relative to manual-sorting competitors still exposed to labor volatility. Producers that fully commit to this will enter the next tight labor cycle with a genuinely durable cost advantage over less-prepared competitors.
03 / BRAND PARTNERSHIP DEVELOPMENT

Secure brand offtake agreements ahead of mandate urgency

Brands facing approaching regulatory recycled-content deadlines increasingly scramble for qualified suppliers, genuinely favoring recyclers who secured relationships before urgency compressed brand negotiating patience across the wider apparel industry and its extended global supply chain partners. Early movers building these relationships now lock in supply agreements before competitors can access the same brand accounts, and that trust genuinely compounds over time. Continuing to wait for mandate-driven demand leaves producers considerably more exposed to being locked out of premium contracts than necessary.
04 / COLLECTION INFRASTRUCTURE FOCUS

Build collection infrastructure ahead of feedstock competition

Producers without dedicated collection infrastructure genuinely risk losing feedstock access as extended producer responsibility mandates spread and competition for reliable textile waste streams intensifies across every major market and its regional processing hubs nationwide. Early movers building collection networks now secure feedstock access before competitors can replicate comparable infrastructure at similar cost and speed, and that access genuinely compounds over time. Continuing to rely purely on third-party feedstock sourcing leaves producers considerably more exposed to supply volatility than genuinely necessary.

Engagement Snapshot From the Field

A live engagement with an industry participant carrying material or product regulatory and market exposure ahead of a defining policy shift, showing how our research translates into a defensible multi-year portfolio strategy.
MARKET MINDS ADVISORY · CLIENT ENGAGEMENT SUMMARY
Textile Recycling Producer Strategic Portfolio Review and Transition Roadmap 2026·Investment Scenario on Textile Recycling Exposure Evaluation 2025-26
CLIENT PROFILE
A mid-sized European apparel brand selling through both retail and e-commerce channels across Western Europe, with annual revenue in the mid hundreds of millions (client-reported, unverified by MMA). The brand had relied on virgin fiber sourcing for most product lines and faced approaching regulatory recycled-content requirements affecting its European market operations. The brand had never previously qualified a recycled fiber supplier.
STRATEGIC CHALLENGE
New European Union recycled-content requirements threatened compliance penalties affecting roughly twenty percent of the brand's European product revenue if documented recycled fiber sourcing was not established before the deadline (client-reported, unverified by MMA). Leadership needed to identify qualified recycling suppliers quickly while managing existing production schedules. The brand had never previously negotiated a recycled fiber supply contract at scale.
MMA APPROACH
MMA conducted a supplier landscape assessment across textile recycling technology providers, evaluating certification status, production capacity, and pricing structure in close detail. The engagement combined primary interviews with five candidate suppliers and secondary analysis of comparable brand compliance transitions to build a defensible, timeline-driven sourcing roadmap for leadership. Timeline pressure required a decision within roughly six weeks.
KEY FINDINGS
  1. Only three of seven candidate suppliers could meet the brand's strict documentation timeline without a costly, expedited certification fee being applied immediately.
  2. Recycled fiber pricing carried a twenty to thirty percent premium over the brand's existing virgin fiber sourcing costs and terms (client-reported, unverified by MMA).
  3. A phased dual-sourcing transition materially reduced supply continuity risk compared with an abrupt full-line conversion attempted earlier by a comparable peer brand.
  4. Compliance audit requirements extended qualification timelines by roughly four full extra weeks beyond the supplier's originally stated official final readiness deadline date.
CLIENT PROFILE
A mid-sized European apparel brand selling through both retail and e-commerce channels across Western Europe, with annual revenue in the mid hundreds of millions (client-reported, unverified by MMA). The brand had relied on virgin fiber sourcing for most product lines and faced approaching regulatory recycled-content requirements affecting its European market operations. The brand had never previously qualified a recycled fiber supplier.
STRATEGIC CHALLENGE
New European Union recycled-content requirements threatened compliance penalties affecting roughly twenty percent of the brand's European product revenue if documented recycled fiber sourcing was not established before the deadline (client-reported, unverified by MMA). Leadership needed to identify qualified recycling suppliers quickly while managing existing production schedules. The brand had never previously negotiated a recycled fiber supply contract at scale.
MMA APPROACH
MMA conducted a supplier landscape assessment across textile recycling technology providers, evaluating certification status, production capacity, and pricing structure in close detail. The engagement combined primary interviews with five candidate suppliers and secondary analysis of comparable brand compliance transitions to build a defensible, timeline-driven sourcing roadmap for leadership. Timeline pressure required a decision within roughly six weeks.
KEY FINDINGS
  1. Only three of seven candidate suppliers could meet the brand's strict documentation timeline without a costly, expedited certification fee being applied immediately.
  2. Recycled fiber pricing carried a twenty to thirty percent premium over the brand's existing virgin fiber sourcing costs and terms (client-reported, unverified by MMA).
  3. A phased dual-sourcing transition materially reduced supply continuity risk compared with an abrupt full-line conversion attempted earlier by a comparable peer brand.
  4. Compliance audit requirements extended qualification timelines by roughly four full extra weeks beyond the supplier's originally stated official final readiness deadline date.
RECOMMENDED STRATEGY
Phase 1: Phase one: qualify two recycled fiber suppliers in parallel to avoid single-source dependency risk during the entire compliance transition window. Phase 2: Phase two: negotiate volume-tiered pricing that steps down progressively as recycled fiber volume scales past the initial annual contract minimums. Phase 3: Phase three: extend the recycled sourcing framework to remaining product lines using this transition as a proven, reliable reference case.
OUTCOME
The brand completed recycled-content compliance documentation two weeks ahead of the regulatory deadline, avoiding penalties affecting a meaningful share of its European product revenue (client-reported, unverified by MMA). Dual-sourcing reduced the brand's supply concentration risk, and the sourcing framework was subsequently applied to two additional product categories within the following year.

Frequently Asked Questions

Foundational context covering the market sizes, CAGR, scope, country, region and competition that inform every finding below. This section is provided to cover basics and most often pre-purchase conversations, answered from the MMA Primary Research Dataset.

What is the current size of the Textile Recycling Market?

The global textile recycling market reached an estimated 6.2 billion dollars in 2025. Growth is being driven by extended producer responsibility mandates and brand sustainability commitments worldwide.

How large will the Textile Recycling Market be by 2036?

MMA projects the market will reach approximately 15.21 billion dollars by 2036. That represents more than a 2.26 times expansion from the 2026 forecast base value.

What is the CAGR for the Textile Recycling Market 2026 to 2036?

The market is projected to grow at an 8.5 percent compound annual rate over the forecast period. The bull case reaches 9.8 percent, while the bear case falls to 7.2 percent.

Which segment is growing fastest?

Chemical Fiber-to-Fiber Recycling leads at a 13.0 percent CAGR, roughly 1.53 times the overall market rate. Mechanical Fiber Recovery for Natural Fibers follows at 9.0 percent.

Who are the major companies in the Textile Recycling Market?

Leading producers include Worn Again Technologies, Renewcell, Circ, Lenzing AG, and Infinited Fiber Company. The top five hold an estimated 32 percent combined share on a production capacity basis.

Which country is growing fastest?

France leads at a 10.5 percent CAGR, driven by its pioneering extended producer responsibility scheme and mature collection infrastructure. Domestic recyclers continue scaling chemical processing capacity.

Report Segmentation Architecture

The full report scope spans multiple orthogonal segmentation dimensions, with cross-tabulated demand data provided for each dimension pair. Coverage extends further to regional breakdowns, trend trajectories, and the competitive detail needed to support segment-level decision-making.
  • Chemical Fiber-to-Fiber Recycling
  • Mechanical Fiber Recovery for Natural Fibers
  • Mechanical Recovery for Synthetic Fibers
  • Post-Industrial Textile Waste Recycling
  • Textile-to-Nonwoven Downcycling
  • Apparel and Fashion Manufacturing
  • Home Textiles and Furnishings
  • Industrial and Automotive Textiles
  • Insulation and Nonwoven Products
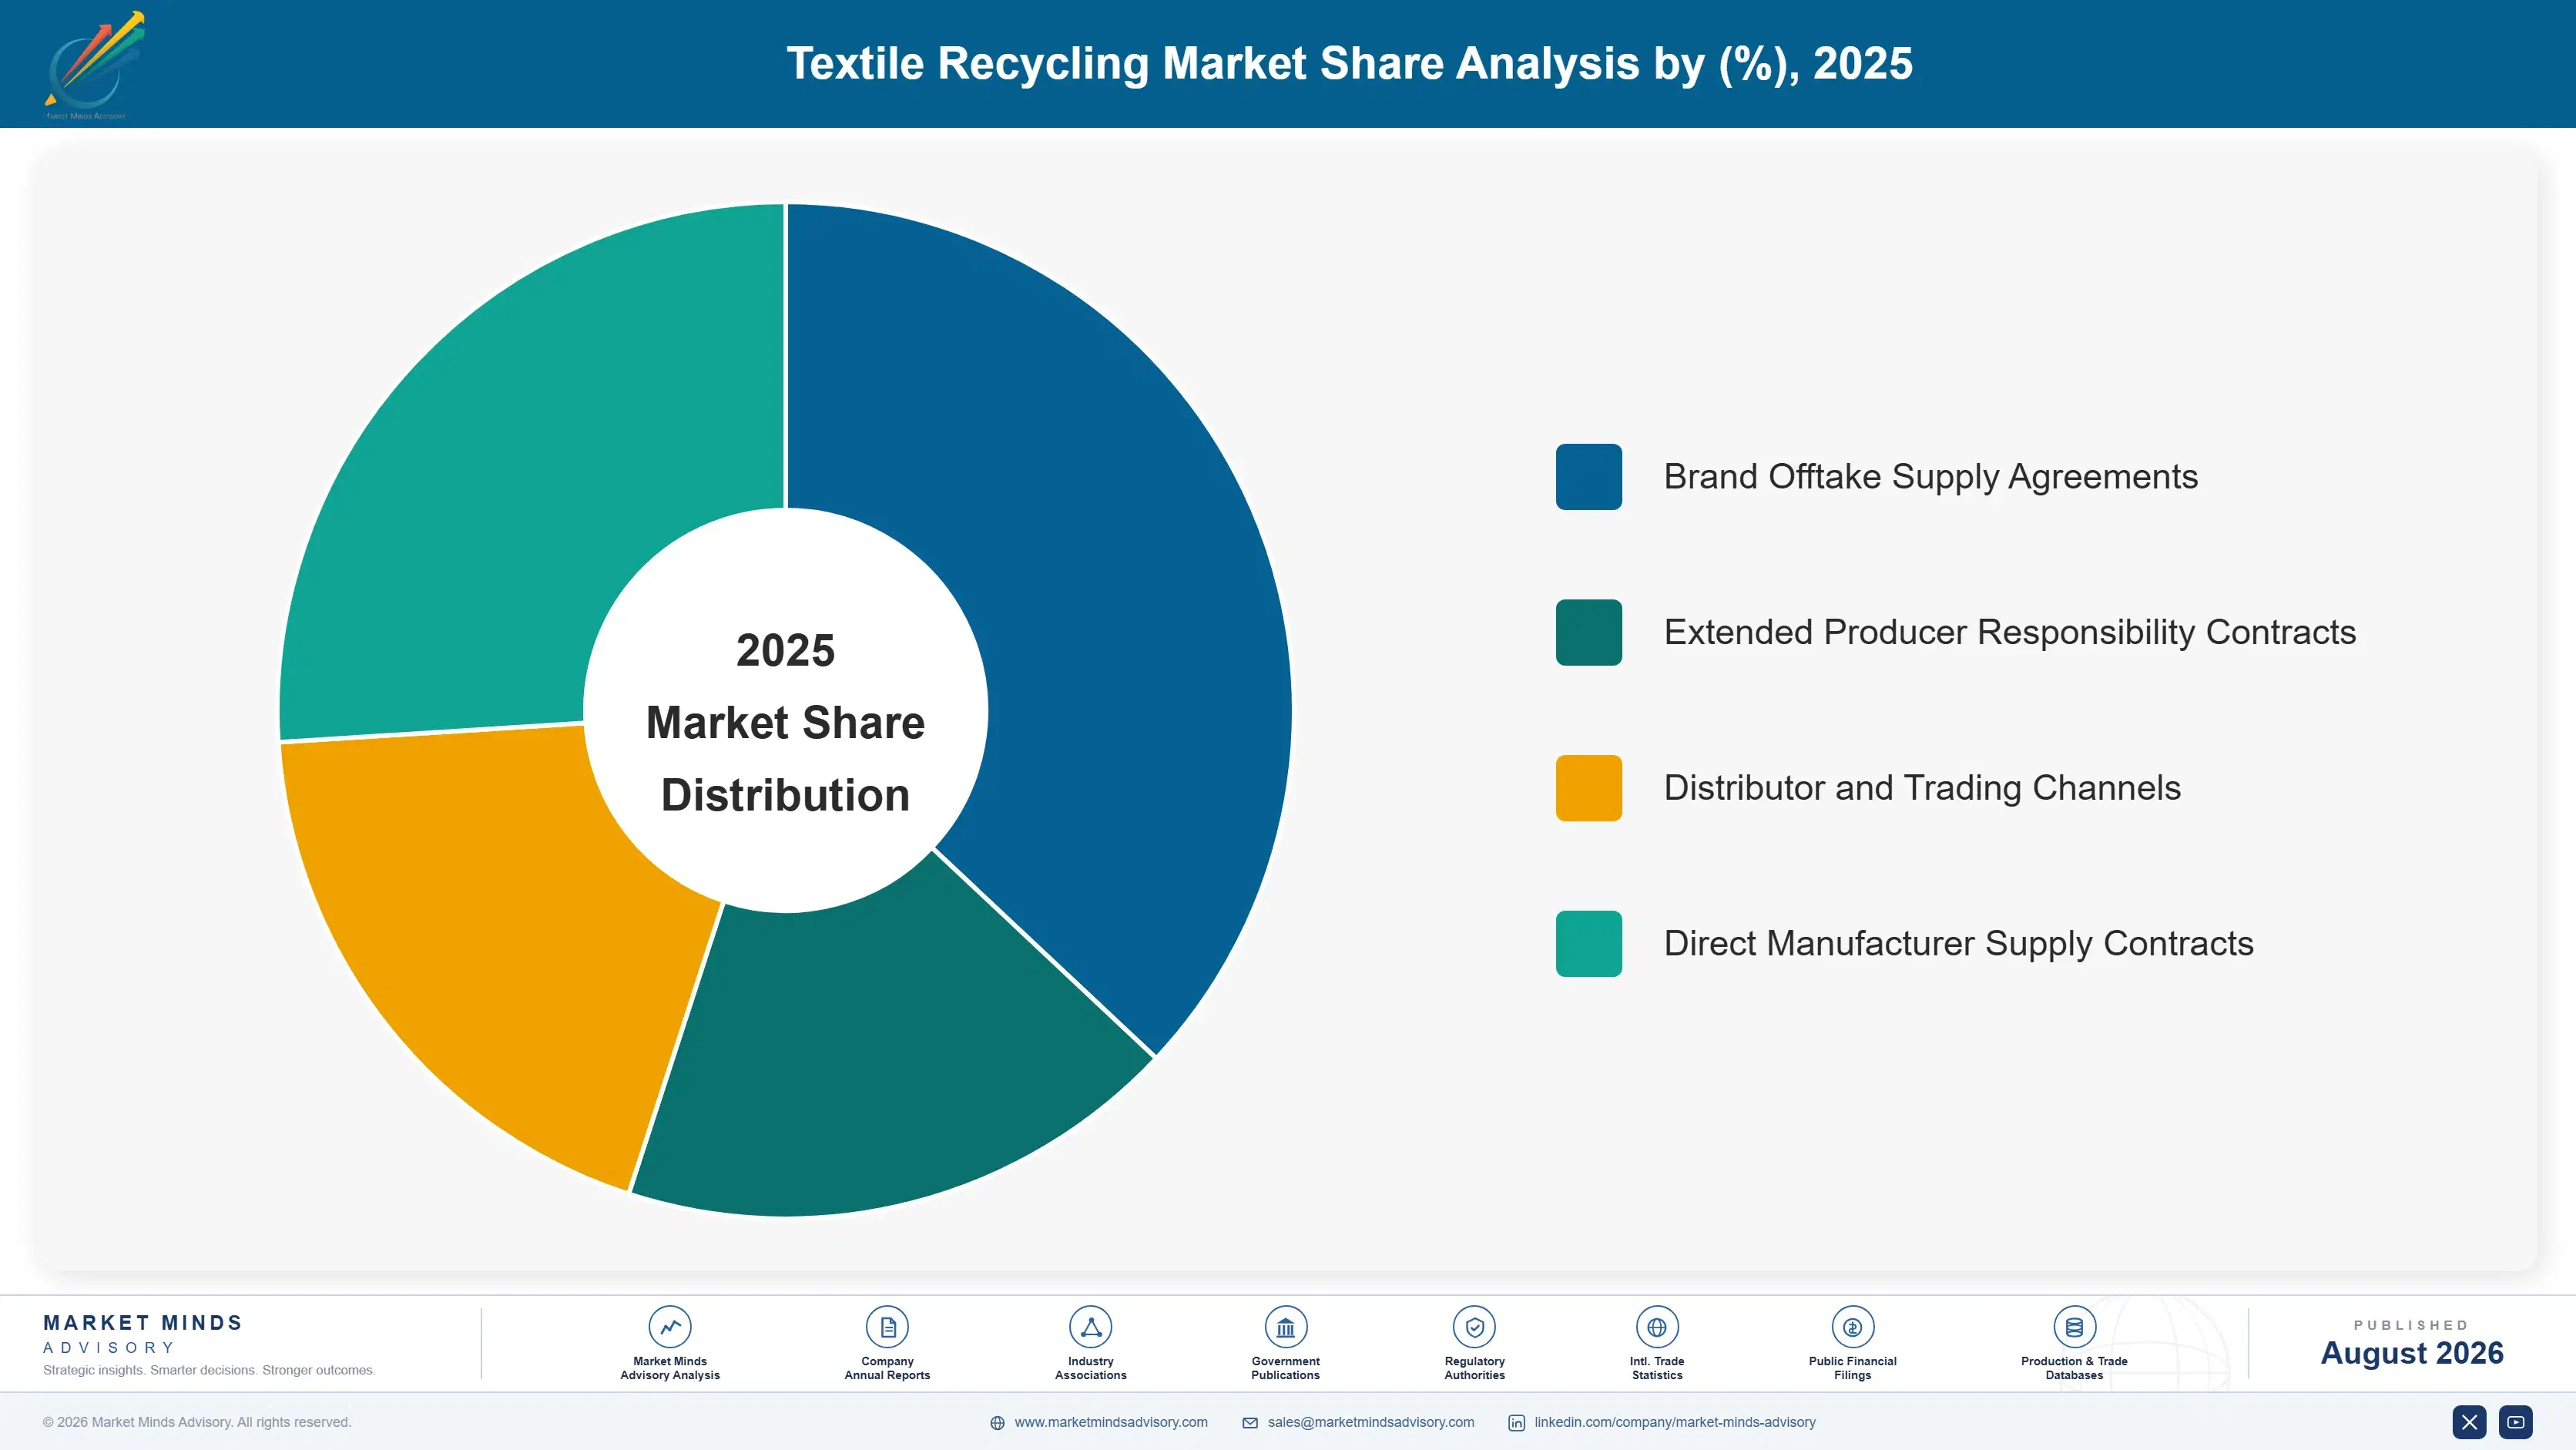
  • Brand Offtake Supply Agreements
  • Extended Producer Responsibility Contracts
  • Distributor and Trading Channels
  • Direct Manufacturer Supply Contracts

By Region

  • North America
  • Western Europe
  • East Asia
  • South Asia and Pacific
  • Latin America
  • Middle East and Africa
  • Eastern Europe

Scope, Methodology, and Coverage

Every figure in this report is reproducible from documented input assumptions. The scope below maps the historical period, the forecast horizon, the segmentation dimensions, and the countries covered, alongside the underlying primary and qualitative methodology.
Historical Period
2020 to 2025
Forecast Period
2026 to 2036
Base Year
2025 (USD billions; MMA Primary Research Dataset, August 2026)
Market Definition
This report covers mechanical and chemical recycling of post-consumer and post-industrial textile waste into reusable fiber, yarn, or polymer feedstock. It excludes textile collection and sorting services sold as standalone offerings, finished recycled textile products, and textile reuse or resale without fiber processing.
Quantitative Units
USD Billion, Volume in Metric Tons
Segmentation Dimensions
Processing Technology, End-Use Industry, Commercial Channel, Region
Regions Covered
North America, Western Europe, East Asia, South Asia and Pacific, Latin America, Middle East and Africa, Eastern Europe
Countries Covered
France, Germany, United Kingdom, United States, China, India, Japan, Sweden, Netherlands, Brazil
Key Companies Profiled
20
Quantitative Methodology
Primary survey, n=3,800 respondents, Q4 2025, six countries; demand-side model with trade association cross-validation
Qualitative Methodology
47 expert interviews, Q4 2025; applied to validate demand model assumptions, identify emerging dynamics, and assess competitive positioning
Report Format
PDF and XLSX data workbook (Word format preview document)
Publisher
Market Minds Advisory
Report Code
MMA-2026-CHM-130
Published
August 2026
Contact
sales@marketmindsadvisory.com | www.marketmindsadvisory.com

Purchase the full Textile Recycling Market Report (2026 to 2036).

This full report delivers comprehensive market sizing, segmentation, and competitive analysis for the global textile recycling market through 2036. Coverage spans mechanical and chemical recycling pathways across apparel, home textile, and industrial applications worldwide. It includes detailed profiles of the twenty leading recyclers plus region-by-region demand forecasts across all seven tracked regions. Pricing trend analysis is tied directly to collection labor and processing cost movements. Subscribers also receive full access to the underlying primary survey dataset and complete expert interview transcripts referenced throughout this analysis.
Twenty detailed recycler competitive profiles and rankings
Seven-region demand and pricing forecasts through 2036
Collection and sorting cost trend and volatility analysis
Segment-level growth rate breakdowns by processing technology
Primary survey dataset access included with subscription
Quarterly market update subscription option available

Built For The People Who Decide

From boardroom strategy to bench-side execution, this report is read cover-to-cover by leaders shaping the next decade of their industry, turning demand scenarios, market dynamics and valuation benchmarks into decisions.
CXOs/ Presidents/ VPs/ Managers
M&A and Corporate Development
Strategy Teams and R&D Heads
Procurement and Product Directors
Regulatory and Compliance Leaders
Investor Relations and Equity Analysts