Market Minds Advisory
Test and Measurement Sensors Market

Test and Measurement Sensors Market: Test and Measurement Sensors Market. Semiconductor and 5G Test Complexity Reshapes Sensor Demand

Semiconductor manufacturers facing shrinking process nodes and telecom operators deploying next-generation networks are colliding as test engineers demand sensors precise enough to validate designs that older instrumentation genuinely cannot measure.

Lead Analyst

Published

September 2026

Make Smarter Decisions with Customized Research Insights

Request a free sample report and evaluate market opportunities, growth trends, and competitive dynamics relevant to your business needs.

2025 MARKET VALUE$8.9BMarket Size 2025
2036 FORECAST VALUE$19.7BBase Case , 2026 to 2036
CAGR 2026 TO 20367.5 %Bull 8.8% / Bear 6.2%
INCREMENTAL OPPORTUNITY$10.2BNet 10- year value creation
EXPANSION MULTIPLE2.06x2036 value over 2026 base
Strategic Levers
M&A Pipeline
Regional Outlook
Country Rankings
Competitive Intelligence
Segmental Deep-dive
Call-Us : 91 93563 13602

Executive Snapshot and Market Trajectory.

Semiconductor process nodes shrinking below advanced thresholds and telecom operators rolling out next-generation network infrastructure are forcing test engineers to adopt sensors precise enough to validate designs that older instrumentation genuinely cannot measure reliably at required tolerances across most active fabs and calibration laboratories worldwide today.
RF and electromagnetic sensors are scaling fastest, as next-generation wireless infrastructure and expanding radar and satellite communication programs demand measurement precision at frequencies most legacy sensors were never designed to capture accurately across increasingly congested spectrum bands used worldwide today by operators. Optical and photonic sensors are close behind, driven by expanding silicon photonics research and quantum computing test requirements pushing measurement precision toward entirely new physical limits few instrumentation makers can satisfy reliably.
Established test equipment giants, specialized sensor manufacturers, and semiconductor test equipment makers all compete for engineering budgets, with vertically integrated giants increasingly bundling proprietary sensor technology directly into complete test systems rather than selling sensors as standalone components separately. Independent sensor specialists are responding by building deeper accuracy and calibration differentiation that bundled offerings genuinely cannot match today across most standard test workflows and calibration cycles.
Market Definition
This report covers precision sensors used in electronic test and measurement instrumentation, including temperature, pressure, vibration, RF, optical, and current sensing components integrated into benchtop and automated test equipment, measured on a global vendor revenue basis. It excludes finished test equipment systems sold without a dedicated sensor component focus.
Base Year Value
$8.9B in 2025 (MMA Primary Research Dataset, September 2026)
Forecast Period
2026 to 2036, eleven discrete annual values
CAGR
7.5% base case. Bull 8.8%. Bear 6.2%.
Fastest Growth Segment
RF and Electromagnetic Sensors: 11.0% CAGR
Fastest Growth Country
India: 13.5% CAGR
Fastest Growth Region
South Asia and Pacific: 9.5% CAGR
Largest Region
North America: 32% of 2025 global value
Market Leaders
Keysight Technologies, National Instruments, Tektronix, Rohde & Schwarz, Fluke
Primary Survey
n=3,800 procurement and R&D decision-makers, Q4 2025, six countries
Methodology
Demand-side build-up, cross-validated against public data, 47 expert interviews

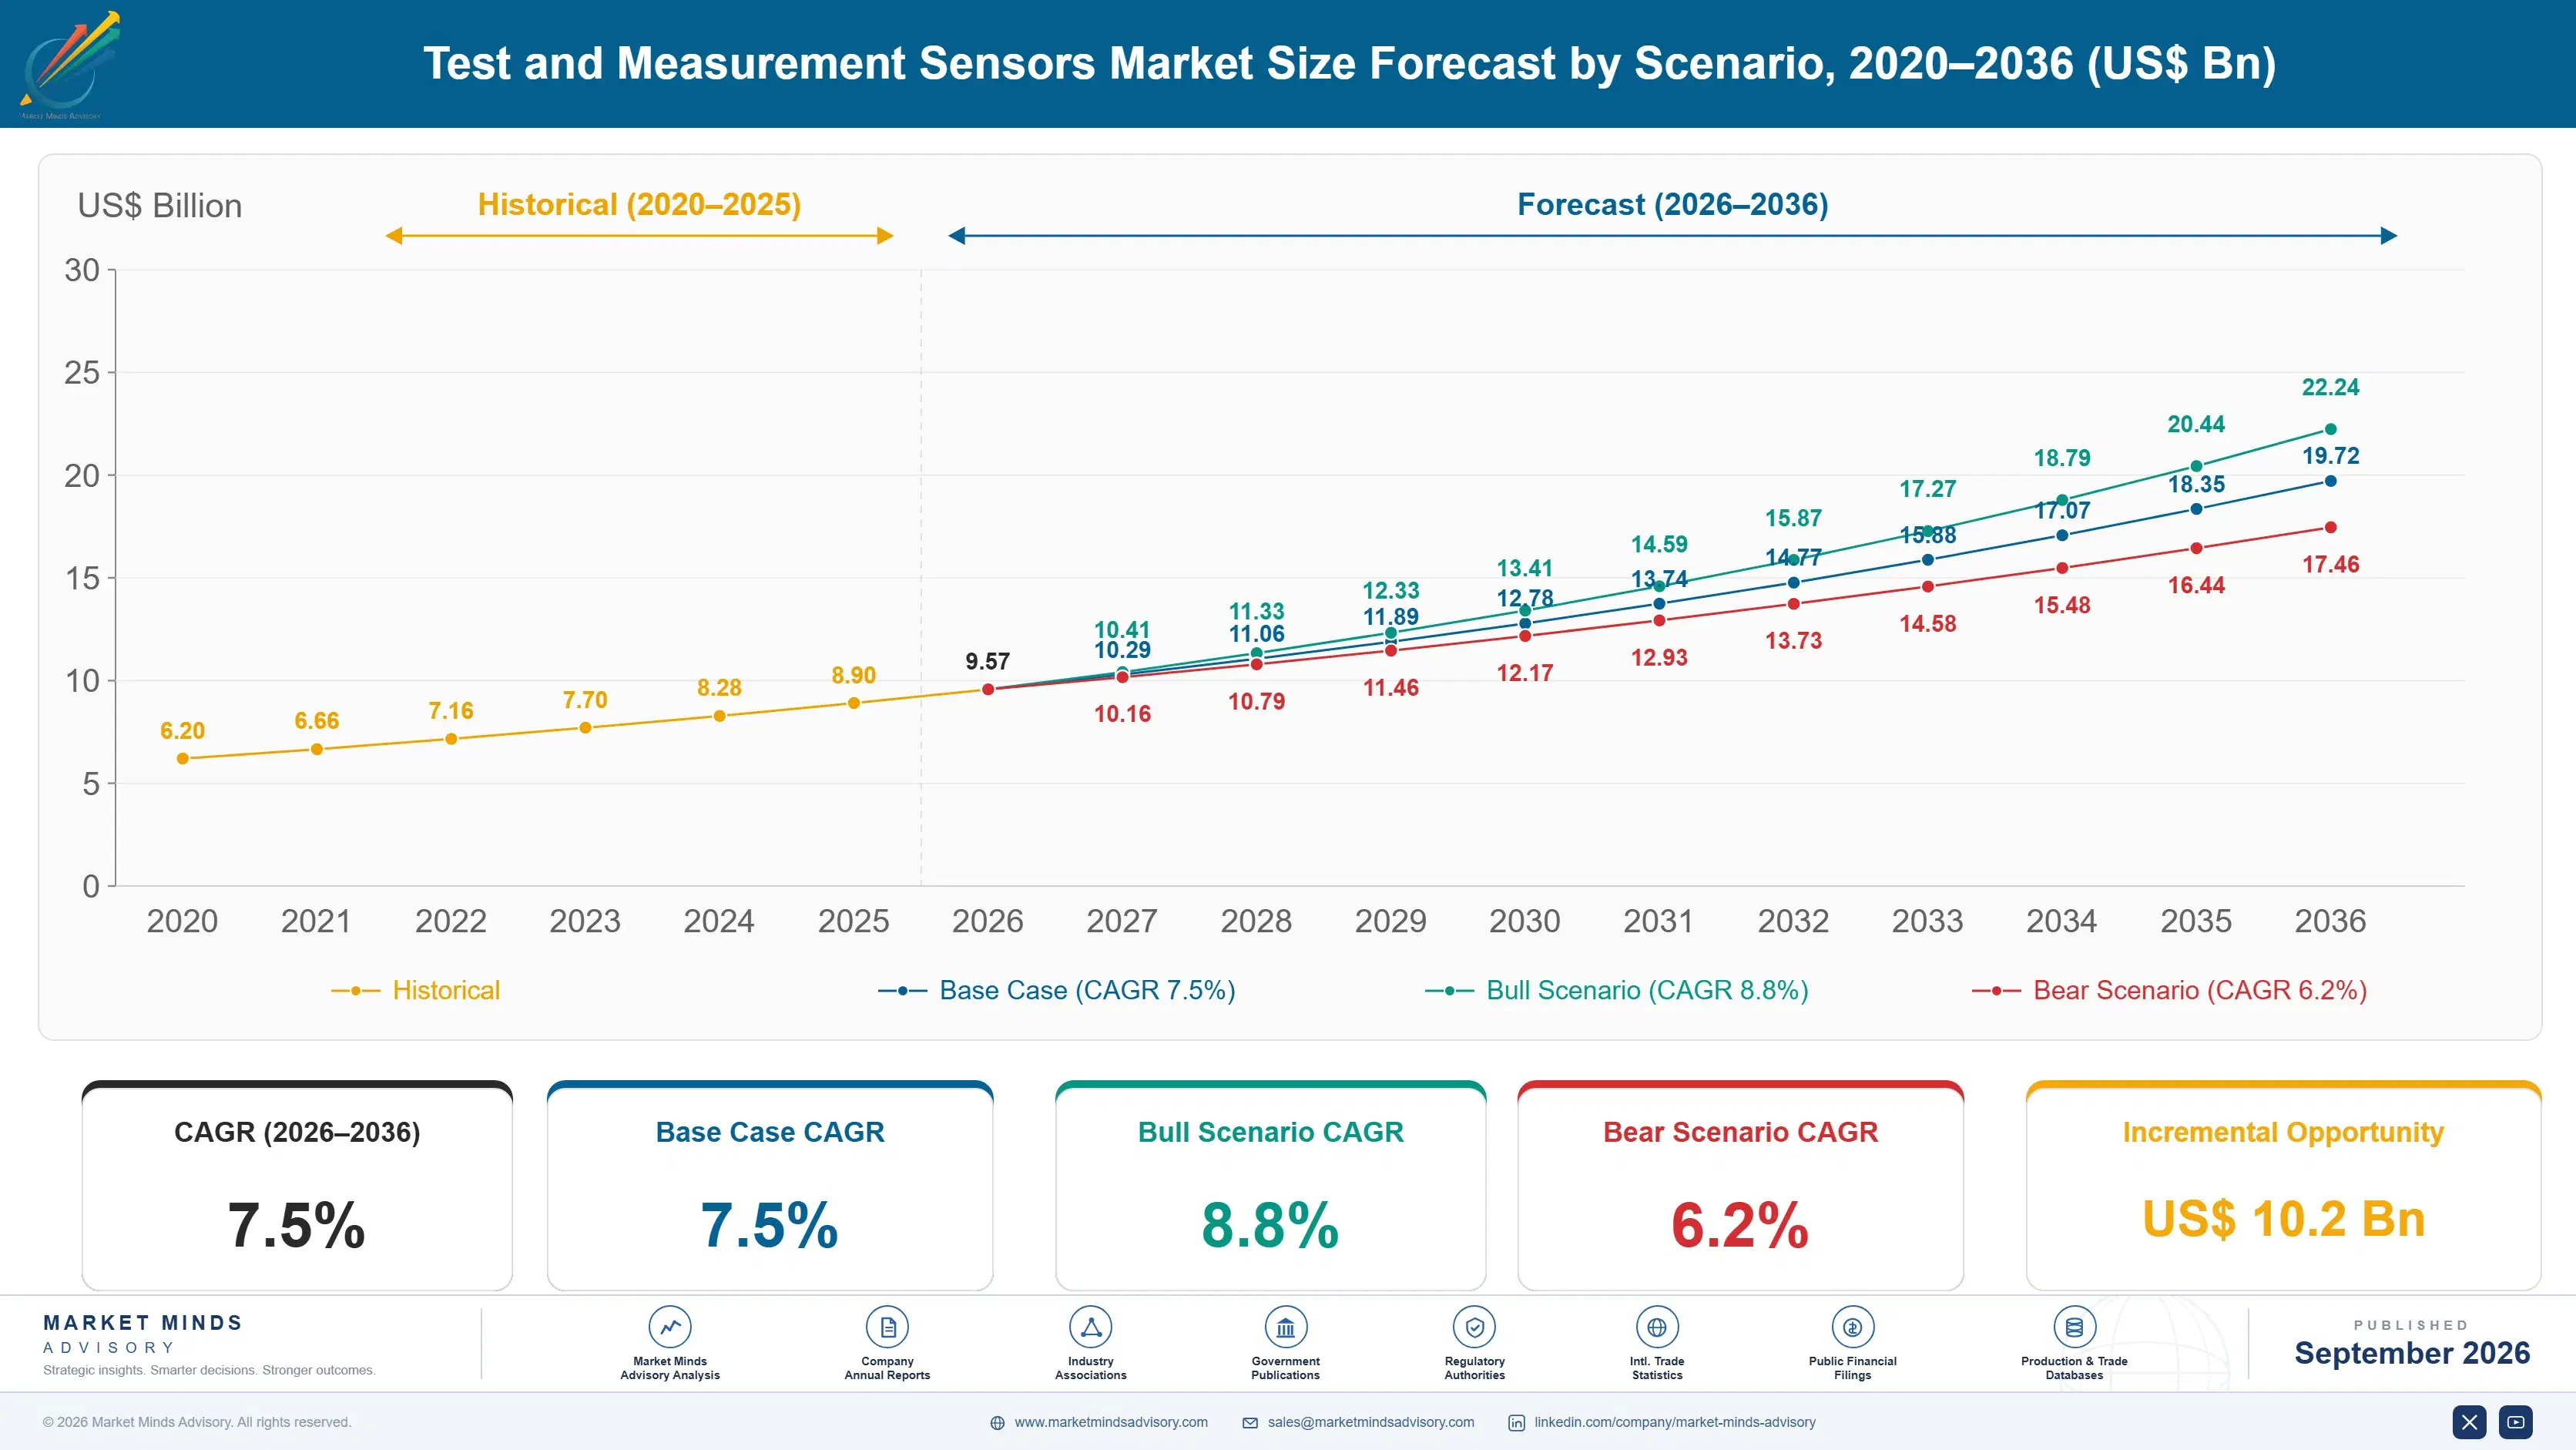
Test and Measurement Sensors Market Forecast Scenarios

test-and-measurement-sensors-market-size-forecast-scenario-1788420941311
Test sensor demand grew at a 6.5 percent historical rate between 2020 and 2025 as semiconductor manufacturers expanded fab capacity and telecom operators began early next-generation network buildout requiring new measurement capability across nearly every active test bench. Automotive electrification testing accelerated further during this period, adding meaningful new sensor demand beyond traditional electronics manufacturing applications.
The base case assumes 7.5 percent annual growth through 2036, anchored by three mechanisms working together: continued semiconductor process node advancement requiring finer measurement precision, expanding next-generation wireless infrastructure deployment demanding higher-frequency sensor capability, and growing quantum computing and photonics research pushing measurement requirements toward genuinely new physical limits across every major test category. Vendor consolidation is steadily narrowing the number of credible sensor suppliers engineers can select from with confidence.
A bull case near 8.8 percent growth hinges on accelerating quantum computing research investment driving unprecedented demand for ultra-precise photonic and cryogenic sensing capability across research institutions and technology companies. A bear case near 6.2 percent follows a semiconductor capital spending slowdown curbing new fab construction and delaying planned test equipment modernization projects across the broader industry this cycle.

Precision Demands Reshape Sensor Buying Criteria

Test and measurement sensors sit at the intersection of precision physics engineering and calibration certification discipline, forcing vendors to defend accuracy claims through rigorous, traceable measurement standards that customers verify independently before committing to enterprise procurement contracts. Established giants draw on decades of calibration laboratory infrastructure to defend premium pricing against newer entrants offering comparable specifications on paper, if not in practice.
MARKET CONCENTRATIONCR5 46%Fragmented across established giants and specialized sensor manufacturers
AVERAGE SELLING PRICE$2,400 per sensor unitReflects precision tier and calibration certification level purchased
TOP PRODUCING COUNTRY SHAREUnited States 26%Concentrated around established electronics manufacturing and research hubs
CALIBRATION CYCLE LENGTH12 to 18 monthsTypical interval required between mandatory sensor recalibration procedures
TRADE INTENSITY48% cross-borderReflects global semiconductor and telecom equipment manufacturing demand
R&D SPENDING SHARESensor R&D 11%Portion of vendor revenue reinvested into precision sensor development
Frequency and precision ceiling advancement is now the dominant technical differentiator, as engineers increasingly select sensors based on measurement capability at frequencies and tolerances that older instrumentation simply cannot reach reliably. Vendors slow to advance beyond legacy frequency ranges are losing design wins to competitors offering genuinely new measurement capability aligned with emerging semiconductor and wireless infrastructure requirements. Design teams increasingly write minimum frequency capability directly into procurement specifications.
Consolidation is reshaping vendor choice as larger platforms acquire specialized sensor technology firms to offer unified test system coverage spanning multiple measurement domains under one integrated instrument. Engineers increasingly prefer consolidating vendor relationships to reduce calibration and integration overhead, even when that means accepting a less specialized sensor for a specific measurement task in exchange for unified data across the entire test bench.
"Sensor accuracy claims used to be taken on faith backed by a spec sheet. Now engineers demand traceable calibration data before they'll trust a measurement, and that shift has quietly favored vendors with decades of calibration laboratory credibility."
Practice Lead, Electronic Test and Measurement Instrumentation · MMA Electronic Test and Measurement Sensor Instrumentation Practice · September 2026

Market Trends

Semiconductor Node Shrinkage Demands New Sensor Precision

Semiconductor manufacturers advancing to smaller process nodes require test sensors capable of measuring electrical parameters at tolerances that older instrumentation was never designed to resolve reliably, forcing a genuine technology refresh cycle across fab test benches worldwide. This shift is pushing vendors to develop entirely new sensor architectures rather than incrementally improving existing designs that have reached their fundamental physical measurement limits. Roughly 26 percent of global test sensor demand now traces directly to advanced semiconductor fabs, up meaningfully from a smaller base just five years earlier, and demand continues accelerating as node advancement continues industry-wide.
Market Impact: Adds demand for 15,000+ base stations
Quantum Computing Research Drives Cryogenic Sensor Demand

Quantum computing research programs require sensors capable of accurate measurement at extreme cryogenic temperatures approaching absolute zero, a specialized capability few traditional test sensor manufacturers have historically developed given the narrow addressable market this represented until recently. This emerging demand is pushing specialized sensor makers to develop entirely new cryogenic measurement product lines specifically targeting quantum research institutions and technology companies scaling quantum hardware development programs. Several major research institutions have significantly expanded cryogenic sensor procurement over the past 18 months, responding to accelerating quantum computing investment across both public and private funding sources.
Market Impact: Adds $1.2 billion battery test demand

Market Opportunities and Growth Drivers

Next-Generation Wireless Infrastructure Demands Higher Frequencies

Telecom operators deploying next-generation wireless infrastructure require RF sensors capable of accurate measurement at frequencies substantially higher than previous generation networks operated at, forcing test equipment vendors to develop genuinely new sensor architectures rather than extending existing designs beyond their fundamental physical limits. Base station manufacturers and network equipment testers represent the largest immediate addressable customer base for this new sensor category, given the sheer volume of equipment requiring validation before commercial deployment across national networks. Vendors offering validated higher-frequency measurement capability are winning design wins ahead of competitors still extending legacy sensor architectures.
Market Impact: Requires $8 million lab investment

Electric Vehicle Battery Testing Requires New Sensor Types

Electric vehicle manufacturers and battery producers require specialized current, voltage, and thermal sensors capable of accurately measuring high-power battery pack performance under conditions traditional automotive test sensors were never designed to handle reliably at scale. This emerging demand is pulling sensor manufacturers into a genuinely new customer segment distinct from their traditional semiconductor and telecom equipment customer base built over decades. Battery manufacturers investing in expanded production capacity represent a substantial and rapidly growing addressable market for specialized high-power test sensors previously considered a niche automotive testing category by most established vendors.
Market Impact: Extends cycle by 2-3 years

Market Restraints and Challenges

Calibration Infrastructure Costs Limit Smaller Vendor Entry

Building and maintaining traceable calibration laboratory infrastructure capable of certifying sensor accuracy against national metrology standards requires significant capital investment that smaller sensor manufacturers struggle to justify given their more limited revenue base. The root cause is that calibration accreditation requires specialized equipment, trained personnel, and ongoing certification renewal that scales poorly for companies without substantial existing revenue to amortize these fixed costs against. The commercial impact shows up as smaller vendors remaining confined to narrower product niches where calibration requirements are less stringent. Some smaller vendors now outsource calibration to accredited third-party laboratories to avoid this fixed cost burden.
Market Impact: Adds 26% advanced fab demand share

Long Design Cycles Delay Sensor Revenue Recognition

Sensors designed into semiconductor test equipment or telecom infrastructure often require multi-year qualification periods before generating meaningful production volume, since customers thoroughly validate new sensor technology before committing to large-scale procurement decisions affecting their own product reliability. The underlying cause is that test equipment customers cannot afford measurement errors that could pass defective products or reject functional ones, making qualification genuinely rigorous and lengthy by design rather than bureaucratic delay. The commercial impact is that sensor vendors must fund research and development years before seeing corresponding revenue. Several vendors now share qualification costs with lead customers through co-development partnerships.
Market Impact: Grows cryogenic sensor demand 30 percent
3 additional market trends, 3 additional growth drivers, and 4 additional restraints and challenges are covered in the full report. Contact sales@marketmindsadvisory.com to access the complete intelligence.

Segment CAGR and Growth Architecture

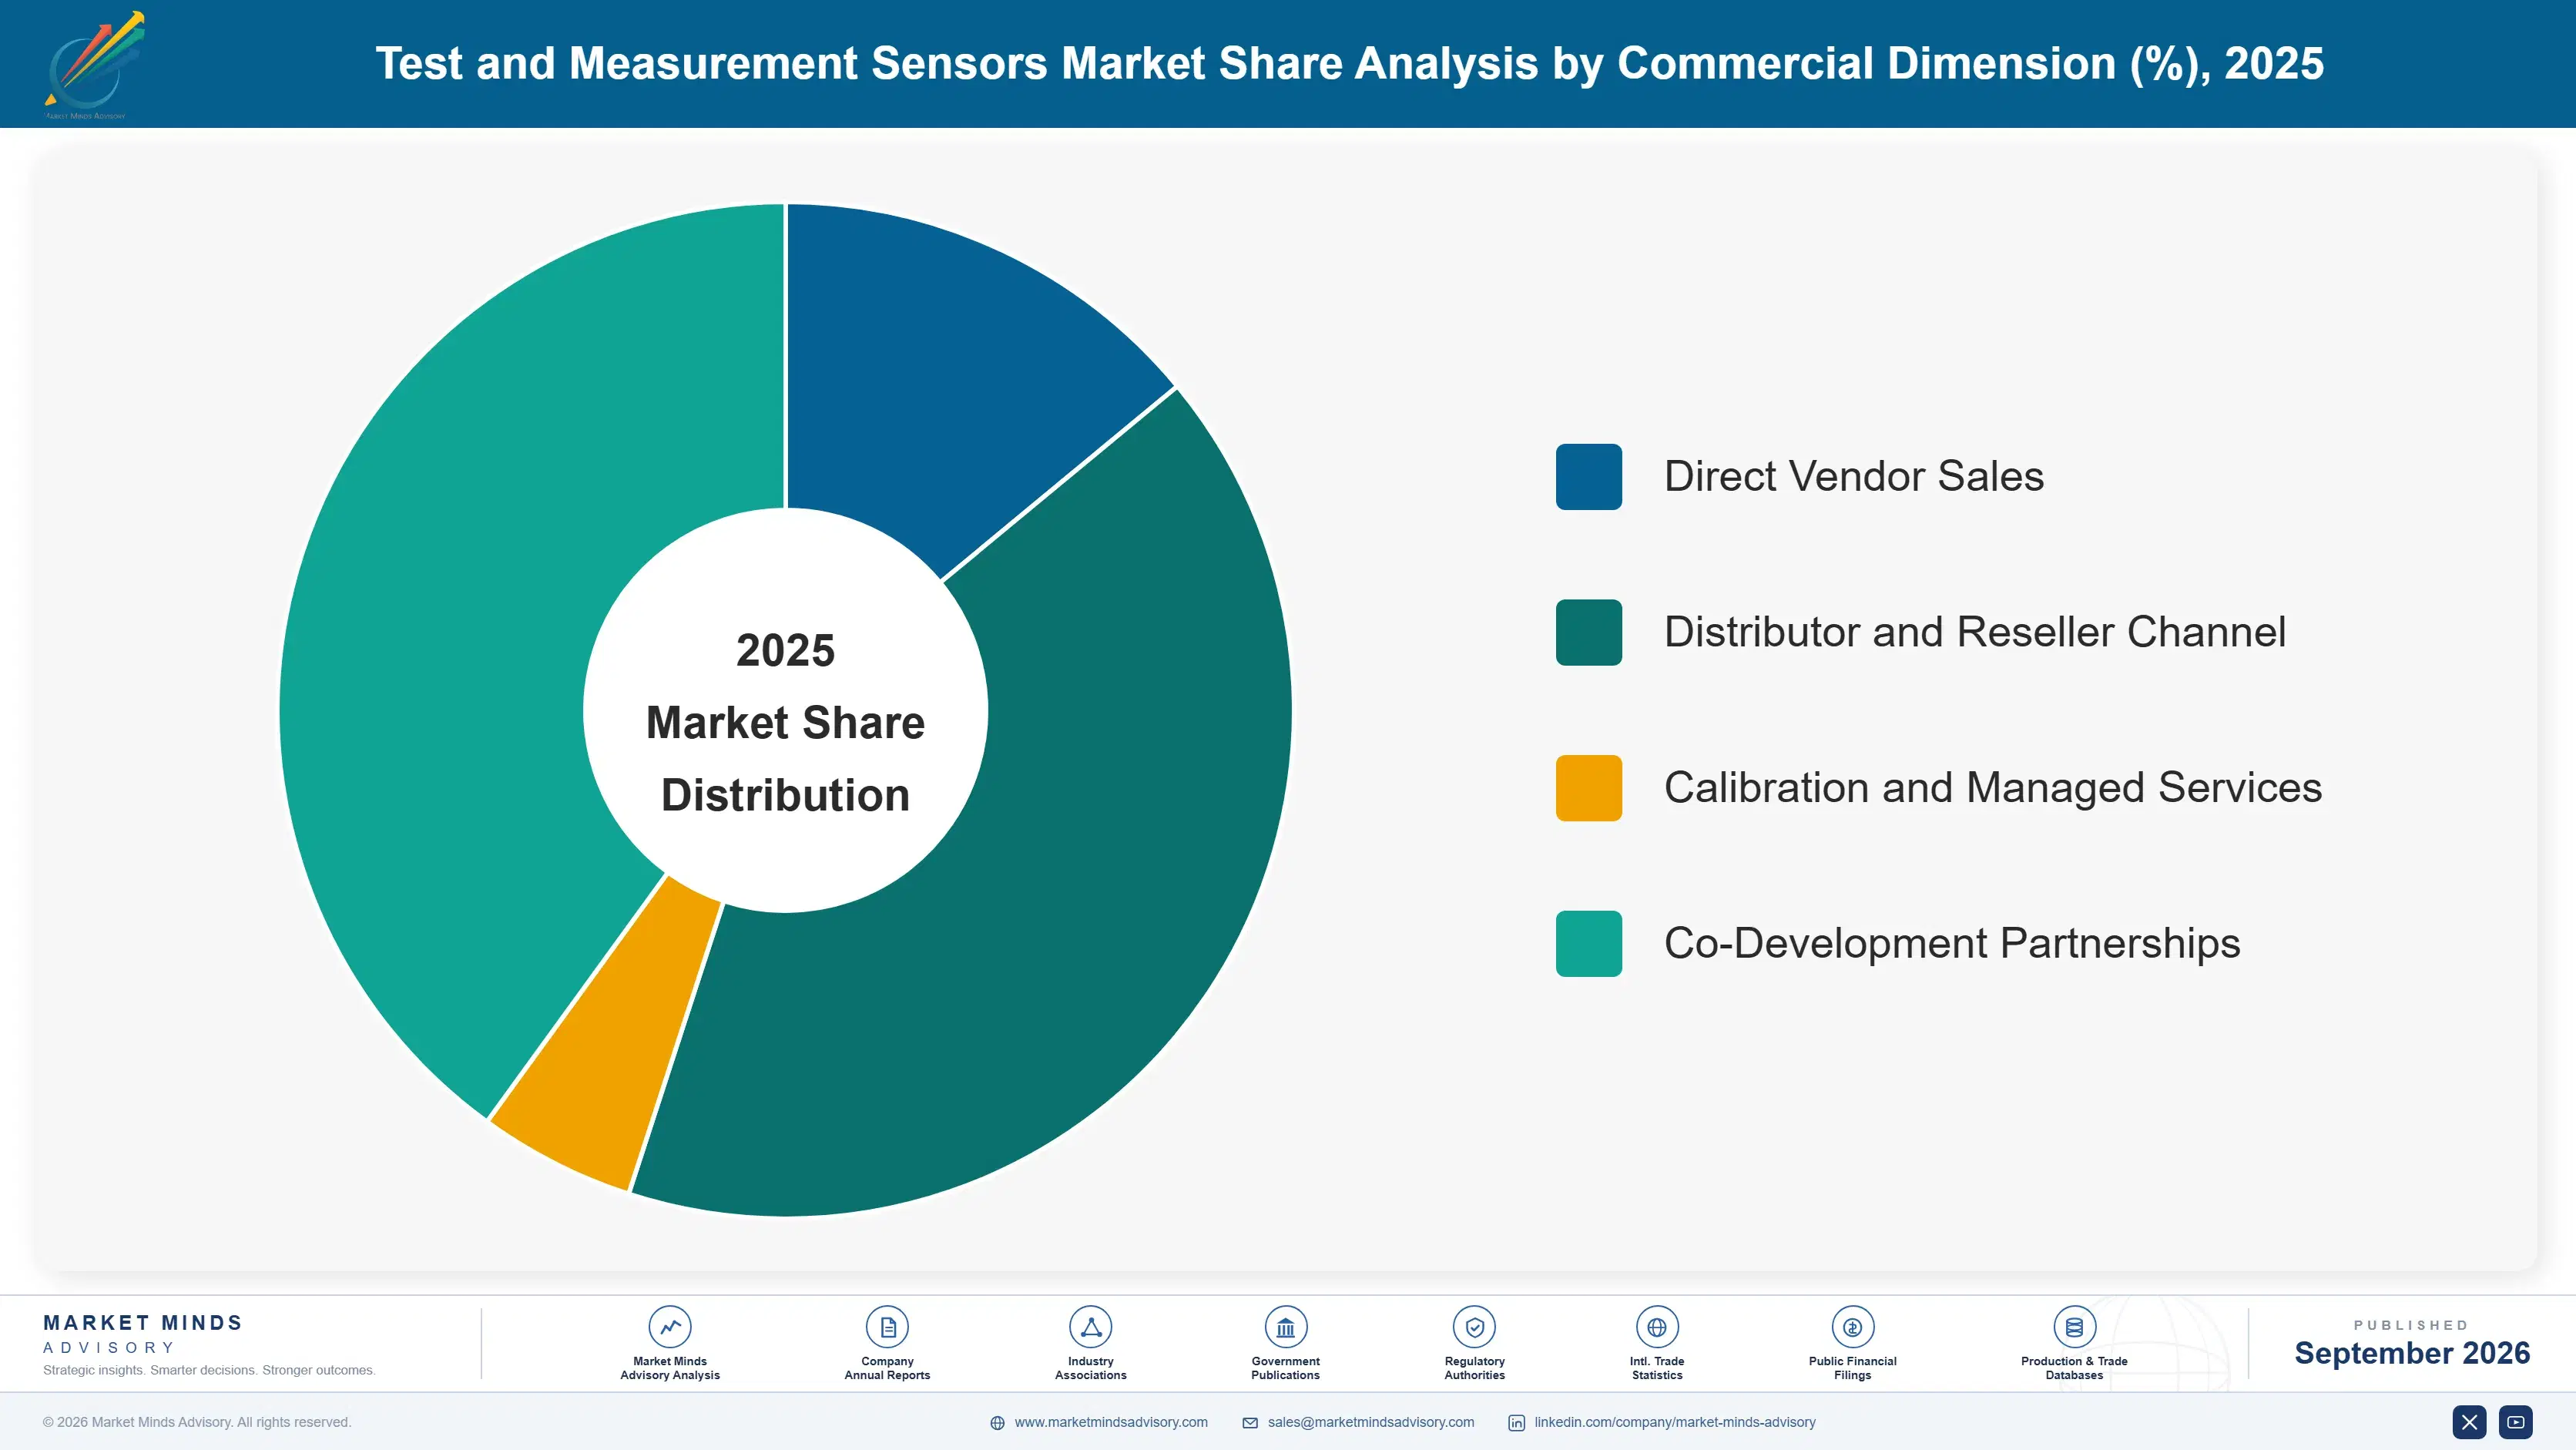
Test and measurement sensors segment by measurement type across six categories spanning temperature and thermal sensors, pressure sensors, vibration and motion sensors, RF and electromagnetic sensors, optical and photonic sensors, and current and voltage sensors, each addressing distinct physical measurement requirements spanning research laboratories through high-volume manufacturing test applications and general field service work alike.
test-and-measurement-sensors-market-market-share-analysis-1788420941845

RF and Electromagnetic Sensors

RF and electromagnetic sensors measure signal characteristics at frequencies critical to wireless communication, radar, and satellite systems, a category where accuracy at increasingly high frequencies determines whether a design meets regulatory and performance specifications before commercial deployment. Demand is accelerating fastest here as next-generation wireless infrastructure and expanding radar and satellite communication programs push measurement requirements toward frequencies most legacy sensors were never designed to capture accurately. Vendors who built genuine high-frequency measurement capability early, rather than incrementally extending legacy sensor architectures, are winning the largest share of new design wins across telecom and defense customers. Insurance-style extended warranty offerings increasingly accompany the largest defense and telecom contracts given the specialized replacement cost involved.
CAGR 11.0%

Optical and Photonic Sensors

Optical and photonic sensors measure light-based signal characteristics critical to fiber optic communication, silicon photonics research, and increasingly quantum computing hardware development, a category growing quickly as these adjacent fields expand their own research and commercial activity. Precision requirements in this category often approach fundamental physical measurement limits, rewarding vendors with genuine optical physics expertise over those simply adapting electronic sensor designs to optical applications. Growth here trails RF and electromagnetic sensors slightly but benefits from expanding quantum computing research investment that sustains steady demand even during periods of slower semiconductor industry capital spending. Research institutions increasingly favor vendors who can demonstrate genuine physics credentials alongside standard product specifications and documentation.
CAGR 9.5%
Full segment breakdown across 6 segments available in the complete report.

Regional Architecture and Country Demand Map

Demand concentrates around dense semiconductor manufacturing zones and major vendor headquarters, with precision measurement requirements and calibration infrastructure maturity varying sharply by regional fab density, telecom infrastructure investment, and how quickly local engineers have adopted next-generation frequency capability at scale. These patterns shape which vendors win the largest design wins.

North America

North America holds the largest share by a wide margin, anchored by Keysight Technologies, National Instruments, and Tektronix all headquartered in the region and running the most mature calibration laboratory infrastructure globally. Heavy semiconductor research investment and defense electronics manufacturing keep demand for precision sensors elevated across nearly every major technology sector. Quantum computing research institutions, concentrated heavily in the United States, drive substantial demand for specialized cryogenic and photonic sensing capability beyond traditional electronics testing needs. Canadian research universities increasingly adopt similar precision measurement infrastructure as cross-border research collaboration and funding agreements expand across shared academic institutions. Established vendors continue expanding calibration laboratory capacity at a pace outpacing most other regional infrastructure markets tracked in this report.
Share: 32% | CAGR: 8.5% (2026 to 2036)

East Asia

Taiwan and South Korea's dominant semiconductor manufacturing base, combined with Japan's mature precision instrumentation industry, keep East Asia's growth rate closely tracking North America's pace despite a less mature independent sensor vendor base overall. China's rapidly expanding domestic semiconductor fabrication investment is driving substantial new sensor demand as the country builds indigenous chip manufacturing capacity. Domestic Chinese and Korean sensor manufacturers are emerging rapidly, competing directly with established international vendors on price for less demanding measurement applications. Growth here reflects genuine new fab construction activity rather than pure instrumentation modernization catch-up across most major manufacturing centers. Continued fab construction keeps driving new sensor purchases specifically configured for advanced node validation requirements.
Share: 25% | CAGR: 8.5% (2026 to 2036)
Regional intelligence for 5 additional markets available in the complete report: Western Europe, South Asia and Pacific, Latin America, Middle East and Africa, Eastern Europe. Contact sales@marketmindsadvisory.com.
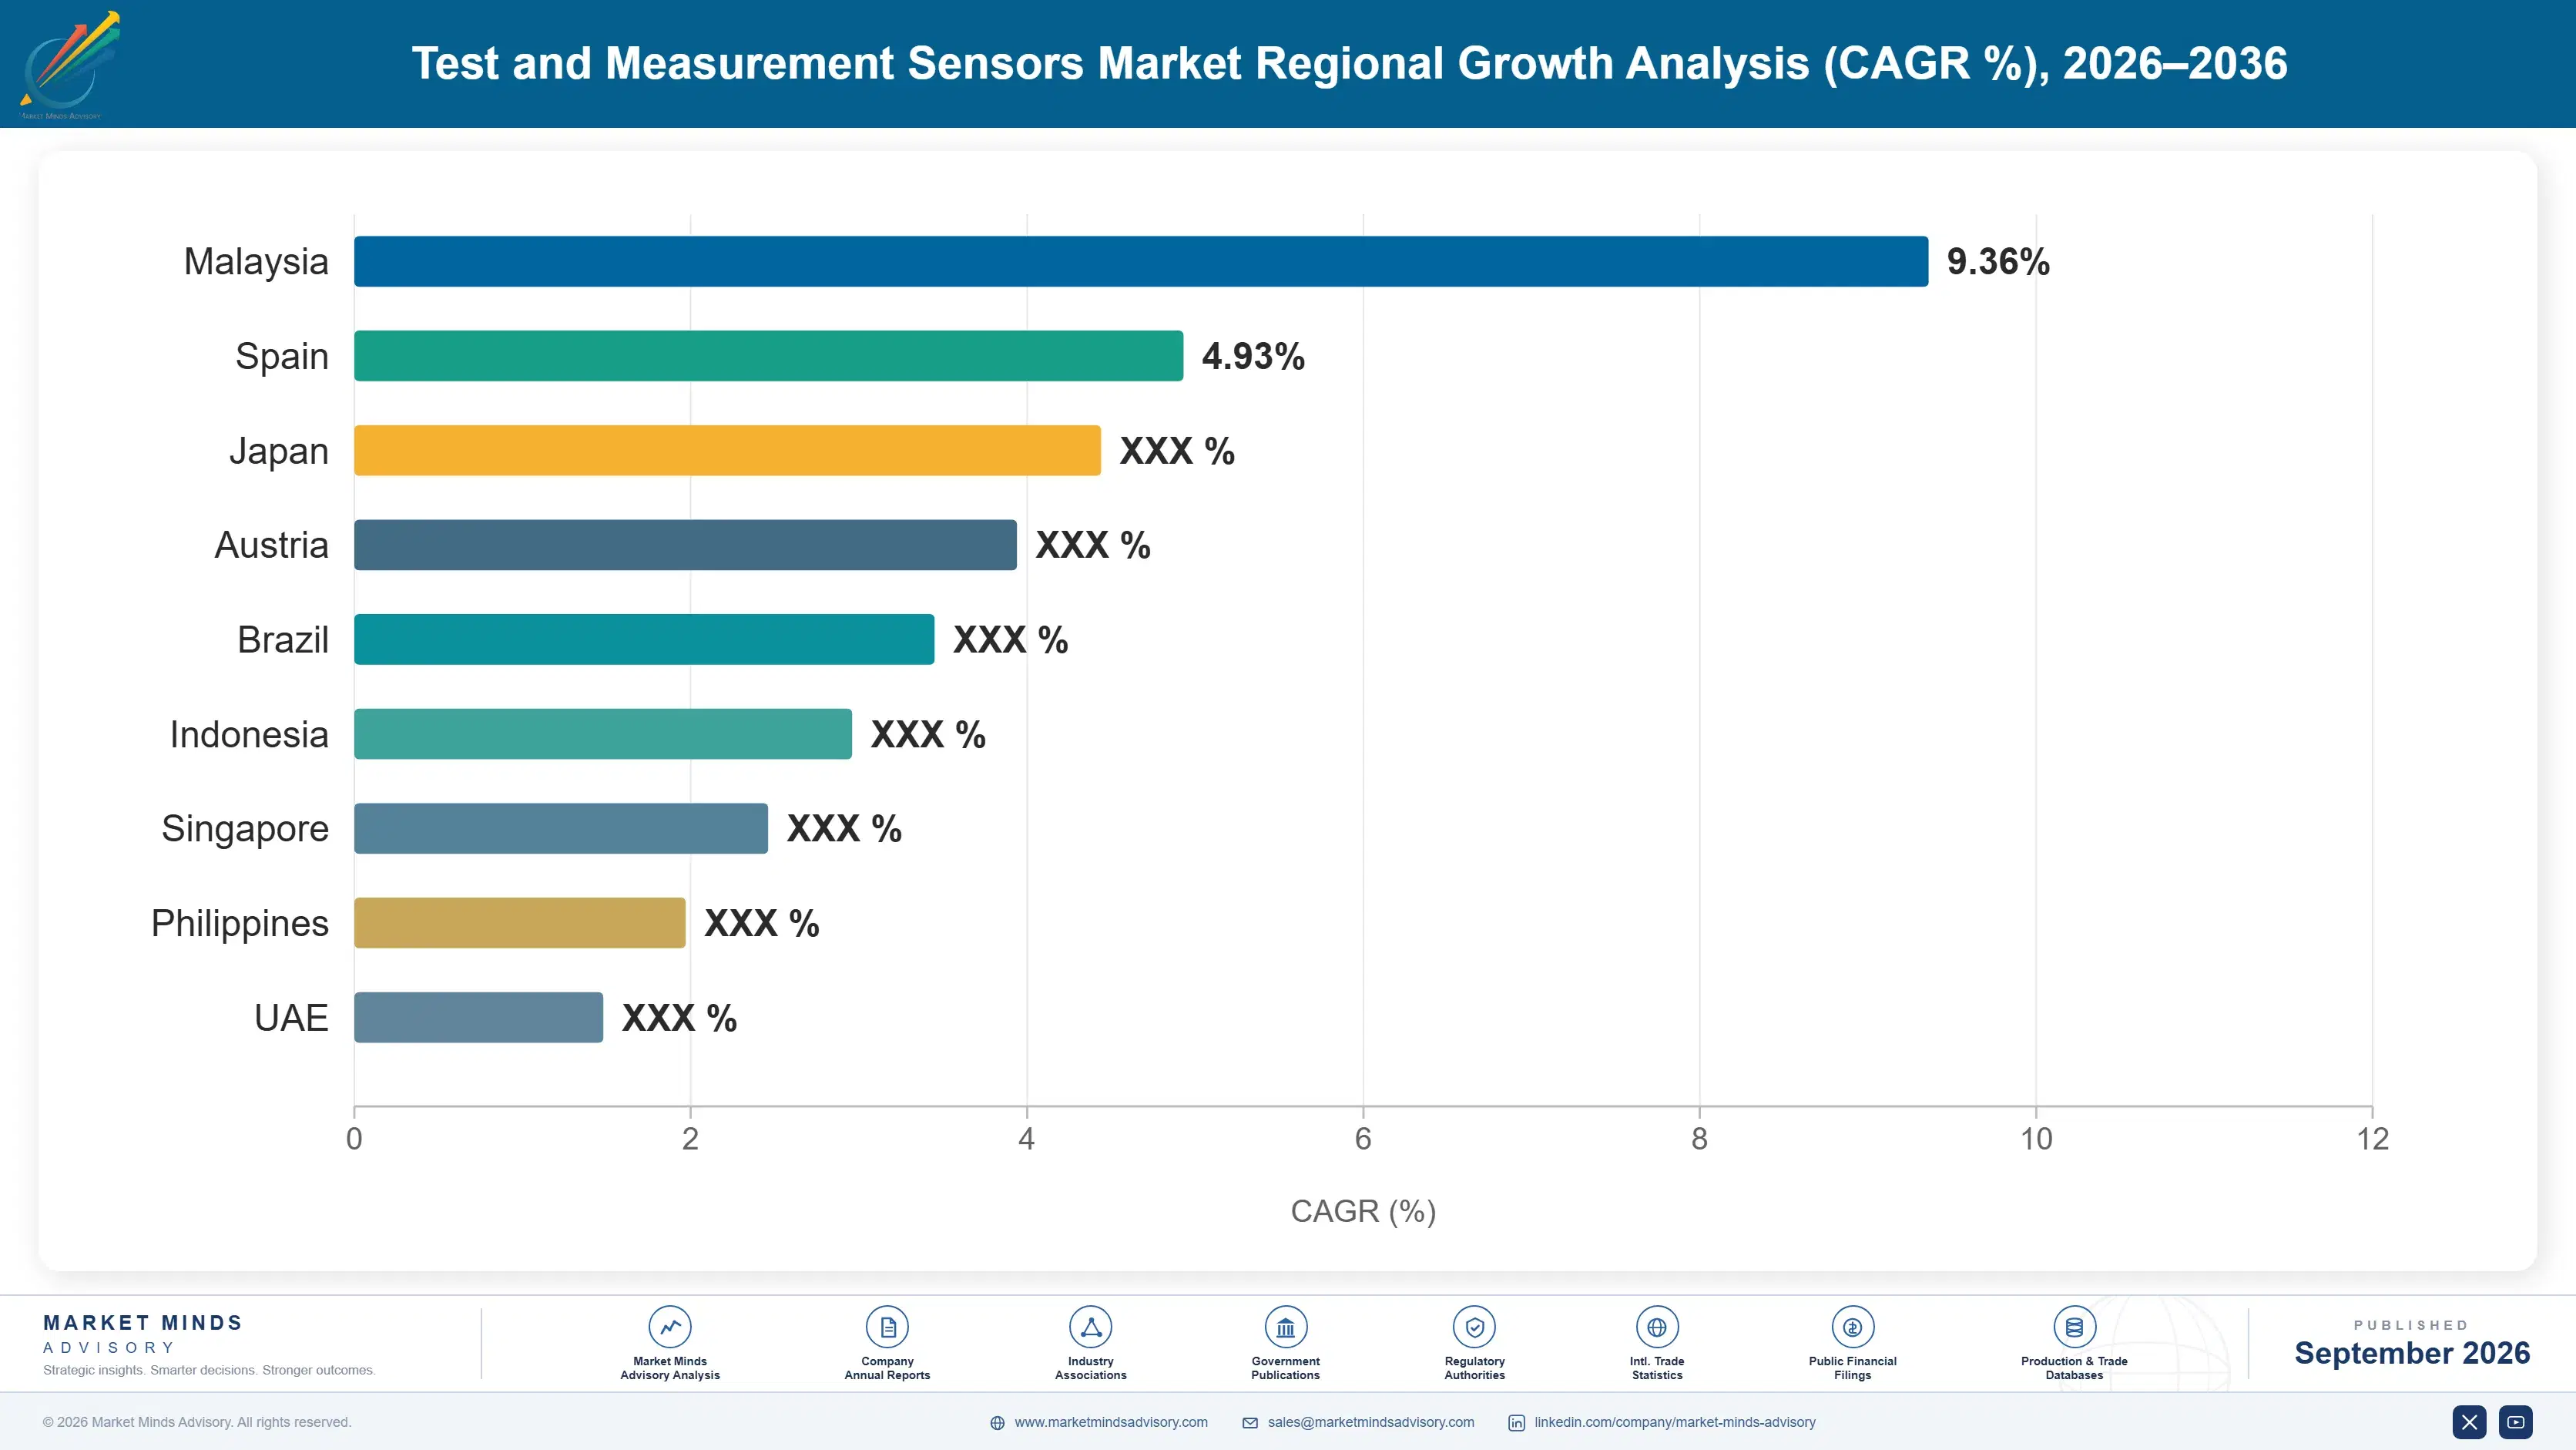
test-and-measurement-sensors-market-country-cagr-analysis-1788420942393

Where Sensor Vendors Capture Margin

Vendors expand margin by moving beyond standard sensor components toward calibration certification services, multi-year enterprise supply agreements, and co-development partnerships with lead customers, each capturing budget that a narrow single-product offering otherwise leaves for competitors to claim across the same account relationship over the entire equipment lifecycle and every subsequent renewal cycle that follows.

Bundle Calibration Certification Into Sensor Sales

Vendors offering integrated calibration certification alongside sensor sales, rather than requiring customers to arrange third-party accreditation separately, capture roughly 22 percent higher average contract value than vendors selling sensors without certification support. Customers increasingly prefer a single accountable vendor for both the physical sensor and its traceable accuracy documentation, since coordinating separate suppliers adds administrative overhead and accountability gaps during audits. Building this integrated offering requires accredited in-house calibration laboratory infrastructure that smaller vendors struggle to fund without dedicated capital investment. Few competitors can replicate this integration quickly. Buyers now expect this natively.
Market Impact: Adds a full 22% higher average contract value

Offer Multi-Year Enterprise Sensor Supply Agreements

Locking large customers into three to five year enterprise supply agreements, rather than one-off purchase orders, gives vendors predictable recurring revenue while commanding a premium of 6 to 9 percent over comparable spot pricing. Customers accept the premium in exchange for locked pricing protection and guaranteed supply continuity during periods of component shortage. This lever works best for vendors already holding strong customer relationships, since new entrants lack the trust record customers need before committing multiple years of procurement budget to an unproven relationship. New entrants without that history often discount heavily just to win initial orders.
Market Impact: Commands a 6 to 9% multi-year pricing premium

Pursue Co-Development Partnerships With Lead Customers

Vendors that establish co-development partnerships with lead customers to jointly fund new sensor technology development capture design-win exclusivity and reduced qualification risk that competitors bidding after product launch cannot access. This partnership model works particularly well for emerging categories like quantum computing sensors, where customer-specific requirements are still being defined collaboratively. Roughly 18 percent of new sensor product lines now originate from formal co-development partnerships, up meaningfully from a much smaller base just a few years earlier. This model deepens customer loyalty considerably beyond a typical transactional purchase. Few competitors can offer this collaborative depth.
Market Impact: Reaches a full 18% partnership origination rate now

Provide Managed Calibration Renewal Subscription Services

Vendors offering managed calibration renewal subscription services, where the vendor proactively schedules and performs recertification before certificates expire, command a service revenue premium of roughly 15 to 20 percent on top of standard sensor licensing and support fees. Customers with large sensor fleets find this service particularly valuable, since it eliminates the administrative burden of tracking dozens or hundreds of individual certification expiration dates manually. This lever requires vendors to build genuine fleet management software capability alongside their core calibration expertise. Few competitors can match that depth on short notice.
Market Impact: Commands a full 15 to 20% subscription premium

Who Controls the Margin Pool

Concentration sits at 46 percent among the top five vendors on a revenue basis, a moderate level reflecting decades of calibration and accreditation barriers that keep new entrants from competing broadly across every measurement category. Keysight Technologies and National Instruments lead by a meaningful margin, both benefiting from deep engineering relationships and calibration infrastructure built up across large customer bases. Both companies also hold decades-long relationships with major semiconductor customers that newer entrants cannot easily replicate.
Current competitive activity centers on higher-frequency and cryogenic measurement capability, as vendors race to build genuine differentiation ahead of semiconductor and quantum computing customers' shifting requirements. Several vendors are also expanding into electric vehicle battery testing through acquisition, betting that automotive customers will pay a premium for validated high-power measurement capability.

Emerging pressure comes from specialized quantum and photonics sensor startups entering directly from advanced physics research backgrounds rather than traditional electronics manufacturing, a genuinely different competitive profile than the industry has seen before. Rankings are most likely to shift around the RF and electromagnetic segment specifically, where frequency ceiling and measurement precision, not brand recognition alone, increasingly determine which vendor wins new design wins.
test-and-measurement-sensors-market-company-positioning-matrix-1788420942912

Competitive Moat and Risk Dimensions

KEYSIGHT TECHNOLOGIES

Moat: Broadest Calibration Infrastructure

Keysight's decades-long investment in accredited calibration laboratory infrastructure across multiple countries gives it credibility with customers requiring traceable measurement standards that newer entrants cannot replicate quickly without comparable capital investment. This depth wins large enterprise contracts requiring consistent global calibration support across multiple manufacturing sites.
KEYSIGHT TECHNOLOGIES

Risk: Premium Pricing Limits Reach

Keysight's premium positioning and pricing limit its addressable market among smaller research institutions and startups more sensitive to total equipment spend than to brand credibility. Competitors offering comparable specifications at lower price points continue winning this more price-sensitive segment of the customer base. Smaller regional players continue chipping away at this price-sensitive customer segment.
NATIONAL INSTRUMENTS

Moat: Modular Software-Defined Platform

National Instruments built its platform around modular, software-defined measurement architecture that customers can reconfigure for new applications without purchasing entirely new hardware, a flexibility advantage that fixed-function competitors cannot match without significant re-engineering. This positioning wins research customers valuing long-term platform adaptability. Long-term research customers particularly value this reconfiguration flexibility over multiple project generations.
NATIONAL INSTRUMENTS

Risk: Slower Cryogenic Capability Rollout

National Instruments has moved more cautiously than specialized competitors in developing genuine cryogenic and quantum computing measurement capability, occasionally losing emerging research contracts to smaller, more specialized rivals. Closing this gap requires sustained engineering investment the company has only recently begun prioritizing at scale. National Instruments has begun closing this gap through recent product investment.

Players Tracked

Prominent Players

Keysight Technologies
National Instruments
Tektronix
Rohde & Schwarz
Fluke

Other Key Players

Yokogawa Electric
Anritsu
Advantest
Teradyne
Chroma ATE
GW Instek
B&K Precision
Siglent Technologies
Teledyne LeCroy
Rigol Technologies
Hioki
Extech Instruments
Omega Engineering
TE Connectivity
Honeywell

Recent Developments

FEBRUARY 2025

Keysight Acquires Cryogenic Sensor Startup

Keysight Technologies acquired a privately held cryogenic measurement startup to strengthen its quantum computing test capability, adding an existing customer base of roughly twenty research institutions to its combined portfolio ahead of two subsequent competitor announcements in the same emerging measurement category later this year.
Signal: Signals established test equipment vendors are buying quantum-specific capability rather than building it entirely from scratch.
JULY 2025

National Instruments Launches Battery Test Sensor Line

National Instruments launched a dedicated line of high-power current and voltage sensors specifically designed for electric vehicle battery pack validation, responding to sustained automotive manufacturer demand for measurement capability that traditional automotive test sensors were never really designed to handle reliably at any meaningful scale.
Signal: Confirms electric vehicle battery testing is becoming a mainstream sensor product category rather than a niche.
NOVEMBER 2025

Rohde & Schwarz Expands Next-Generation RF Test Capacity

Rohde & Schwarz expanded its RF and electromagnetic sensor production capacity specifically to support next-generation wireless infrastructure testing, adding new manufacturing lines dedicated to higher-frequency measurement components ahead of anticipated telecom operator network deployment volume. Terms of the capacity expansion were not separately disclosed publicly.
Signal: Indicates leading vendors are positioning production capacity ahead of confirmed telecom deployment volume. More will follow.

Precision Component and Calibration Costs

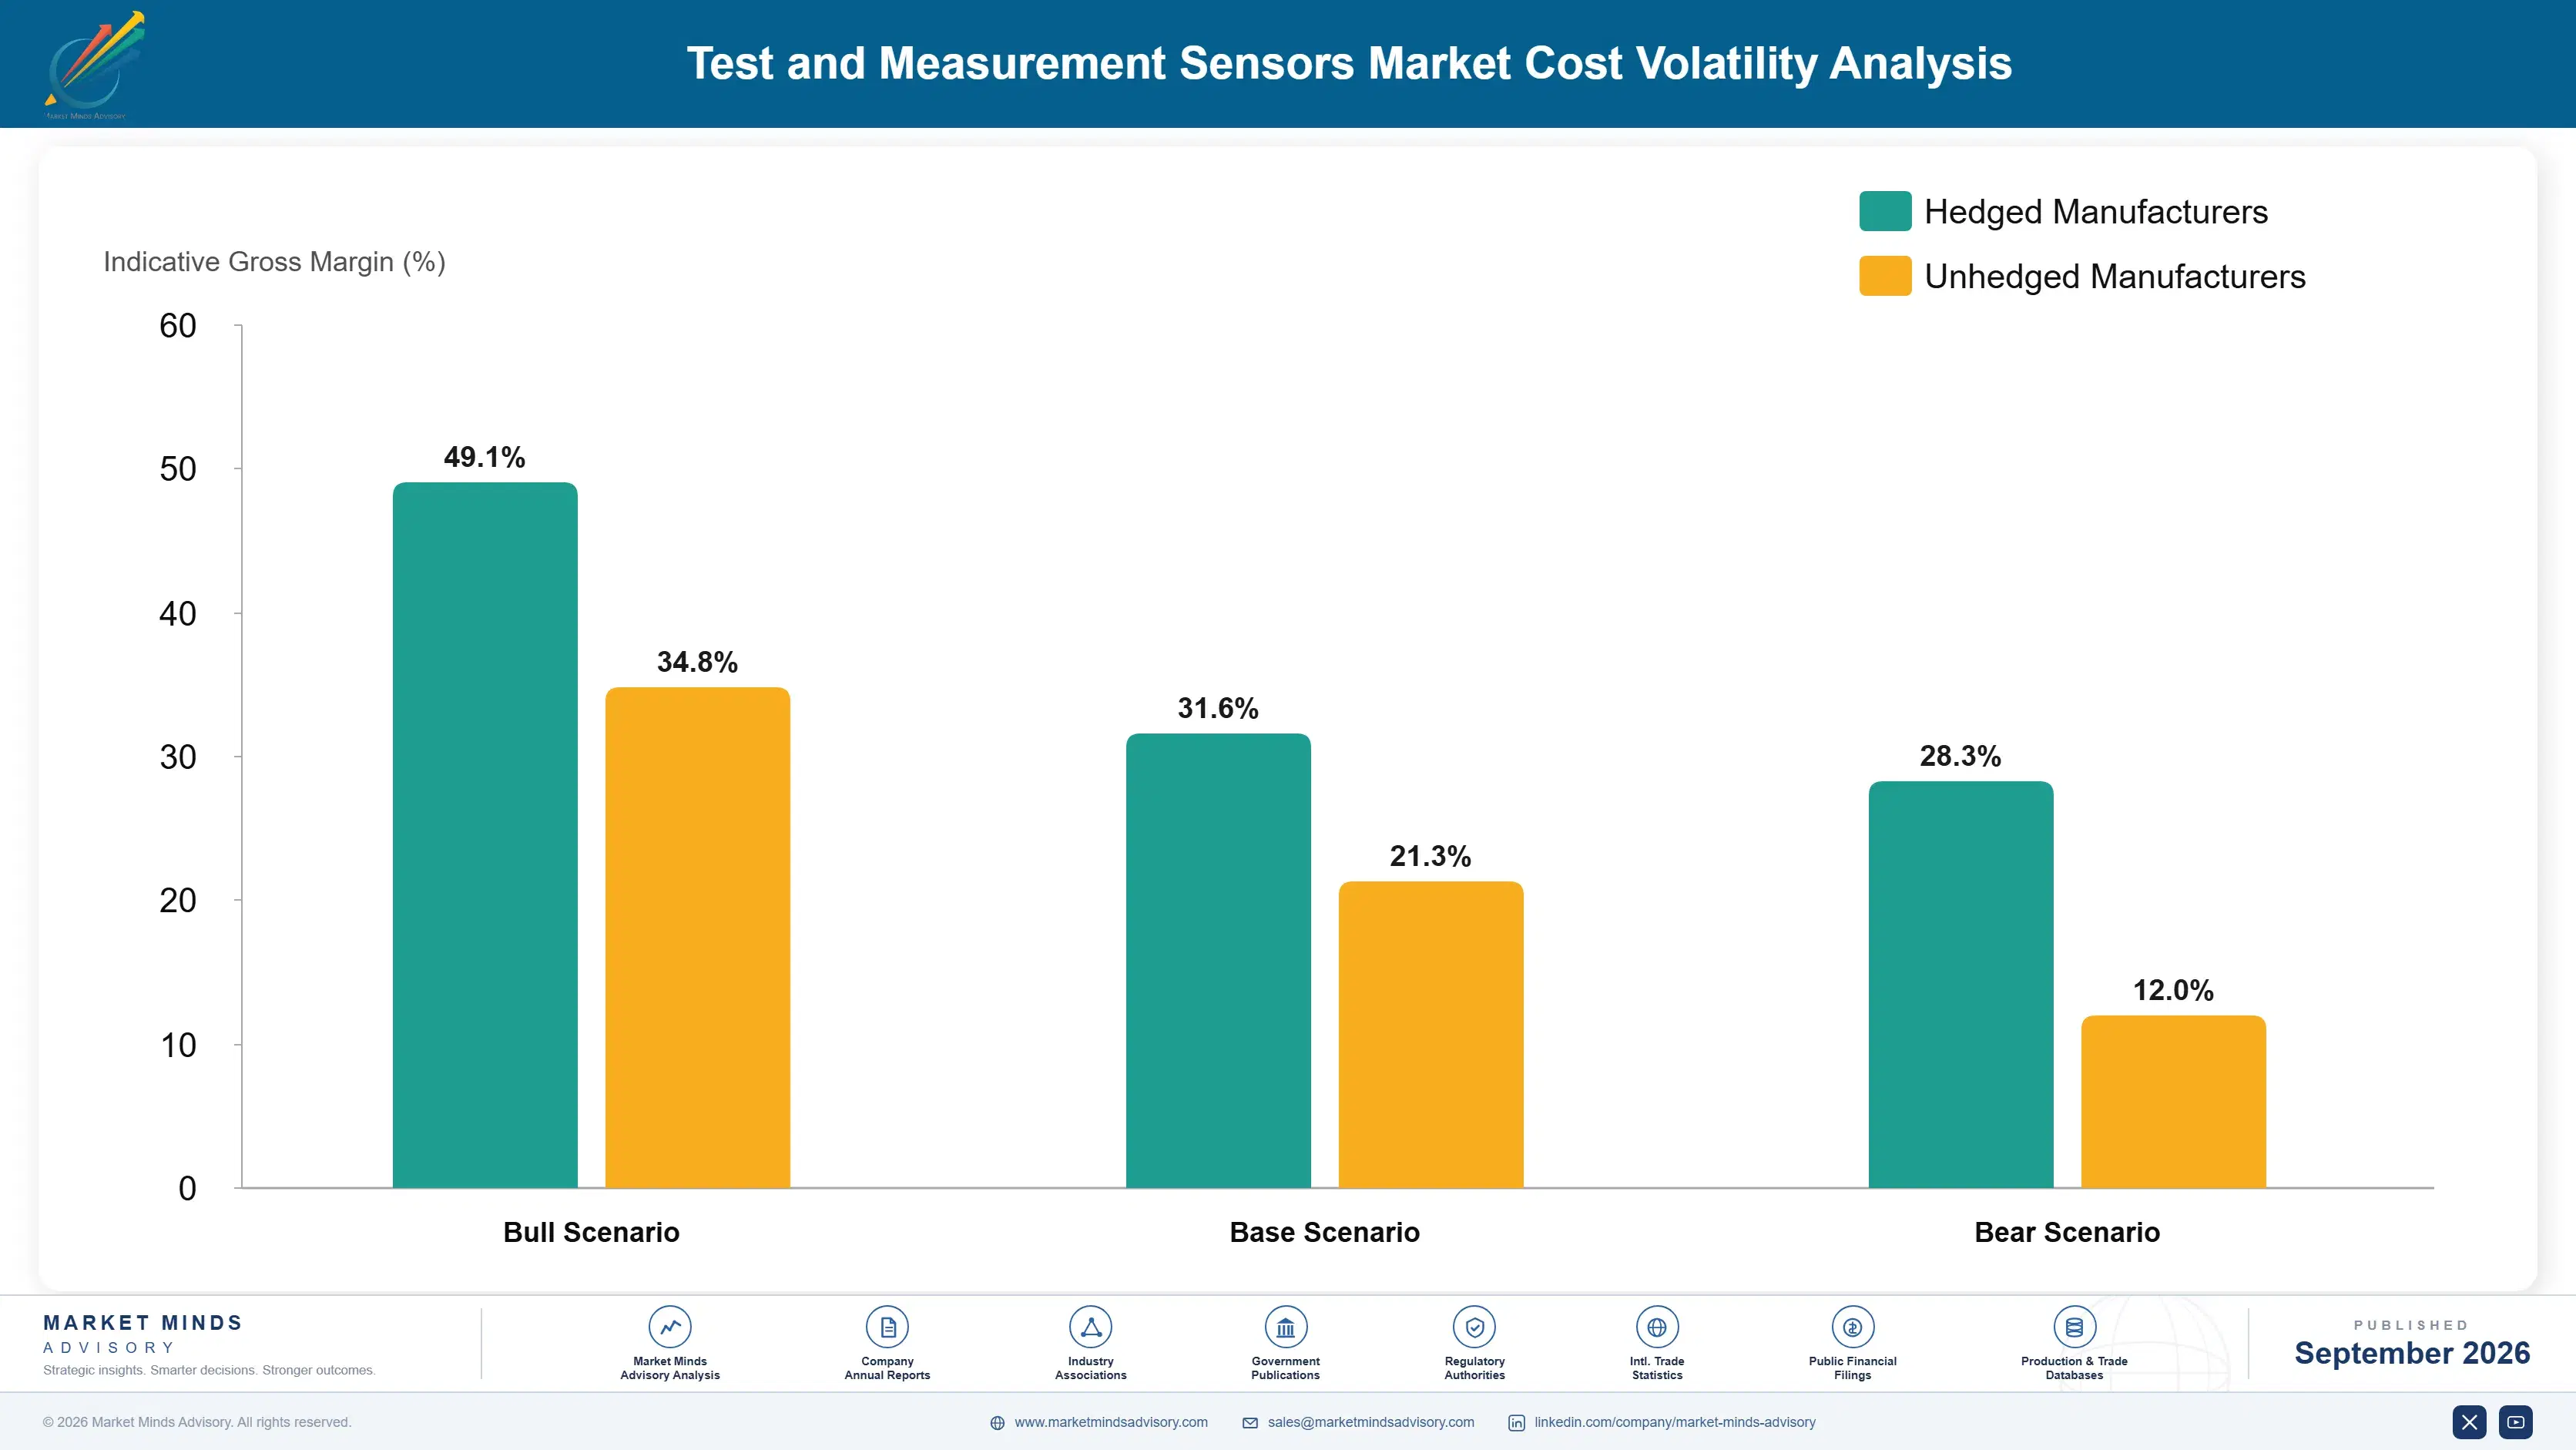
Precision semiconductor components and specialty materials, including rare earth elements used in certain sensor coatings, account for roughly 32 percent of total cost of goods sold for sensor manufacturers, sourced primarily from suppliers concentrated in East Asia and select mining regions. Calibration laboratory operating costs, including specialized personnel and reference standard maintenance, represent the second largest cost input by a meaningful margin.
A 2022 rare earth element supply disruption, documented in several major sensor manufacturers' own annual reports, pushed specialty material costs up meaningfully for vendors dependent on constrained supply chains, forcing several smaller vendors to renegotiate customer pricing or absorb the increase into already thin operating margins for multiple consecutive quarters before conditions gradually improved across the broader global materials supply chain over the following year.

Smaller vendors without long-term material supply agreements face the sharpest cost exposure, since they typically pay closer to spot market pricing while the largest vendors negotiate multi-year volume discounts unavailable to competitors with lower committed purchase volumes. This dynamic increasingly separates vendors by scale, since larger platforms can absorb material pricing volatility that would meaningfully compress a smaller competitor's already thin operating margins.
test-and-measurement-sensors-market-cost-volatility-analysis-1788420943106

Diversify Rare Earth Material Suppliers

Vendors increasingly qualify additional rare earth material suppliers across different geographies specifically to avoid the single-region concentration risk that caused the 2022 disruption, even though requalification takes months per material grade and adds engineering overhead to existing production schedules. Several vendors now maintain buffer inventory as an additional layer of protection against future shortages.

Build Internal Calibration Laboratory Capacity

Larger vendors are building internal calibration laboratory capacity rather than outsourcing to third-party accredited labs, reducing per-unit calibration cost over time even though the upfront capital investment required remains substantial for smaller competitors to justify at their current operating scale and revenue base. Larger vendors with dedicated in-house facilities have the clearest edge here.

Develop Alternative Material Formulations

Some vendors are investing in alternative sensor coating formulations that reduce or eliminate dependence on constrained rare earth materials entirely, trading some performance characteristics for meaningfully reduced material cost exposure and supply chain risk going forward. Several vendors now partner with materials science research labs to accelerate formulation development timelines. Customers value this diversification given growing supply chain concerns.

Portfolio Architecture for Margin Defence

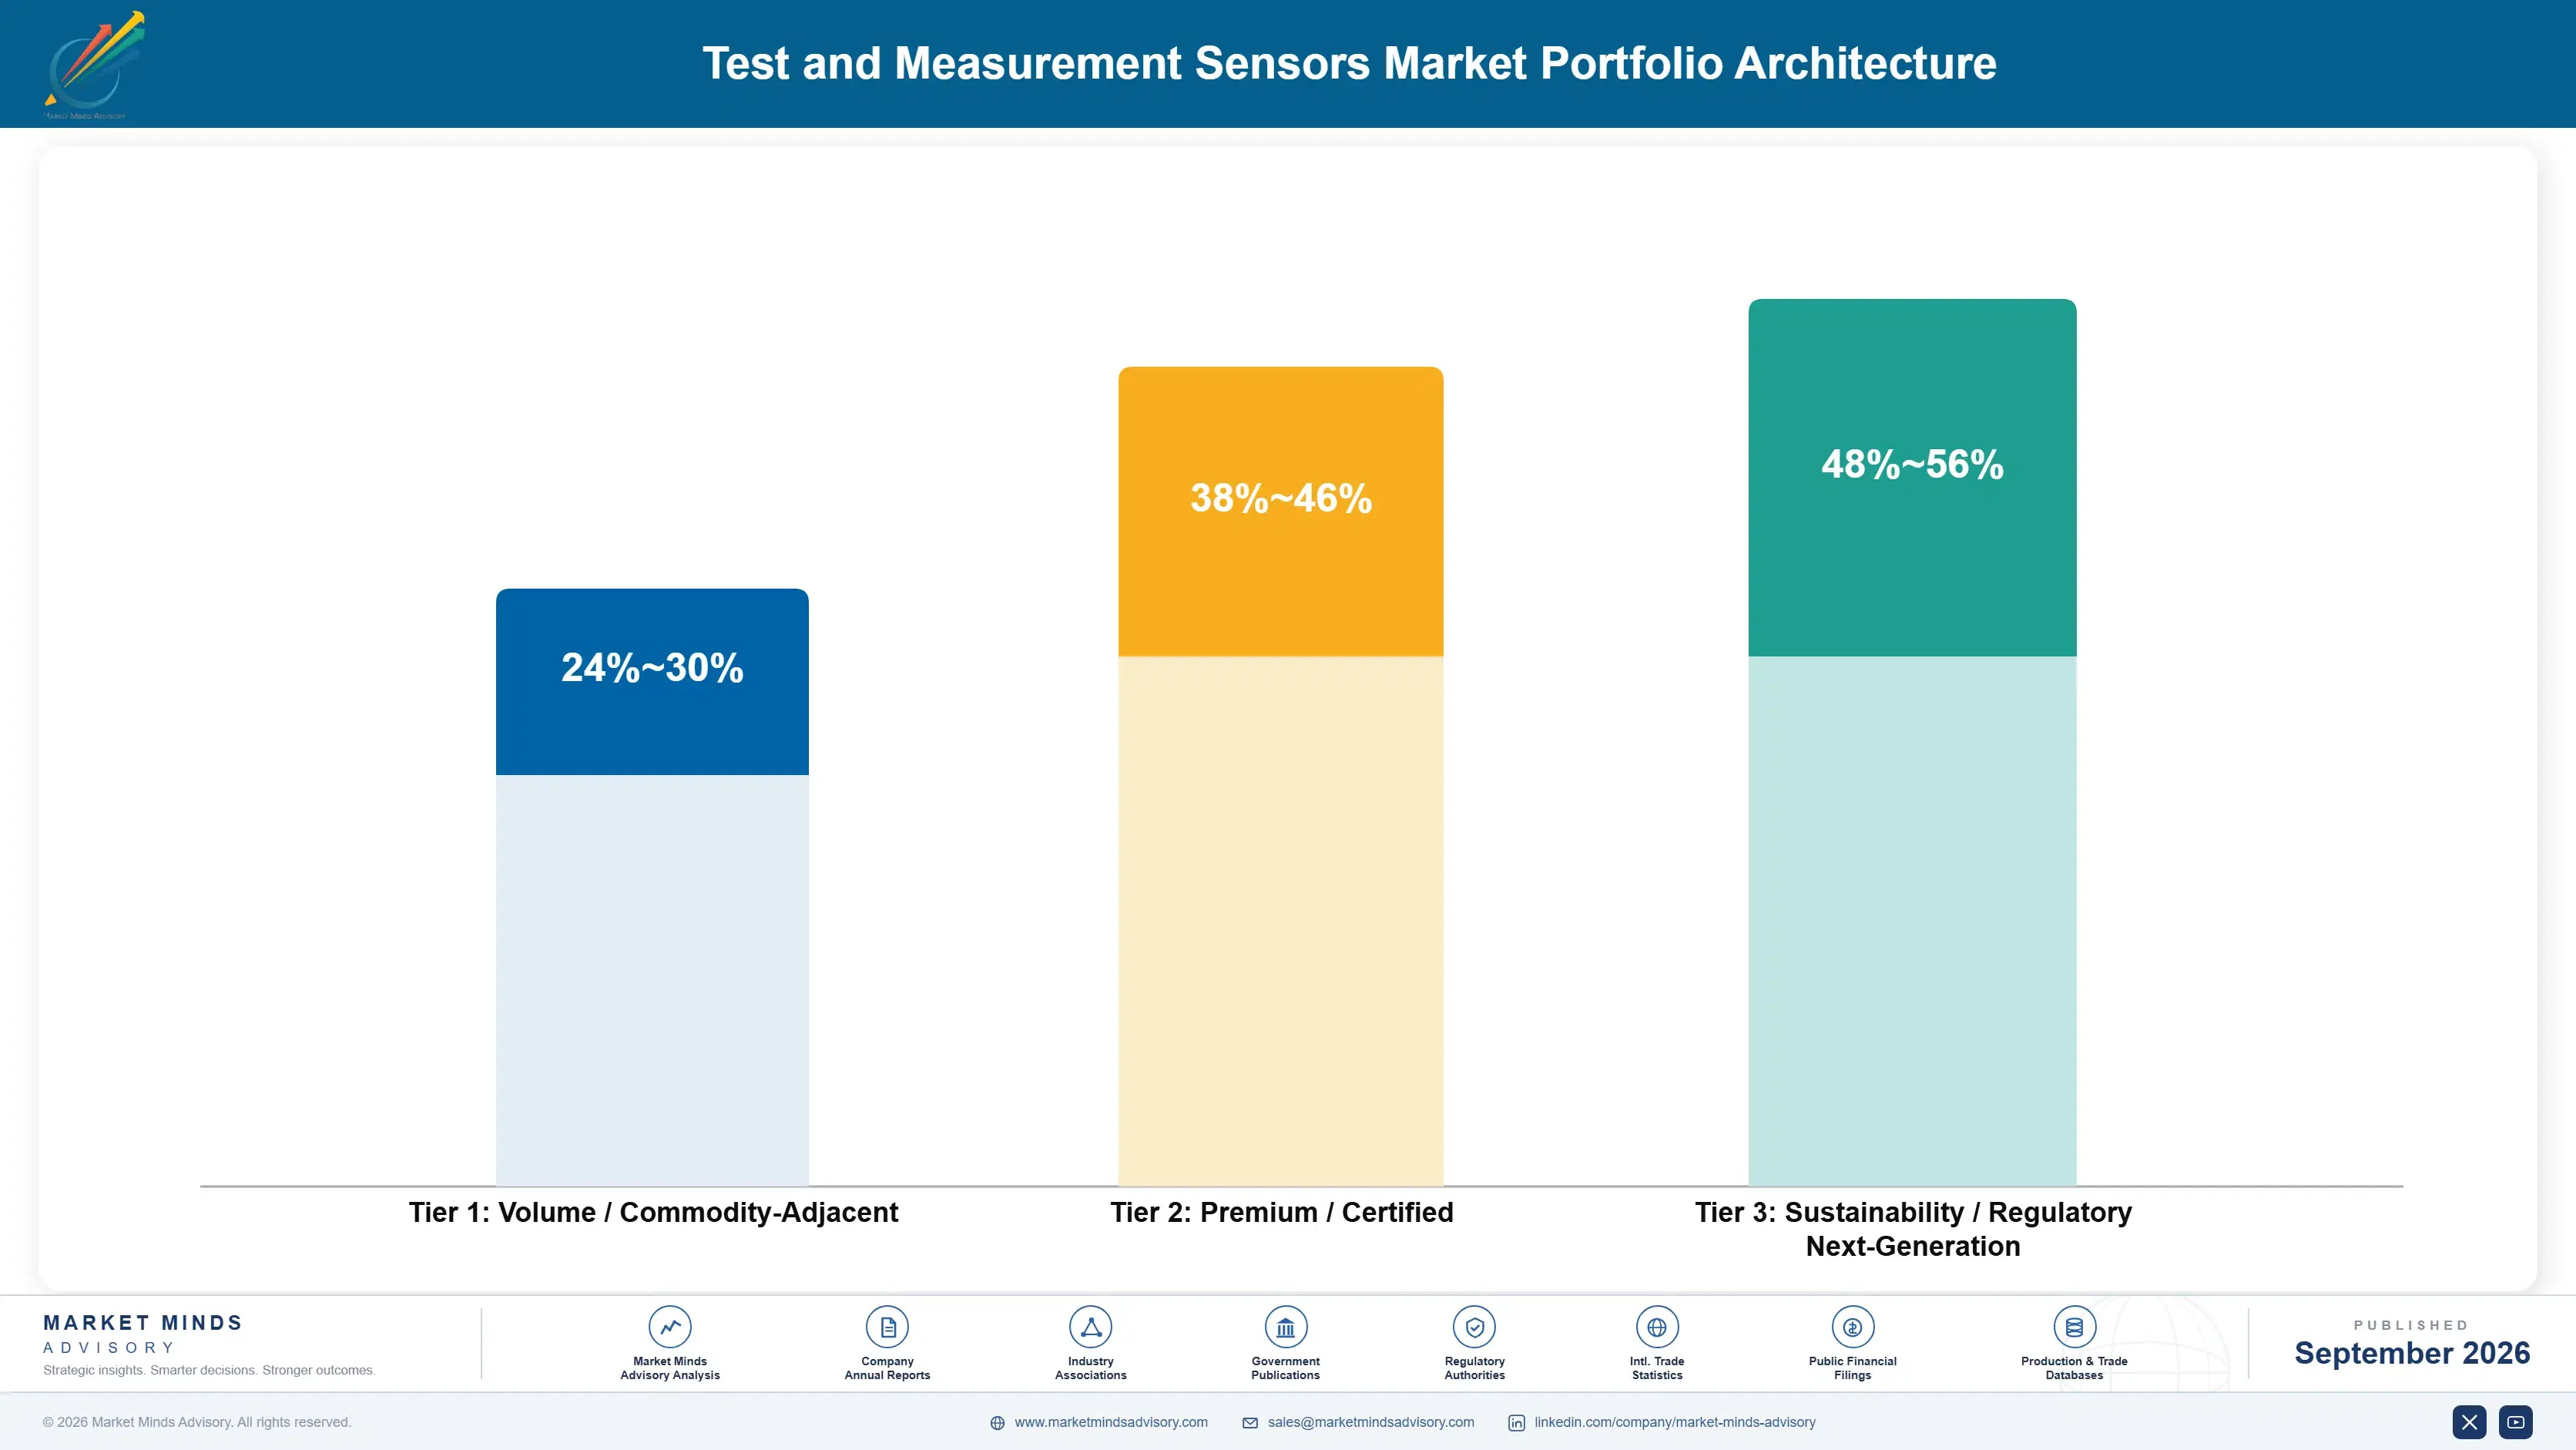
Vendor economics split along a commodity-versus-precision axis, with standard temperature and pressure sensors competing largely on price while RF, optical, and cryogenic sensors command materially higher margins tied to specialized physics engineering expertise. Gross margins across the category span a wide range depending almost entirely on which measurement domain a given vendor's product mix concentrates in most heavily. Vendors that shift product mix toward the higher tiers over time consistently outperform peers competing purely on manufacturing scale.
Volume tier vendors compete on manufacturing efficiency and broad basic feature coverage, accepting thinner margins in exchange for larger addressable customer counts across general electronics manufacturing. Premium tier vendors instead compete on measurement precision depth, since customers paying for genuine high-frequency or cryogenic capability are far less price-sensitive than buyers of standard temperature or pressure sensors alone.

High-value margin pools concentrate overwhelmingly in the sustainability and next-generation tier, where vendors combining RF and cryogenic measurement depth with genuine physics research credentials capture premiums unavailable anywhere else in the category. This concentration is pulling vendor investment away from pure volume-tier feature expansion and toward specialized measurement capability, a shift likely to reshape competitive rankings over the coming several years.

Volume / Commodity-Adjacent

Standard temperature and pressure sensors for general electronics manufacturing, competing primarily on price and manufacturing scale rather than deep feature differentiation. Margins remain thin given intense vendor competition for this large, low-differentiation customer segment.
Gross Margin: 24-30%

Premium / Certified

RF and electromagnetic sensors serving semiconductor and telecom customers requiring validated high-frequency measurement capability beyond legacy sensor architecture limits. That combination remains genuinely scarce among smaller independent vendors currently. Few vendors offer this combination.
Gross Margin: 38-46%

Sustainability / Regulatory / Next-Generation

Optical, photonic, and cryogenic sensors commanding the category's highest margins through genuine physics research expertise that competitors cannot easily replicate. Few vendors currently operate at this level consistently. This tier remains a genuine rarity.
Gross Margin: 48-56%
test-and-measurement-sensors-market-portfolio-architecture-1788420943605

High-value Sub-segments and Strategic Watch-out

RF and Electromagnetic Sensors

Highest-value, fastest-growing category as next-generation wireless infrastructure pushes measurement requirements toward frequencies most legacy sensors were never designed to capture accurately. Vendors slow to build this capability lose design wins to faster-moving competitors. Buyers now expect this natively. This capability is no longer optional anymore.
Gross Margin: high

Optical and Photonic Sensors

High-value category growing steadily as quantum computing and photonics research expands, rewarding vendors with genuine optical physics expertise over adapted electronic designs. Multi-year research funding cycles sustain adoption even during slower electronics spending periods. Contract terms often span multiple years. Vendors compete hard for this segment.
Gross Margin: high-moderate

Core Temperature and Pressure Sensors

Volume core category sustained by ongoing electronics manufacturing growth and legacy system replacement cycles, generating steady but slower-growing order volume with thinner margins. Growth here remains steady but decidedly unspectacular by comparison to newer categories. Renewal activity still dominates here. Growth trails the newer categories meaningfully.
Gross Margin: moderate

Manual Measurement to Automated Sensing Conversion

Strategic watch-out category as remaining manual measurement processes eventually convert to automated sensing, a gradual conversion wave that will taper once most holdouts transition. Vendors targeting this shift use simplified, lower-cost entry-level product lines. Few holdouts remain by comparison. Vendors now use simplified onboarding here.
Gross Margin: watch

Calibration Cycles Anchor Recurring Revenue

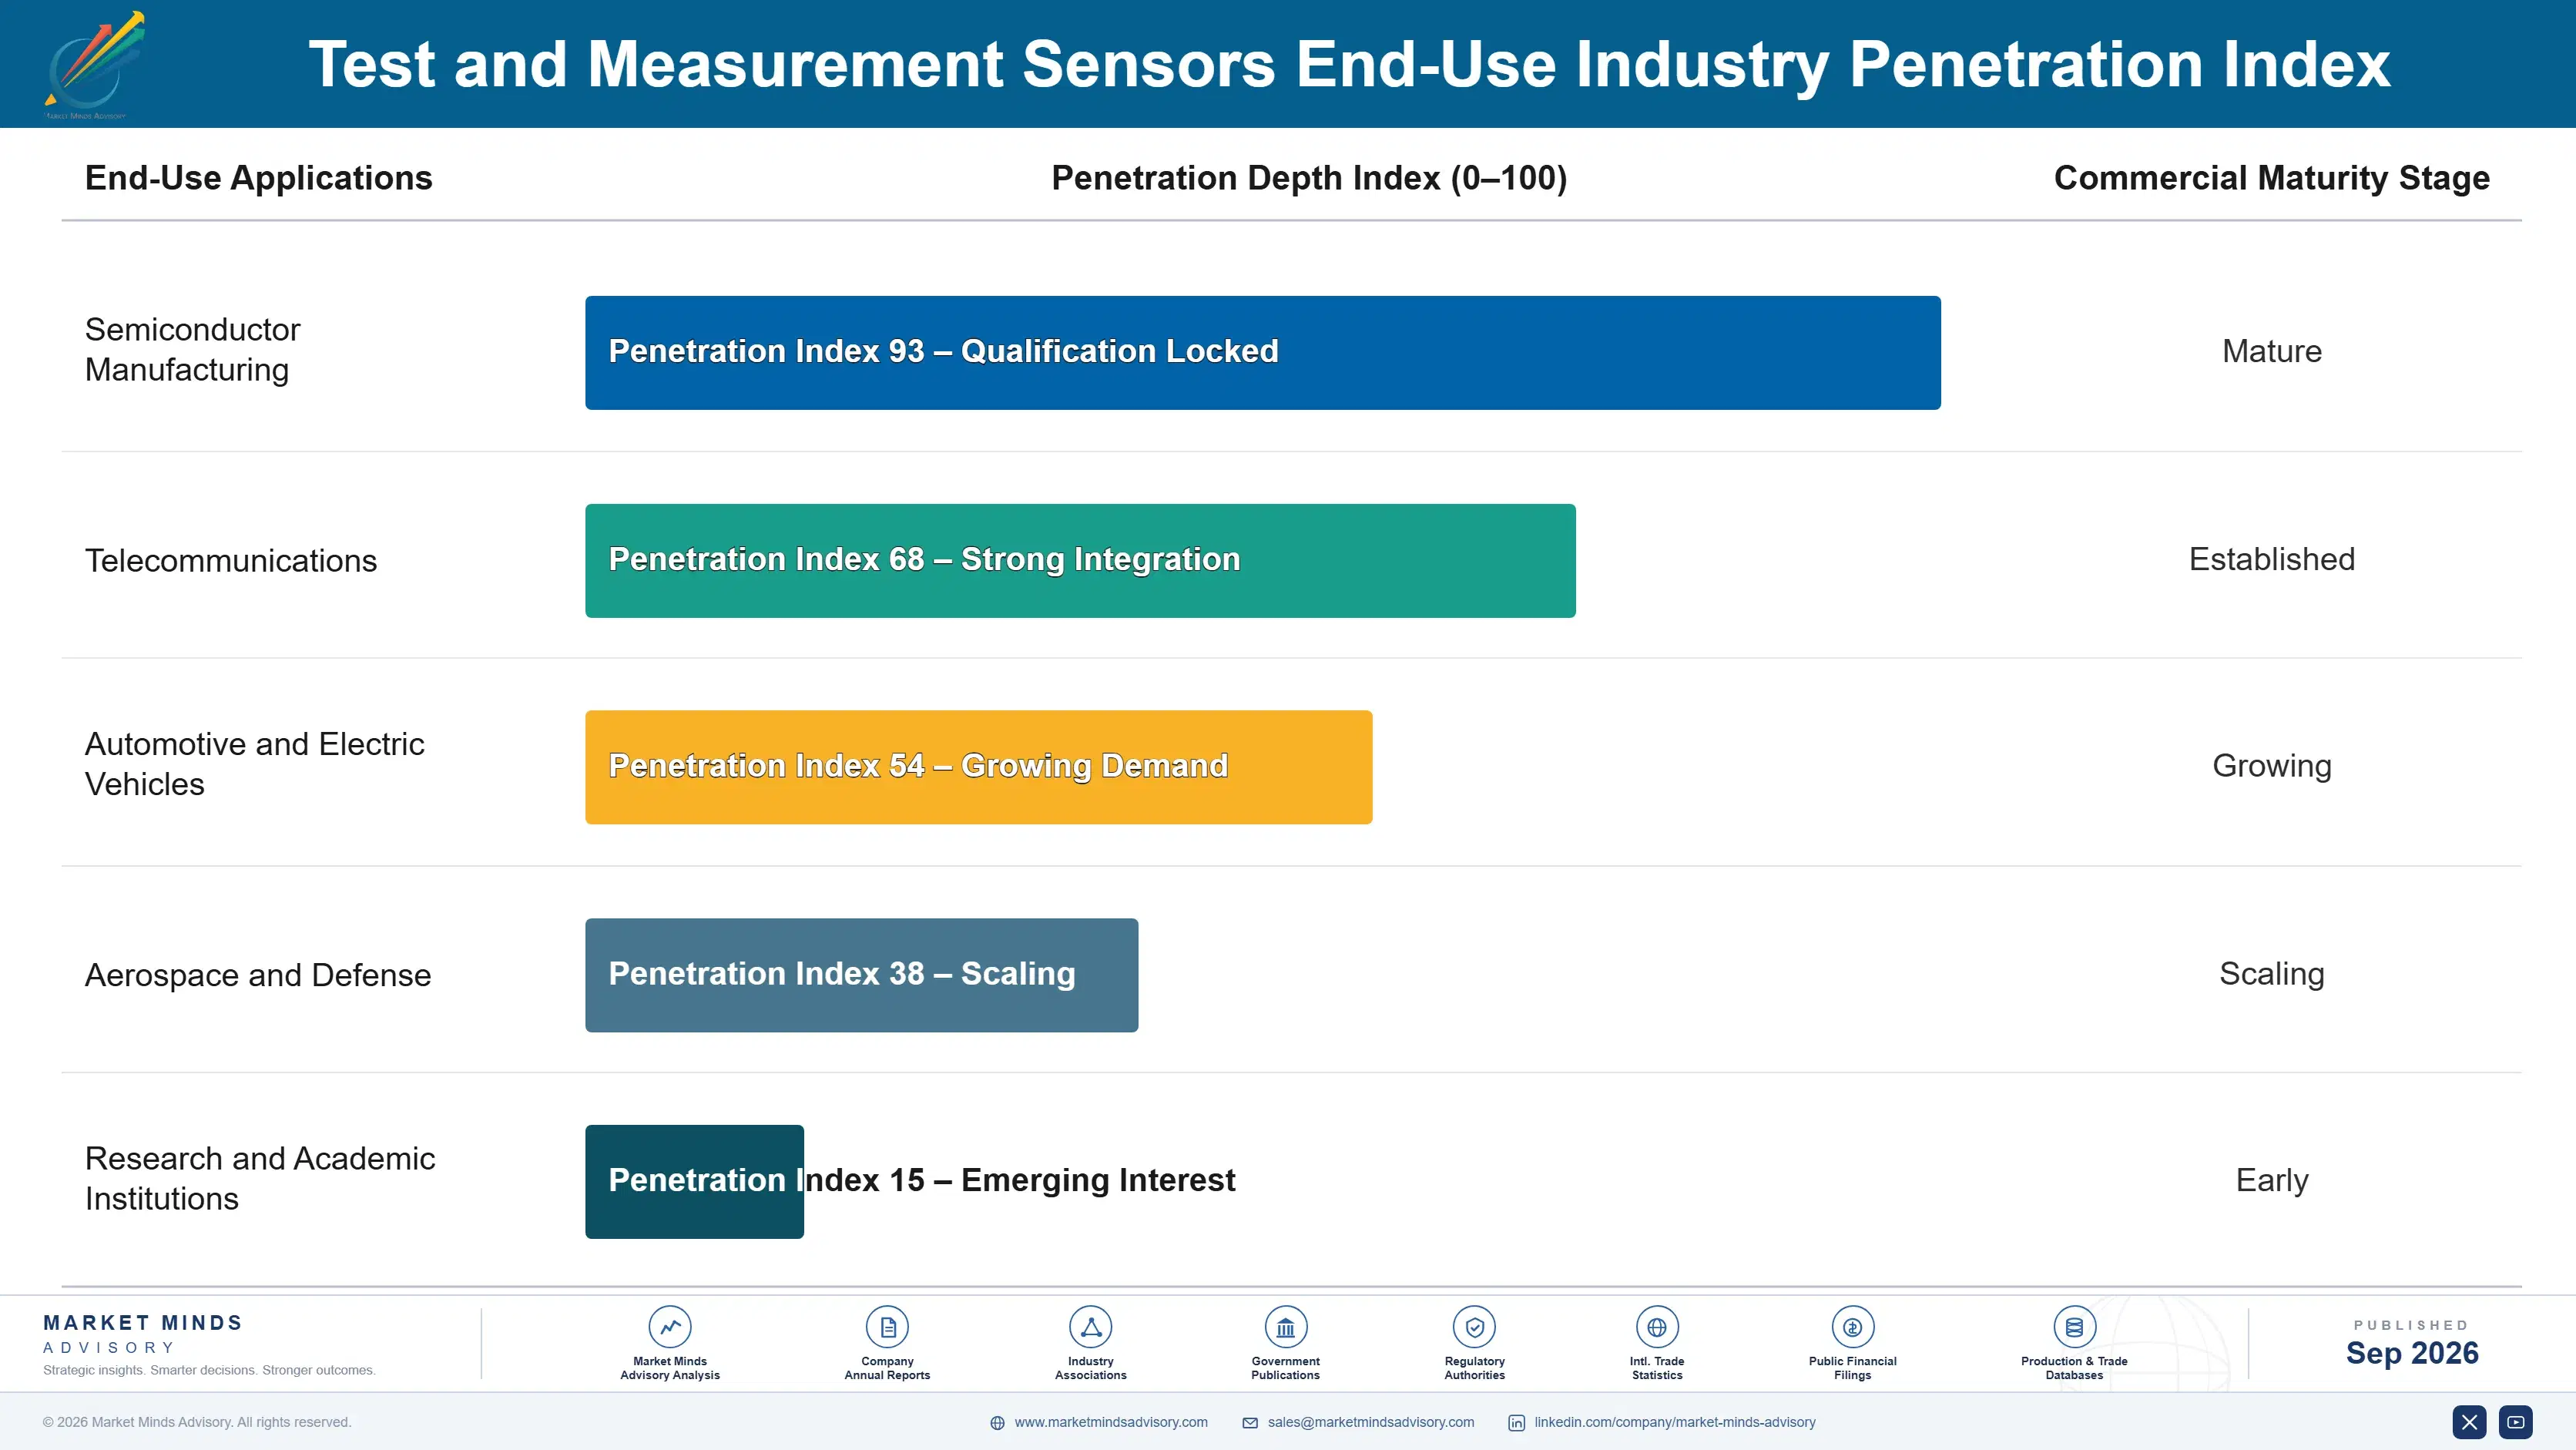
Once an engineering team qualifies a sensor for a specific test workflow and validates it against their production tolerances, switching vendors requires re-qualifying the replacement sensor across the entire test process, a project most teams avoid unless the incumbent vendor genuinely underperforms. This creates annuity-like recurring revenue through mandatory recalibration cycles that repeat every twelve to eighteen months across years of stable customer relationships.
Adoption stickiness varies by end-use vertical: semiconductor fabs with dedicated metrology teams show more willingness to evaluate alternative sensor vendors during major equipment refresh cycles, while smaller electronics manufacturers with thin technical staff show the deepest lock-in since they lack internal capacity to manage a disruptive sensor requalification project themselves. Research institutions sit closer to the fab pattern, given their generally larger dedicated technical staff and funding for equipment evaluation.

A generational shift in buyer profiles is underway as procurement decisions move from purely hardware-focused test engineers toward joint hardware-and-data-science buying committees, reflecting how software-defined measurement platforms have become a specification requirement rather than a downstream afterthought handled separately. Younger engineering leaders increasingly expect vendors to demonstrate genuine software integration capability upfront during initial evaluation rather than treating it as a later add-on purchase.
test-and-measurement-sensors-market-end-use-penetration-index-1788420944092

MMA Verdict on Test Sensors

These are among the four positions where our research anticipates prominent divergence between winners and laggards over the coming forecast period. Each is grounded in the demand model, the regulatory perimeter, and the announced capacity pipeline.
01 / HIGH-FREQUENCY PRODUCT INVESTMENT

Build genuine higher-frequency sensor capability now

Vendors still extending legacy sensor architectures are losing design wins to competitors offering genuinely new higher-frequency measurement capability, since semiconductor and telecom customers increasingly evaluate vendors specifically on frequency ceiling rather than incremental accuracy improvements alone. Building this capability within the next eighteen months positions a vendor to capture the fastest-growing segment of this market before next-generation wireless deployment volume accelerates further across major telecom operators worldwide. Waiting longer risks permanent exclusion from advanced design-in opportunities across the entire product category.
02 / QUANTUM RESEARCH PARTNERSHIP

Pursue co-development partnerships with quantum labs

Quantum computing research institutions represent a genuinely underexploited customer segment for vendors whose customer base remains concentrated in traditional semiconductor and telecom manufacturing test applications today. Establishing formal co-development partnerships with leading quantum research institutions now positions a vendor to define emerging cryogenic sensor specifications before competitors establish comparable relationships and capture the associated design-win exclusivity across the category. This is a genuine near-term window worth pursuing aggressively before competitors close it entirely across the entire broader quantum research market.
03 / CALIBRATION SERVICE EXPANSION

Build managed calibration renewal subscription services

Vendors without managed calibration renewal services are leaving genuine recurring revenue on the table, since customers with large sensor fleets consistently struggle to track dozens or hundreds of individual certification expiration dates manually. Building this capability requires modest incremental investment relative to existing calibration infrastructure already in place at most established vendors serving enterprise accounts. This makes it a genuinely accessible near-term margin expansion opportunity worth prioritizing immediately across the entire installed customer base and every currently active product line.
04 / MATERIAL SUPPLY RESILIENCE

Diversify rare earth suppliers before next disruption

The 2022 rare earth element supply disruption exposed how concentrated qualified material supply really is, and vendors who have not yet diversified suppliers across multiple geographies remain exposed to the same risk recurring at any point as demand for specialized sensor coatings continues growing steadily. Requalification takes months per material grade, meaning vendors who start today are meaningfully protected before the next plausible disruption event, while those who wait risk repeating the same costly delays. This is a near-term priority.

Engagement Snapshot From the Field

A live engagement with an industry participant carrying material or product regulatory and market exposure ahead of a defining policy shift, showing how our research translates into a defensible multi-year portfolio strategy.
MARKET MINDS ADVISORY · CLIENT ENGAGEMENT SUMMARY
Test and Measurement Sensors Producer Strategic Portfolio Review and Transition Roadmap 2026·Investment Scenario on Test and Measurement Sensors Exposure Evaluation 2025-26
CLIENT PROFILE
The client is an automotive semiconductor test facility validating power management chips for electric vehicle applications, generating approximately $340 million in annual revenue (client-reported, unverified by MMA) prior to this engagement. The company had relied on legacy current and voltage sensors originally designed for internal combustion vehicle electronics, increasingly inadequate for validating high-power battery management chips.
STRATEGIC CHALLENGE
Rising demand for electric vehicle power management chip validation was exposing measurement gaps in the client's legacy sensor fleet, with several recent test failures traced to sensor accuracy limits rather than genuine chip defects. Leadership needed an objective evaluation of whether to upgrade the existing sensor fleet incrementally or invest in a comprehensive modernization program.
MMA APPROACH
MMA conducted structured interviews with the client's test engineering, quality assurance, and procurement teams alongside a comparative evaluation of three candidate sensor vendors against measurement accuracy, calibration support, and total cost of ownership over a five-year horizon. The analysis modeled expected test accuracy improvement and false failure reduction under each vendor option relative to the client's existing baseline.
KEY FINDINGS
  1. The client's legacy sensor fleet was generating an estimated 8 percent false failure rate on high-power battery management chip validation tests annually.
  2. Two of the three evaluated vendors could deliver validated high-power measurement sensors within four months given existing product line availability and stock.
  3. Full sensor fleet modernization carried an estimated $2.8 million in total cost (client-reported, unverified by MMA) with a projected sixteen-month payback horizon.
  4. Modeled false failure rate reduction from modernized sensors reached roughly 6 percentage points once fully deployed across all active production test benches.
CLIENT PROFILE
The client is an automotive semiconductor test facility validating power management chips for electric vehicle applications, generating approximately $340 million in annual revenue (client-reported, unverified by MMA) prior to this engagement. The company had relied on legacy current and voltage sensors originally designed for internal combustion vehicle electronics, increasingly inadequate for validating high-power battery management chips.
STRATEGIC CHALLENGE
Rising demand for electric vehicle power management chip validation was exposing measurement gaps in the client's legacy sensor fleet, with several recent test failures traced to sensor accuracy limits rather than genuine chip defects. Leadership needed an objective evaluation of whether to upgrade the existing sensor fleet incrementally or invest in a comprehensive modernization program.
MMA APPROACH
MMA conducted structured interviews with the client's test engineering, quality assurance, and procurement teams alongside a comparative evaluation of three candidate sensor vendors against measurement accuracy, calibration support, and total cost of ownership over a five-year horizon. The analysis modeled expected test accuracy improvement and false failure reduction under each vendor option relative to the client's existing baseline.
KEY FINDINGS
  1. The client's legacy sensor fleet was generating an estimated 8 percent false failure rate on high-power battery management chip validation tests annually.
  2. Two of the three evaluated vendors could deliver validated high-power measurement sensors within four months given existing product line availability and stock.
  3. Full sensor fleet modernization carried an estimated $2.8 million in total cost (client-reported, unverified by MMA) with a projected sixteen-month payback horizon.
  4. Modeled false failure rate reduction from modernized sensors reached roughly 6 percentage points once fully deployed across all active production test benches.
RECOMMENDED STRATEGY
Phase 1: Phase one: replace sensors on the highest-volume test benches first, prioritizing lines validating the newest battery management chip designs currently in production. Phase 2: Phase two: migrate remaining test benches over six months, retiring legacy sensors as new units complete qualification testing successfully and reliably. Phase 3: Phase three: renegotiate vendor calibration support terms to include proactive recertification scheduling across the entire modernized sensor fleet going forward.
OUTCOME
The client completed sensor fleet modernization within seven months, ahead of the original nine-month target, reducing false failure rates from 8 percent to under 2 percent (client-reported, unverified by MMA). Test throughput improved meaningfully as engineers spent less time investigating false failures. The engagement also improved engineer confidence in test results overall.

Frequently Asked Questions

Foundational context covering the market sizes, CAGR, scope, country, region and competition that inform every finding below. This section is provided to cover basics and most often pre-purchase conversations, answered from the MMA Primary Research Dataset.

What is the current size of the Test and Measurement Sensors Market?

The market is valued at $8.9 billion in 2025 on a global vendor revenue basis. This figure covers precision sensors used in electronic test and measurement instrumentation.

How large will the Test and Measurement Sensors Market be by 2036?

The market is projected to reach $19.72 billion by 2036. Growth is driven primarily by semiconductor node advancement and next-generation wireless infrastructure demand worldwide today.

What is the CAGR for the Test and Measurement Sensors Market 2026 to 2036?

The market is expected to grow at a CAGR of 7.5 percent between 2026 and 2036. This reflects steady demand tied to precision manufacturing and research.

Which segment is growing fastest?

RF and Electromagnetic Sensors lead at an 11.0 percent CAGR, roughly 1.47 times the overall market rate. Next-generation wireless infrastructure drives this segment's outsized growth.

Who are the major companies in the Test and Measurement Sensors Market?

Keysight Technologies, National Instruments, Tektronix, Rohde & Schwarz, and Fluke lead the competitive landscape. Together the top five vendors hold 46 percent of global revenue.

Which country is growing fastest?

India leads at a 13.5 percent CAGR, driven by its expanding domestic semiconductor manufacturing ambitions under a national chip production incentive program. This outpaces every other country tracked.

Report Segmentation Architecture

The full report scope spans multiple orthogonal segmentation dimensions, with cross-tabulated demand data provided for each dimension pair. Coverage extends further to regional breakdowns, trend trajectories, and the competitive detail needed to support segment-level decision-making.

By Primary Market Dimension

  • Temperature and Thermal Sensors
  • Pressure Sensors
  • Vibration and Motion Sensors
  • RF and Electromagnetic Sensors
  • Optical and Photonic Sensors
  • Current and Voltage Sensors

By End-Use Industry

  • Semiconductor Manufacturing
  • Telecommunications
  • Automotive and Electric Vehicles
  • Aerospace and Defense
  • Research and Academic Institutions

By Commercial Dimension

  • Direct Vendor Sales
  • Distributor and Reseller Channel
  • Calibration and Managed Services
  • Co-Development Partnerships

By Region

  • North America
  • Western Europe
  • East Asia
  • South Asia and Pacific
  • Latin America
  • Middle East and Africa
  • Eastern Europe

Scope, Methodology, and Coverage

Every figure in this report is reproducible from documented input assumptions. The scope below maps the historical period, the forecast horizon, the segmentation dimensions, and the countries covered, alongside the underlying primary and qualitative methodology.
Historical Period
2020 to 2025
Forecast Period
2026 to 2036
Base Year
2025 (USD billions; MMA Primary Research Dataset, September 2026)
Market Definition
This report covers precision sensors used in electronic test and measurement instrumentation, including temperature, pressure, vibration, RF, optical, and current sensing components integrated into benchtop and automated test equipment, measured on a global vendor revenue basis. It excludes finished test equipment systems sold without a dedicated sensor component focus.
Quantitative Units
USD billions, vendor revenue basis
Segmentation Dimensions
Measurement type (temperature, pressure, vibration, RF, optical, current/voltage)
Regions Covered
North America, Western Europe, East Asia, South Asia and Pacific, Latin America, Middle East and Africa, Eastern Europe
Countries Covered
United States, Taiwan, South Korea, Japan, Germany, India, China, and 18 additional countries across all seven regions
Key Companies Profiled
Keysight Technologies, National Instruments, Tektronix, Rohde & Schwarz, Fluke, and 15 additional named vendors
Quantitative Methodology
Primary survey, n=3,800 respondents, Q4 2025, six countries; demand-side model with trade association cross-validation
Qualitative Methodology
47 expert interviews, Q4 2025; applied to validate demand model assumptions, identify emerging dynamics, and assess competitive positioning
Report Format
PDF and XLSX data workbook (Word format preview document)
Publisher
Market Minds Advisory
Report Code
MMA-2026-TEC-142
Published
September 2026
Contact
sales@marketmindsadvisory.com | www.marketmindsadvisory.com

Purchase the full Test and Measurement Sensors Market Report (2026 to 2036).

This report delivers a comprehensive analysis of the global test and measurement sensors market through 2036. It combines primary survey data from 3,800 respondents across six countries with 47 expert interviews conducted in Q4 2025, alongside company disclosures and published semiconductor industry data. Coverage spans market sizing, segmentation by measurement type, regional dynamics across all seven regions, competitive positioning among twenty named vendors, material cost exposure, and forward-looking strategic verdicts. The analysis is designed for engineering, procurement, and investment decision-makers evaluating this precision-driven instrumentation category.
Full 2020-2036 historical and forecast data
Detailed segmentation by physical measurement type
All seven regional market breakdowns included
Competitive profiles of twenty named vendors
Material and calibration cost exposure analysis
Strategic revenue lever and verdict recommendations

Built For The People Who Decide

From boardroom strategy to bench-side execution, this report is read cover-to-cover by leaders shaping the next decade of their industry, turning demand scenarios, market dynamics and valuation benchmarks into decisions.
CXOs/ Presidents/ VPs/ Managers
M&A and Corporate Development
Strategy Teams and R&D Heads
Procurement and Product Directors
Regulatory and Compliance Leaders
Investor Relations and Equity Analysts