Market Minds Advisory
Temperature Controlled Packaging Solutions Market

Temperature Controlled Packaging Solutions Market: The Validation File Is Worth More Than The Box

A commercial reading of thermal shipping systems, where a single temperature excursion destroys a consignment worth more than a year of packaging spend, and qualification rather than price decides who supplies it.

Lead Analyst

Bilal Shaikh

Published

September 2026

Make Smarter Decisions with Customized Research Insights

Request a free sample report and evaluate market opportunities, growth trends, and competitive dynamics relevant to your business needs.

2025 MARKET VALUE$13.6BMarket Size 2025
2036 FORECAST VALUE$35.1BBase Case , 2026 to 2036
CAGR 2026 TO 20369.0 %Bull 10.2% / Bear 7.8%
INCREMENTAL OPPORTUNITY$20.3BNet 10- year value creation
EXPANSION MULTIPLE2.37x2036 value over 2026 base
Strategic Levers
M&A Pipeline
Regional Outlook
Country Rankings
Competitive Intelligence
Segmental Deep-dive
Call-Us : 91 93563 13602

Executive Snapshot and Market Trajectory

Nobody in pharmaceutical logistics buys packaging on price. A biologic consignment can be worth several million dollars and a two-hour excursion above eight degrees destroys all of it, so the qualification file matters far more than the unit cost ever will. That inversion shapes the whole market.
The market stands at USD 13.6 billion in 2025 and reaches USD 35.08 billion by 2036 at a 9.0% CAGR. Cryogenic systems grow fastest at 12.2%, about 1.36 times the overall rate, as cell and gene therapies ship at temperatures conventional packaging cannot hold. North America holds 30% of value on pharmaceutical manufacturing and clinical trial volume, while India posts the quickest national growth at 13.2%.
Fragmentation is moderate, with the top five holding roughly 34% of thermal packaging revenue across single-use and reusable models that barely compete on the same terms. Two forces pull against each other. Qualification lock-in protects incumbents on validated lanes for years at a time, while reusable container fleets and sustainability targets are pushing shippers to reopen files they had every reason to leave closed. Both arguments end up in the same validation committee.
Market Definition
The temperature controlled packaging solutions market covers thermal protection systems used to hold a defined temperature range around a shipment in transit, spanning insulated parcel and pallet shippers, phase change and gel refrigerants, vacuum insulated panel systems, reusable thermal containers, and cryogenic dry vapour shippers. Refrigerated transport equipment and reefer containers, monitoring devices and data loggers sold separately, cold chain logistics and freight services, primary product packaging and barrier films sold as a performance packaging category, and warehouse refrigeration are excluded.
Base Year Value
$13.6B in 2025 (MMA Primary Research Dataset, August 2026)
Forecast Period
2026 to 2036, eleven discrete annual values
CAGR
9.0% base case. Bull 10.2%. Bear 7.8%.
Fastest Growth Segment
Cryogenic Systems: 12.2% CAGR
Fastest Growth Country
India: 13.2% CAGR
Fastest Growth Region
South Asia and Pacific: 11.2% CAGR
Largest Region
North America: 30% of 2025 global value
Market Leaders
Sonoco ThermoSafe, Pelican BioThermal, Cold Chain Technologies, va-Q-tec, CSafe. Source: MMA Analysis based on company annual reports.
Primary Survey
n=3,800 procurement and R&D decision-makers, Q4 2025, six countries
Methodology
Demand-side build-up, cross-validated against public data, 47 expert interviews

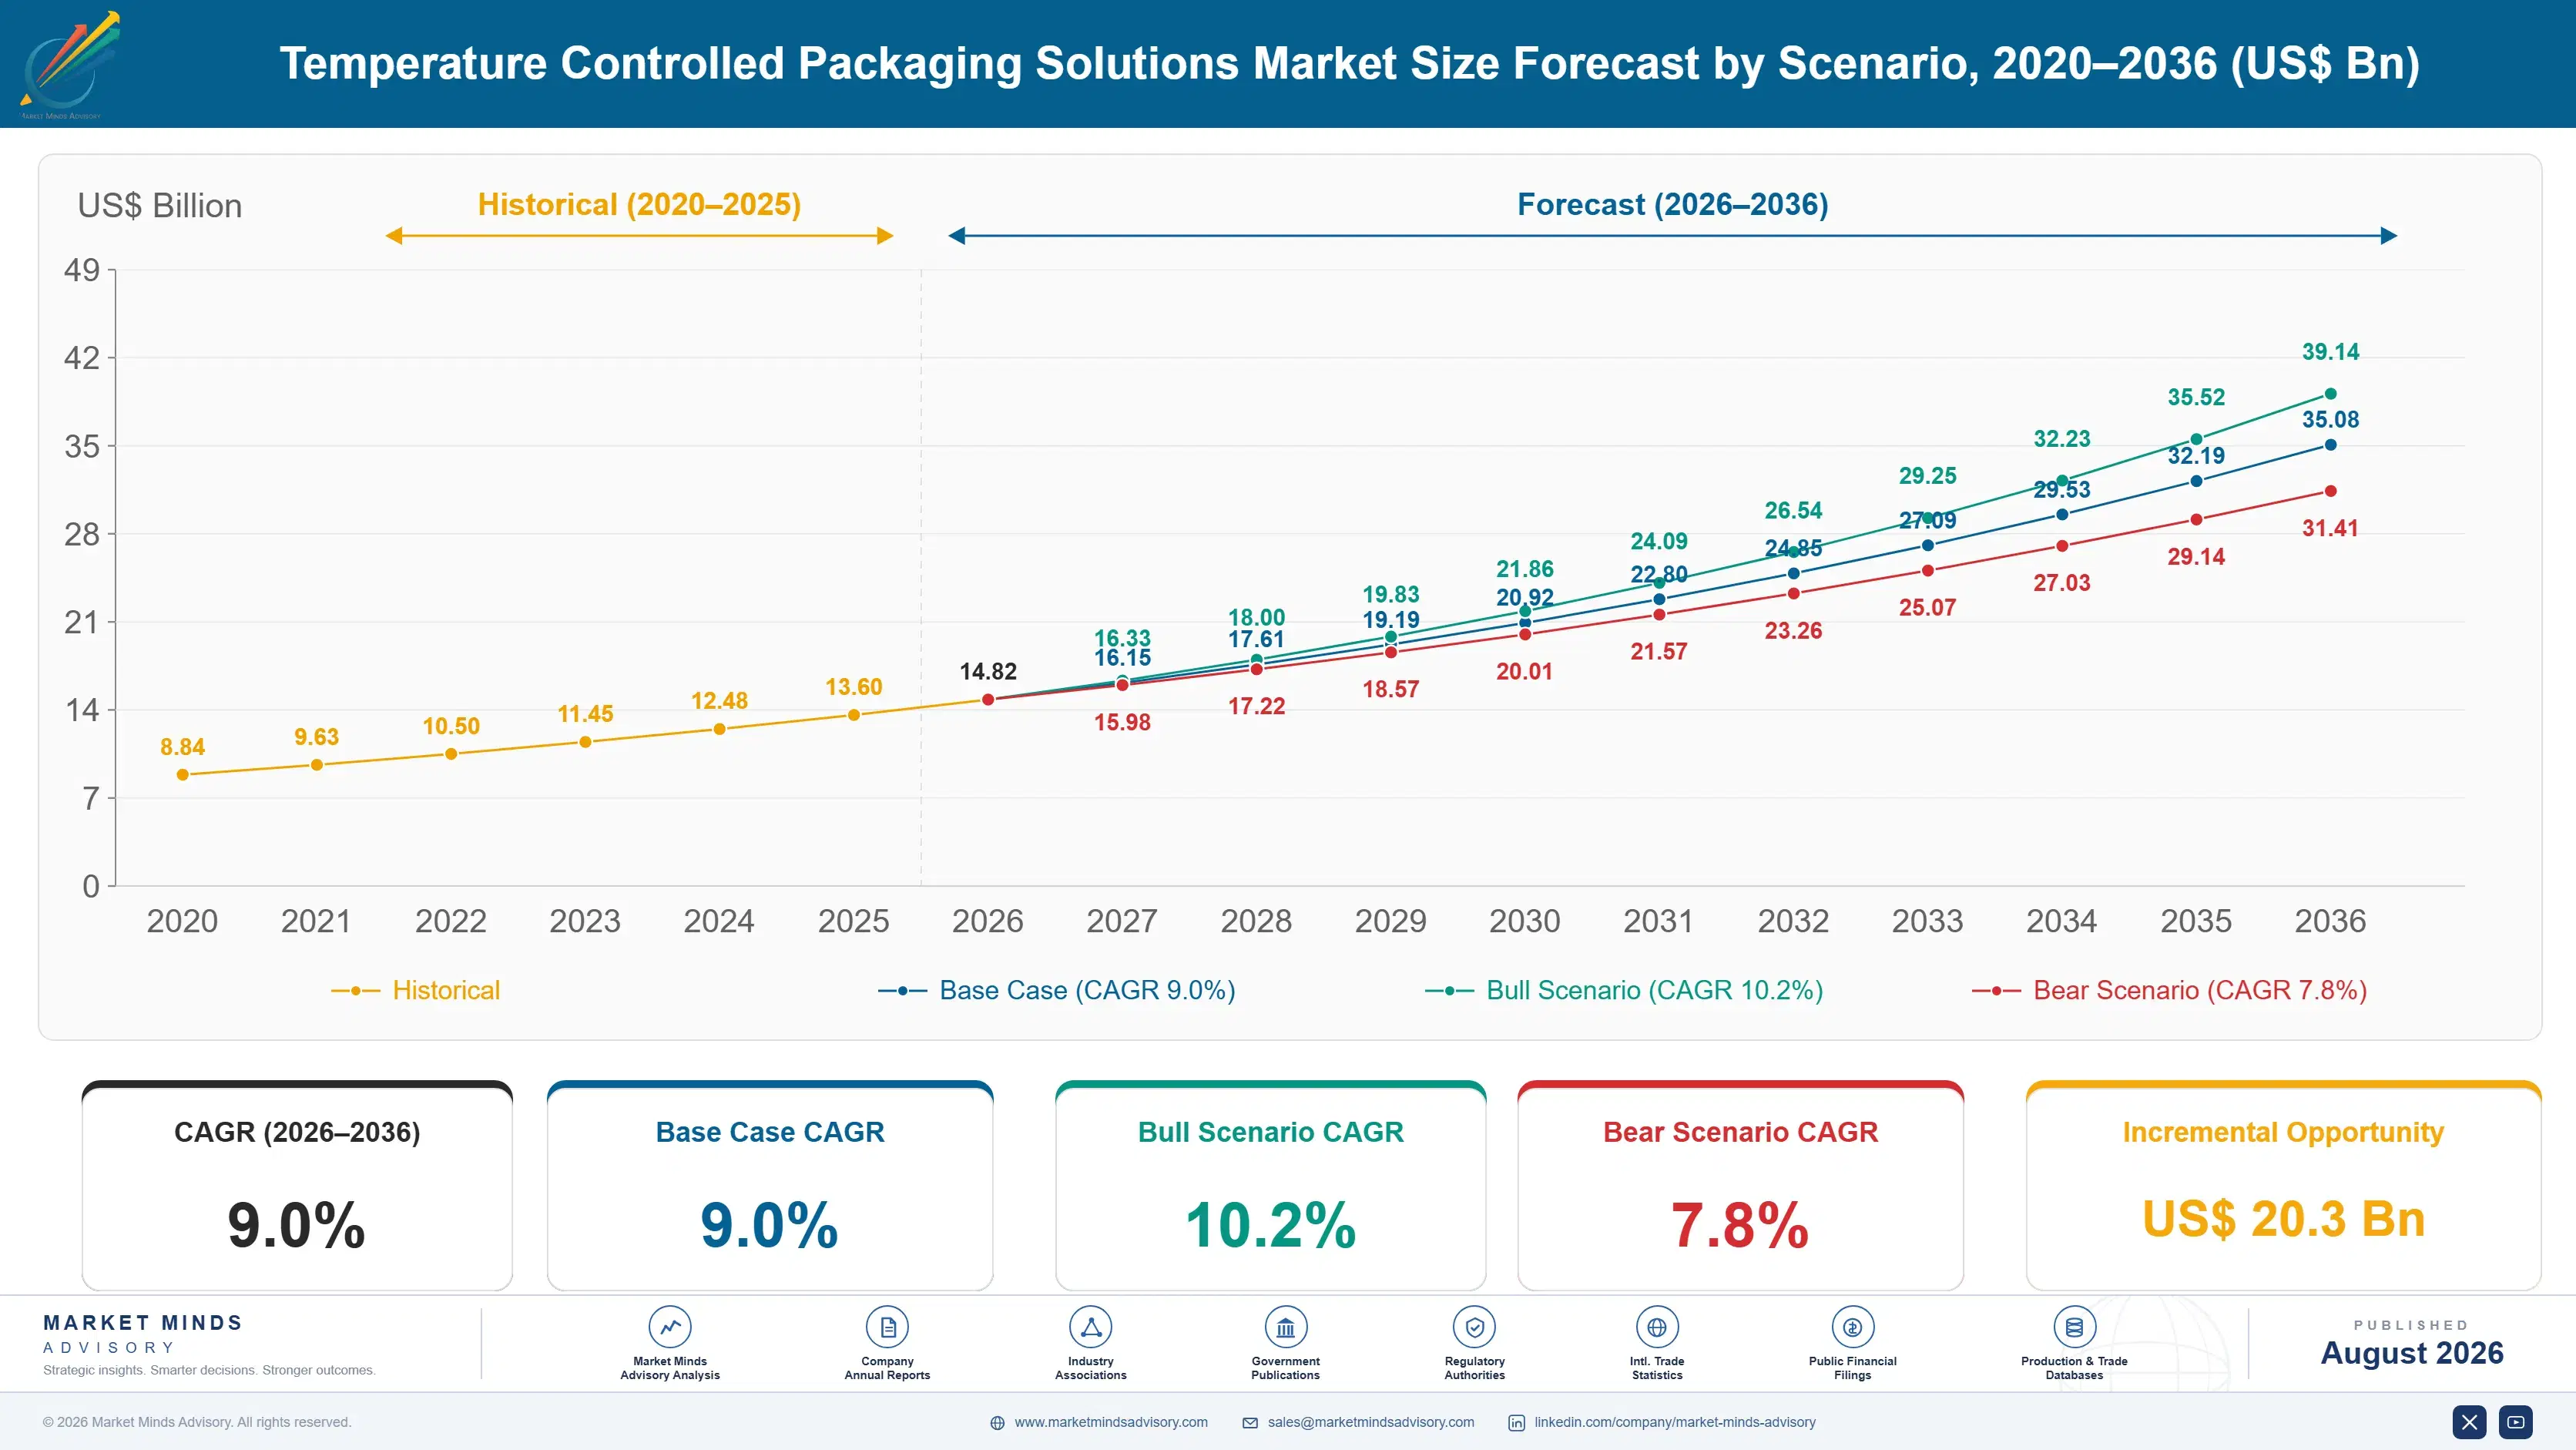
Temperature Controlled Packaging Solutions Market Forecast Scenarios

temperature-controlled-packaging-market-2-size-forecast-scenario-1787324668634
Growth from 2020 to 2025 compounded near 8.0%, and vaccine distribution rather than underlying demand set the pattern. Deep frozen and ultra-cold shipping capacity was built at extraordinary speed through 2021, then sat idle as programmes wound down. Biologics and clinical trial volumes carried the market afterwards. Reusable container fleets also gained ground during that period because single-use supply simply ran out.
Three mechanisms carry the base case to 9.0%. First, biologics mix, since a growing share of pharmaceutical pipelines requires refrigerated or frozen handling that small molecules never did. Second, direct-to-patient and decentralised trial shipping, which multiplies the number of individual parcels moving under temperature control rather than consolidating them onto pallets. Third, regulatory tightening on good distribution practice, which converts temperature assurance from a commercial preference into a documented obligation with audit consequences.
The bull case at 10.2% assumes cell and gene therapy approvals arrive on schedule and reusable fleets expand into lanes single-use still holds. The bear case at 7.8% assumes biosimilar pricing pressure pushes shippers toward cheaper thermal solutions, air freight capacity normalises enough to shorten transit durations, and validated single-use systems keep their positions because nobody wants to requalify a working lane.

Qualification Beats Price In Every Cold Lane

Demand rests on three foundations. Product value provides the pricing power, since a thermal system costing 0.3% to 2% of consignment value protects goods whose loss nobody will explain twice. Biologics mix provides the volume growth, as pipelines shift toward molecules that cannot survive ambient handling. And regulation provides the floor, because good distribution practice makes documented temperature assurance an audit obligation rather than a service choice.
MARKET CONCENTRATIONCR5: 34%Moderately fragmented across single-use and reusable business models
EXCURSION LOSS RATEAbout 2%Pharmaceutical shipments recording a temperature deviation in transit
PACKAGING COST SHARE0.3% to 2%Thermal system as a portion of consignment value
QUALIFICATION TIMELINE4 to 9 monthsValidation work behind approving one lane and system
REUSABLE FLEET SHAREAbout 27%Volume moving in returnable containers rather than single-use
CONTAINER ROTATION CYCLE18 to 40 daysTime a reusable unit takes to return for reissue
Commercially, everything turns on the validation file. Qualifying one system on one lane takes four to nine months of thermal mapping, transit simulation, and documentation, after which nobody reopens it without a reason. That is why incumbents hold positions for years and why a challenger with a better container often cannot get a hearing. Excursion rates near 2% keep the subject alive.
The decade ahead turns on the single-use and reusable split. Reusable fleets already carry about 27% of volume and win on cost per shipment wherever rotation cycles hold at 18 to 40 days, though they need reverse logistics that many lanes cannot support. Sustainability reporting is pushing shippers toward them faster than pure economics would. Cryogenic requirements sit outside that debate entirely.
"Ask a quality director to switch thermal systems and you are not asking about packaging, you are asking them to reopen a validated file and sign their name to it. That is why the cheapest qualified box beats the best unqualified one every single time."
Director, Cold Chain and Life Science Packaging Practice · MMA Packaging / Cold

Market Trends

Cell And Gene Therapies Demand Cryogenic Shipping

Cryogenic systems grow at 12.2% against a market at 9.0%, driven by autologous cell therapies and viral vector products that must hold minus 150 degrees or lower from apheresis to infusion. Each shipment is patient-specific and irreplaceable, so there is no acceptable failure rate and no substitute consignment waiting. Dry vapour shippers and liquid nitrogen dewars carry most of this volume today, with condition monitoring and chain of identity documentation treated as part of the packaging rather than an add-on. Volumes are small and the value per shipment is extraordinary. Nothing about it resembles parcel shipping.
Market Impact: About 50% of approvals need it
Reusable Container Fleets Displace Single-Use Systems

Reusable thermal containers now carry roughly 27% of temperature-controlled volume, and cost per shipment beats single-use comfortably wherever rotation cycles stay inside 18 to 40 days. Sustainability reporting has accelerated adoption beyond what the economics alone justified, since a returnable container removes recurring waste that appears directly in packaging reduction targets. The constraint is reverse logistics: a container stranded at a destination without a return route is worse than a box that was always going to be discarded. Lane density decides whether the model works. Thin lanes still favour single-use by a wide margin.
Market Impact: One pallet becomes 40 parcels

Market Opportunities and Growth Drivers

Biologics Pipelines Require Refrigerated Or Frozen Handling

A rising share of pharmaceutical development pipelines consists of monoclonal antibodies, vaccines, cell therapies, and other biologics that degrade outside narrow temperature windows, where small molecule tablets travelled ambient for decades without incident. That shift converts temperature control from a specialist service into a default requirement across a widening share of shipments. Clinical trial supply amplifies it further, since investigational biologics move in small quantities to many sites under the same conditions the commercial product will need. The trend runs on approval pipelines rather than logistics decisions. Roughly half of new approvals now need it.
Market Impact: Qualification takes 4 to 9 months

Direct-To-Patient Shipping Multiplies Individual Parcel Volumes

Decentralised clinical trials and home delivery of specialty medicines send single patient quantities to residential addresses rather than consolidating them onto pallets bound for a distribution centre. One pallet becomes 40 parcels, each needing its own qualified thermal system, its own duration profile, and its own excursion documentation. Ambient conditions at a doorstep are also far less predictable than a loading dock, which pushes duration requirements longer than lane transit time alone would suggest. Each of them carries its own excursion liability and its own paperwork. Qualification work has grown accordingly for every supplier.
Market Impact: Rotation must close in 40 days

Market Restraints and Challenges

Qualification Timelines Freeze Lanes Against Better Alternatives

Approving one thermal system on one lane takes four to nine months of thermal mapping, transit simulation, stability assessment, and documentation, and quality organisations will not repeat that work without a compelling reason. The root cause is that validation carries regulatory liability, so a quality director who reopens a working file owns any consequence that follows. Commercially this locks incumbents in and keeps better systems out. Challengers mitigate by targeting new lanes and new products rather than established ones, offering qualification support at their own cost, and entering through clinical trial supply where files are being written anyway.
Market Impact: Systems hold minus 150 degrees

Reverse Logistics Limits Where Reusables Actually Work

A reusable container only earns its cost advantage if it comes back, and on thin lanes into secondary markets it frequently does not. The root cause is asymmetric freight: return legs cost real money, customs treatment of empty containers varies by jurisdiction, and consignees have no incentive to arrange collection. Commercially this strands assets and destroys the rotation economics the model depends on. Participants mitigate through third-party collection networks, deposit and penalty terms written into shipping contracts, hybrid fleets that use single-use on thin lanes, and rental models that put recovery risk on the supplier.
Market Impact: Reusables carry 27% of volume
4 additional market trends, 3 additional growth drivers, and 2 additional restraints and challenges are covered in the full report. Contact sales@marketmindsadvisory.com to access the complete intelligence.

Segment CAGR and Growth Architecture

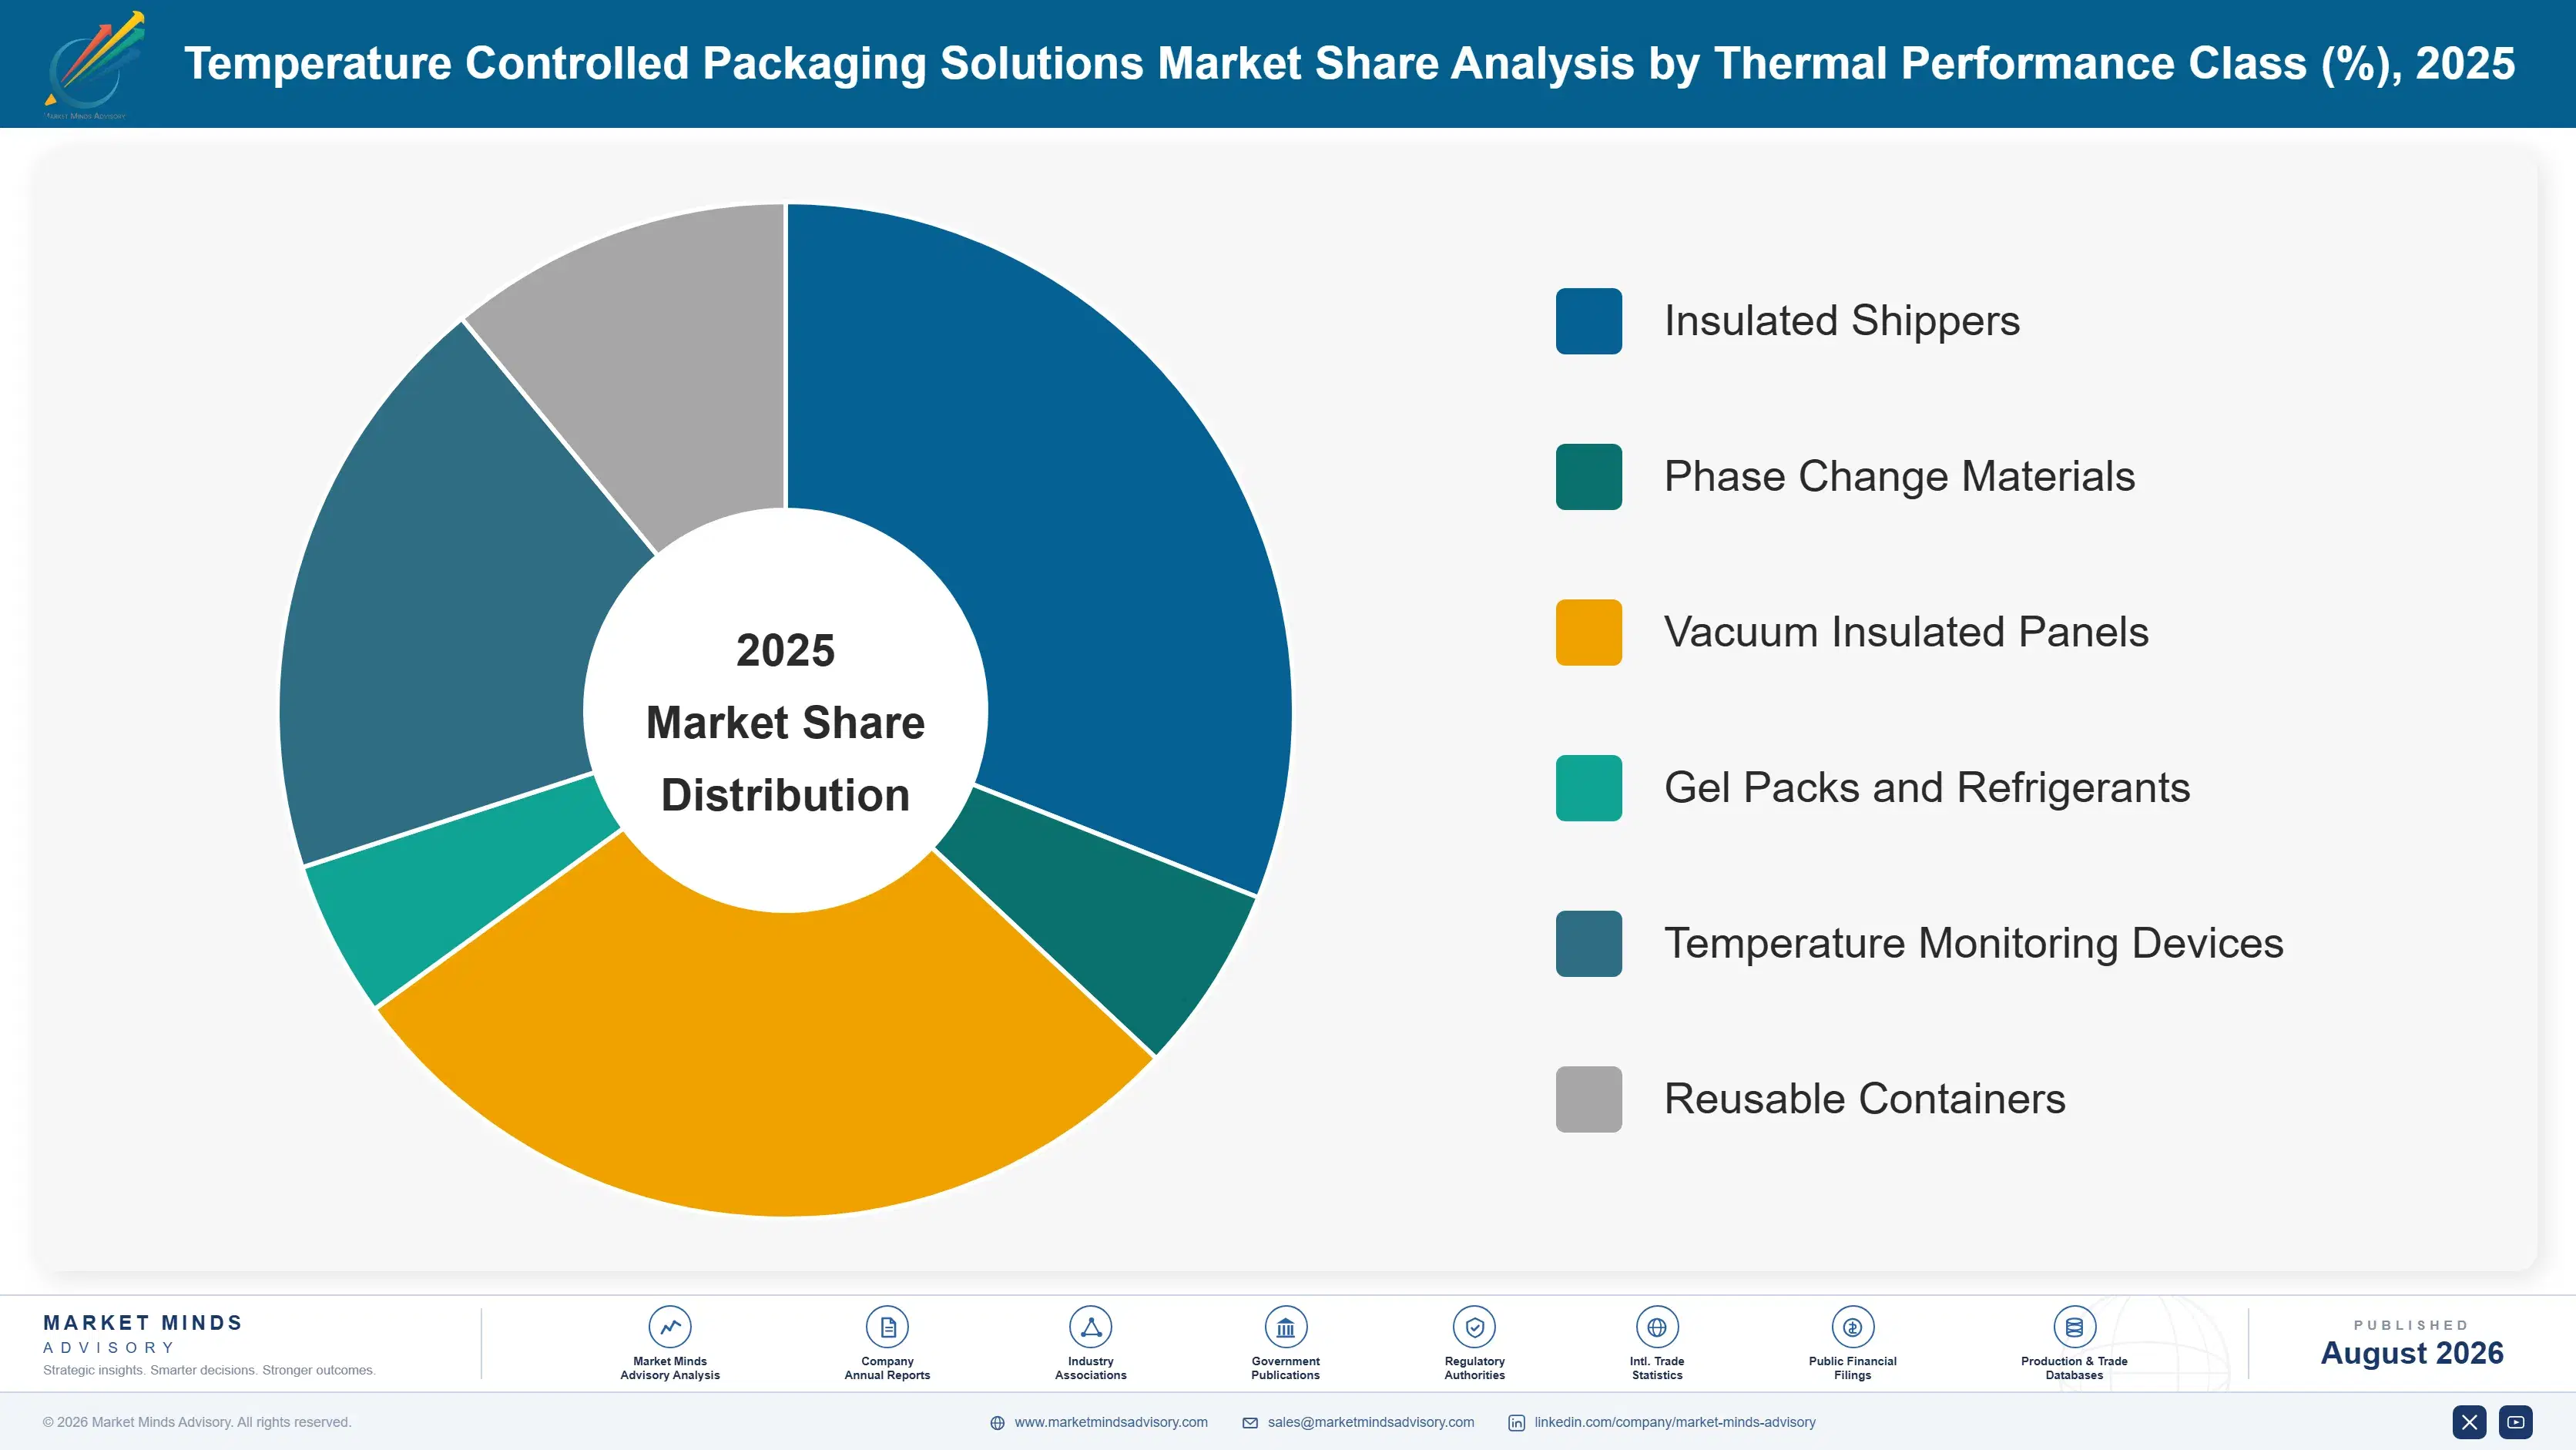
Segmentation follows thermal performance class, a single classification describing the temperature range a system is qualified to hold. Each class carries its own insulation technology, refrigerant, duration profile, and validation protocol, so commercial economics track the range rather than the product inside. End-use industry and supply model appear separately within the framework as their own distinct dimensions.
temperature-controlled-packaging-market-2-market-share-analysis-1787324669171

Cryogenic Systems

Cryogenic systems grow fastest at 12.2%, about 1.36 times the overall 9.0% rate, and cell and gene therapy pipelines explain almost all of it. Holding minus 150 degrees or lower requires dry vapour shippers or liquid nitrogen dewars rather than insulation and refrigerant, which puts this class in a different engineering category from everything else here. Shipments are patient-specific, irreplaceable, and documented to chain of identity standards, so there is no tolerable failure rate and no substitute consignment on a shelf somewhere. Volumes are modest and value per shipment is extraordinary. Competition here is technical rather than commercial, and qualified suppliers number in the single digits. Price barely enters the conversation at all.
CAGR 12.2%

Controlled Room Temperature Systems

Controlled room temperature systems grow at 10.8%, the second-fastest class, protecting products that must stay between fifteen and twenty-five degrees rather than refrigerated. Growth comes from recognition rather than new science: shippers spent years treating ambient products as needing no protection, then discovered that tarmac heat, unheated aircraft holds, and winter road freight all breach the window regularly. Excursion data from monitored lanes made the case that argument alone never could. Systems here are lighter and cheaper than refrigerated equivalents because no refrigerant is required, which keeps cost per shipment low enough that adoption spreads quickly once a shipper decides the risk is real. Qualification burden is lighter here as well.
CAGR 10.8%
Full segment breakdown across 5 segments available in the complete report.

Regional Architecture and Country Demand Map

Pharmaceutical manufacturing location and distribution practice enforcement together set this distribution more than population does. North America leads on production and clinical trial volume, while South Asia and Pacific grows quickest as generic and biosimilar export shipping comes under tighter temperature obligations. Lane density decides the reusable share.

North America

North America holds 30% of value on the largest concentration of biologics manufacturing and clinical trial activity anywhere. Specialty pharmacy and direct-to-patient delivery have grown faster here than in any other region, which multiplies parcel-level shipments rather than pallet volume and pushes qualification work toward smaller, more numerous systems. Reusable fleets do well on dense domestic lanes between manufacturing sites and distribution centres, and less well on the residential last mile. Cell and gene therapy shipping is concentrated around a handful of treatment centres. Growth of 8.4% reflects pipeline mix shifting toward temperature-sensitive products faster than shipment counts alone are rising. Excursion documentation and reporting expectations are also the strictest anywhere.
Share: 30% | CAGR: 8.4% (2026 to 2036)

Western Europe

Good distribution practice enforcement rather than volume gives Western Europe its 25% of value. European guidelines made documented temperature control an inspection matter well before other regions caught up, which built qualification discipline into routine pharmaceutical logistics across the region. Dense intra-European lanes and short return legs also make reusable container economics work better here than almost anywhere, and several of the largest reusable fleet operators are European. Swiss, Irish, German, and Danish biologics manufacturing generates high-value outbound volume. Growth of 7.4% is the slowest of the seven regions, reflecting a mature base where the practice was already established. Packaging waste reporting requirements are now pushing reusable adoption further still.
Share: 25% | CAGR: 7.4% (2026 to 2036)
Regional intelligence for 5 additional markets available in the complete report: East Asia, South Asia and Pacific, Latin America, Middle East and Africa, Eastern Europe. Contact sales@marketmindsadvisory.com.
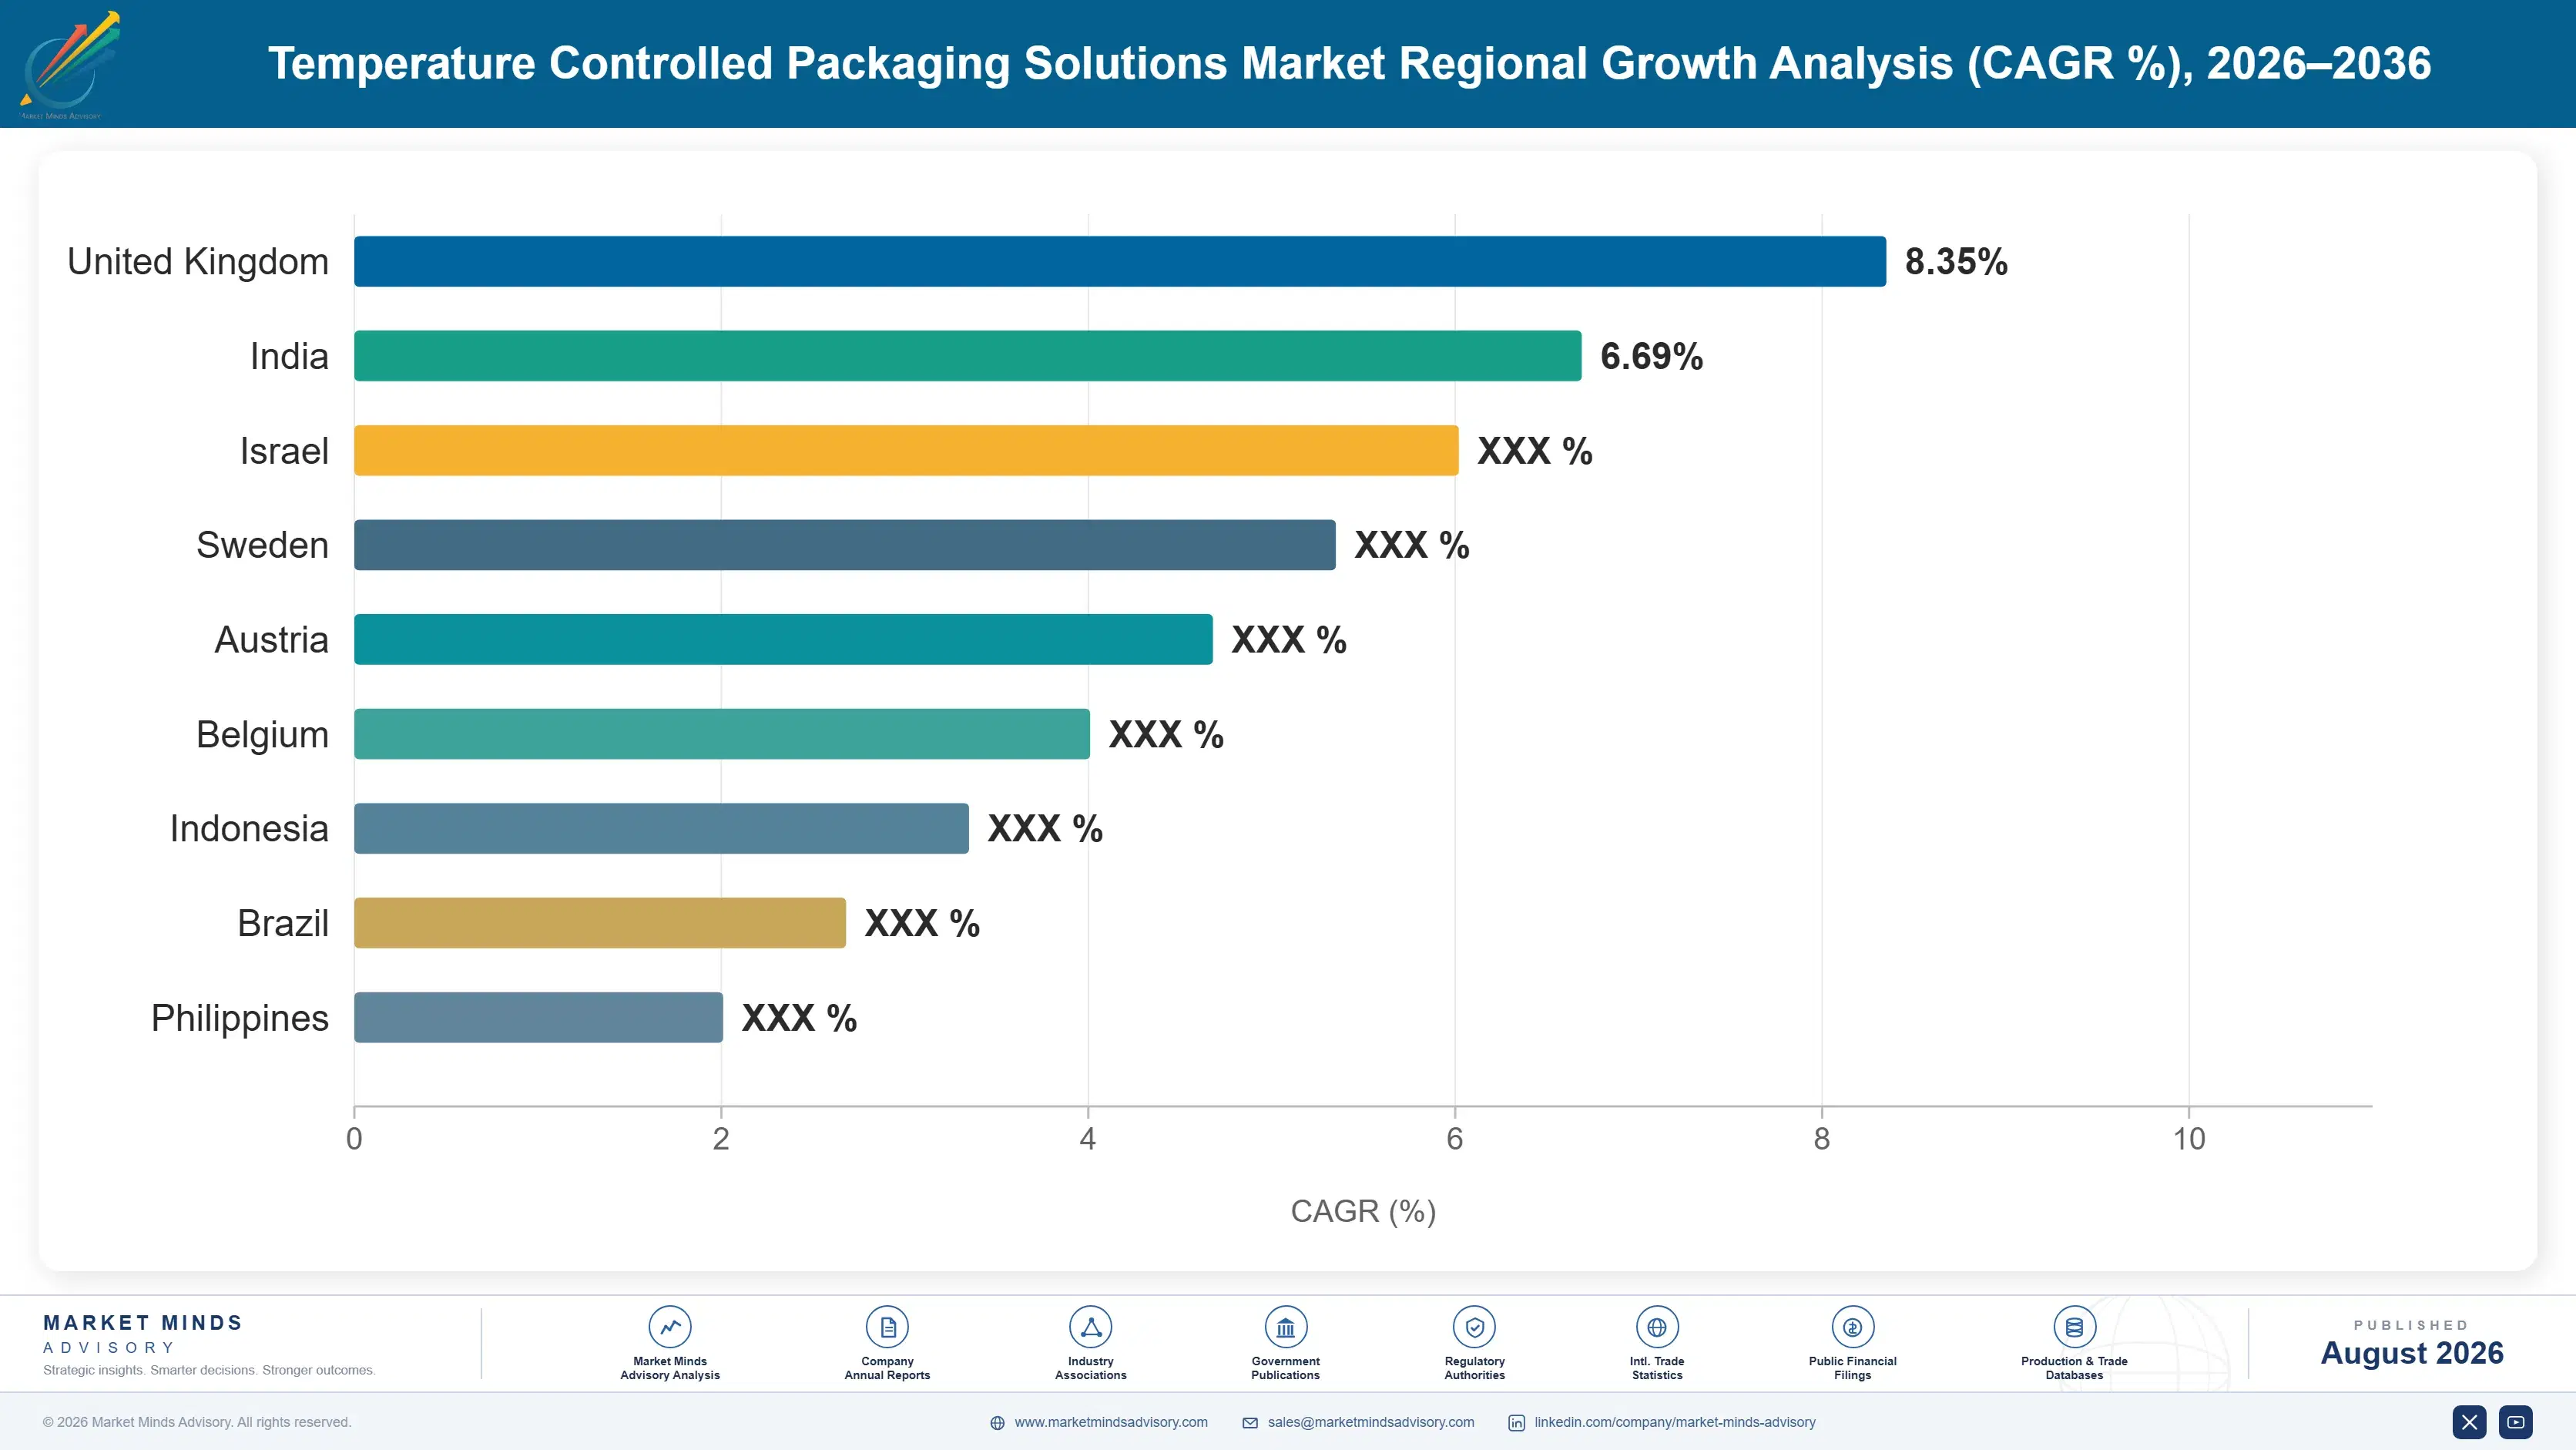
temperature-controlled-packaging-market-2-country-cagr-analysis-1787324669706

Where Thermal Packaging Margin Actually Sits

Nobody wins a validated lane on unit price, because the file is worth more than the box. The four moves below concentrate on ground a procurement comparison cannot touch: owning the qualification work, entering at clinical trial stage, selling duration rather than material, and pricing reusables on rotation instead of per shipment. All four outlast a tender.

Do The Qualification Work At Your Own Cost

Qualifying one system on one lane takes 4 to 9 months of thermal mapping, transit simulation, and documentation, and quality organisations will not fund that work to evaluate an alternative they are not already unhappy with. A supplier who runs the study, produces the report, and hands over a file the quality director can sign removes the only real obstacle to switching. The cost is real and recoverable, since a qualified lane then runs for years without renegotiation. Suppliers waiting to be invited into a qualification study are waiting for something that rarely happens.
Market Impact: Qualification runs 4 to 9 months pe

Enter At Clinical Trial Stage, Not Commercial

Clinical trial supply writes its thermal qualification from scratch, which makes it the only moment when a new supplier competes on merit rather than against an existing file. A system validated during Phase 2 and Phase 3 carries naturally into commercial launch, because requalifying at approval adds risk and delay nobody wants at that point. Trial volumes are small and margins on them look unattractive against commercial supply. That is the wrong comparison: the trial shipment costs little and decides a decade of commercial volume behind it. About 1 in 10 trials reaches approval.
Market Impact: Phase 3 qualification carries strai

Sell Hours Of Protection Rather Than Material

A shipper does not want polyurethane or vacuum panels, it wants 96 hours of protection at a stated ambient profile with documentation to prove it. Selling duration reframes the comparison away from material cost, where a competitor can always undercut, toward performance against a specific lane profile that only testing establishes. It also justifies premium construction, since a vacuum insulated panel system holding longer than a foam equivalent is not more expensive packaging, it is fewer failed consignments. Procurement resists this framing and quality assurance usually supports it. The second audience signs.
Market Impact: Systems sold on a 96 hour protectio

Price Reusable Fleets On Rotation, Not Shipment

A reusable container earns its return over 18 to 40 day rotation cycles, and pricing it as though it were a single-use box invites exactly the comparison it loses. Rental and per-cycle pricing shifts the conversation to cost per shipment across the container's life, where reusables win comfortably on dense lanes. It also puts recovery risk where it belongs, with the supplier who can build a collection network, rather than with a consignee who has no reason to care. Hybrid fleets are the realistic answer for most shippers. Thin lanes still need a single-use option alongside.
Market Impact: Rotation cycles run every 18 to 40

Who Controls the Margin Pool

Fragmentation is moderate: the top five hold roughly 34% of thermal packaging revenue, split across single-use manufacturers and reusable fleet operators whose business models barely overlap. The gap between leaders and challengers is qualification support capability and installed validated position rather than thermal engineering, which is well understood across the field. All participants here are assessed on one basis, revenue from temperature-controlled packaging systems and container rental
Competition runs along four dimensions. First, validated installed position, since a qualified lane rarely reopens. Second, qualification support, because the supplier who funds the study controls the specification. Third, network coverage for reusable fleets, which determines whether rotation economics hold on a given lane. Fourth, duration performance at the ambient profiles that actually occur, rather than laboratory conditions nobody ships in.

Pressure is building from two directions. Cell and gene therapy shipping needs cryogenic capability that most established suppliers simply do not have, which opens positions to specialists. Packaging waste reporting is pushing shippers to revisit single-use files they would otherwise have left alone. Rankings should favour suppliers with cryogenic capability and reusable network coverage over those defending validated foam positions alone.
temperature-controlled-packaging-market-2-company-positioning-matrix-1787324670231

Competitive Moat and Risk Dimensions

SONOCO THERMOSAFE

Moat: Validated position and qualification support

Sonoco ThermoSafe holds validated positions across a large installed base of pharmaceutical lanes, and those files rarely reopen once written. Its qualification and testing capability lets it fund the studies that decide specifications, which is the practical route into any account. Breadth across parcel, pallet, and bulk formats also matters as shippers consolidate suppliers rather than manage several.
SONOCO THERMOSAFE

Risk: Single-use weighting and waste reporting

Revenue leans on single-use construction that packaging waste reporting requirements are increasingly awkward for, and the reusable operators competing for the same lanes have the easier sustainability argument. Cryogenic capability is thinner than the specialists building for cell and gene therapy. Validated position also cuts both ways, since it slows the company's own product transitions.
PELICAN BIOTHERMAL

Moat: Reusable network and rental model

Pelican BioThermal operates one of the widest reusable container service networks, with collection and reconditioning points that make rotation economics work on lanes where competitors cannot recover assets. Rental pricing shifts recovery risk to the supplier, which shippers value and few can offer credibly. Its parcel and pallet range covers most pharmaceutical duration requirements without custom engineering.
PELICAN BIOTHERMAL

Risk: Asset intensity and lane density

The rental model requires substantial capital tied up in container fleets, service depots, and reconditioning capacity, all of which sits idle when volume dips. Rotation economics fail entirely on thin lanes into secondary markets, which limits addressable geography. Single-use manufacturers also compete effectively wherever validated foam positions are already in place and nobody wants to requalify.

Players Tracked

Prominent Players

Sonoco ThermoSafe
Pelican BioThermal
Cold Chain Technologies
va-Q-tec
CSafe

Other Key Players

Envirotainer
SkyCell
Tower Cold Chain
Cryopak
TemperPack
Tempack
Intelsius
Woolcool
Insulated Products Corporation
Sofrigam
AeroSafe Global
Klinge Corporation
Cryoport
Nordic Cold Chain Solutions
American Aerogel

Recent Developments

MARCH 2025

European packaging waste rules tighten reuse expectations

Packaging and packaging waste requirements advanced with reuse targets and reporting obligations reaching transport packaging, prompting shippers to document single-use thermal volumes for the first time. This was European regulation taking effect rather than a commercial transaction, and it handed reusable operators an argument they had made unsuccessfully for years.
Signal: Waste reporting quietly reopens single-use
SEPTEMBER 2024

Cryogenic shipper capacity expands for cell therapy launches

Several suppliers expanded dry vapour and liquid nitrogen shipper capacity ahead of cell and gene therapy launches requiring temperatures conventional systems cannot approach. These were organic capacity expansions rather than acquisitions or joint ventures, and they reflect qualified cryogenic supply rather than demand being the binding constraint on those launches.
Signal: Capacity committed well before approvals a
MAY 2024

Direct-to-patient trial shipping guidance widens across regulators

Regulators in several markets clarified expectations for shipping investigational medicines directly to patient homes, including temperature documentation and excursion handling for residential delivery. These were regulatory clarifications rather than transactions, and they converted an informal practice into one requiring qualified parcel-level thermal systems and recorded conditions.
Signal: Each clarification turns an informal shipp

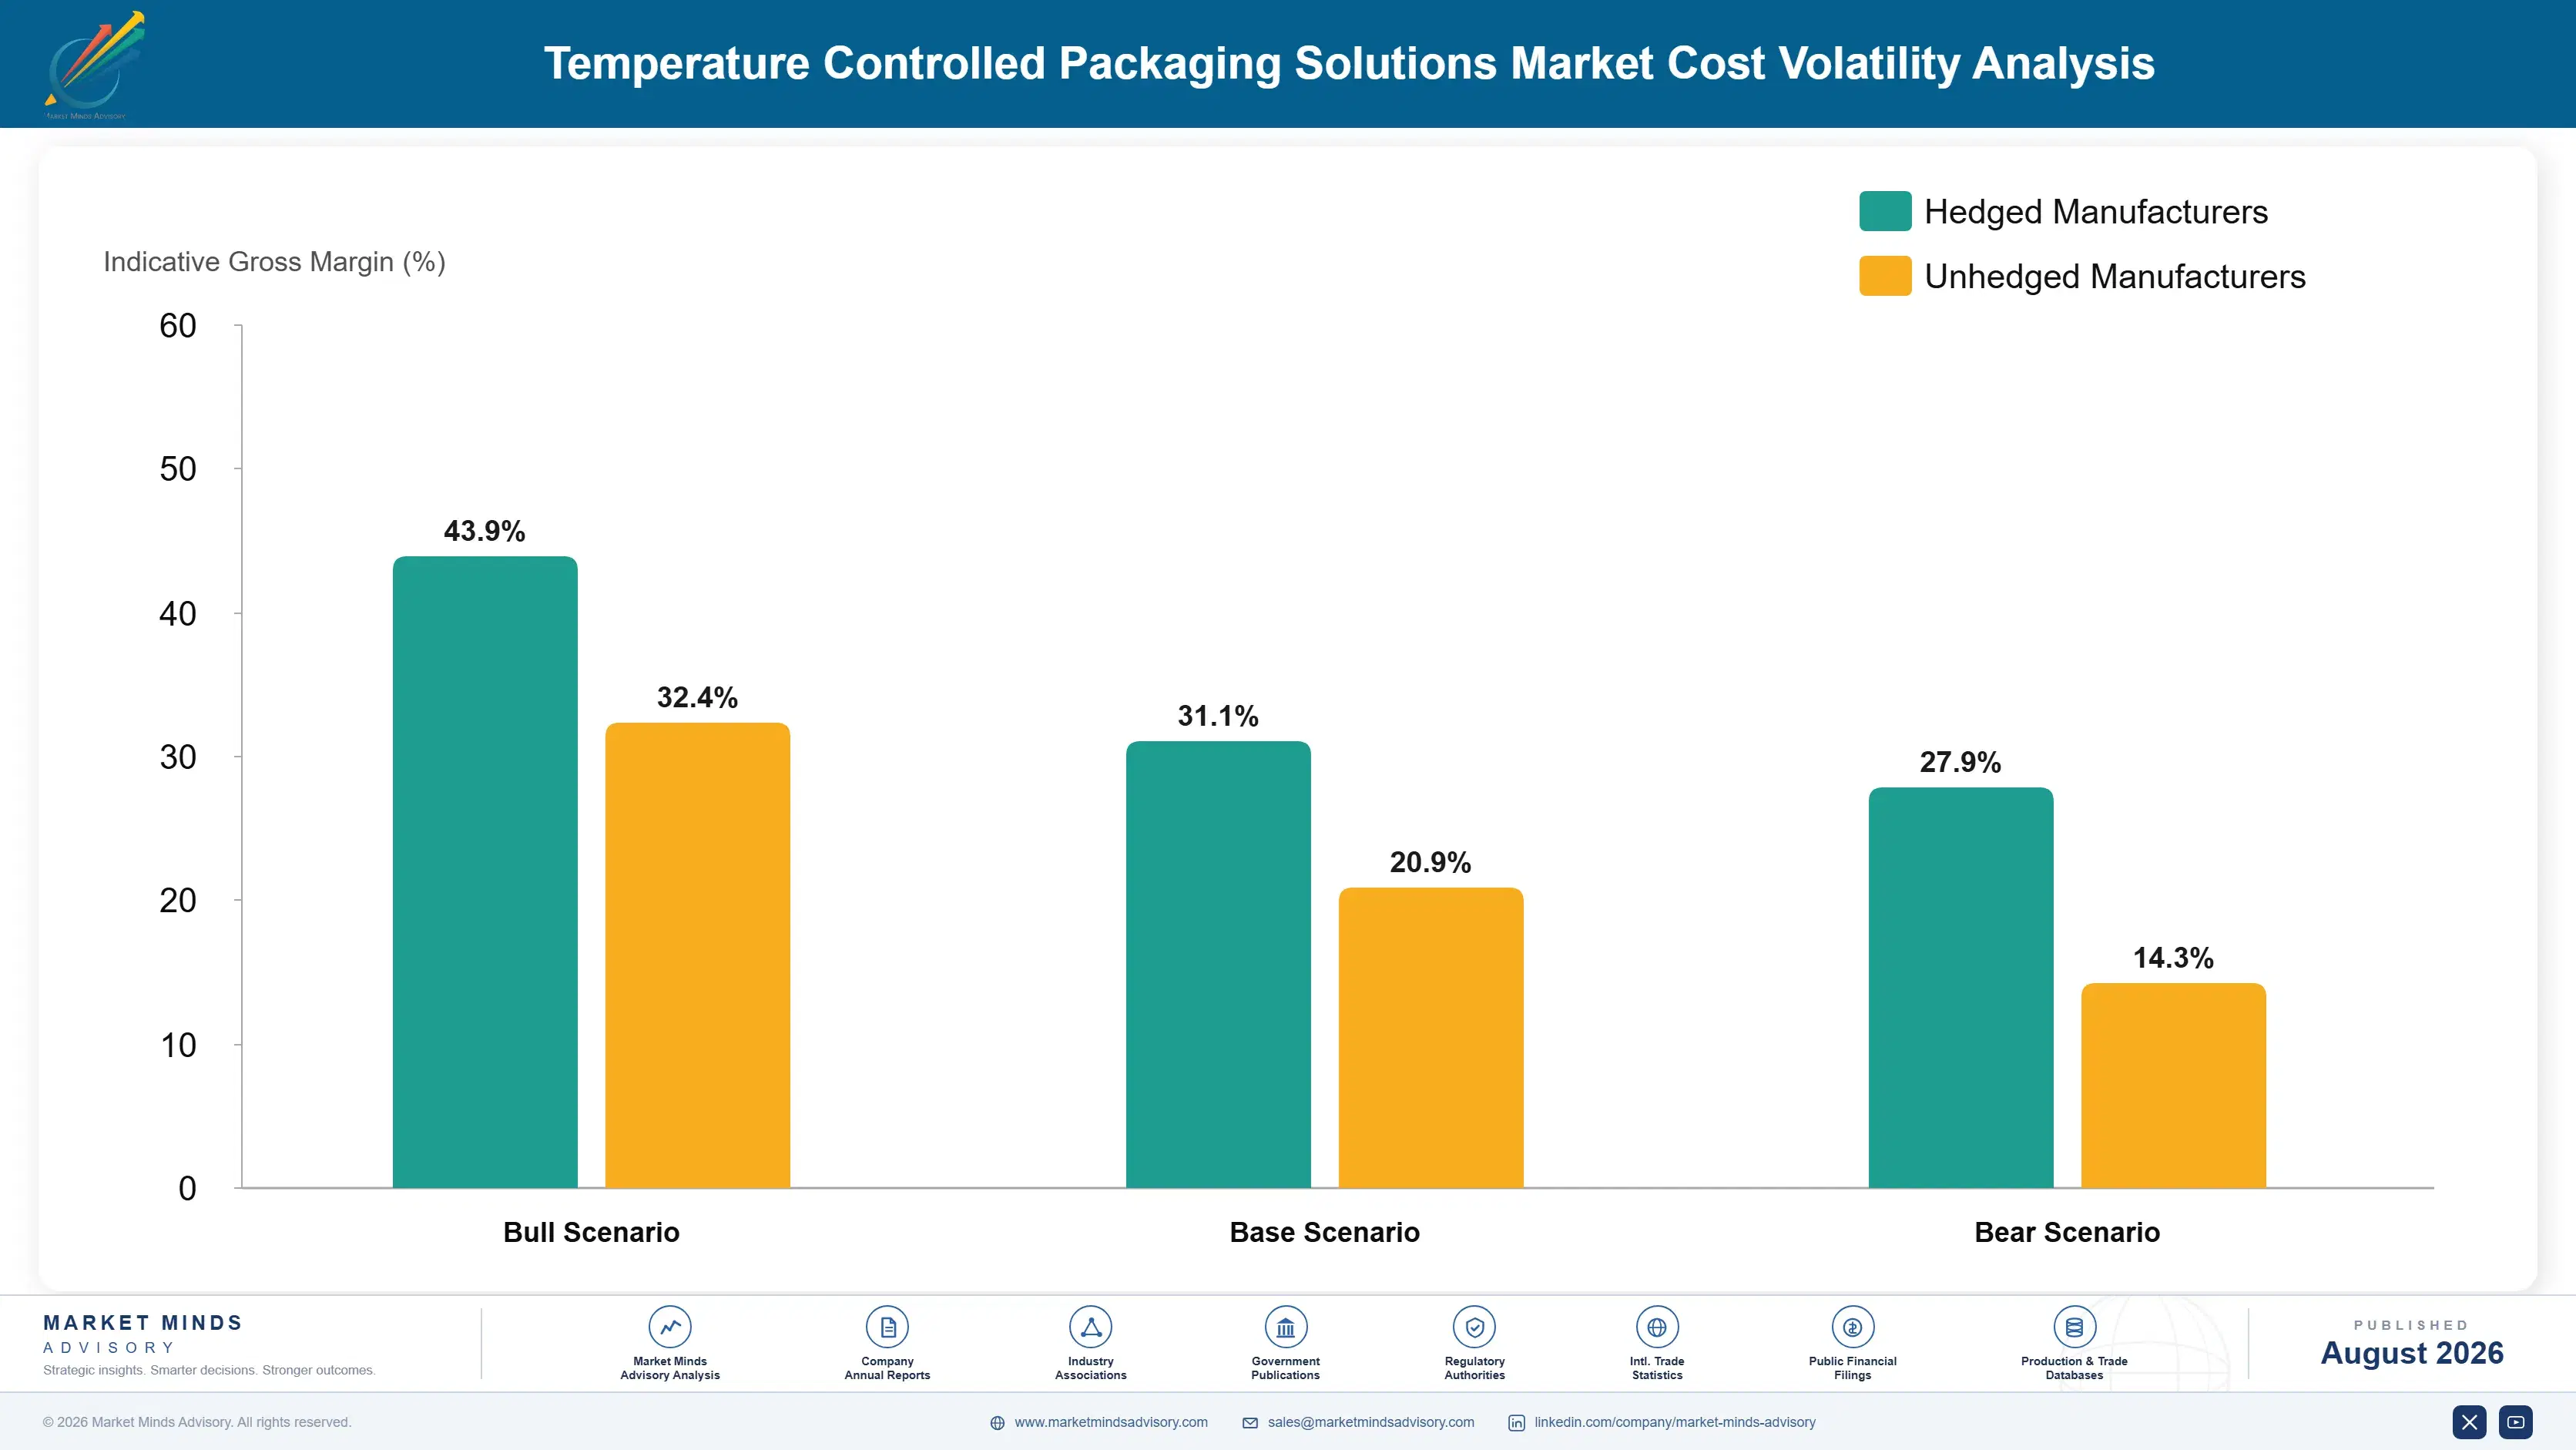
Polyurethane, Vacuum Panels, Refrigerants, Freight

Cost structure varies by construction rather than product class. Polystyrene and polyurethane insulation runs 22% to 34% of single-use system cost, sourced from regional converters close to the point of use because insulated boxes ship badly. Vacuum insulated panels cost far more per unit of performance and dominate premium system cost at 45% to 60%. Refrigerants and gel add 10% to 16%.
Air freight is the input that hurts most, since thermal systems are bulky and airlines charge on volumetric weight rather than mass. Capacity collapsed through 2020 and 2021 as passenger belly space vanished, with IATA reporting air cargo rates at several times prior-year levels. Suppliers whose systems were larger for the same protection lost work, and the episode accelerated interest in vacuum insulated panels because thinner walls meant lower freight.

Exposure separates by construction choice and manufacturing footprint. A supplier building foam systems close to customers carries low freight on inbound material but heavy exposure to resin pricing and volumetric charges on the outbound consignment. One selling vacuum panel systems carries higher unit cost and a narrow supplier base for the panels, offset by lower shipping volume. Reusable operators carry neither and take fleet capital risk instead.
temperature-controlled-packaging-market-2-cost-volatility-analysis-1787324670426

Qualify vacuum panel and foam variants of every system

Freight charged on volumetric weight punishes thick-walled foam construction on long-haul lanes, while vacuum panels cost considerably more per unit. Holding both qualified for the same duration lets a shipper choose by lane rather than accept one economic profile everywhere. The qualification work doubles, but it removes the situation where a competitor wins purely on wall thickness.

Manufacture insulated components close to filling sites

Insulated boxes are mostly air, so shipping them any distance destroys the economics before the customer ever sees a quotation. Regional converting close to pharmaceutical filling and distribution sites cuts inbound freight substantially and shortens lead times that quality organisations increasingly build into supply continuity plans. The trade-off is fragmented manufacturing scale and higher fixed cost per site.

Build hybrid fleets rather than choosing one model

Reusable containers win on dense lanes with rotation inside 40 days and lose badly where no return freight exists. Running both models under one qualification umbrella lets a supplier serve the whole network rather than the profitable half of it. The cost is holding two inventories and two sets of documentation, which smaller suppliers cannot carry.

Portfolio Architecture for Margin Defence

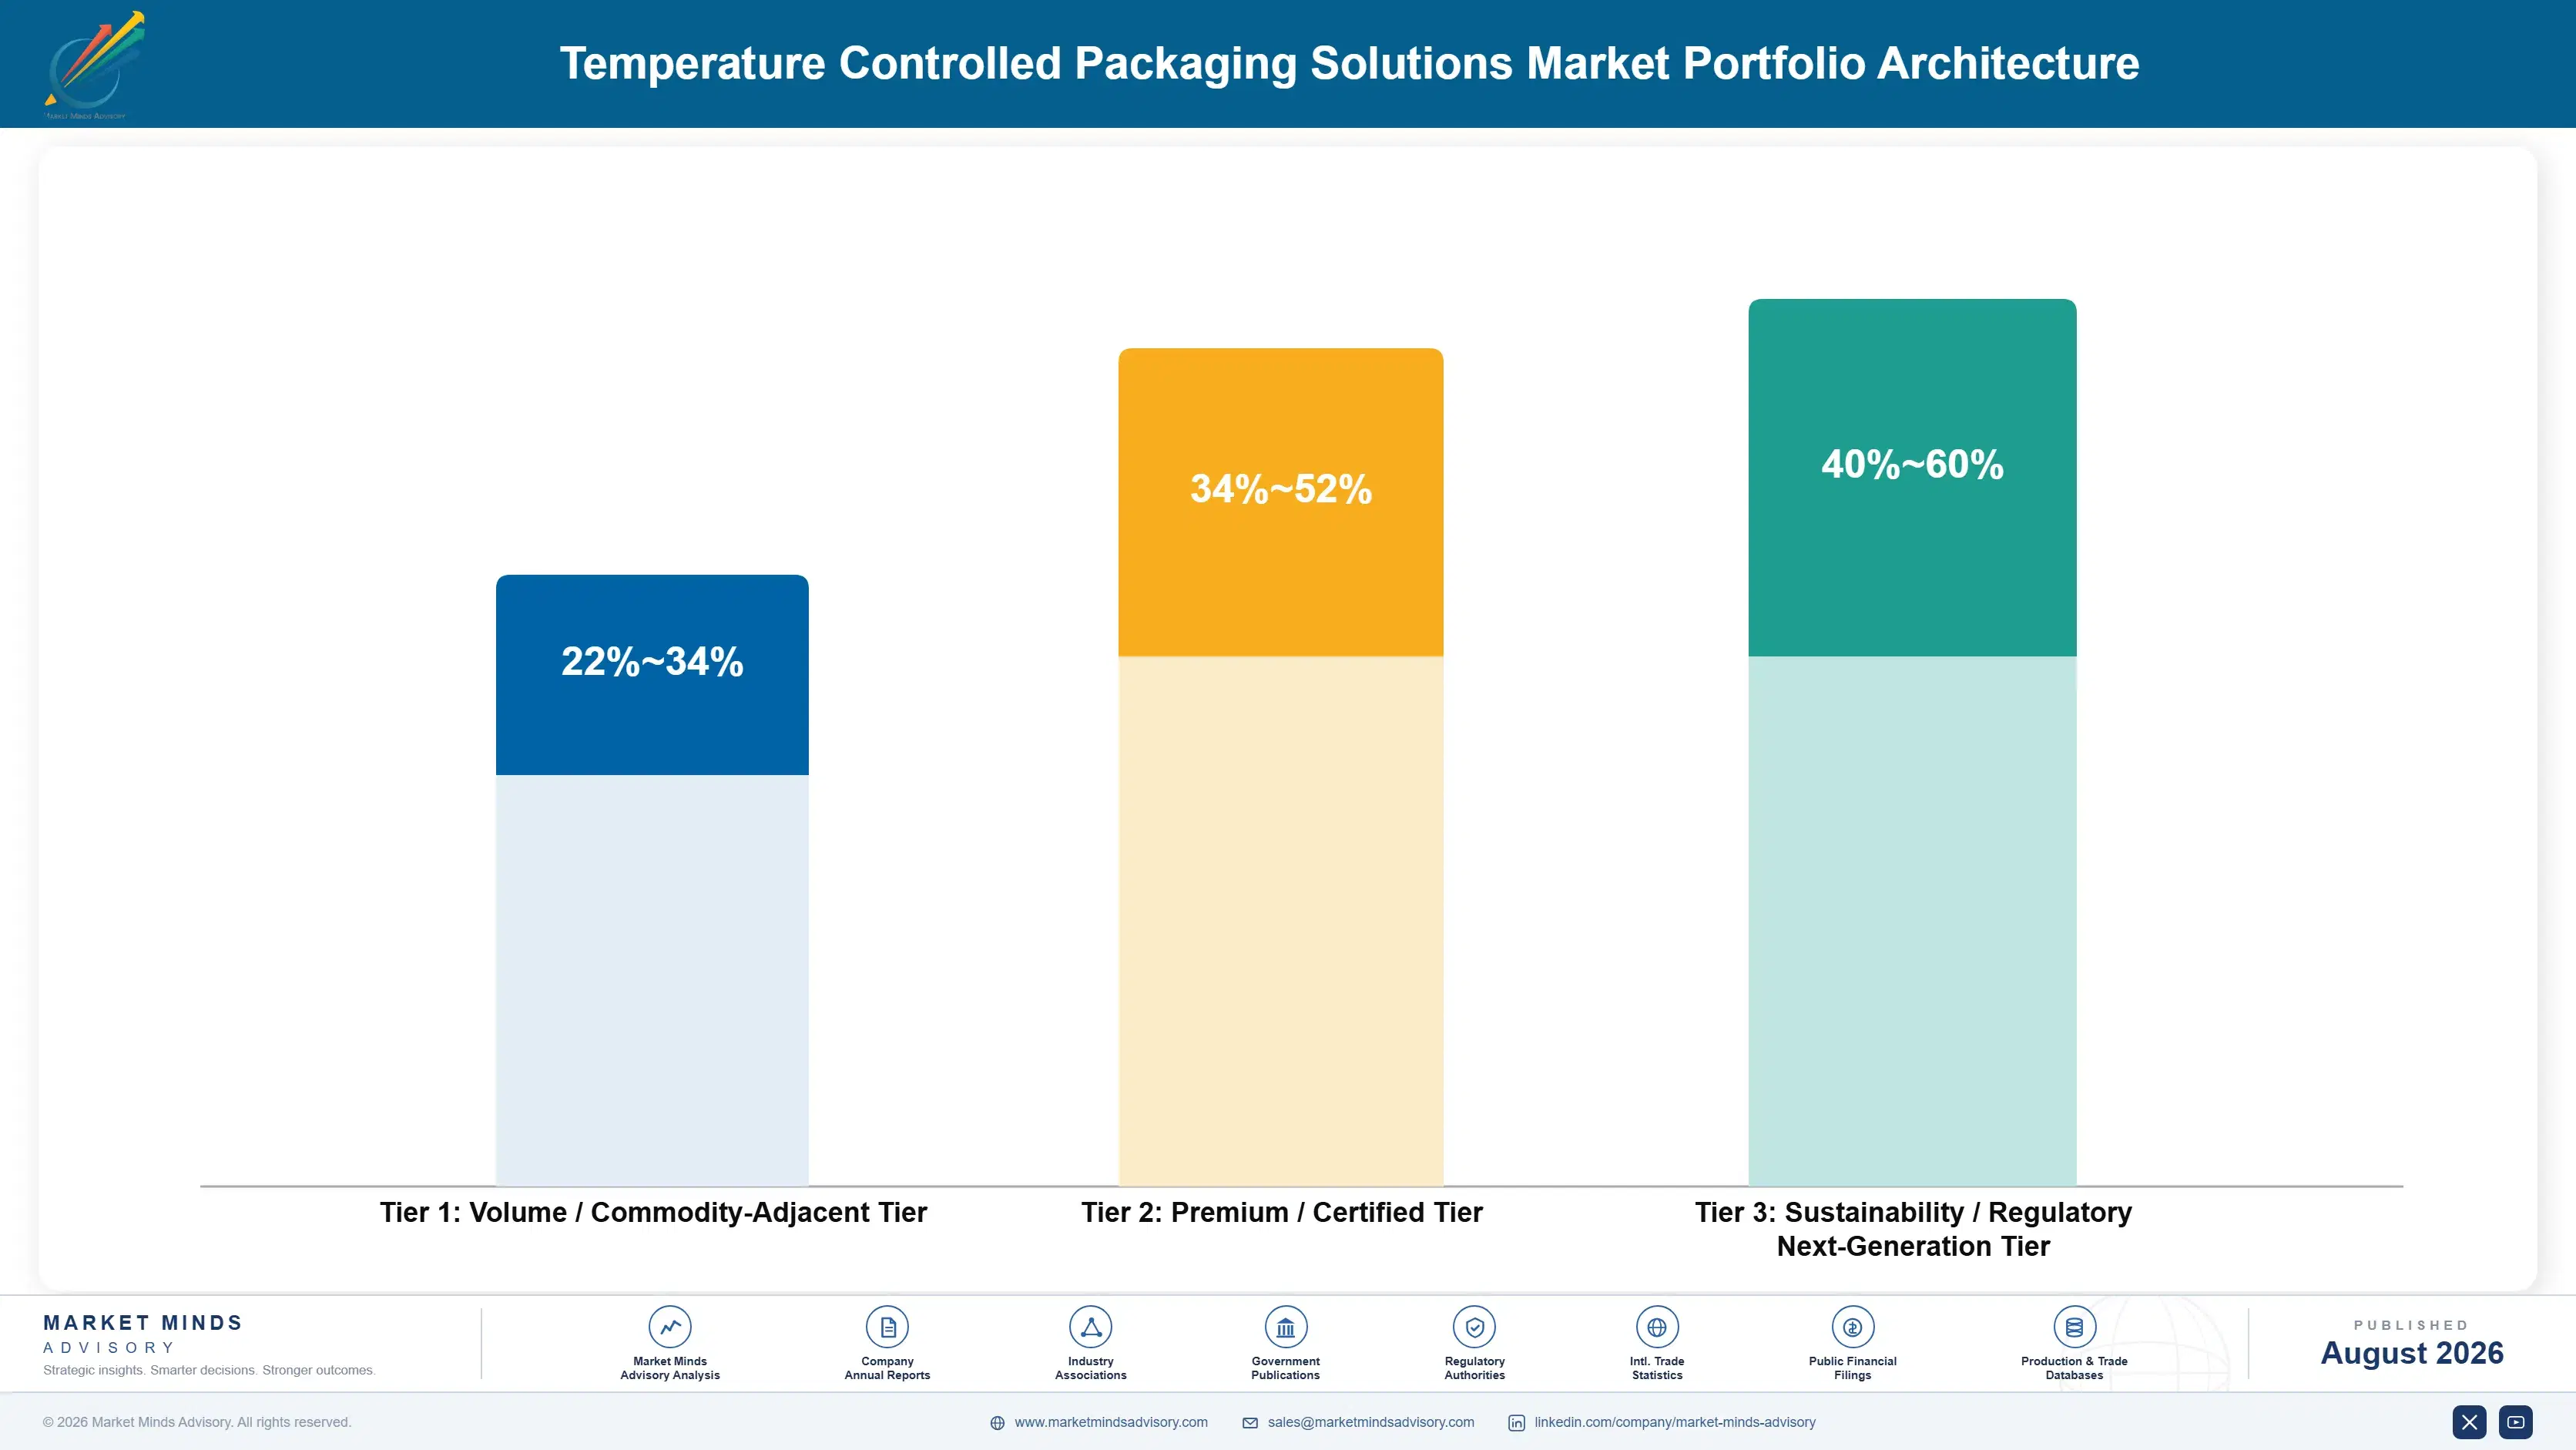
The portfolio splits into three tiers with different economics. Standard insulated shippers and gel packs form the volume tier, where construction is well understood and price decides once qualification is equal. Vacuum panel systems and validated pallet shippers earn more because performance and documentation narrow the field. Cryogenic systems and reusable rental fleets price against consignment risk or rotation economics rather than a competing box.
The tension runs between volume systems that fill the plant and premium formats that earn the return. Standard shippers keep capacity loaded, cover the fixed cost of assembly lines, and hold the account through which premium work sells. Yet they compete against every regional converter once the qualification is settled. Suppliers handling this well accept commodity pricing on parcel volume while directing development toward panels, cryogenics, and reusable networks.

High-value pools concentrate where qualification or capability limits competition: cryogenic systems for cell and gene therapy, validated pallet shippers on long-haul lanes, reusable rental fleets with recovery networks, and vacuum panel systems where freight economics reward thin walls. All four escape the unit price comparison. Standard gel packs and basic parcel shippers sit at the other end, where a dozen converters compete on cost.

Volume / Commodity-Adjacent Tier

Standard insulated parcel shippers, gel packs, and water-based refrigerants sold on delivered cost once qualification is equal. The range is wide because regional manufacturing footprint and resin purchasing separate converters considerably at identical selling prices.
Gross Margin: 22-34%

Premium / Certified Tier

Vacuum insulated panel systems, phase change refrigerants, and validated pallet shippers carrying documented duration performance. The range is wide because panel supply is narrow and qualification support cost differs enormously between suppliers serving the same lanes.
Gross Margin: 34-52%

Sustainability / Regulatory / Next-Generation Tier

Reusable rental fleets, cryogenic dry vapour shippers, and fibre-based recyclable insulated systems. The range is wide because rental returns depend on rotation density while cryogenic work carries unrecovered engineering and depot cost.
Gross Margin: 40-60%
temperature-controlled-packaging-market-2-portfolio-architecture-1787324670921

High-value Sub-segments and Strategic Watch-out

Cryogenic Systems

High value and high growth at 12.2%, the fastest class, on cell and gene therapy pipelines that need minus 150 degrees or lower. Shipments are patient-specific and irreplaceable, so failure is not priced in, and the number of genuinely qualified suppliers stays in single digits.
Gross Margin: 48-66%

Controlled Room Temperature Systems

High value with strong growth at 10.8%, protecting products between fifteen and twenty-five degrees that shippers long assumed needed nothing. Excursion data from monitored lanes made that case, and lighter construction without refrigerant keeps cost per shipment low enough for quick adoption. Qualification burden is lighter too.
Gross Margin: 32-50%

Refrigerated Two To Eight Degree Systems

The volume core by a wide margin, growing at 8.6% on biologics and vaccine shipping. Qualification lock-in protects incumbents well, but standard foam construction faces a dozen capable converters and packaging waste reporting is now reopening files that had been settled. Reusable fleets compete hardest here of all.
Gross Margin: 26-44%

Frozen And Deep Frozen Systems

The strategic watch-out, growing at 9.4% on frozen biologics and plasma shipping after vaccine programmes left considerable capacity behind. Dry ice supply and its air transport restrictions constrain what is practical, and phase change alternatives are still proving themselves at these temperatures. Idle capacity keeps pricing soft for now.
Gross Margin: 30-48%

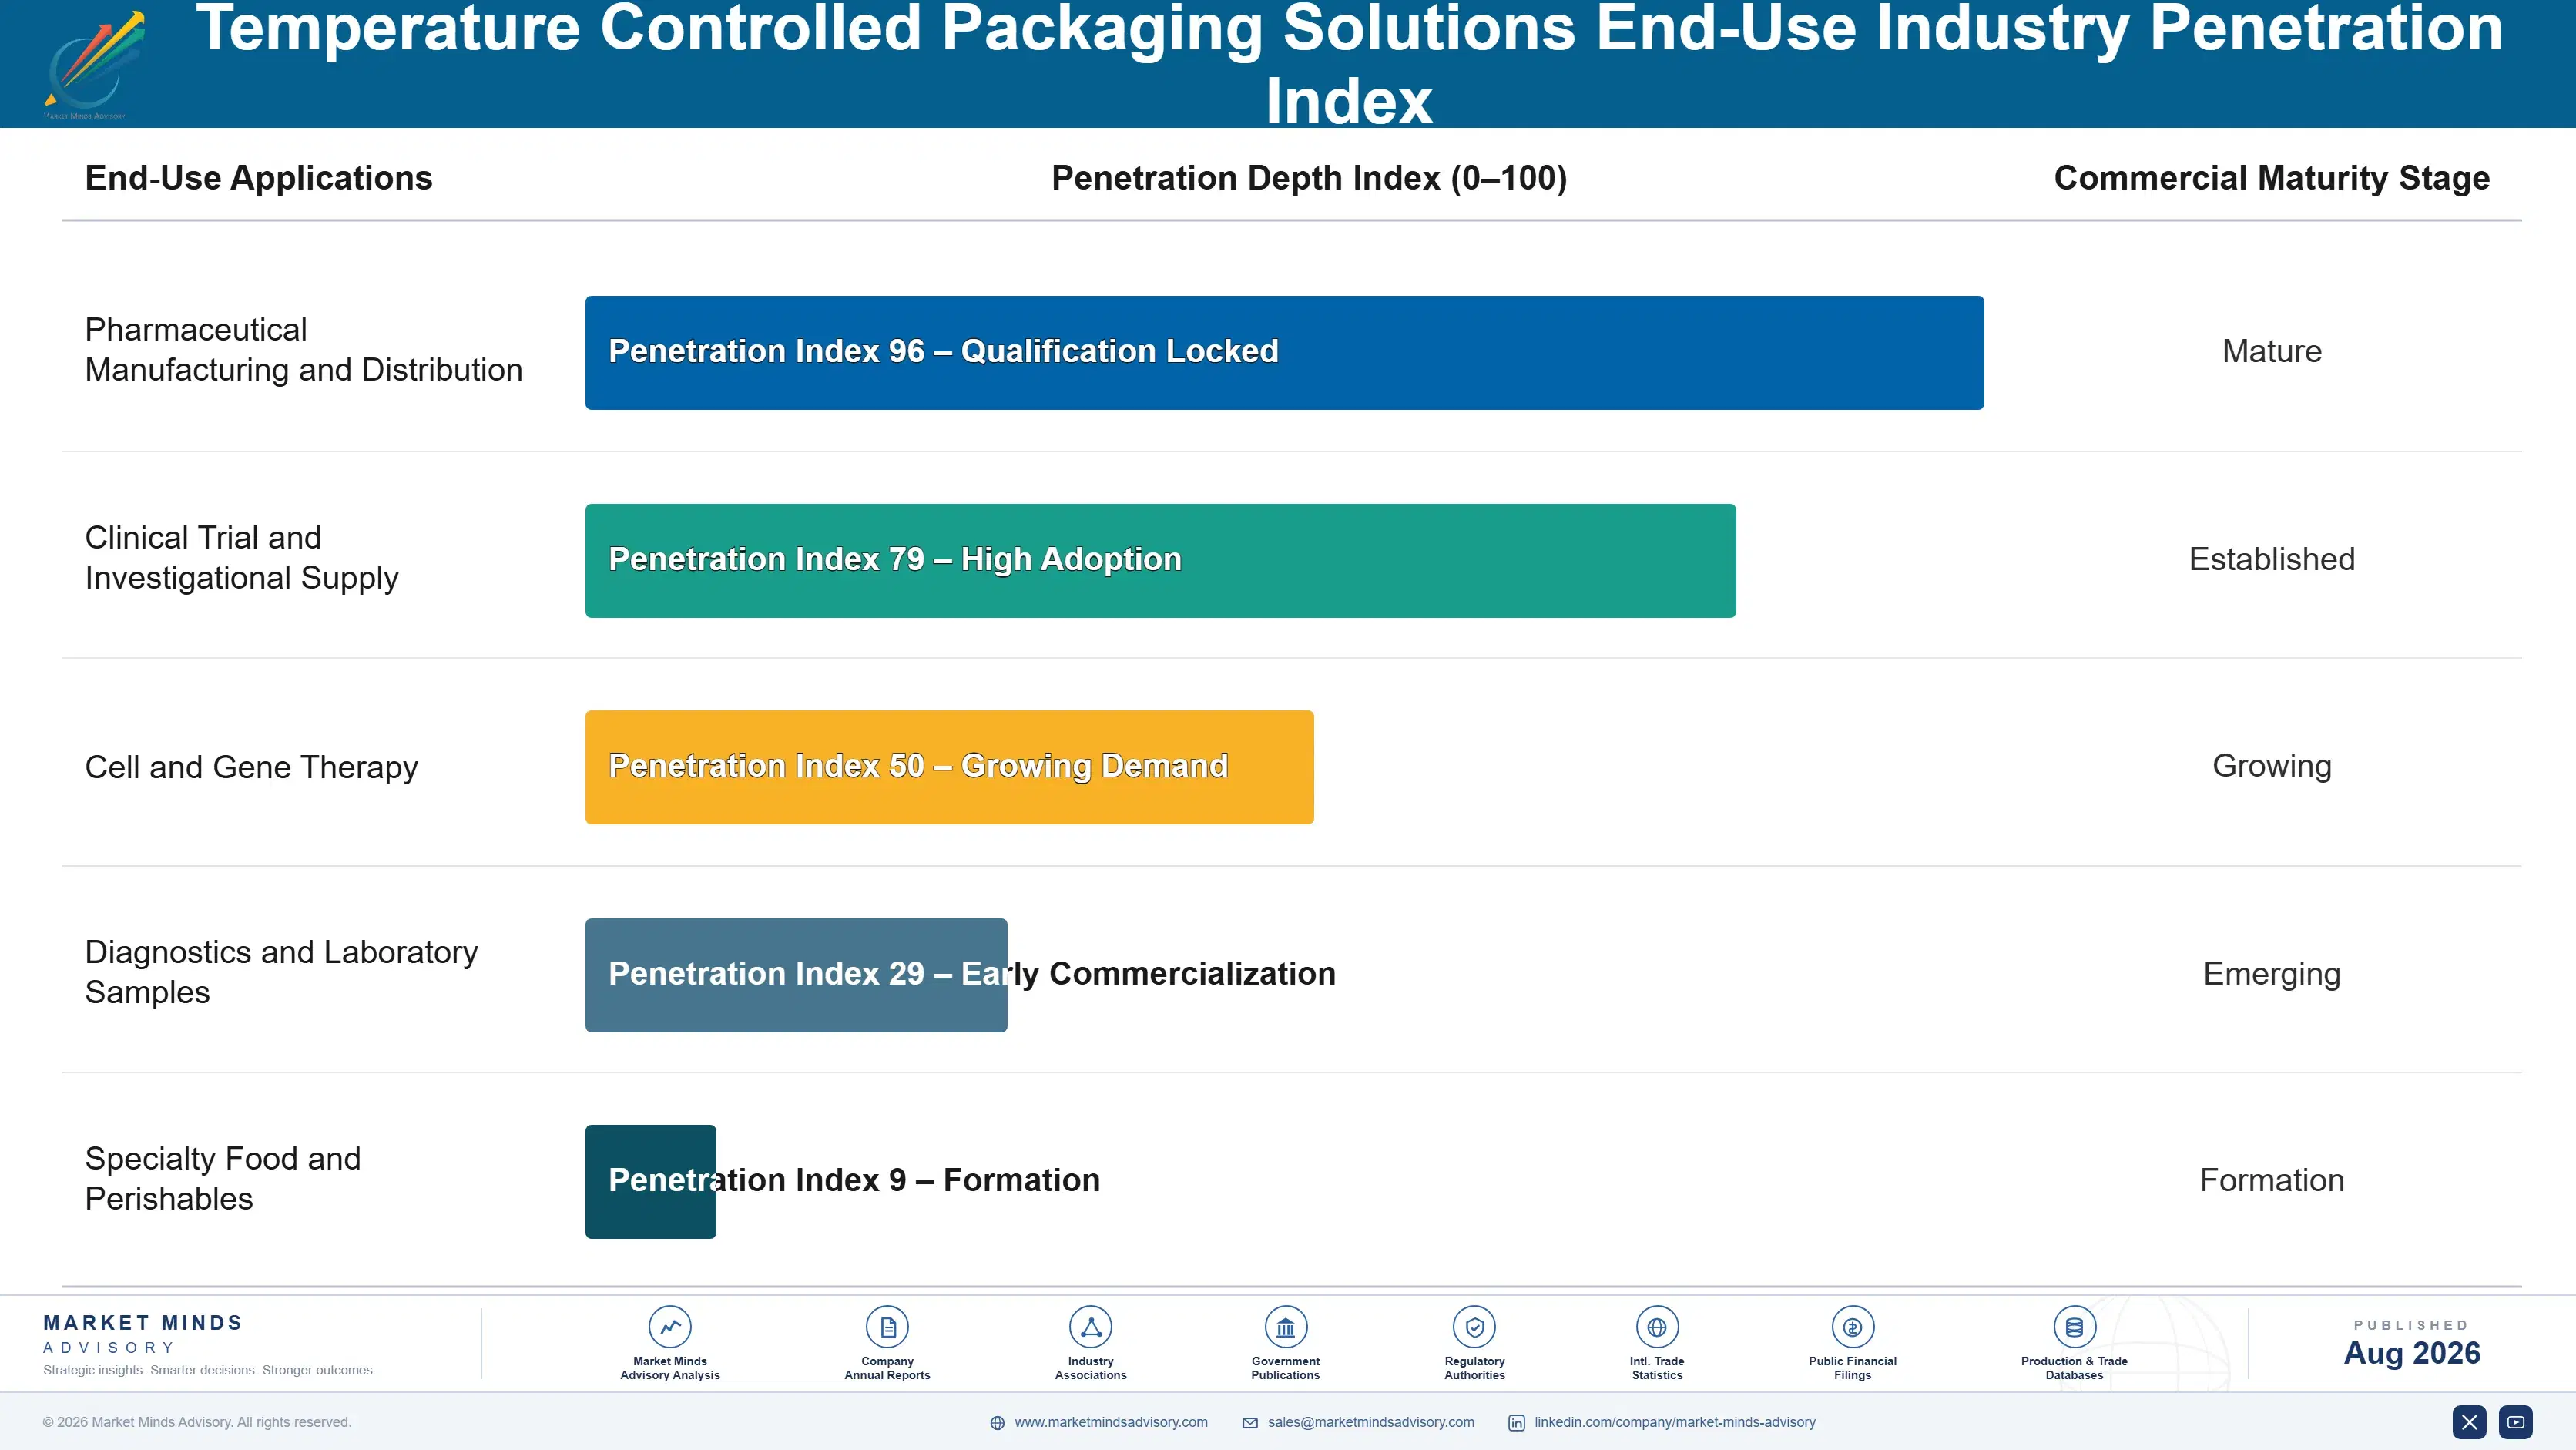
How Validated Lanes Actually Hold

Demand commits at lane qualification and repeats shipment after shipment until something forces a review. A validated file records thermal mapping, transit simulation, stability data, and a signature from someone carrying regulatory liability, and none of that is repeated casually. Switching means funding a new study and accepting risk on a working lane. That protects incumbents strongly, which is why packaging waste reporting matters commercially: it forces reviews that competition alone never
Stickiness varies by regulatory exposure and consignment value. Cell and gene therapy shipping sticks hardest, since chain of identity documentation ties the system to a treatment protocol. Commercial biologics lanes stick almost as firmly through the validated file. Clinical trial supply sticks least, because files are being written fresh and a new supplier can compete on merit. Ambient protective shipping barely sticks.

Buyer profiles have moved from logistics managers choosing on price toward quality assurance and regulatory affairs teams holding a veto that procurement cannot override. Sustainability reporting has added a third voice with its own criteria. That change rewards suppliers who bring qualification files, excursion data, and waste figures alongside a quotation, and it penalises those still selling insulation performance to a shipping department.
temperature-controlled-packaging-market-2-end-use-penetration-index-1787324671411

Our Call On Thermal Packaging

These are among the four positions where our research anticipates prominent divergence between winners and laggards over the coming forecast period. Each is grounded in the demand model, the regulatory perimeter, and the announced capacity pipeline.
01 / QUALIFICATION FILE OWNERSHIP

Fund the study or wait to be asked

Qualifying one system on one lane takes 4 to 9 months of thermal mapping, transit simulation, and documentation, and no quality organisation funds that work simply to evaluate an alternative it is not already unhappy with. A supplier who runs the study, produces the report, and hands over a file the quality director can sign has removed the only genuine obstacle to switching. Waiting to be invited into a qualification programme is waiting for something that almost never arrives on its own.
02 / CLINICAL TRIAL ENTRY

Win the file before the product is approved

Clinical trial supply writes its thermal qualification from nothing, which makes it the one moment a new supplier competes on merit rather than against a signed file. A system validated across Phase 2 and Phase 3 carries into commercial launch, because requalifying at approval adds risk and delay that nobody accepts at that stage. Trial margins look thin against commercial supply, but that is the wrong comparison: the shipment costs little and settles a decade of commercial volume sitting behind it.
03 / ROTATION ECONOMICS PRICING

Reusables lose the comparison they should never enter

A reusable container earns its advantage across 18 to 40 day rotation cycles, so pricing it like a single-use box invites precisely the comparison it cannot win. Rental and per-cycle pricing moves the argument to cost per shipment over the container's working life, where reusables win comfortably on dense lanes, and it puts recovery risk with the supplier who can actually build a collection network. Thin lanes still need a single-use option, which is why hybrid fleets beat purity in this market.
04 / DURATION NOT MATERIAL

Sell protection hours, never insulation specifications

A shipper does not want polyurethane or vacuum panels, it wants a documented 96 hours of protection against the ambient profile that its lane actually experiences. Selling duration moves the comparison away from material cost, where somebody can always undercut, and onto tested performance that only a qualification study establishes. It also justifies premium construction honestly, since a panel system holding longer than a foam equivalent is not more expensive packaging, it is fewer written-off consignments and fewer investigations to explain afterwards.

Engagement Snapshot From the Field

A live engagement with an industry participant carrying material or product regulatory and market exposure ahead of a defining policy shift, showing how our research translates into a defensible multi-year portfolio strategy.
MARKET MINDS ADVISORY · CLIENT ENGAGEMENT SUMMARY
Temperature Controlled Packaging Solutions Producer Strategic Portfolio Review and Transition Roadmap 2026·Investment Scenario on Temperature Controlled Packaging Solutions Exposure Evaluation 2025-26
CLIENT PROFILE
A global biologics manufacturer shipping to fifty-two markets engaged MMA after a series of temperature excursions on Asian and Latin American lanes. The client reported roughly 340 qualified lane and system combinations, an excursion rate near 3% on long-haul routes against under 1% domestically, and packaging spend of about USD 78 million annually (client-reported, unverified by MMA).
STRATEGIC CHALLENGE
Requalifying 340 combinations exceeded available quality resource by a wide margin, and incumbent suppliers had proposed upgrading every lane to premium panel systems regardless of where failures actually occurred. Sustainability reporting was separately demanding a cut in single-use volume. The board needed a sequence that fixed the failing lanes without funding a programme it could not staff.
MMA APPROACH
MMA ranked every lane by excursion frequency and consignment value rather than uniformly, which internal planning had not attempted. We mapped actual ambient profiles against qualified duration to find where the specification was genuinely short rather than where handling had failed. We then tested which lanes had the return freight density to support reusable containers, since sustainability and excursions needed separate answers.
KEY FINDINGS
  1. About 19% of lanes carried roughly 71% of excursion events, almost all of them long-haul air routes with ground legs above thirty-five degrees (client-reported, unverified by MMA).
  2. Most failures reflected handling delays rather than insufficient insulation, so upgrading to premium panel systems would have spent money without addressing the actual cause.
  3. Only 44 of the 340 lane combinations had return freight density supporting reusable rotation inside forty days, which capped what the sustainability target could realistically deliver.
  4. Extending qualified duration from 72 to 96 hours on the worst lanes cost less than a quarter of the premium upgrade the incumbents had proposed (client-reported, unverified by MMA).
CLIENT PROFILE
A global biologics manufacturer shipping to fifty-two markets engaged MMA after a series of temperature excursions on Asian and Latin American lanes. The client reported roughly 340 qualified lane and system combinations, an excursion rate near 3% on long-haul routes against under 1% domestically, and packaging spend of about USD 78 million annually (client-reported, unverified by MMA).
STRATEGIC CHALLENGE
Requalifying 340 combinations exceeded available quality resource by a wide margin, and incumbent suppliers had proposed upgrading every lane to premium panel systems regardless of where failures actually occurred. Sustainability reporting was separately demanding a cut in single-use volume. The board needed a sequence that fixed the failing lanes without funding a programme it could not staff.
MMA APPROACH
MMA ranked every lane by excursion frequency and consignment value rather than uniformly, which internal planning had not attempted. We mapped actual ambient profiles against qualified duration to find where the specification was genuinely short rather than where handling had failed. We then tested which lanes had the return freight density to support reusable containers, since sustainability and excursions needed separate answers.
KEY FINDINGS
  1. About 19% of lanes carried roughly 71% of excursion events, almost all of them long-haul air routes with ground legs above thirty-five degrees (client-reported, unverified by MMA).
  2. Most failures reflected handling delays rather than insufficient insulation, so upgrading to premium panel systems would have spent money without addressing the actual cause.
  3. Only 44 of the 340 lane combinations had return freight density supporting reusable rotation inside forty days, which capped what the sustainability target could realistically deliver.
  4. Extending qualified duration from 72 to 96 hours on the worst lanes cost less than a quarter of the premium upgrade the incumbents had proposed (client-reported, unverified by MMA).
RECOMMENDED STRATEGY
Phase 1: Phase 1 (0 to 7 months): Requalify only the highest-excursion lanes at extended duration rather than upgrading construction across the whole network. Phase 2: Phase 2 (7 to 20 months): Convert the forty-four lanes with adequate return density to reusable containers and report that volume against the sustainability target. Phase 3: Phase 3 (20 to 34 months): Address handling delays with carriers directly, since packaging cannot solve a problem created on the ground.
OUTCOME
The client cut long-haul excursions by roughly 62% within two years by extending duration on the worst lanes rather than upgrading everything, at about a quarter of the proposed cost. Reusable conversion on forty-four lanes met most of the single-use reduction target, and carrier handling discussions closed the remaining gap (client-reported, unverified by MMA).

Frequently Asked Questions

Foundational context covering the market sizes, CAGR, scope, country, region and competition that inform every finding below. This section is provided to cover basics and most often pre-purchase conversations, answered from the MMA Primary Research Dataset.

What is the current size of the Temperature Controlled Packaging Solutions Market?

The global temperature controlled packaging solutions market is valued at USD 13.6 billion in 2025, covering insulated shippers, refrigerants, vacuum panel systems, and reusable thermal containers. Refrigerated transport equipment and logistics services are excluded.

How large will the Temperature Controlled Packaging Solutions Market be by 2036?

The market is forecast to reach USD 35.08 billion by 2036 in the base case, about 2.37 times the 2026 level. That represents incremental value of roughly USD 20.26 billion across the decade.

What is the CAGR for the Temperature Controlled Packaging Solutions Market 2026 to 2036?

The market grows at a 9.0% CAGR in the base case, with bull and bear scenarios at 10.2% and 7.8%. The spread turns mainly on cell therapy approvals and reusable fleet expansion.

Which segment is growing fastest?

Cryogenic systems grow fastest at 12.2%, about 1.36 times the overall rate, on cell and gene therapy shipping below minus 150 degrees. Controlled room temperature systems follow at 10.8%.

Who are the major companies in the Temperature Controlled Packaging Solutions Market?

Leading suppliers include Sonoco ThermoSafe, Pelican BioThermal, Cold Chain Technologies, va-Q-tec, and CSafe. Fragmentation is moderate, with the top five holding roughly 34% of thermal packaging revenue across single-use and reusable models.

Which country is growing fastest?

India grows fastest at a 13.2% CAGR, as generic and biosimilar exporters must meet destination market temperature requirements. China and Indonesia follow on biologics capacity and distribution modernisation.

Report Segmentation Architecture

The full report scope spans multiple orthogonal segmentation dimensions, with cross-tabulated demand data provided for each dimension pair. Coverage extends further to regional breakdowns, trend trajectories, and the competitive detail needed to support segment-level decision-making.

By Thermal Performance Class

  • Refrigerated Two To Eight Degree Systems
  • Controlled Room Temperature Systems
  • Frozen And Deep Frozen Systems
  • Cryogenic Systems
  • Ambient Protective Systems

By End-Use Industry

  • Pharmaceutical Manufacturing and Distribution
  • Clinical Trial and Investigational Supply
  • Cell and Gene Therapy
  • Diagnostics and Laboratory Samples
  • Specialty Food and Perishables

By Supply Model

  • Single-Use Purchase
  • Reusable Container Rental
  • Managed Fleet and Depot Service
  • Distributor and Reseller Supply

By Region

  • North America
  • Western Europe
  • East Asia
  • South Asia and Pacific
  • Latin America
  • Middle East and Africa
  • Eastern Europe

Scope, Methodology, and Coverage

Every figure in this report is reproducible from documented input assumptions. The scope below maps the historical period, the forecast horizon, the segmentation dimensions, and the countries covered, alongside the underlying primary and qualitative methodology.
Historical Period
2020 to 2025
Forecast Period
2026 to 2036
Base Year
2025 (USD billions; MMA Primary Research Dataset, August 2026)
Market Definition
The temperature controlled packaging solutions market comprises the manufacture, sale, and rental of thermal protection systems that hold a defined temperature range around goods in transit, valued at supplier selling prices and rental revenue to pharmaceutical manufacturers, distributors, clinical trial supply organisations, and specialty shippers. It spans insulated parcel and pallet shippers, phase change and water-based refrigerants, vacuum insulated panel systems, reusable thermal containers with associated depot and reconditioning service, and cryogenic dry vapour shippers, together with the qualification and validation documentation supplied with them. Refrigerated transport equipment including reefer containers and vehicles, temperature monitoring devices and data loggers sold separately from packaging, cold chain logistics and freight forwarding services, warehouse refrigeration, and primary product packaging or barrier films sold as a performance packaging category are excluded.
Quantitative Units
USD billions (current prices); shipment volume in million units and container rental cycles where applicable
Segmentation Dimensions
By Thermal Performance Class; By End-Use Industry; By Supply Model; By Region
Regions Covered
North America, Western Europe, East Asia, South Asia and Pacific, Latin America, Middle East and Africa, Eastern Europe
Countries Covered
USA, China, Germany, France, UK, Japan, South Korea, India, Australia, Canada, Brazil, Mexico, Indonesia, Vietnam, Thailand, Malaysia, UAE, Saudi Arabia, South Africa, Nigeria, Turkey, Poland, Netherlands, Italy, Spain, Sweden, Switzerland, Argentina, Colombia, Singapore, and additional markets relevant to this sector
Key Companies Profiled
Sonoco ThermoSafe, Pelican BioThermal, Cold Chain Technologies, va-Q-tec, CSafe, Envirotainer, SkyCell, Tower Cold Chain, Cryopak, TemperPack, Tempack, Intelsius, Woolcool, Insulated Products Corporation, Sofrigam, AeroSafe Global, Klinge Corporation, Cryoport, Nordic Cold Chain Solutions, American Aerogel
Quantitative Methodology
Primary survey, n=3,800 respondents, Q4 2025, six countries; demand-side model with trade association cross-validation
Qualitative Methodology
47 expert interviews, Q4 2025; applied to validate demand model assumptions, identify emerging dynamics, and assess competitive positioning
Report Format
PDF and XLSX data workbook (Word format preview document)
Publisher
Market Minds Advisory
Report Code
MMA-2026-PAC-267
Published
August 2026
Contact
sales@marketmindsadvisory.com | www.marketmindsadvisory.com

Purchase the full Temperature Controlled Packaging Solutions Market Report (2026 to 2036).

The full MMA Temperature Controlled Packaging Solutions report sizes the market across five thermal performance classes, five end-use industries, four supply models, and seven regions through 2036. It profiles 20 suppliers on a consistent basis of temperature-controlled packaging and container rental revenue, scoring each on validated installed position, qualification support capability, network coverage, and duration performance. Scenario models quantify how qualification lock-in, packaging waste reporting, and cell therapy approvals move both volume and achievable margin by class. The report also includes lane excursion benchmarking, qualification timeline mapping by system type, reusable rotation economics modelling, and cost per shipment comparison across single-use and rental models.
Five-class and four-model market sizing to 2036
Twenty-supplier benchmark on thermal packaging and rental revenue
Lane excursion benchmarking across regions and performance classes
Qualification timeline mapping by thermal system type
Reusable rotation economics modelling against lane return density
Cost per shipment comparison across single-use and rental

Built For The People Who Decide

From boardroom strategy to bench-side execution, this report is read cover-to-cover by leaders shaping the next decade of their industry, turning demand scenarios, market dynamics and valuation benchmarks into decisions.
CXOs/ Presidents/ VPs/ Managers
M&A and Corporate Development
Strategy Teams and R&D Heads
Procurement and Product Directors
Regulatory and Compliance Leaders
Investor Relations and Equity Analysts