Market Minds Advisory
Telehealth and Telemedicine Market

Telehealth and Telemedicine Market: Relocating Clinician Minutes, Not Creating Them

A video consultation consumes as many clinician minutes as the appointment it replaced, sometimes more. Everything in this market that actually grew found a way to break that one-clinician-one-patient ratio instead.

Lead Analyst

Alice Ballenger

Published

September 2026

Make Smarter Decisions with Customized Research Insights

Request a free sample report and evaluate market opportunities, growth trends, and competitive dynamics relevant to your business needs.

2025 MARKET VALUE$92.0BMarket Size 2025
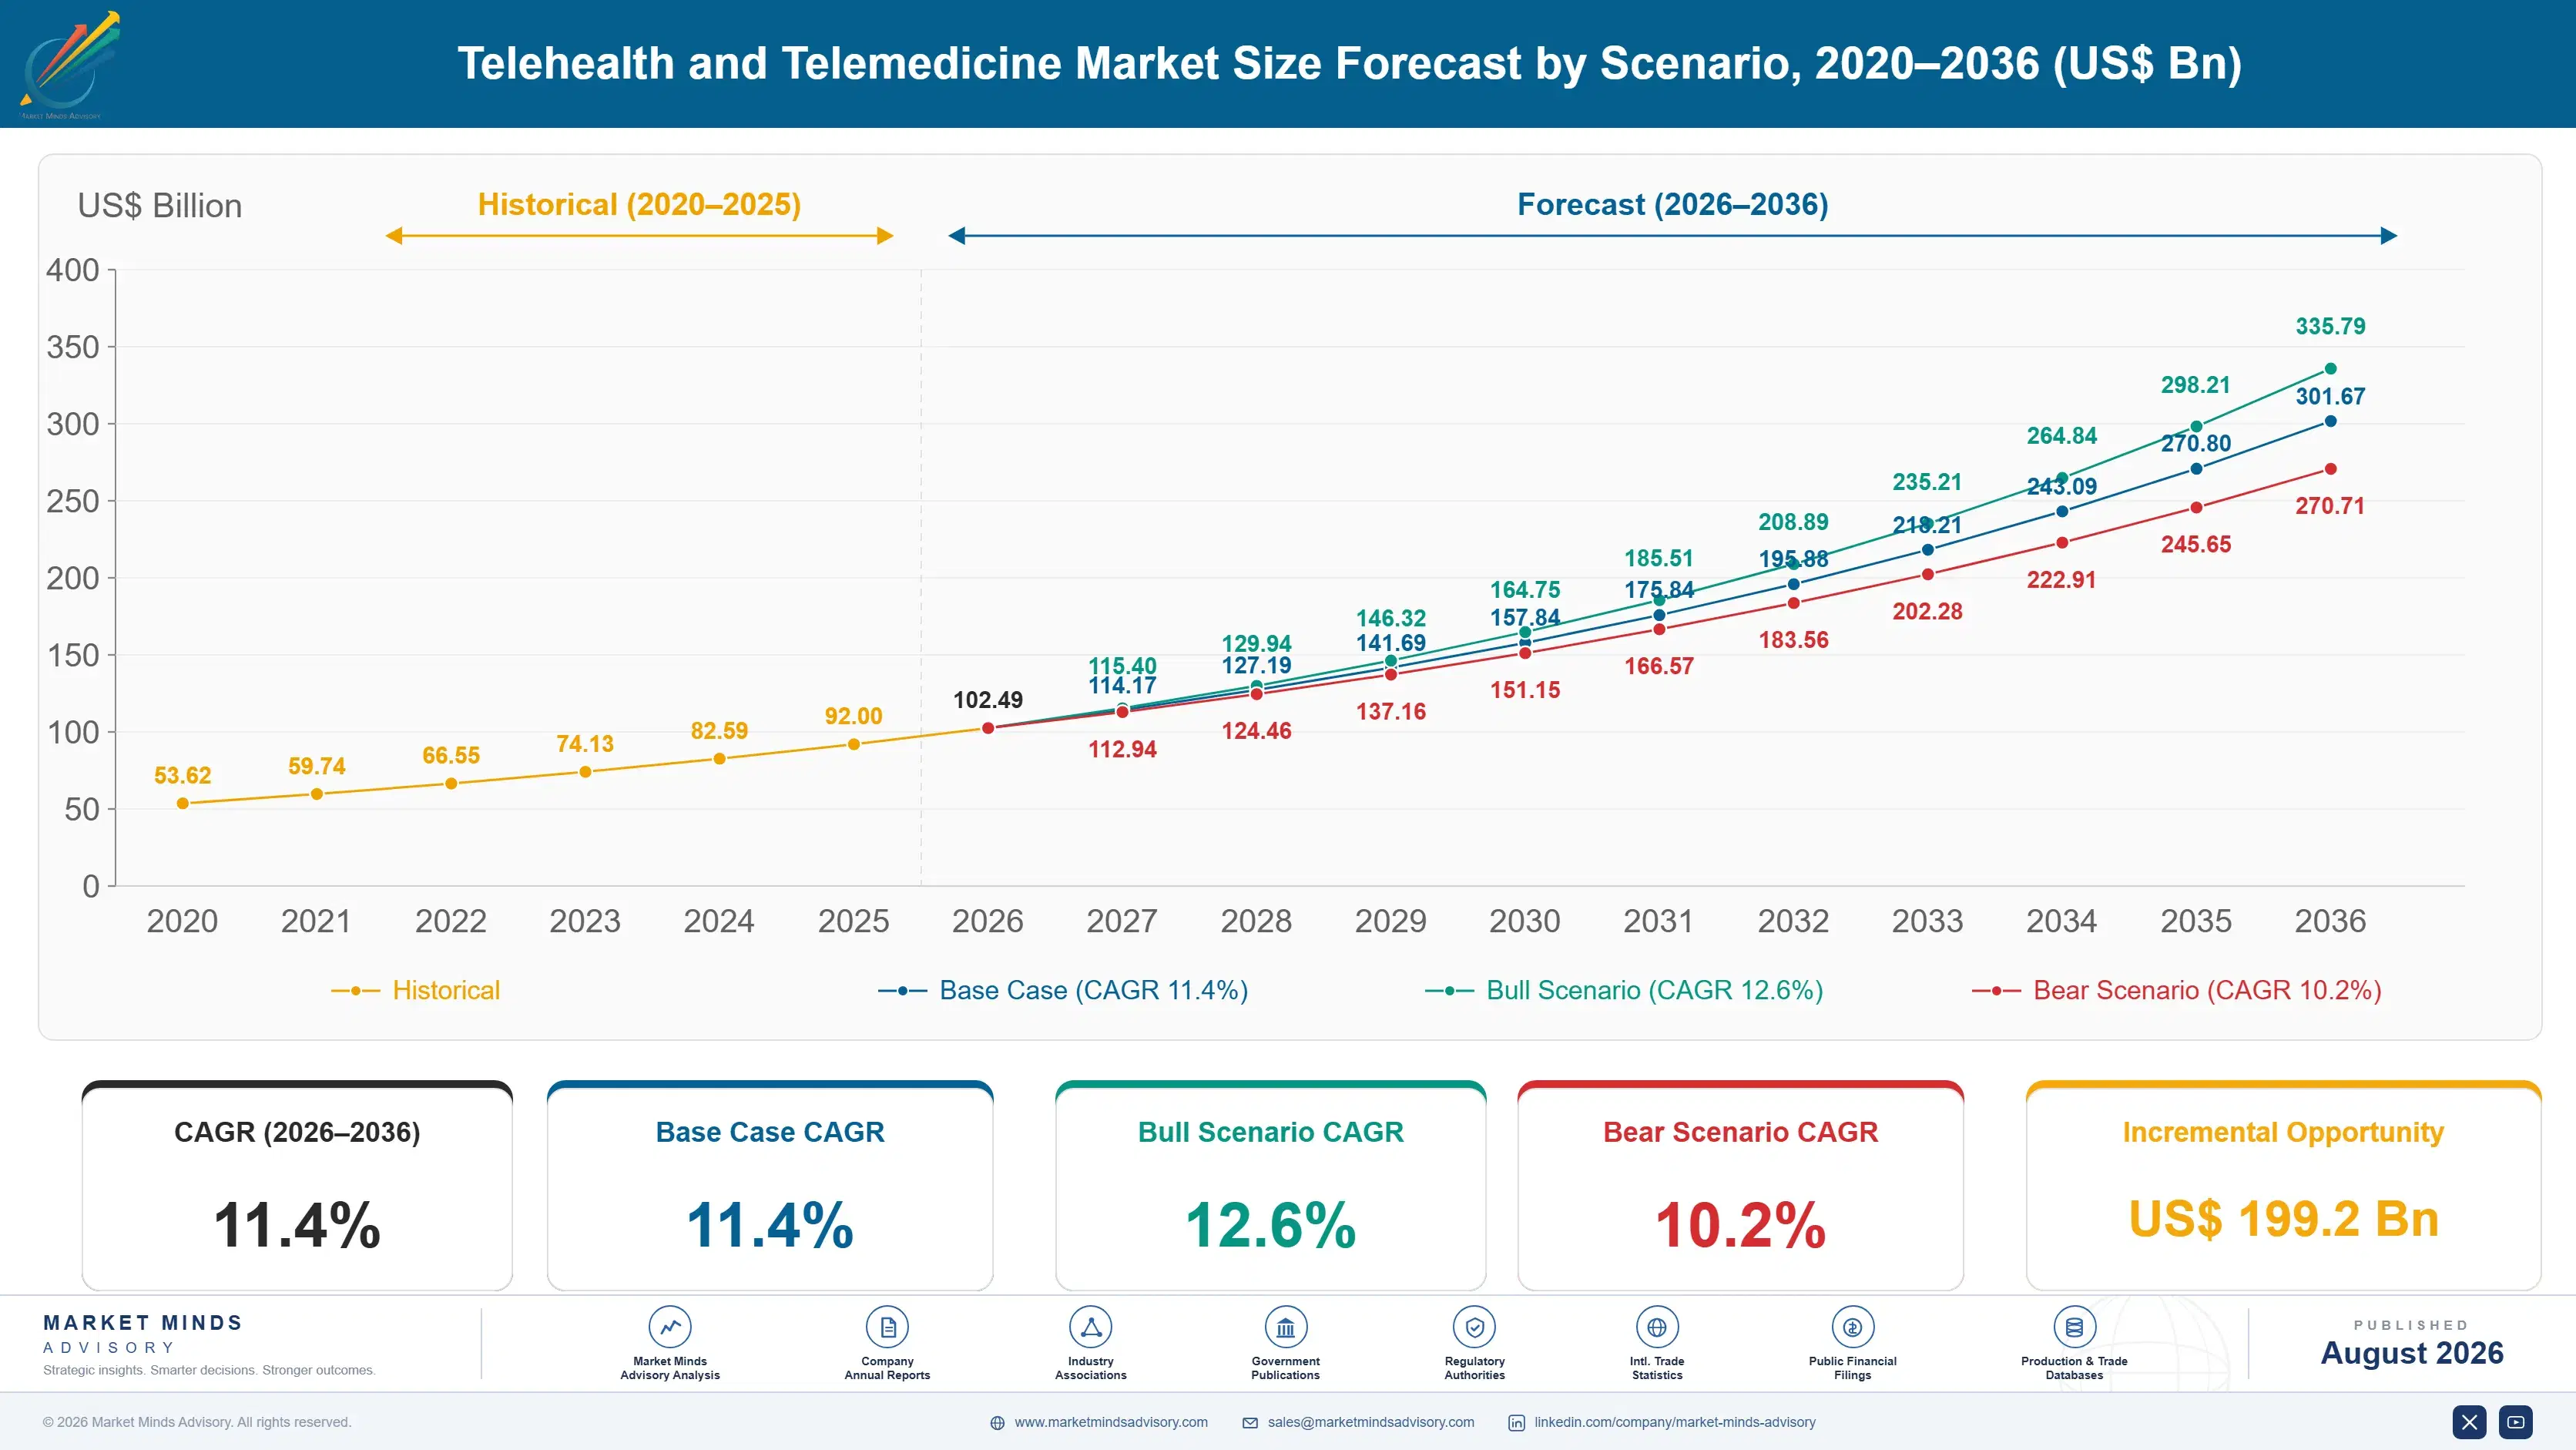
2036 FORECAST VALUE$301.7BBase Case , 2026 to 2036
CAGR 2026 TO 203611.4 %Bull 12.6% / Bear 10.2%
INCREMENTAL OPPORTUNITY$199.2BNet 10- year value creation
EXPANSION MULTIPLE2.94x2036 value over 2026 base
Strategic Levers
M&A Pipeline
Regional Outlook
Country Rankings
Competitive Intelligence
Segmental Deep-dive
Call-Us : 91 93563 13602

Executive Snapshot and Market Trajectory

The constraint was never bandwidth or software. A video consultation takes about 19 clinician minutes against a comparable in-person appointment, so synchronous telehealth moves capacity around without adding any of it. Everything that survived the retreat after 2021 works by breaking the one-clinician-one-patient ratio rather than merely by digitising it.
Growth runs at 11.4%, and it comes from care models that scale rather than from consultations that cannot. Remote patient monitoring grows fastest at 17.1%, exactly 1.50 times the market rate, because a single clinician reviews batched data for many patients at once rather than one. Virtual nursing and hospital-at-home follows at 15.9%, solving a nursing staffing problem rather than a patient access one.
Concentration reaches only 19% across the top five measured on annual virtual care and remote monitoring revenue, spanning platforms, provider groups, and monitoring device makers that barely compete with one another at all. North America holds 42%, far above its framework band, on billing codes that exist at scale nowhere else in the world. China leads global consultation volume by a very wide margin and contributes far less value than that.
Market Definition
This market covers virtual care delivery and the technology enabling it, measured at realised revenue to service providers and platform vendors, spanning synchronous video and telephone consultation, asynchronous store-and-forward consultation, remote patient monitoring, virtual nursing and hospital-at-home, tele-behavioural health services, and direct-to-consumer prescribing platforms. Electronic health record systems, in-person care delivered after a virtual triage, medical devices sold outside a monitoring service, and pharmacy fulfilment revenue fall outside scope.
Base Year Value
$92.0B in 2025 (MMA Primary Research Dataset, August 2026)
Forecast Period
2026 to 2036, eleven discrete annual values
CAGR
11.4% base case. Bull 12.6%. Bear 10.2%.
Fastest Growth Segment
Remote Patient Monitoring: 17.1% CAGR
Fastest Growth Country
India: 14.2% CAGR
Fastest Growth Region
South Asia and Pacific: 13.4% CAGR
Largest Region
North America: 42% of 2025 global value
Market Leaders
Teladoc Health, Ping An Healthcare and Technology, Hims & Hers Health, Amwell, Included Health. Source: MMA Analysis based on company annual reports.
Primary Survey
n=3,800 procurement and R&D decision-makers, Q4 2025, six countries
Methodology
Demand-side build-up, cross-validated against public data, 47 expert interviews

Telehealth and Telemedicine Market Forecast Scenarios

telehealth-and-telemedicine-market-size-forecast-scenario-1787299871912
The 2020 to 2025 period averaged 10.2% and that figure conceals a collapse and a rebuild. Volume rose enormously through 2020 and 2021, then fell back hard across general medical specialties as in-person capacity reopened, with only about 23% of peak volume retained. What survived was concentrated in behavioural health, dermatology, and follow-up care. Underneath the retreat, remote monitoring and hospital-at-home grew steadily and quietly throughout.
Three mechanisms carry the 11.4% base case. Remote monitoring reimbursement is the largest, since device and management codes now pay for a model where one clinician reviews many patients rather than seeing one. Virtual nursing is the second, growing at 15.9% because it answers a nursing shortage rather than a patient access problem. And Asian consultation platforms are the third, expanding volume enormously at revenue per encounter far below Western levels.
The 12.6% bull case rests on cross-border and multi-state licensure widening, since only 34% of clinicians can practise beyond one jurisdiction and that cap is what prevents supply pooling from working. The 10.2% bear case is remote monitoring adherence, which sits near 58% at six months and determines whether the billing codes underneath the fastest growing segment are collectible at all.

The Ratio Nobody Managed To Break

The economics of a video consultation are worth stating carefully because so much was built on getting them wrong. A remote appointment consumes around 19 clinician minutes against a comparable in-person one, sometimes more, since the physical examination is replaced by longer history-taking and by follow-up arrangements that would otherwise have happened in the room. Travel time disappears for the patient and not for the doctor. Capacity is therefore relocated rather than created.
TOP FIVE CONCENTRATION19%Fragmented across platforms, providers, and monitoring device makers
CLINICIAN MINUTES PER VISIT19 minutesAgainst a comparable in-person appointment of similar clinical complexity
PANDEMIC PEAK RETENTION23%Of peak volume retained across general medical specialties afterward
BEHAVIOURAL HEALTH SHARE38%Of retained synchronous volume across developed health systems now
MULTI-JURISDICTION LICENSURE SHARE34%Of clinicians licensed beyond a single jurisdiction to practise
SIX MONTH ADHERENCE58%Of enrolled patients still transmitting data after six months
That explains the shape of the retreat after 2021. Around 23% of peak volume was retained across general medical specialties, and behavioural health now accounts for 38% of what remains, because psychiatry and therapy were always conversations rather than examinations. Video did not change how that care is delivered, it changed who could reach it, and in a specialty with severe workforce shortage that is worth a great deal.
Everything growing fast breaks the one-to-one ratio in some way. A clinician reviewing batched monitoring data covers many patients in the time one consultation takes. A virtual nurse covers several hospital rooms at once. Asynchronous dermatology review handles a queue rather than a calendar. The technology was never the constraint; the clinician's hour always was.
"Every failed telehealth business I have looked at was selling a video call at a lower price than a clinic visit while paying the same doctor for the same time. There was no margin in that anywhere and there was never going to be."
Director, Digital Health and Virtual Care Delivery Practice · MMA Technology and

Market Trends

Monitoring Grew Because One Clinician Covers Many Patients

Remote patient monitoring pays for device supply and for time spent reviewing transmitted data, and a clinician working through batched readings covers dozens of patients in the time a single consultation absorbs. That is the only reimbursement model in virtual care with genuine operating leverage inside it. Growth runs at 17.1% against 11.4% for the market. The binding constraint is not enrolment but adherence, since roughly 58% of enrolled patients are still transmitting at six months and a patient who stops transmitting generates no billable review at all. Enrolment growth without adherence is simply reported activity.
Market Impact: 38% of retained synchronous volume
Virtual Nursing Answers Staffing Rather Than Access

A virtual nurse on camera handles admission documentation, discharge teaching, medication verification, and second-nurse checks across several rooms at once, freeing bedside staff for work that requires physical presence. Hospitals adopting it report meaningful reductions in documentation burden and in nurse turnover, which is what actually justifies the investment. Growth runs at 15.9%, second fastest in this market. The argument is a workforce one rather than a patient access one, and hospitals respond to it far more readily than to anything framed around convenience. Convenience arguments stopped working in hospital capital committees years ago.
Market Impact: India grows at 14.2% annually

Market Opportunities and Growth Drivers

Behavioural Health Shortage Makes Geography The Constraint

Psychiatry and therapy were always conducted through conversation, so nothing clinical is lost when the conversation happens over video, and behavioural health now accounts for 38% of retained synchronous volume across developed systems. Workforce shortage is severe enough that many regions have no local provision at all, which makes remote access the difference between treatment and none. Waiting lists rather than patient preference drive this. It is the one specialty where virtual delivery expanded the treated population rather than relocating it. Nothing else in virtual care can claim that honestly.
Market Impact: Only 34% licensed beyond one

Indian Teleconsultation Volume Is Expanding Enormously

Public teleconsultation programmes in India have delivered consultation volumes in the hundreds of millions, reaching populations with no realistic access to a physician otherwise, while private platforms have built alongside them on pharmacy and diagnostics integration. India contributes the fastest national growth rate in this forecast at 14.2%. Revenue per consultation is a small fraction of Western levels, so the value contribution lags the volume considerably. The commercial model rests on adjacent fulfilment rather than on the consultation fee itself. Volume and value diverge more sharply here than anywhere. Fulfilment carries the economics here.
Market Impact: Adherence falls to 58%

Market Restraints and Challenges

Licensure Caps The Supply Pooling That Justified Everything

The economic promise of virtual care was pooling clinician supply across geography, and only 34% of clinicians hold licences beyond a single jurisdiction. The root cause is that medical licensing is administered locally and predates any of this by a century. Commercial impact is that a platform with idle capacity in one state or country cannot serve a waiting list in the next one, which removes most of the efficiency the model was built on. Compacts, mutual recognition arrangements, and registration reform are progressing slowly and unevenly. Nothing else caps utilisation as hard as this does.
Market Impact: Growing at 17.1% annually

Monitoring Adherence Decides Whether Codes Are Collectible

Remote monitoring reimbursement generally requires a minimum number of transmitted days per month, and roughly 58% of enrolled patients are still transmitting at six months. The root cause is that enrolment is easy and daily engagement with a device is not, particularly among the older multimorbid patients these programmes target. Commercial impact is that reported enrolment badly overstates collectible revenue in the fastest growing segment. Providers are responding with simplified cellular devices, proactive outreach on missed days, and family involvement in setup. Reported enrolment growth and collectible revenue have diverged steadily across the sector as a result.
Market Impact: Growing at 15.9% annually
3 additional market trends, 4 additional growth drivers, and 2 additional restraints and challenges are covered in the full report. Contact sales@marketmindsadvisory.com to access the complete intelligence.

Segment CAGR and Growth Architecture

Segmentation follows the care delivery model, because the model determines whether clinician time scales with patient count, who reimburses it, what the revenue per encounter looks like, and whether any operating leverage exists at all. Clinical specialty and technology stack both cut across every model rather than separating them, which makes either a weak primary dimension here.
telehealth-and-telemedicine-market-market-share-analysis-1787299872446

Remote Patient Monitoring

The fastest model at 17.1%, exactly 1.50 times the market rate, and the only one where a clinician's hour covers many patients rather than one. Connected blood pressure cuffs, glucose meters, weight scales, and cardiac monitors transmit readings that are reviewed in batches, with reimbursement paying separately for device supply and for management time. Hypertension, heart failure, and diabetes carry most of the volume. The real constraint is adherence rather than enrolment, since roughly 58% of patients are still transmitting at six months and reimbursement usually requires a minimum transmission threshold each month to be met. Reported enrolment therefore overstates collectible revenue considerably across most published programme figures. Nobody publishes the gap.
CAGR 17.1%

Virtual Nursing And Hospital-At-Home

Second fastest at 15.9%, and the model that sells to a hospital chief nursing officer rather than to a patient or a payer. A virtual nurse covers several rooms at once for admission documentation, discharge teaching, medication verification, and second-nurse checks, which returns hours to bedside staff who are in genuinely short supply. Hospital-at-home extends the same logic to acute care delivered in a residence with remote oversight and periodic visits. Both are justified on workforce economics and length of stay rather than on convenience, which is why they survived a period when convenience arguments stopped working entirely. Nothing framed around convenience survived that period. Both models survived a period when nothing else did.
CAGR 15.9%
Full segment breakdown across 6 segments available in the complete report.

Regional Architecture and Country Demand Map

Consultation volume and market value point in opposite directions here, more sharply than in almost any market we cover. North America sits far above its framework band on reimbursement codes that exist at scale nowhere else, while China delivers far more consultations at a small fraction of the revenue.

North America

Forty-two percent, far above the framework band, and the justification is billing infrastructure rather than adoption: the United States has distinct reimbursement codes for remote monitoring device supply, monitoring management time, virtual check-ins, and hospital-at-home, and no other health system pays separately for those activities at comparable scale. A substantial cash direct-to-consumer prescribing market sits alongside that, covering weight management, men's health, and dermatology outside insurance entirely. Multi-state licensure compacts have progressed further here than cross-border arrangements anywhere else. Growth at 10.6% sits below the global rate on a large and already well-penetrated base. Canadian provincial systems reimburse virtual visits without separate monitoring codes, which is why the regional figure is overwhelmingly an American number rather than a continental one.
Share: 42% | CAGR: 10.6% (2026 to 2036)

East Asia

Consultation volume here dwarfs everywhere else and the revenue does not follow it. Chinese internet hospital platforms handle enormous consultation counts, with revenue per encounter a small fraction of Western levels and much of the commercial model resting on pharmacy and diagnostics fulfilment that sits outside this scope. Regulatory recognition of internet hospitals gave the sector legitimacy that most markets took far longer to grant. Japanese and Korean adoption is smaller, more conservative, and concentrated in follow-up care. Growth at 12.6% runs above the global rate on continued platform expansion and gradually rising realised prices per encounter. Taiwanese adoption is small and well integrated into existing primary care rather than delivered through separate platforms.
Share: 22% | CAGR: 12.6% (2026 to 2036)
Regional intelligence for 5 additional markets available in the complete report: Western Europe, South Asia and Pacific, Latin America, Middle East and Africa, Eastern Europe. Contact sales@marketmindsadvisory.com.
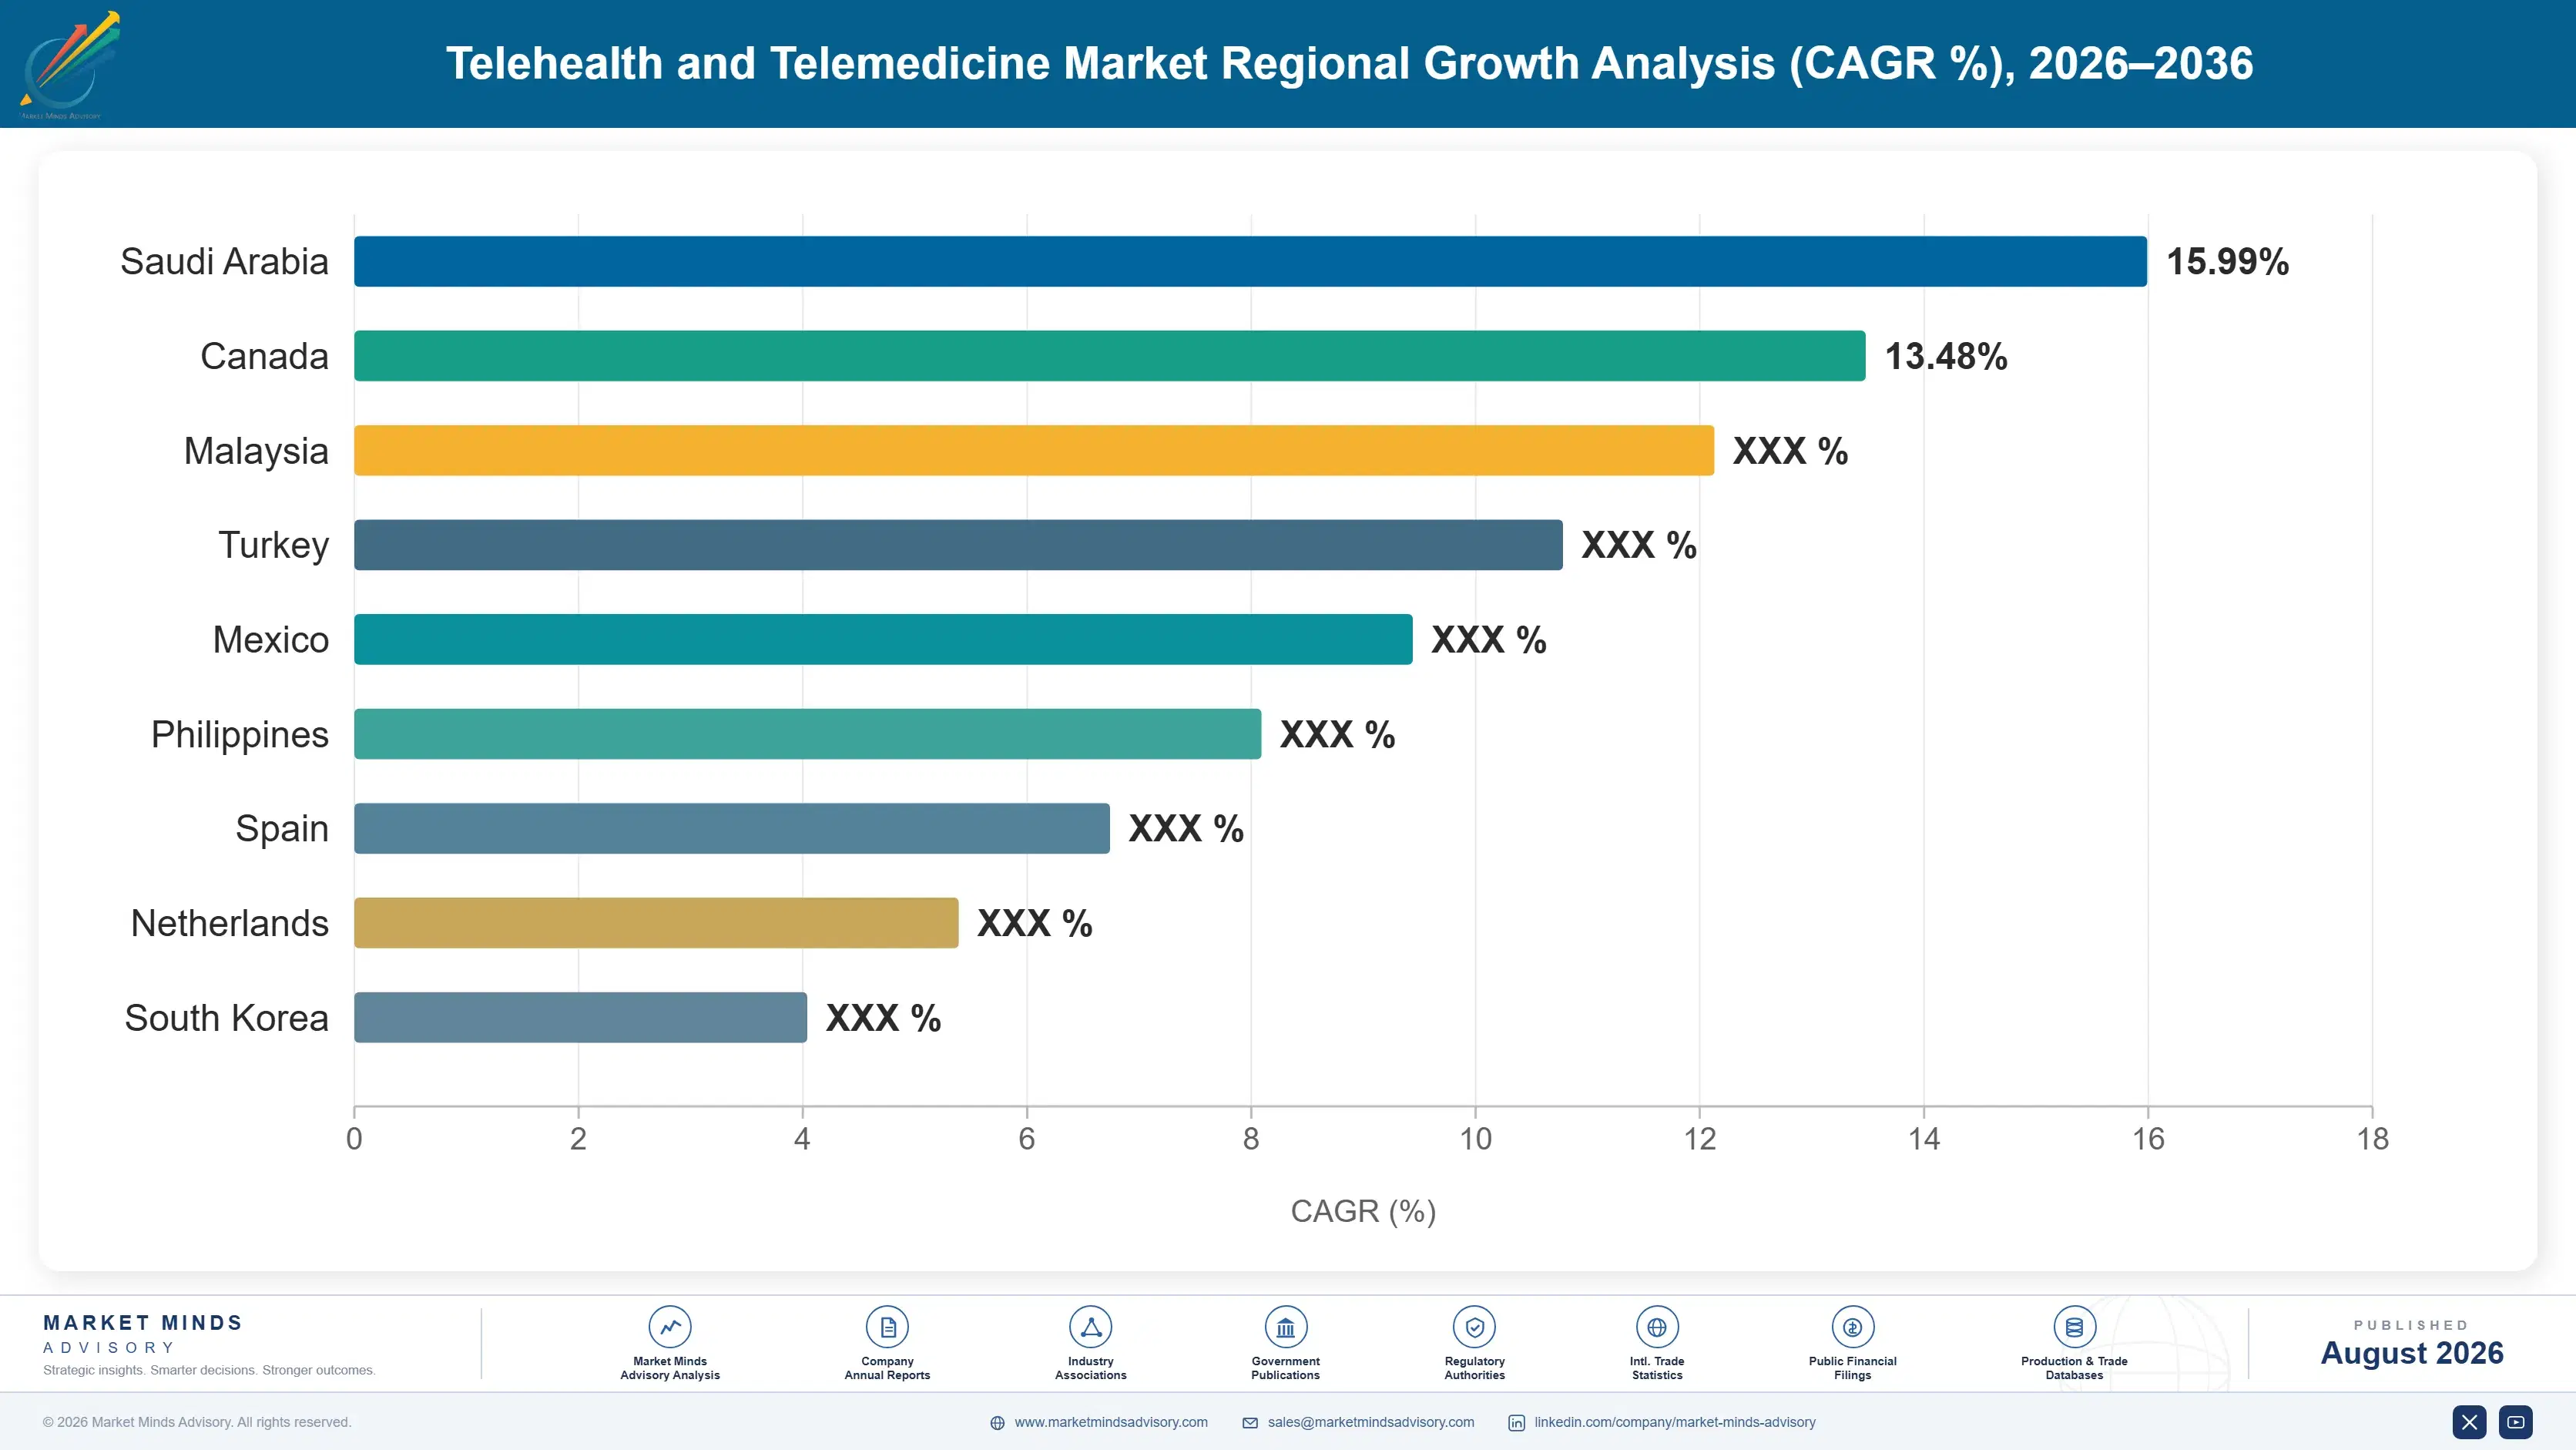
telehealth-and-telemedicine-market-country-cagr-analysis-1787299872962

Building Models That Actually Scale

A synchronous consultation consumes about 19 clinician minutes and produces no operating leverage whatever, however many users a given platform manages to accumulate. Value comes from models where one clinician covers many patients, from protecting monitoring adherence, from pursuing licensure reach deliberately, and from selling workforce economics to hospitals rather than convenience to patients.

Build Where Clinician Time Does Not Scale With Patients

Every durable business in this market broke the one-clinician-one-patient ratio somewhere. Batched monitoring review, asynchronous queues, and virtual nursing across multiple rooms all let a single clinician hour serve many patients, while a video consultation serves exactly one for about 19 minutes. Platforms whose cost base is clinician minutes have gross margin that never improves with scale, no matter how many users they add. Reweighting a portfolio from synchronous consultation toward batched review typically lifts contribution margin by 12 to 18 points on the same clinical workforce. No amount of user growth substitutes for that.
Market Impact: Lifts contribution margin by 12 to 18 points

Treat Monitoring Adherence As The Revenue Line It Is

Reimbursement for remote monitoring usually requires a minimum number of transmitted days each month, and roughly 58% of enrolled patients are still transmitting at six months, which means reported enrolment overstates collectible revenue substantially. Proactive outreach on missed transmission days, cellular devices requiring no home network setup, and family involvement at enrolment each move that number materially. A dedicated adherence team costs around 900,000 dollars annually per hundred thousand enrolled patients and returns several times that in collectible claims. Most operators still report enrolment as though it were revenue. The gap surfaces only when claims are denied.
Market Impact: Adherence team costs about 900,000 dollars each year

Pursue Licensure Reach As A Commercial Programme

Only 34% of clinicians hold licences beyond one jurisdiction, which caps the supply pooling that makes virtual care economically interesting in the first place. Funding multi-state or cross-border licensure for a clinical workforce costs perhaps 3,000 dollars per clinician in fees and administration and converts idle capacity in one region into billable work in another. Most operators treat licensure as a compliance chore handled case by case rather than as the capacity lever it genuinely is. Nothing else raises utilisation as cheaply. Utilisation gaps of thirty points between regions are common where licensure was handled reactively rather than planned.
Market Impact: Licensure costs roughly 3,000 dollars for each clinician

Sell Workforce Economics To Hospitals Not Convenience

Virtual nursing propositions built on patient experience lose to every other capital request a hospital receives. The same proposition built on documentation hours returned to bedside staff, reduced nurse turnover, and shorter length of stay competes against nothing, because chief nursing officers are managing a shortage rather than a satisfaction score. Programmes justified that way have grown at 15.9% while access-framed offers stalled. The change costs nothing beyond rewriting a business case and putting a different executive in the room. The executive signing it is managing a shortage rather than a satisfaction score.
Market Impact: Workforce-framed programmes now grow at 15.9% each year

Who Controls the Margin Pool

Concentration reaches only 19% across the top five measured on annual virtual care and remote monitoring revenue, and the low figure reflects a category that is several unrelated businesses sharing a label. Consultation platforms, cash prescribing operators, monitoring device manufacturers, and hospital virtual nursing vendors appear on the same leaderboard while almost never appearing in the same procurement process. The gap between leader and challenger says more about definitional boundaries
Competitive activity runs on three fronts. Operating leverage is the first, since a platform paying clinicians by the minute has no path to margin however large it grows. Licensure footprint is the second, because it determines whether capacity in one region can serve demand in another. Reimbursement coding expertise is the third, and it is where a surprising amount of the value in remote monitoring actually sits.

Pressure comes from two directions. Health systems are building virtual capability in-house rather than buying it, having watched vendor economics closely enough to understand where the margin was going. And cash direct-to-consumer prescribing has attracted regulatory attention in several markets simultaneously, which threatens the highest-margin part of the category and the part carrying most of its forward expectation.
telehealth-and-telemedicine-market-company-positioning-matrix-1787299873488

Competitive Moat and Risk Dimensions

TELADOC HEALTH

Moat: Employer and payer contract breadth

Multi-year contracts with large employers and health plans supply enrolled member populations that do not need acquiring individually, which is the most expensive part of any virtual care business. That distribution took a decade to assemble and renews on cycles measured in years. Reaching those members any other way costs far more per head.
TELADOC HEALTH

Risk: Cost base is clinician minutes

A business weighted toward synchronous consultation pays clinicians for time that scales one to one with patients served, so gross margin does not improve as volume grows. Enrolled populations are valuable and utilisation of them is expensive to serve. Shifting toward asynchronous and monitoring models requires different clinical staffing, different codes, and a different operating rhythm entirely.
PING AN HEALTHCARE AND TECHNOLOGY

Moat: Consultation volume at enormous scale

Handling consultation volumes far above anything in Western markets produces clinical data, triage patterns, and workflow understanding that no smaller operator can assemble. Integration with insurance, pharmacy, and diagnostics inside one group means the consultation does not have to carry the economics alone. That combination is difficult for a standalone platform to replicate anywhere.
PING AN HEALTHCARE AND TECHNOLOGY

Risk: Revenue per encounter stays low

Enormous volume at a small fraction of Western revenue per consultation means value grows far more slowly than usage does, and much of the monetisation sits in adjacent fulfilment rather than in care delivery. Regulatory attention to online prescribing and pharmacy linkage is a persistent exposure. Scale in encounters is not the same thing as scale in revenue.

Players Tracked

Prominent Players

Teladoc Health
Ping An Healthcare and Technology
Hims & Hers Health
Amwell
Included Health

Other Key Players

JD Health
Alibaba Health
Doctolib
Kry
Practo
Halodoc
Philips
Medtronic
Masimo
iRhythm Technologies
Dexcom
Omada Health
Talkspace
LifeMD
Medically Home

Recent Developments

JANUARY 2025

Hospital group expands virtual nursing across acute inpatient units

A hospital group extended virtual nursing coverage across its acute inpatient units, citing documentation hours returned to bedside staff and reduced nurse turnover in its published capital justification. The decision was internal capital policy rather than any joint venture, acquisition, or framework agreement with a virtual care vendor.
Signal: Workforce economics rather than patient convenience is what carries a virtual care business case through a hospital board
APRIL 2025

Health system adds remote monitoring codes for heart failure management

A national health system introduced separate reimbursement for remote monitoring device supply and for clinician review time in heart failure management, following an evaluation of admission avoidance. The change was a reimbursement policy decision rather than any procurement arrangement or partnership with a device manufacturer.
Signal: Paying separately for review time is what creates operating leverage, since one clinician then covers many patients
AUGUST 2025

Licensure compact adds further jurisdictions for remote practice

A multi-jurisdiction licensure compact admitted additional member states, widening the population that participating clinicians may treat remotely without separate applications in each jurisdiction. The expansion was a regulatory development rather than any commercial arrangement, lobbying settlement, or agreement involving virtual care operators. No transition period was specified.
Signal: Licensure reach rather than any software capability determines whether idle clinical capacity can serve waiting demand

Paying For Clinician Time

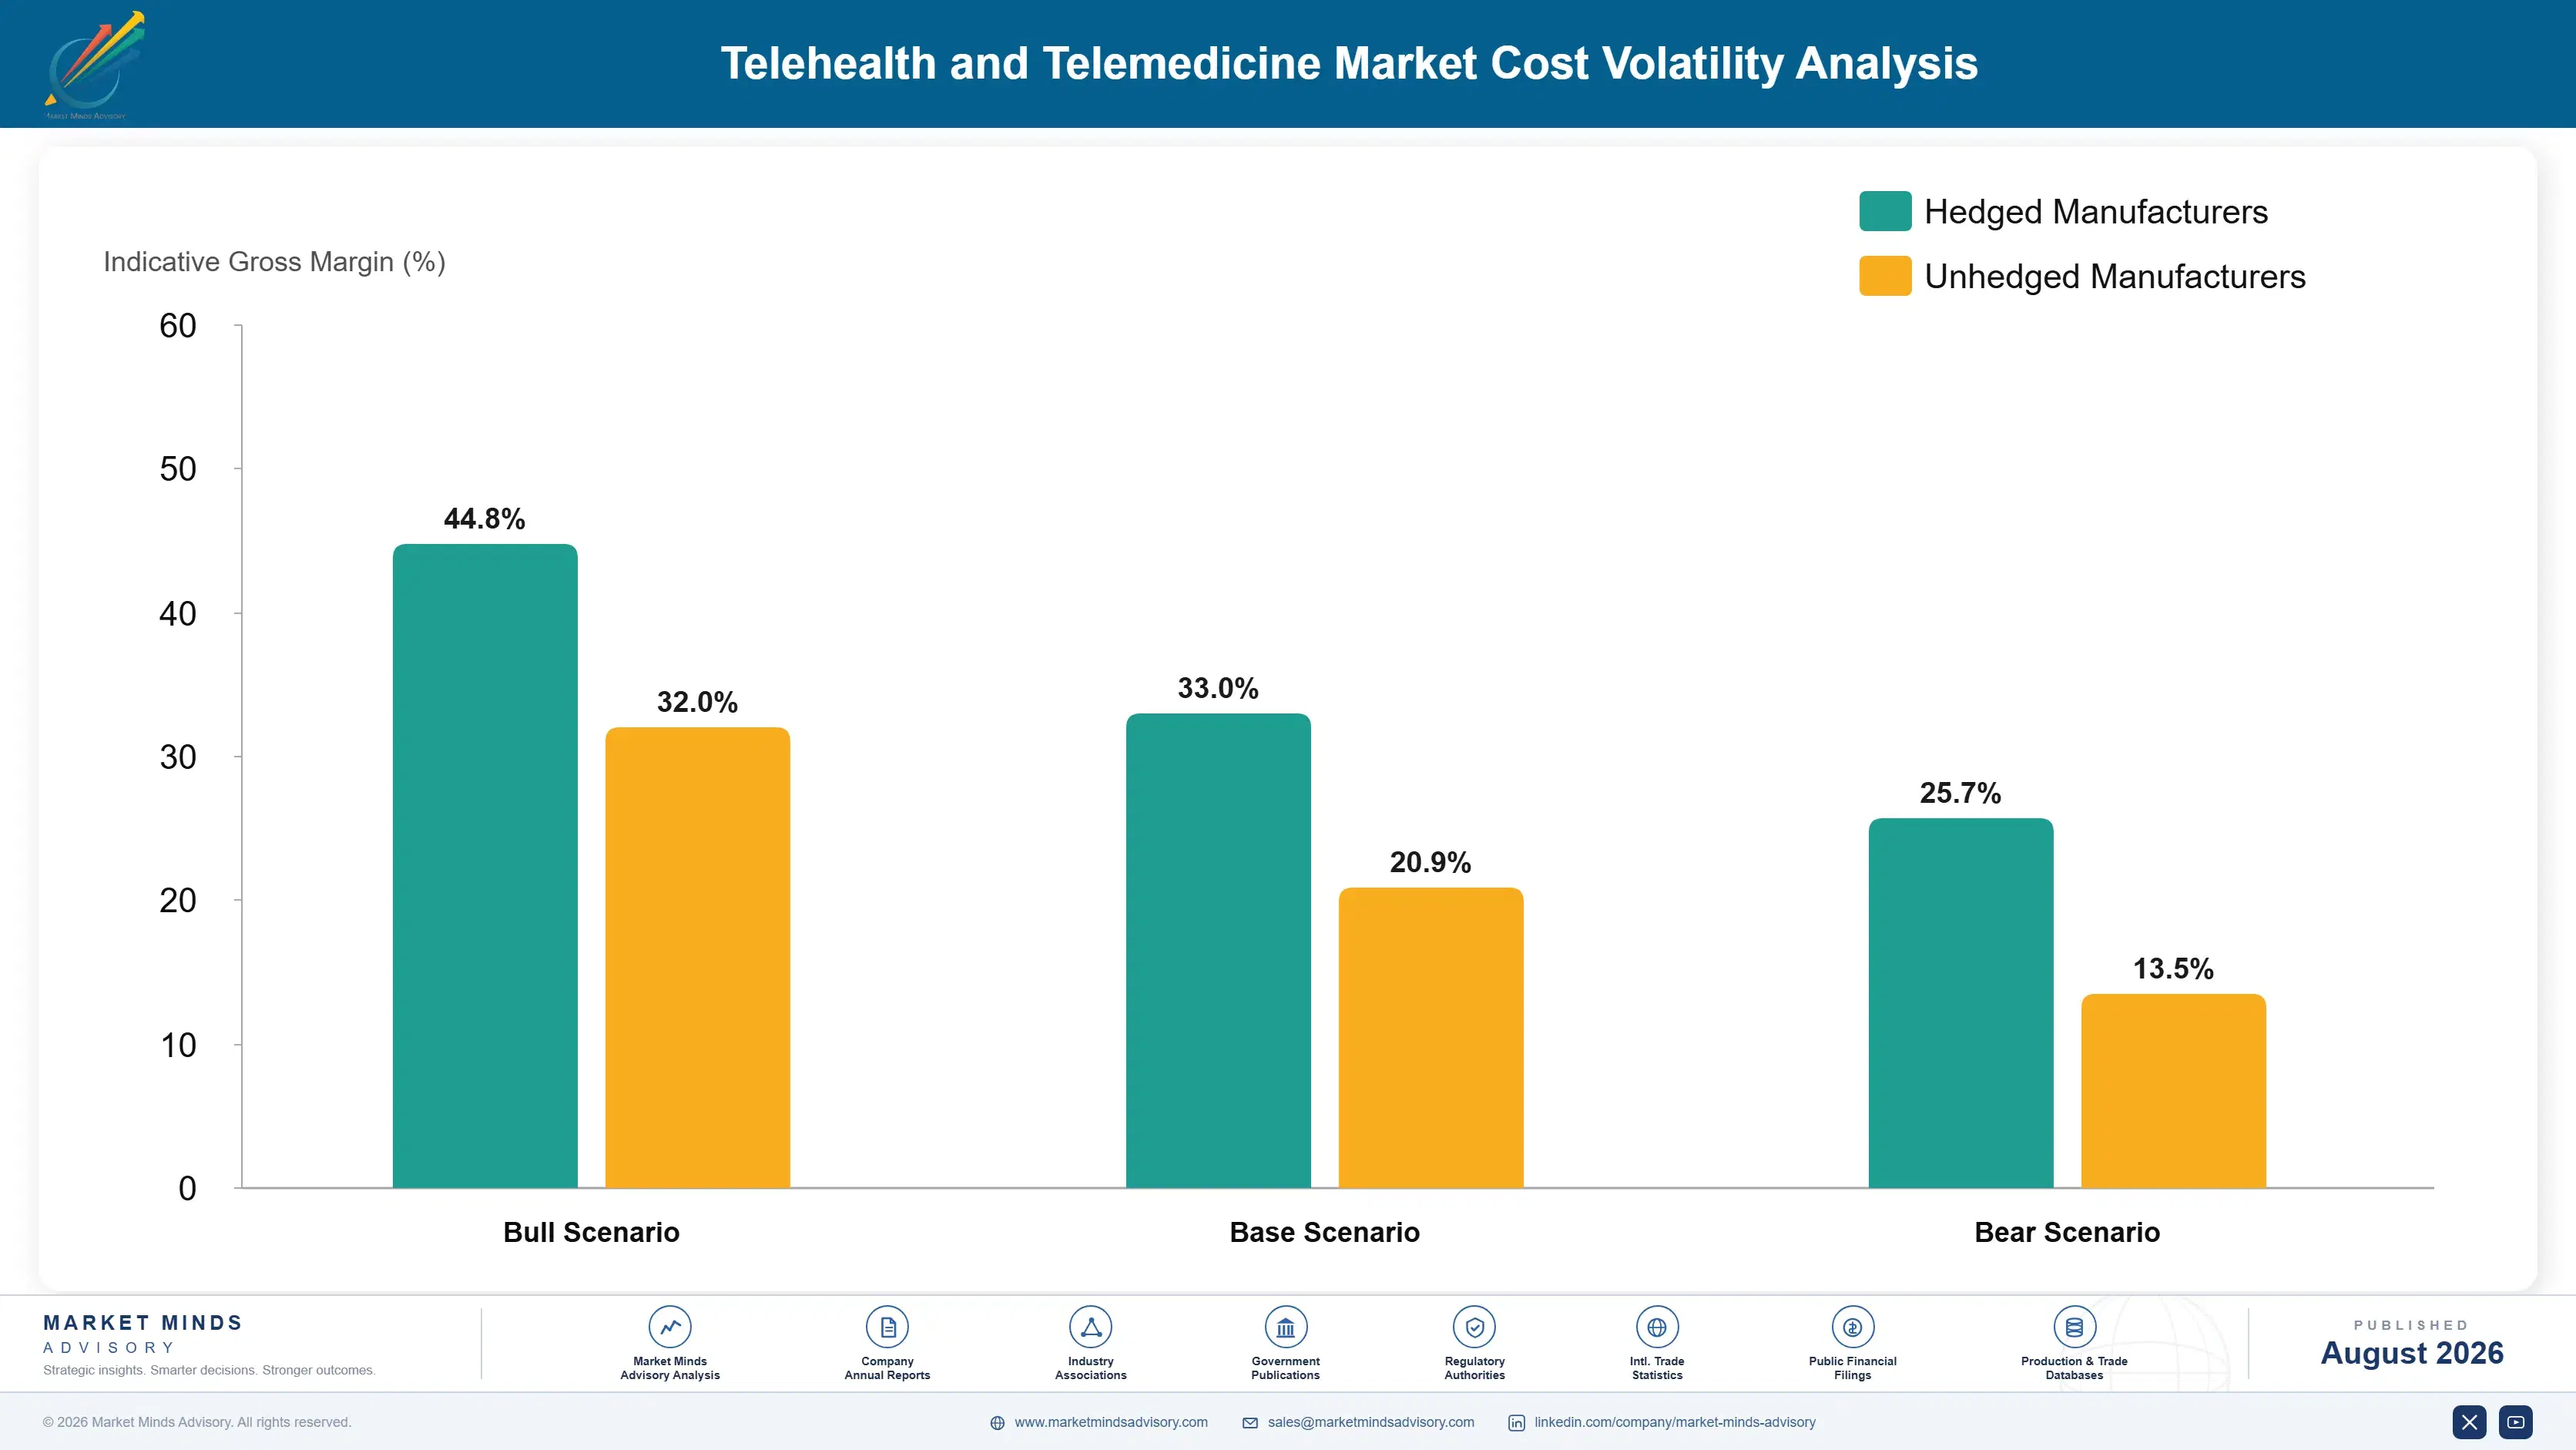
Clinician compensation dominates at roughly 52% of cost of delivery across consultation-led models, which is the single fact that determines whether a virtual care business can ever produce margin. Technology infrastructure and cloud hosting add about 11%, patient acquisition around 14% where the model is direct to consumer, monitoring device hardware near 9% in remote monitoring programmes and clinical operations carry the remainder.
Behavioural health and nursing wage inflation through 2021 and 2023 was the exposure that mattered. United States Bureau of Labor Statistics wage reporting documented sustained increases across both occupations as shortage bit, and virtual care operators competing for the same clinicians paid the same increases. Platforms with contracted per-consultation pricing to employers and payers could not reprice inside contract terms, so the increase landed on gross margin for two to three years.

The competitive disadvantage mechanism runs through model design rather than through purchasing. An operator whose revenue scales with consultations and whose cost scales with clinician minutes has no operating leverage and no defence against wage movement. One built on batched monitoring review, asynchronous queues, or virtual nursing across multiple rooms absorbs the same wage increase across many more billable encounters. Model choice determines exposure here.
telehealth-and-telemedicine-market-cost-volatility-analysis-1787299873684

Reweight the portfolio toward models with operating leverage

A consultation business pays for clinician minutes that serve exactly one patient, so a wage increase transfers straight to gross margin with nothing at all to absorb it. Batched monitoring review and asynchronous queues spread the same clinician hour across many billable encounters. This is a model design decision rather than a procurement one.

Negotiate wage escalation clauses into payer and employer contracts

Multi-year per-consultation pricing agreed before a period of clinical wage inflation left operators absorbing increases they had no ability to pass through anywhere. Escalation clauses tied to published labour cost indices transfer that risk to the party better able to carry it. Buyers resist the clause and rarely resist the underlying logic once the exposure is set out plainly.

Widen licensure reach to raise clinician utilisation

A clinician licensed in one jurisdiction sits idle whenever local demand dips while waiting lists build next door, which raises effective cost per billable minute considerably. Funding multi-jurisdiction licensure at roughly 3,000 dollars per clinician converts that idle time into billable work. It is the cheapest utilisation improvement available and most operators treat it as a compliance task instead.

Portfolio Architecture for Margin Defence

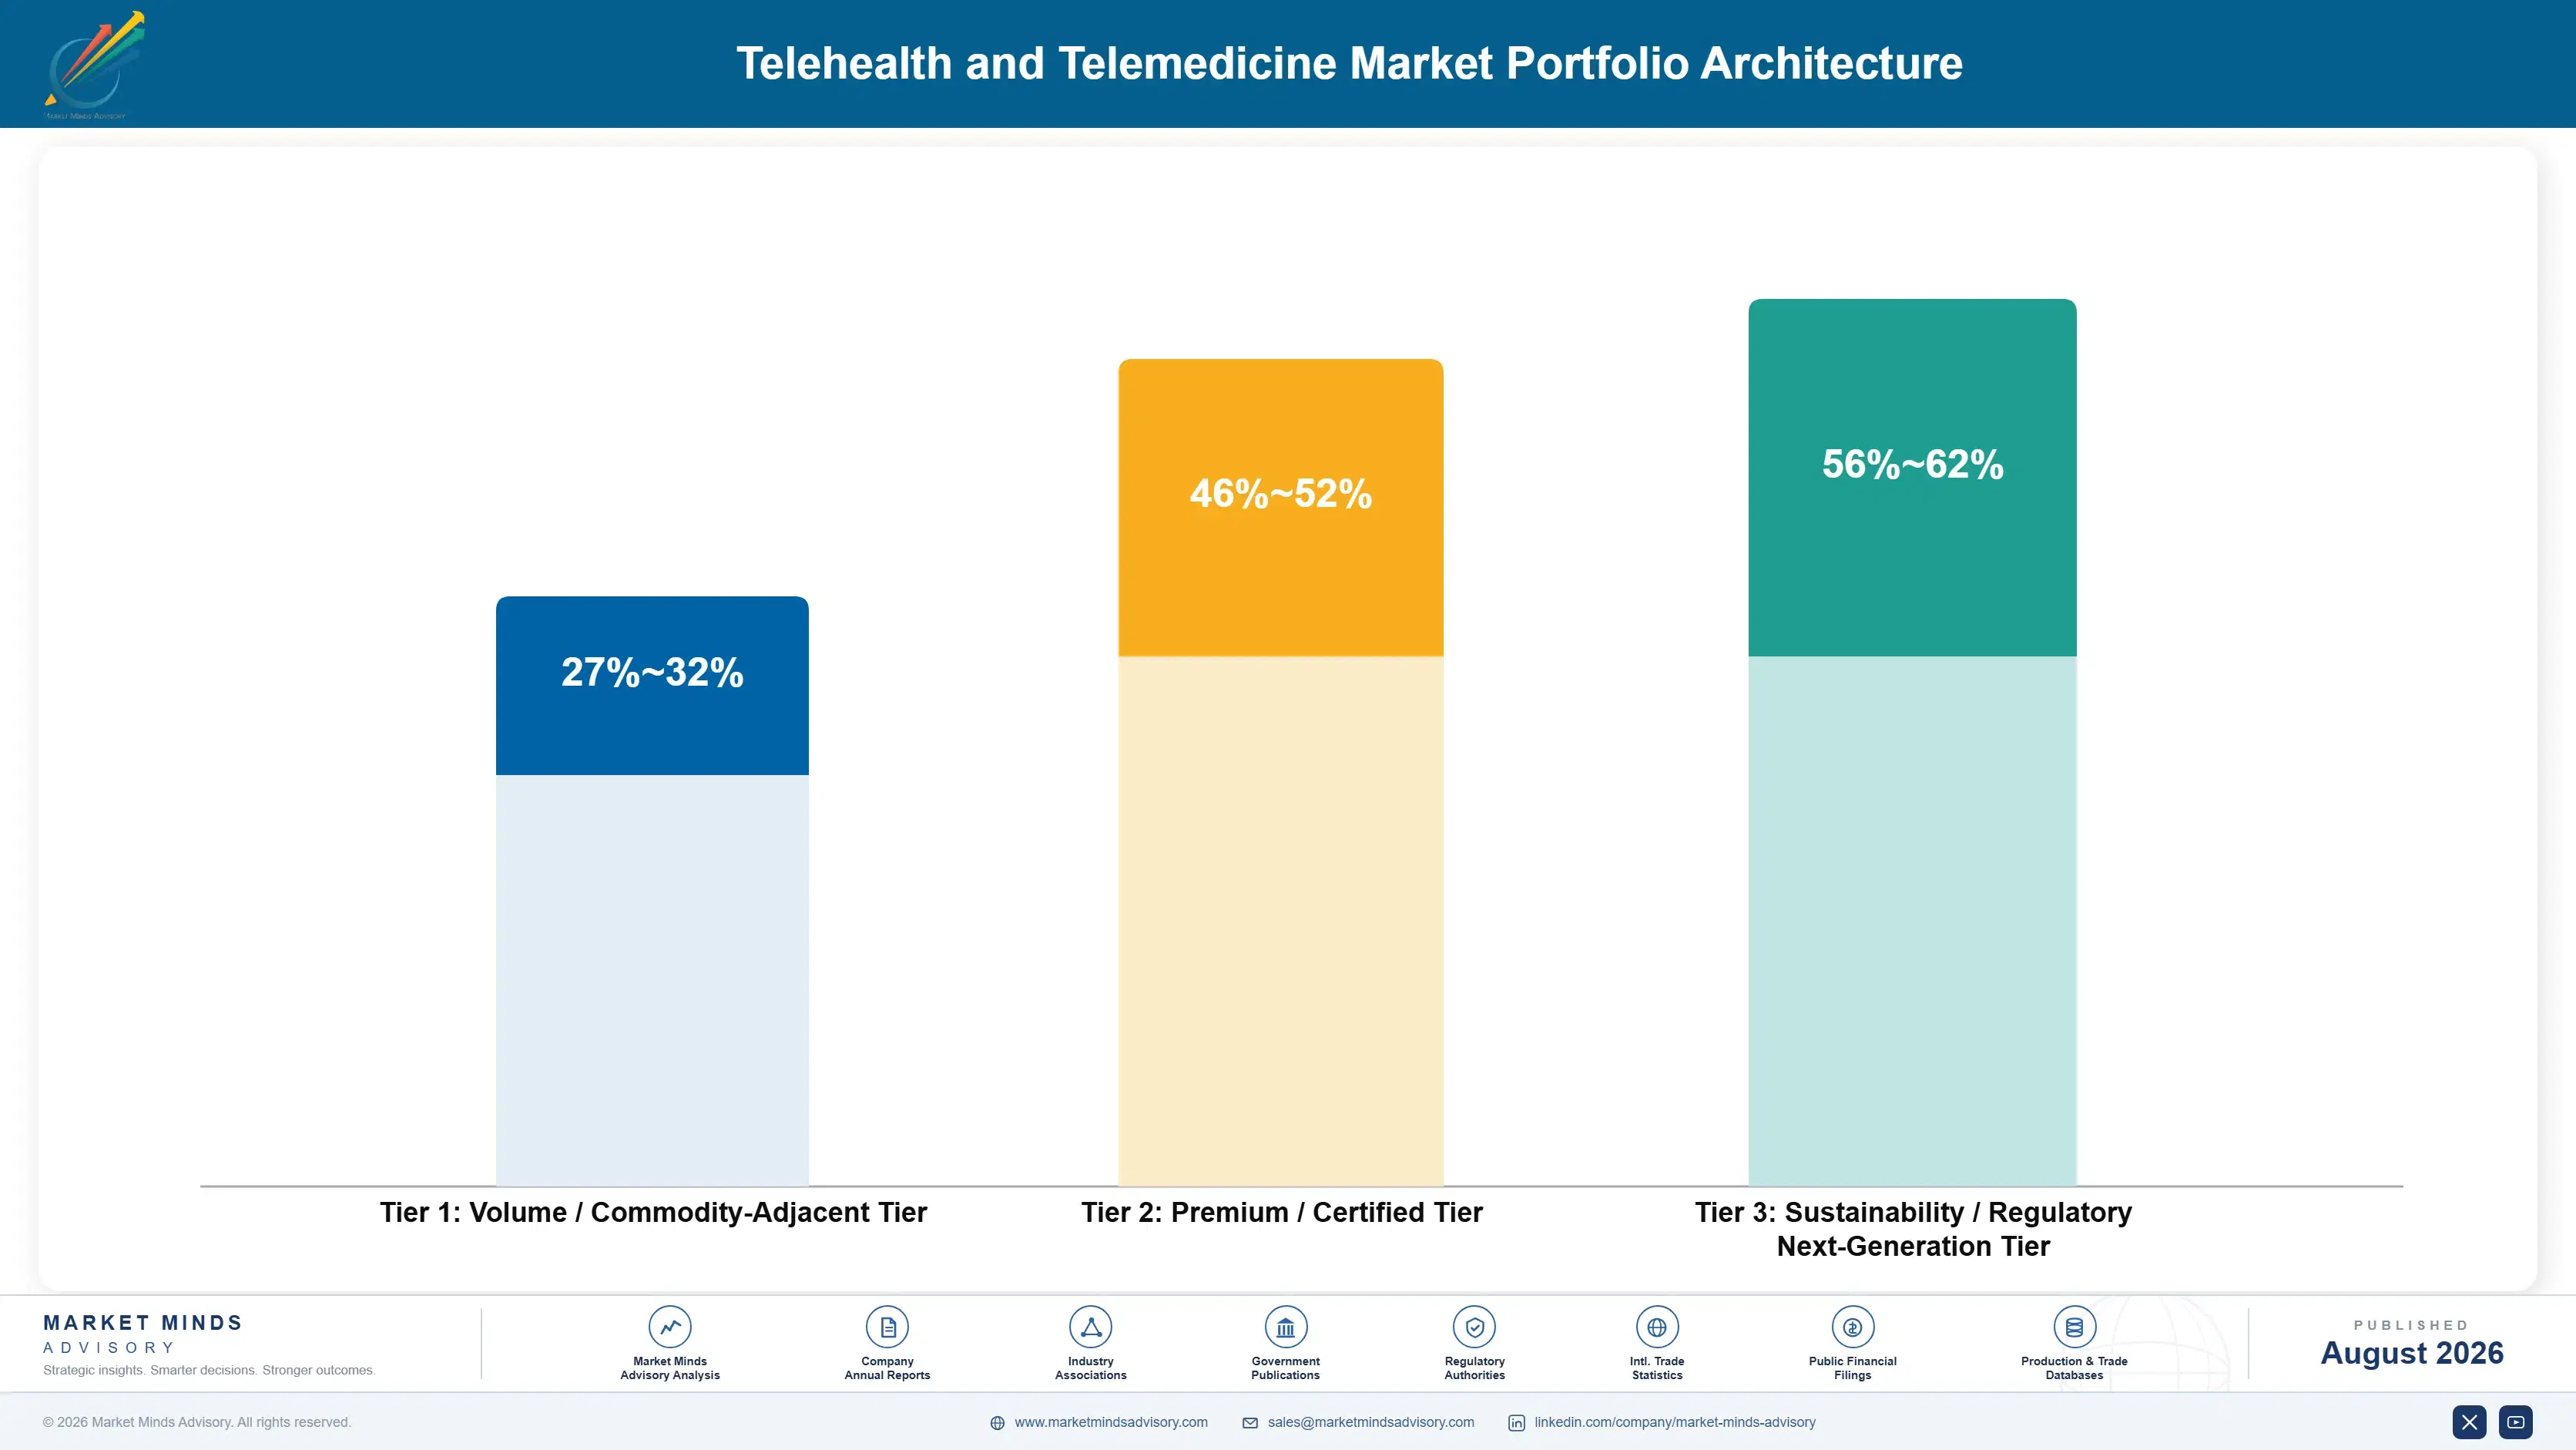
Three tiers describe this business and the spread is set entirely by whether clinician time scales with patient count. Synchronous consultation sits at the bottom, paying a clinician per encounter and producing gross margin that does not improve with volume. Asynchronous and monitoring models sit far higher because one clinician hour covers many patients. Cash direct-to-consumer prescribing occupies a third tier on pricing freedom rather than on efficiency.
The tension is that consultation capability is what payers and employers actually contract for. Enrolled member populations arrive through contracts that specify video access, and those populations are then available for monitoring enrolment and asynchronous care at no further acquisition cost. Operators who abandoned consultation for margin reasons discovered they had also abandoned the distribution that made everything else reachable.

High-value pools concentrate where reimbursement pays for clinician review time separately from the encounter itself. Remote monitoring management codes and hospital virtual nursing contracts both do this, and both therefore reward a model that consultation billing penalises. Anywhere payment is attached to an encounter rather than to a population, the arithmetic works against the supplier no matter how well the service performs clinically.

Volume / Commodity-Adjacent Tier

Synchronous video and telephone consultation delivered under employer and payer contracts at a fixed price per encounter. Margin does not improve with scale because clinician minutes scale with patients, but the contracts supply enrolled populations everything else reaches.
Gross Margin: 27-32%

Premium / Certified Tier

Remote monitoring and asynchronous review models where reimbursement pays separately for device supply and clinician management time. Margin reflects genuine operating leverage, since one clinician hour covers many patients rather than the single patient a consultation serves.
Gross Margin: 46-52%

Sustainability / Regulatory / Next-Generation Tier

Hospital virtual nursing contracts and cash direct-to-consumer prescribing platforms, sold on workforce economics and on pricing freedom respectively. Best margin in the category, and the tier now attracting the most regulatory attention in several major markets simultaneously.
Gross Margin: 56-62%
telehealth-and-telemedicine-market-portfolio-architecture-1787299874182

High-value Sub-segments and Strategic Watch-out

Remote Patient Monitoring

Fastest growth at 17.1%, exactly 1.50 times the market rate, and the only reimbursement model paying separately for clinician review time across many patients. Adherence near 58% at six months rather than enrolment is what decides how much of it is actually collectible. Adherence support is the unglamorous answer.
Gross Margin: 46-52%

Hospital Virtual Nursing Contracts

Strong margin and 15.9% growth, sold to chief nursing officers on documentation hours returned and turnover reduction rather than on patient convenience. Multi-year contracts with a health system are considerably stickier than any consumer or employer relationship in this market. Removing it means retraining whole wards.
Gross Margin: 56-62%

Synchronous Consultation Volume

The volume core with margin that never improves as it grows, since a clinician serves exactly one patient for about 19 minutes each time. It nonetheless carries the employer and payer contracts through which enrolled populations for everything else become reachable at all. Abandoning it removes the distribution above it.
Gross Margin: 27-32%

Direct-To-Consumer Prescribing

The strategic watch-out, carrying the best margin in the category on cash pricing outside insurance and attracting regulatory attention in several markets at once. Identity verification and record continuity requirements would raise the cost of exactly what makes it profitable. Regulatory movement is the live risk here.
Gross Margin: 56-62%

How Virtual Care Revenue Recurs

Revenue recurs through three quite different rhythms and mixing them up is how most forecasts here have gone wrong. Employer and payer contracts renew on multi-year cycles and provide enrolled populations regardless of whether anybody uses the service, which makes utilisation a cost rather than a revenue driver. Remote monitoring bills monthly per patient while transmission continues. Cash prescribing behaves as consumer subscription, with churn measured in months rather than years.
Stickiness varies enormously across those three. Hospital virtual nursing contracts are deepest, since the workflow is built into nursing practice and removing it means retraining wards. Remote monitoring sticks while the patient transmits and ends when they stop, which is roughly 42% of them inside six months. Employer contracts stick through renewal cycles and then move on price. Cash consumer relationships are the least durable and the most expensive to acquire.

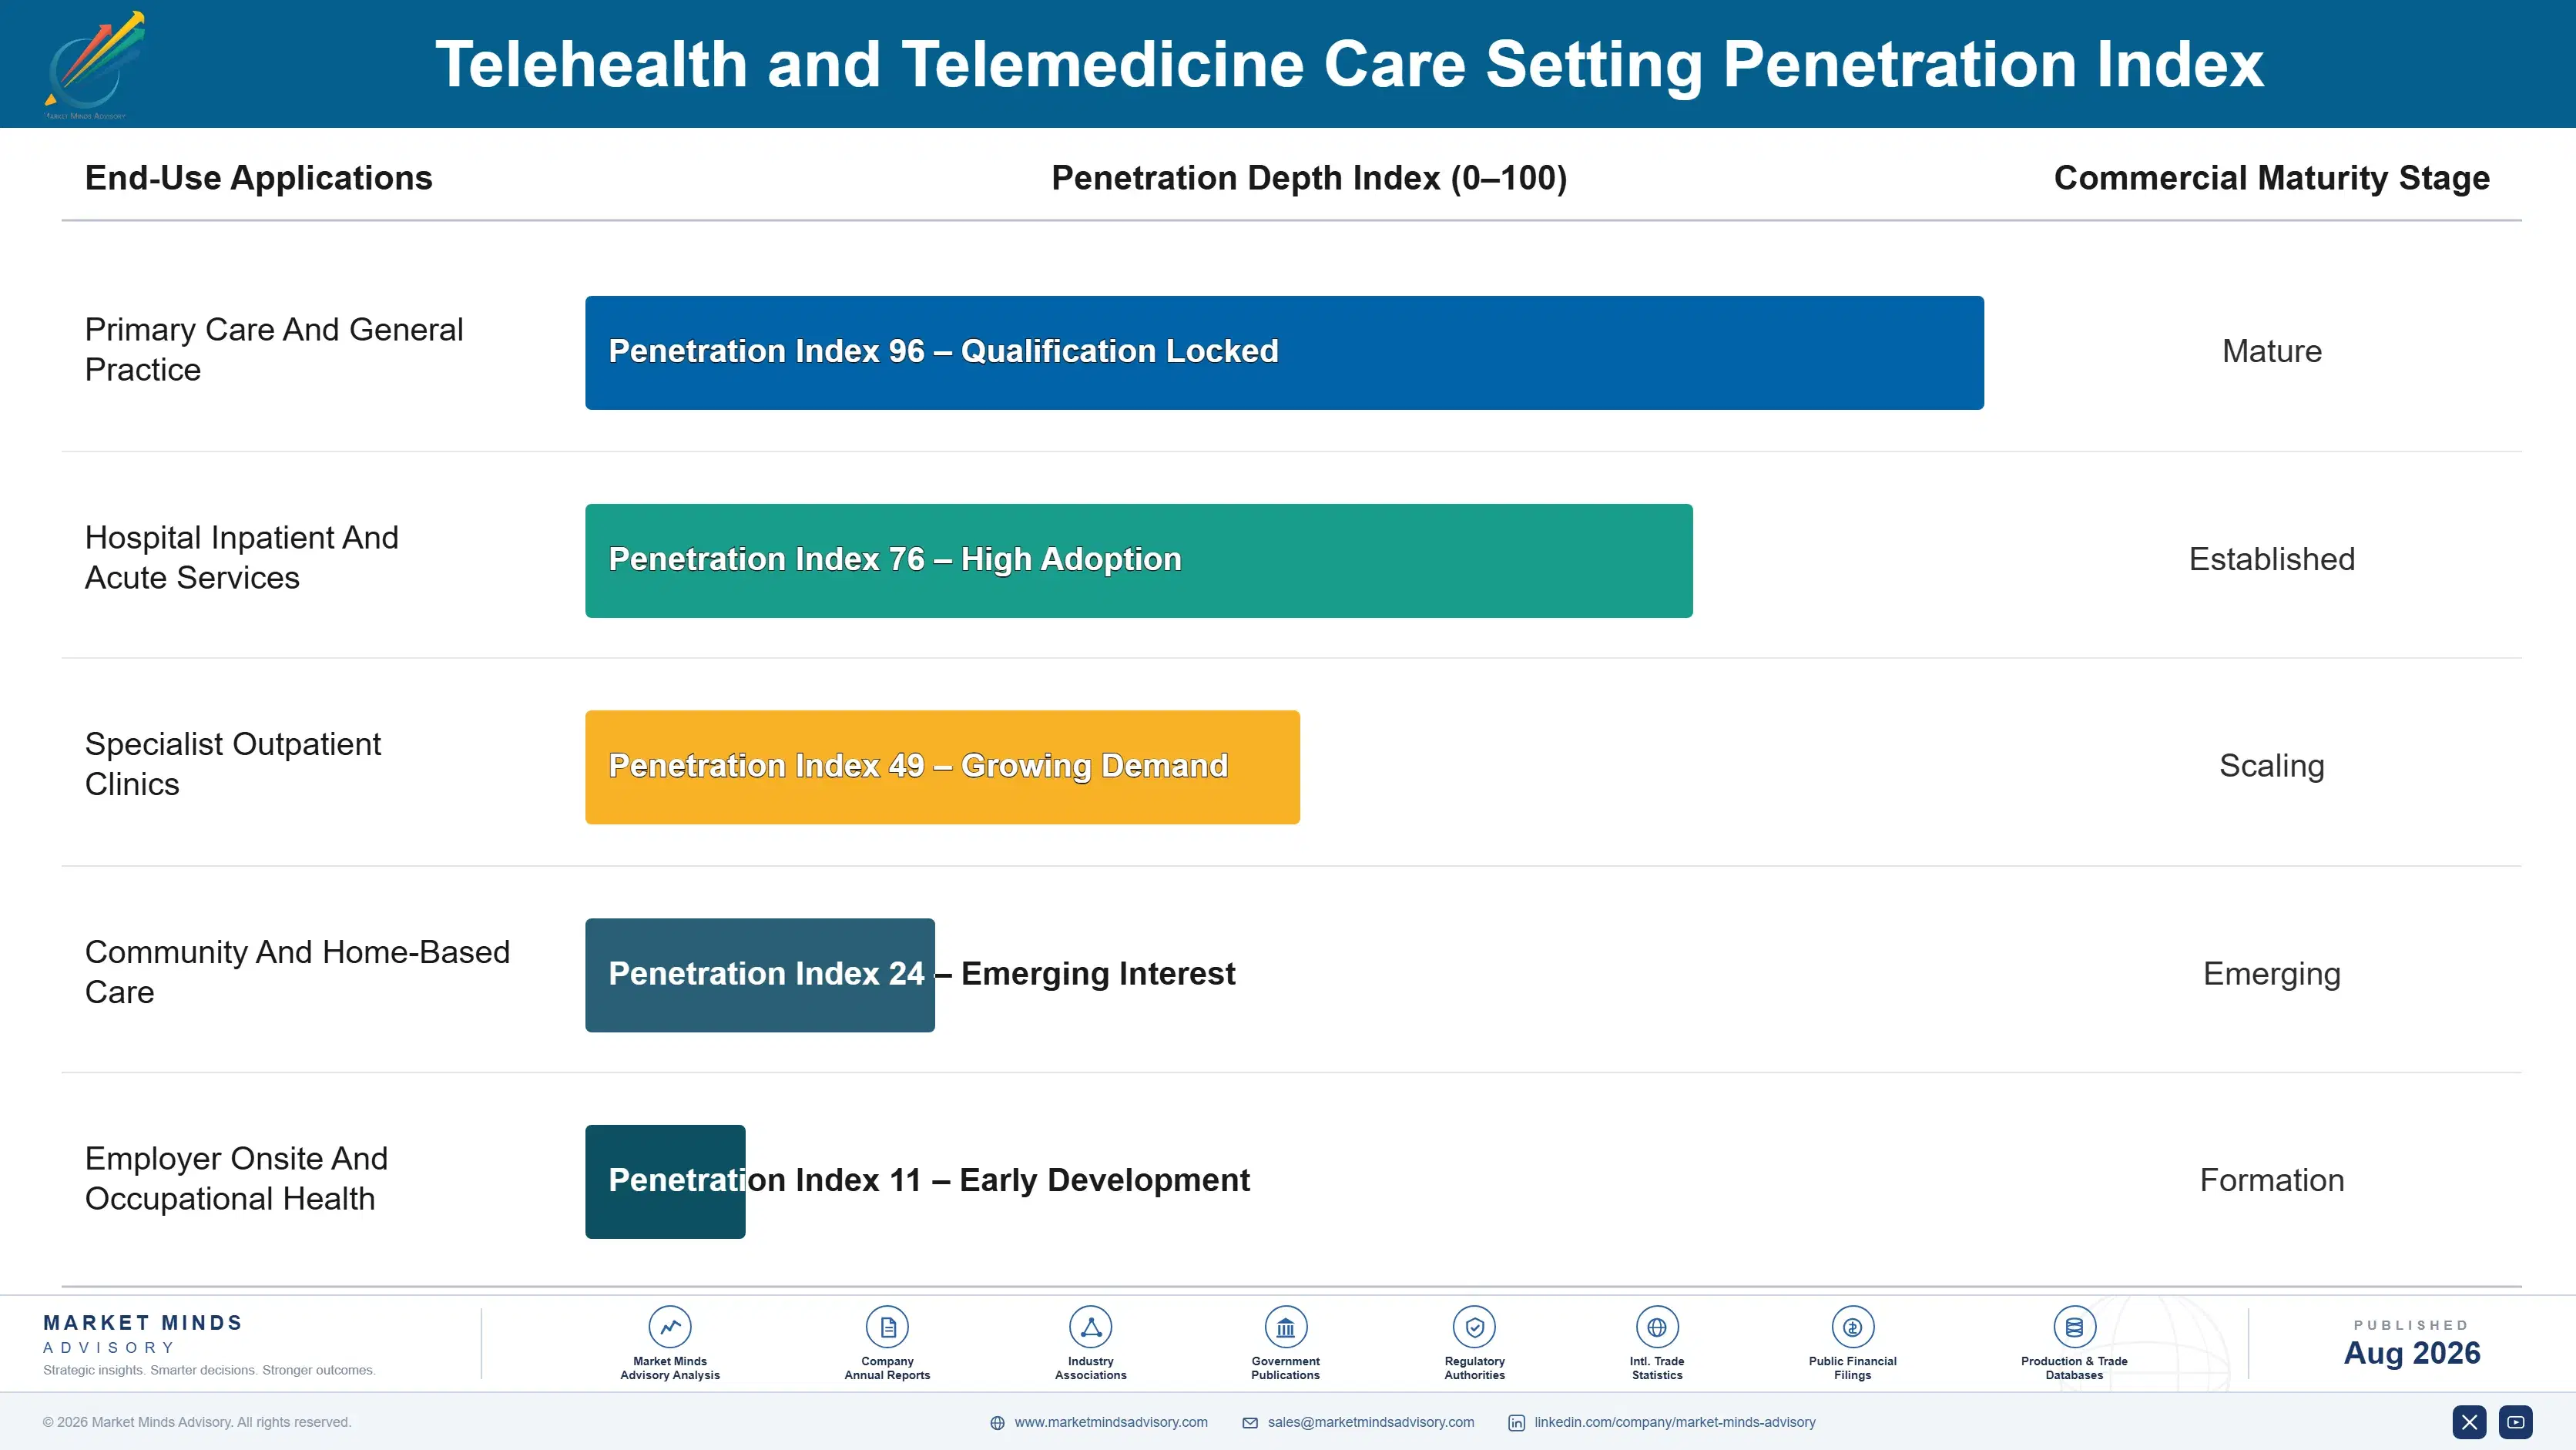
Buyer profiles have moved decisively toward operations. Digital health teams once bought these services on innovation budgets; chief nursing officers and chronic care programme leads now buy them against staffing and admission avoidance. That shift favours operators who can quantify staffing hours returned and admissions avoided.
telehealth-and-telemedicine-market-end-use-penetration-index-1787299874672

What We Would Tell a Board

These are among the four positions where our research anticipates prominent divergence between winners and laggards over the coming forecast period. Each is grounded in the demand model, the regulatory perimeter, and the announced capacity pipeline.
01 / OPERATING LEVERAGE DESIGN

Paying by the minute means margin never improves

A synchronous consultation consumes about 19 clinician minutes and serves exactly one patient, so a business built on it has gross margin that stays flat however many users it adds to the platform. Every durable model in this market broke that ratio somewhere, through batched monitoring review, asynchronous queues, or virtual nursing across several rooms at once. Reweighting a portfolio toward those models typically lifts contribution margin by 12 to 18 points using the identical clinical workforce and no additional hiring at all.
02 / ADHERENCE REVENUE PROTECTION

Enrolment numbers overstate what you can actually bill

Remote monitoring reimbursement generally requires a minimum count of transmitted days each month, and only about 58% of enrolled patients are still transmitting six months after signing up to the programme. Reported enrolment therefore overstates collectible revenue in the fastest growing part of this market by a wide margin. A dedicated adherence team costs roughly 900,000 dollars annually per hundred thousand enrolled patients and returns several times that figure in claims that would otherwise never have been billable against the transmission thresholds.
03 / LICENSURE CAPACITY PROGRAMME

Idle clinicians and waiting lists sit one border apart

Only 34% of clinicians hold licences beyond a single jurisdiction, which caps the supply pooling that made virtual care economically interesting in the first place and leaves capacity stranded next to unmet demand. Funding multi-jurisdiction licensure costs around 3,000 dollars per clinician in fees and administration and converts idle hours directly into billable work elsewhere. Most operators handle licensure case by case as a compliance chore rather than running it as the capacity and utilisation programme it very plainly is.
04 / HOSPITAL BUSINESS CASE FRAMING

Chief nursing officers are managing a shortage, not experience

Virtual care propositions built on patient convenience lose to every competing capital request a hospital board reviews, because convenience is not the problem any hospital executive is currently trying to solve. The same capability framed around documentation hours returned to bedside staff, reduced nurse turnover, and shorter length of stay competes against almost nothing at all. Programmes argued that way have grown at 15.9% while access-framed offers stalled, and the change costs nothing beyond a rewritten business case and a different executive in the room.

Engagement Snapshot From the Field

A live engagement with an industry participant carrying material or product regulatory and market exposure ahead of a defining policy shift, showing how our research translates into a defensible multi-year portfolio strategy.
MARKET MINDS ADVISORY · CLIENT ENGAGEMENT SUMMARY
Telehealth and Telemedicine Producer Strategic Portfolio Review and Transition Roadmap 2026·Investment Scenario on Telehealth and Telemedicine Exposure Evaluation 2025-26
CLIENT PROFILE
A virtual care operator with approximately 420 million dollars in annual revenue (client-reported, unverified by MMA), serving employer and health plan contracts across several countries with a portfolio weighted heavily toward synchronous video consultation. The business had recently launched remote monitoring, held no hospital contracts, and licensed clinicians individually in each jurisdiction as demand arose.
STRATEGIC CHALLENGE
Revenue had grown for four consecutive years while gross margin fell in each of them, and management attributed the decline to clinical wage inflation beyond its control. A proposal to raise per-consultation pricing at renewal was on the table. The board wanted an independent view on whether wages explained the compression before risking contracts on a price increase.
MMA APPROACH
We decomposed margin by delivery model, separating clinician minutes per billable encounter across consultation, monitoring, and asynchronous care. Monitoring enrolment was reconciled against transmitted days and collected claims. Clinician utilisation was measured against licensure footprint by region, and hospital virtual nursing procurement criteria were reviewed against the client's existing propositions.
KEY FINDINGS
  1. Wage inflation explained under half the margin compression; the rest came from mix shifting toward synchronous consultation, where clinician minutes scale one to one with patients served.
  2. Around 44% of monitoring enrolments failed to meet the monthly transmission threshold, so reported enrolment growth had not converted into collectible revenue at anything like the assumed rate.
  3. Clinician utilisation varied from 61% to 94% across regions purely on licensure footprint, with idle capacity sitting adjacent to waiting lists it was not permitted to serve.
  4. Every hospital proposition reviewed was framed on patient experience, while procurement criteria at the same institutions weighted nurse staffing and length of stay far more heavily.
CLIENT PROFILE
A virtual care operator with approximately 420 million dollars in annual revenue (client-reported, unverified by MMA), serving employer and health plan contracts across several countries with a portfolio weighted heavily toward synchronous video consultation. The business had recently launched remote monitoring, held no hospital contracts, and licensed clinicians individually in each jurisdiction as demand arose.
STRATEGIC CHALLENGE
Revenue had grown for four consecutive years while gross margin fell in each of them, and management attributed the decline to clinical wage inflation beyond its control. A proposal to raise per-consultation pricing at renewal was on the table. The board wanted an independent view on whether wages explained the compression before risking contracts on a price increase.
MMA APPROACH
We decomposed margin by delivery model, separating clinician minutes per billable encounter across consultation, monitoring, and asynchronous care. Monitoring enrolment was reconciled against transmitted days and collected claims. Clinician utilisation was measured against licensure footprint by region, and hospital virtual nursing procurement criteria were reviewed against the client's existing propositions.
KEY FINDINGS
  1. Wage inflation explained under half the margin compression; the rest came from mix shifting toward synchronous consultation, where clinician minutes scale one to one with patients served.
  2. Around 44% of monitoring enrolments failed to meet the monthly transmission threshold, so reported enrolment growth had not converted into collectible revenue at anything like the assumed rate.
  3. Clinician utilisation varied from 61% to 94% across regions purely on licensure footprint, with idle capacity sitting adjacent to waiting lists it was not permitted to serve.
  4. Every hospital proposition reviewed was framed on patient experience, while procurement criteria at the same institutions weighted nurse staffing and length of stay far more heavily.
RECOMMENDED STRATEGY
Phase 1: Phase 1 (months one to nine): hold consultation pricing, build an adherence function for monitoring, and reframe hospital propositions on workforce economics. Phase 2: Phase 2 (months nine to twenty-four): fund multi-jurisdiction licensure across the clinical workforce and rebalance capacity toward underserved regions. Idle capacity sits next to waiting lists. Phase 3: Phase 3 (months twenty-four to forty): shift portfolio weighting deliberately toward monitoring and asynchronous models with genuine operating leverage. Consultation remains the distribution channel.
OUTCOME
The price increase was not pursued and contracts renewed intact. Monitoring collections rose sharply once adherence support was funded, clinician utilisation converged upward as licensure widened, and the first hospital virtual nursing contracts were signed on reframed workforce business cases (client-reported, unverified by MMA). Gross margin recovered within the year.

Frequently Asked Questions

Foundational context covering the market sizes, CAGR, scope, country, region and competition that inform every finding below. This section is provided to cover basics and most often pre-purchase conversations, answered from the MMA Primary Research Dataset.

What is the current size of the Telehealth and Telemedicine Market?

The market is valued at USD 92.0 billion in 2025, rising to USD 102.49 billion in 2026. Scope covers virtual care delivery and enabling technology, excluding pharmacy fulfilment revenue.

How large will the Telehealth and Telemedicine Market be by 2036?

MMA forecasts USD 301.66 billion by 2036, an increase of USD 199.17 billion over the 2026 base. That represents an expansion multiple of 2.94 times across the forecast period.

What is the CAGR for the Telehealth and Telemedicine Market 2026 to 2036?

The base case CAGR is 11.4%, with a bull case of 12.6% and a bear case of 10.2%. The historical rate from 2020 to 2025 was 10.2%, which conceals a sharp collapse and rebuild.

Which segment is growing fastest?

Remote patient monitoring at 17.1%, exactly 1.50 times the market rate. It is the only reimbursement model paying separately for clinician review time covering many patients at once.

Who are the major companies in the Telehealth and Telemedicine Market?

Teladoc Health, Ping An Healthcare and Technology, Hims and Hers Health, Amwell, and Included Health lead on annual virtual care revenue. The top five hold only 19% between them.

Which country is growing fastest?

India at 14.2%, driven by public teleconsultation programmes delivering hundreds of millions of encounters alongside private platforms built on pharmacy and diagnostics integration rather than consultation fees.

Report Segmentation Architecture

The full report scope spans multiple orthogonal segmentation dimensions, with cross-tabulated demand data provided for each dimension pair. Coverage extends further to regional breakdowns, trend trajectories, and the competitive detail needed to support segment-level decision-making.

By Care Delivery Model

  • Synchronous Video And Telephone Consultation
  • Asynchronous Store-And-Forward Consultation
  • Remote Patient Monitoring
  • Virtual Nursing And Hospital-At-Home
  • Tele-Behavioural Health Services
  • Direct-To-Consumer Prescribing Platforms

By Care Setting

  • Primary Care And General Practice
  • Hospital Inpatient And Acute Services
  • Specialist Outpatient Clinics
  • Community And Home-Based Care
  • Employer Onsite And Occupational Health

By Payer Channel

  • Employer And Self-Insured Contracts
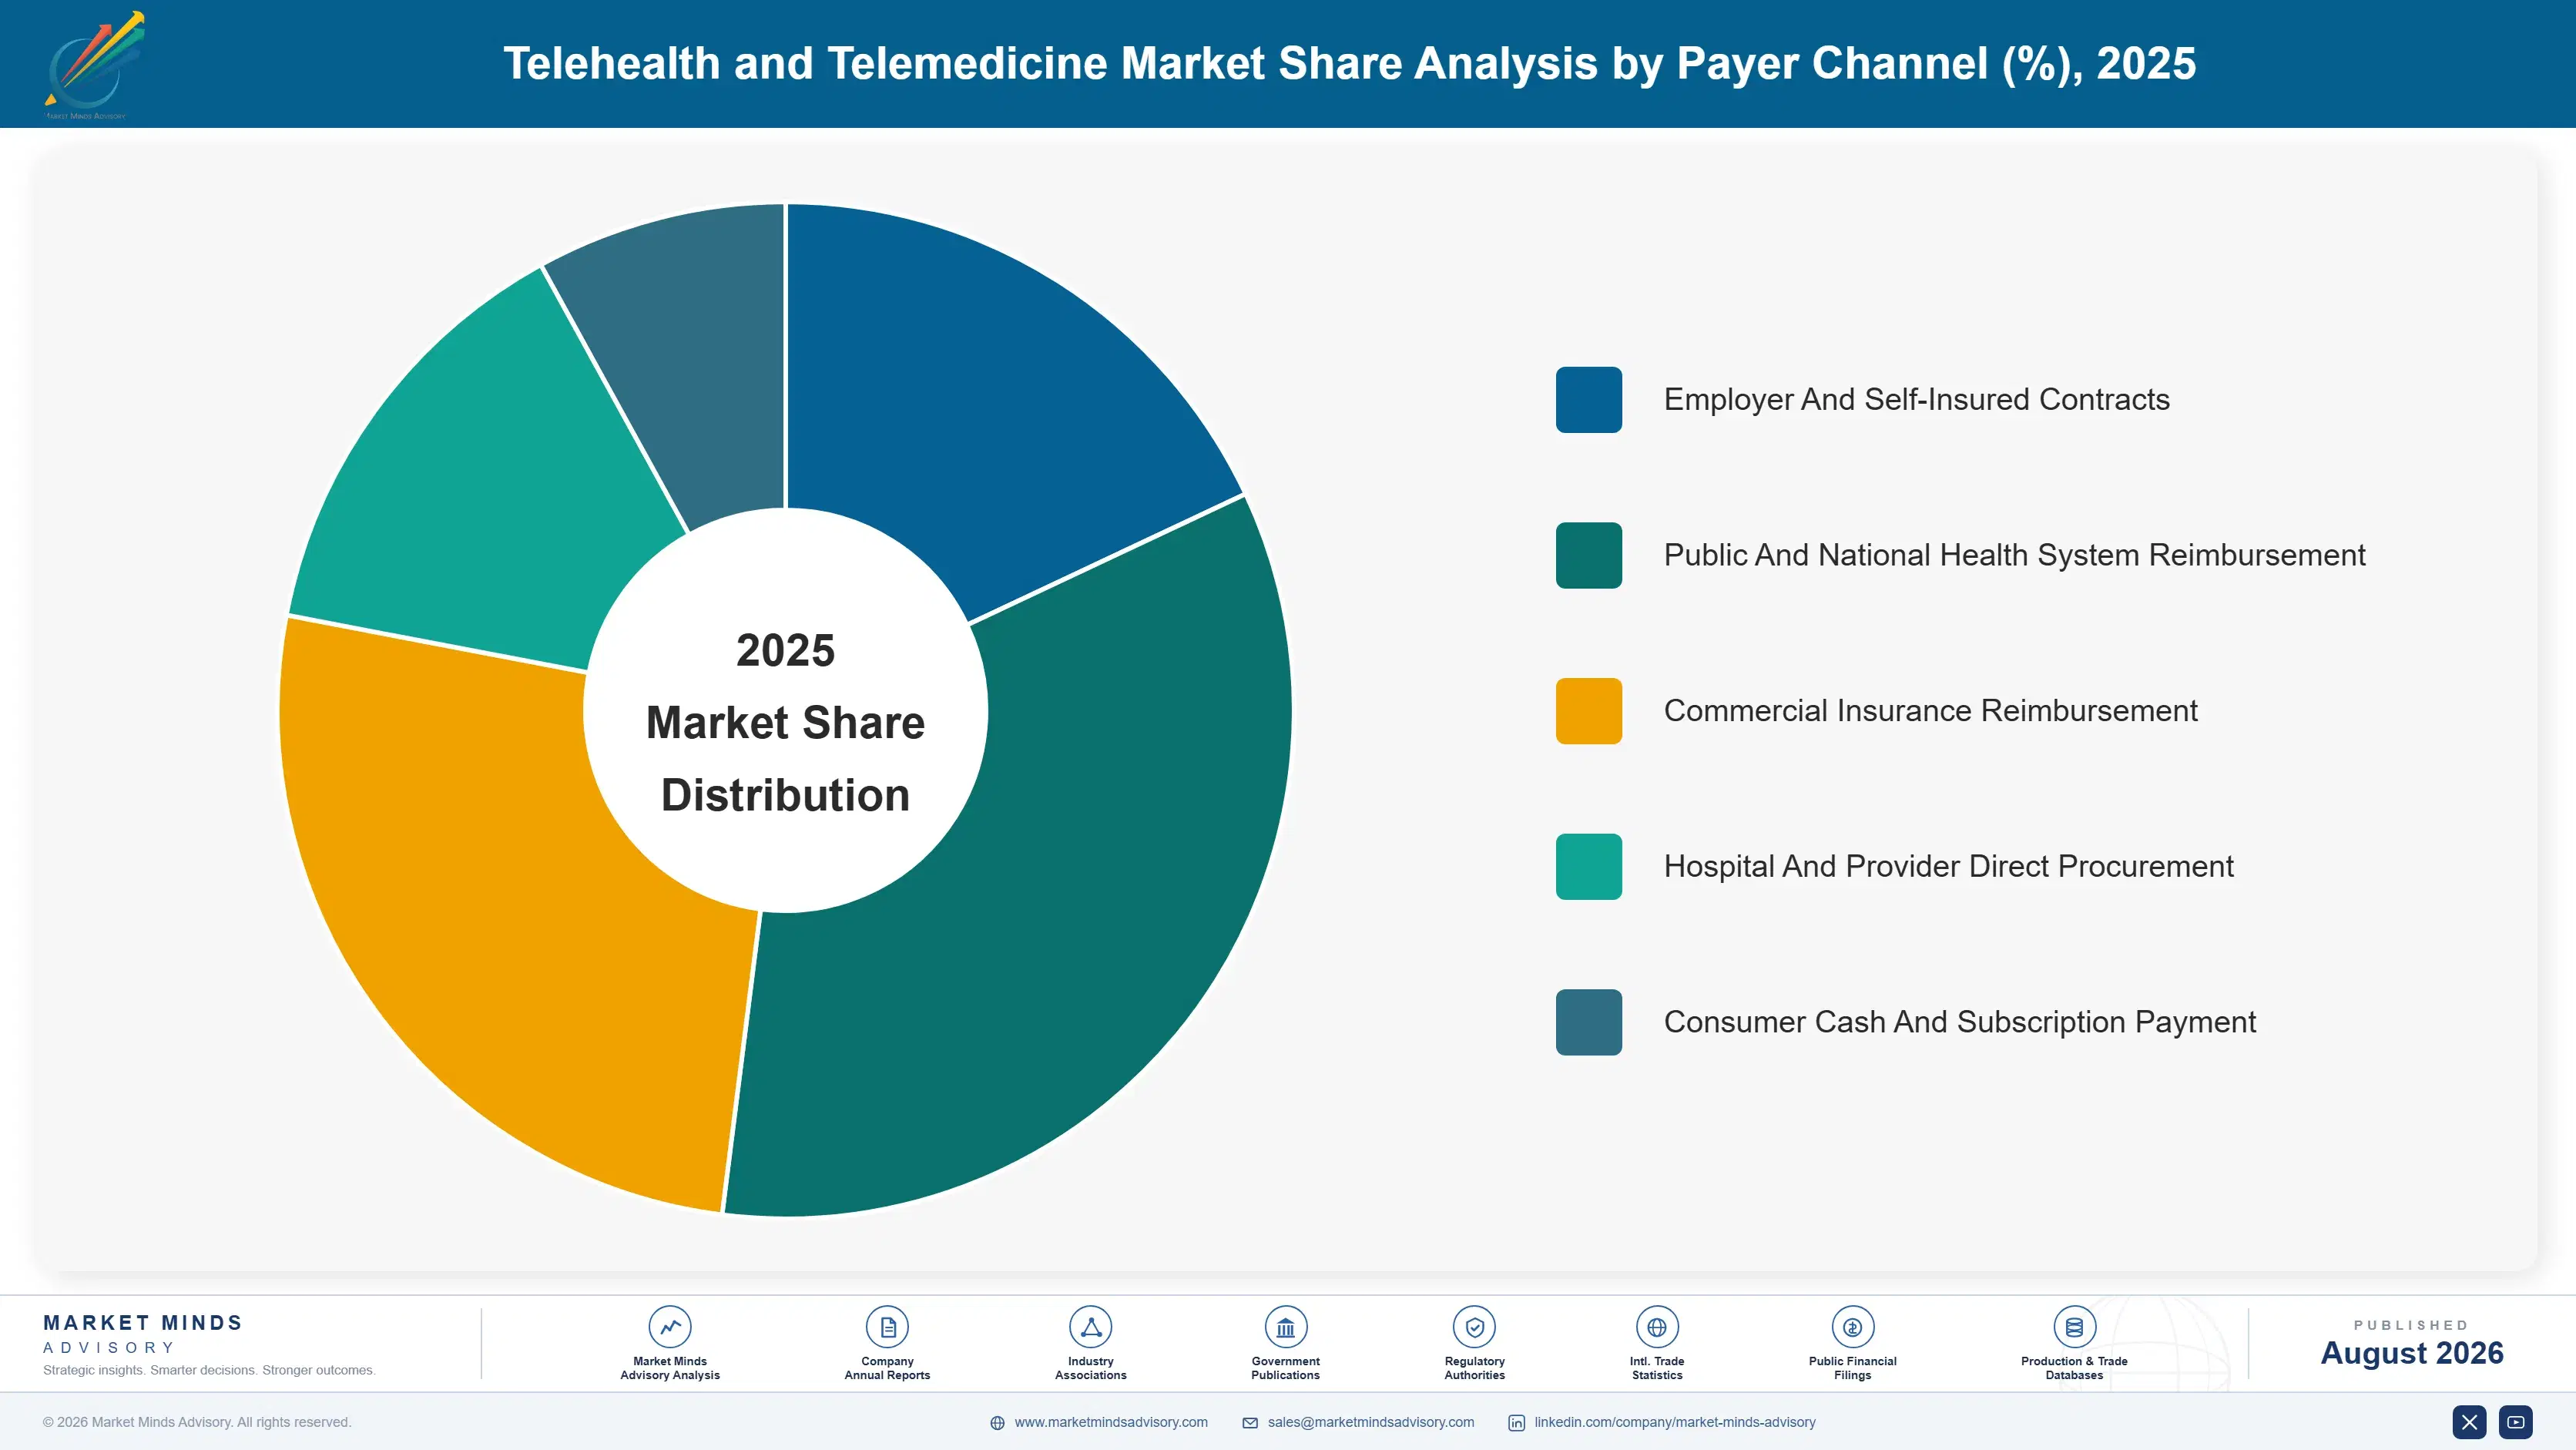
  • Public And National Health System Reimbursement
  • Commercial Insurance Reimbursement
  • Hospital And Provider Direct Procurement
  • Consumer Cash And Subscription Payment

By Region

  • North America
  • East Asia
  • Western Europe
  • South Asia and Pacific
  • Latin America
  • Middle East and Africa
  • Eastern Europe

Scope, Methodology, and Coverage

Every figure in this report is reproducible from documented input assumptions. The scope below maps the historical period, the forecast horizon, the segmentation dimensions, and the countries covered, alongside the underlying primary and qualitative methodology.
Historical Period
2020 to 2025
Forecast Period
2026 to 2036
Base Year
2025 (USD billions; MMA Primary Research Dataset, August 2026)
Market Definition
This market comprises virtual care delivery and the technology platforms enabling it, measured at realised revenue to service providers and platform vendors across all payer channels. Model coverage spans synchronous video and telephone consultation, asynchronous store-and-forward consultation including e-consults and teledermatology, remote patient monitoring including connected device supply and management time, virtual nursing and hospital-at-home programmes, tele-behavioural health services, and direct-to-consumer prescribing platforms. Electronic health record and practice management systems, in-person care delivered following virtual triage, medical devices sold outside a monitoring service, pharmacy dispensing and fulfilment revenue, diagnostics, and general video conferencing software fall outside scope.
Quantitative Units
USD billions (current prices); encounters per year; revenue per encounter; enrolled monitoring patients
Segmentation Dimensions
By Care Delivery Model; By Care Setting; By Payer Channel; By Region
Regions Covered
North America, East Asia, Western Europe, South Asia and Pacific, Latin America, Middle East and Africa, Eastern Europe
Countries Covered
USA, Canada, China, Japan, South Korea, Taiwan, India, Indonesia, Philippines, Vietnam, Australia, Germany, France, UK, Netherlands, Sweden, Denmark, Spain, Italy, Belgium, Poland, Czechia, Romania, Brazil, Mexico, Colombia, Chile, Saudi Arabia, UAE, Israel, South Africa, Kenya, Nigeria, and additional markets relevant to this sector
Key Companies Profiled
Teladoc Health, Ping An Healthcare and Technology, Hims & Hers Health, Amwell, Included Health, JD Health, Alibaba Health, Doctolib, Kry, Practo, Halodoc, Philips, Medtronic, Masimo, iRhythm Technologies, Dexcom, Omada Health, Talkspace, LifeMD, Medically Home
Quantitative Methodology
Primary survey, n=3,800 respondents, Q4 2025, six countries; demand-side model with trade association cross-validation
Qualitative Methodology
47 expert interviews, Q4 2025; applied to validate demand model assumptions, identify emerging dynamics, and assess competitive positioning
Report Format
PDF and XLSX data workbook (Word format preview document)
Publisher
Market Minds Advisory
Report Code
MMA-2026-TEC-448
Published
August 2026
Contact
sales@marketmindsadvisory.com | www.marketmindsadvisory.com

Purchase the full Telehealth and Telemedicine Market Report (2026 to 2036).

The full report sizes telehealth and telemedicine across six care delivery models, five care settings, five payer channels, and seven regions, with country detail for the thirty largest markets. Clinician minutes per billable encounter are modelled by delivery model, since that ratio rather than user count determines whether any operating leverage exists in a given business. Remote monitoring adherence is quantified against enrolment to separate reported growth from collectible revenue. Competitive profiling covers twenty companies on annual virtual care and monitoring revenue. Licensure footprint is mapped against clinician utilisation by region.
Clinician minutes per billable encounter modelled by delivery model
Monitoring adherence quantified separately from reported enrolment growth
Licensure footprint mapped against regional clinician utilisation rates
Pandemic volume retention measured by clinical specialty and country
Reimbursement code coverage compared across major national systems
Hospital procurement criteria assessed against vendor proposition framing

Built For The People Who Decide

From boardroom strategy to bench-side execution, this report is read cover-to-cover by leaders shaping the next decade of their industry, turning demand scenarios, market dynamics and valuation benchmarks into decisions.
CXOs/ Presidents/ VPs/ Managers
M&A and Corporate Development
Strategy Teams and R&D Heads
Procurement and Product Directors
Regulatory and Compliance Leaders
Investor Relations and Equity Analysts