

Market Minds Advisory
Telecom Network Infrastructure Market

Telecom Network Infrastructure Market: Telecom Network Infrastructure Market: Capital Cycles, Vendor Restrictions and Traffic Economics 2026 to 2036

Data traffic keeps compounding at around 25% a year while operator service revenue barely moves at all. Every equipment purchase in this industry is now argued against that single uncomfortable ratio.

Lead Analyst

Published

September 2026

Make Smarter Decisions with Customized Research Insights

Request a free sample report and evaluate market opportunities, growth trends, and competitive dynamics relevant to your business needs.

2025 MARKET VALUE$118.0BMarket Size 2025
2036 FORECAST VALUE$201.8BBase Case , 2026 to 2036
CAGR 2026 TO 20365.0 %Bull 6.2% / Bear 3.8%
INCREMENTAL OPPORTUNITY$77.9BNet 10- year value creation
EXPANSION MULTIPLE1.63x2036 value over 2026 base
Strategic Levers
M&A Pipeline
Regional Outlook
Country Rankings
Competitive Intelligence
Segmental Deep-dive
Call-Us : 91 93563 13602

Executive Snapshot and Market Trajectory.

Network traffic compounds at roughly 25% a year and operator revenue does not, which is the ratio every equipment purchase in this industry has to answer to. Vendors selling capacity are selling into that gap. It has not closed in fifteen years and nobody credible expects it to.
The market reaches USD 123.9 billion in 2026 and USD 201.8 billion by 2036, a 1.63 times expansion at 5.0% annually. Open and disaggregated radio access equipment grows at 7.5%, half again the market rate of 5.0%, because operators want purchasing power against a supplier base of three. East Asia holds 29% of global capital spending, and India compounds fastest of any market at 7.9% on network buildout that is still under way.
Five vendors hold 71% of network equipment revenue, which is one of the most concentrated positions in any capital goods industry anywhere. Huawei, Ericsson, Nokia, ZTE and Samsung Networks lead the field, though security restrictions across several markets mean the practical choice in any given country is frequently narrower than five. That single constraint shapes equipment pricing more than competition between the five ever does.
Market Definition
This report covers telecom network infrastructure equipment by network domain: radio access network equipment, open and disaggregated radio access equipment, core network and packet processing systems, optical transport and transmission equipment, fixed access and broadband aggregation equipment, and microwave and satellite backhaul systems. It excludes handsets and customer premises equipment, network management and orchestration software sold separately, tower and passive site infrastructure, data centre networking, and telecom operator services revenue.
Base Year Value
$118.0B in 2025 (MMA Primary Research Dataset, September 2026)
Forecast Period
2026 to 2036, eleven discrete annual values
CAGR
5.0% base case. Bull 6.2%. Bear 3.8%.
Fastest Growth Segment
Open And Disaggregated Radio Access Equipment: 7.5% CAGR
Fastest Growth Country
India: 7.9% CAGR
Fastest Growth Region
South Asia and Pacific: 7.2% CAGR
Largest Region
East Asia: 29% of 2025 global value
Market Leaders
Huawei, Ericsson, Nokia, ZTE and Samsung Networks lead on telecom network equipment revenue. Source: MMA Analysis.
Primary Survey
n=3,800 procurement and R&D decision-makers, Q4 2025, six countries
Methodology
Demand-side build-up, cross-validated against public data, 47 expert interviews

Telecom Network Infrastructure Market Forecast Scenarios

telecom-network-infrastructure-market-size-forecast-scenario-1789993948309
Between 2020 and 2025 the category compounded at 4.0%, and the period was dominated by a fifth-generation buildout that arrived earlier and more expensively than most operators had planned for. Spectrum auctions absorbed capital before any equipment was bought, spending peaked around 2022, then fell as coverage obligations were met. Vendor restrictions on security grounds removed suppliers from several markets and forced replacement programmes adding spending without capacity.
The base case holds 5.0% on three mechanisms. Traffic growth near 25% annually forces capacity investment regardless of whether operator revenue supports it, which is a demand floor rather than a growth engine. Fibre transport and optical capacity keep expanding to carry that traffic between sites. And network densification continues in dense urban markets where coverage is adequate but capacity per user is not, particularly across India and Southeast Asia.
The bull case at 6.2% assumes the next generation standard arrives on schedule with genuine capability differences rather than incremental improvement, restarting a replacement cycle. The bear case at 3.8% is operator consolidation: fewer networks in a market means fewer of everything, and regulators across Europe have become considerably more willing to permit mergers than they were a decade ago.

Traffic Grows, Revenue Does Not

One ratio governs this entire industry. Traffic compounds at roughly 25% a year while operator service revenue has been broadly flat for over a decade, which means every additional bit carried has to cost less than the last one. Equipment vendors are consequently selling capacity per pound rather than capacity, and an operator who cannot show that ratio improving will not get the capital approved internally.
TOP FIVE CONCENTRATION71%Among the most concentrated positions in any capital goods industry
ANNUAL TRAFFIC GROWTH25%Compounding annually while operator service revenue stays broadly flat
CAPITAL INTENSITY17%Operator capital spending as a share of service revenue
EQUIPMENT SERVICE LIFE8 yearsTypical before radio access hardware requires wholesale replacement
RESTRICTED MARKET COUNT22 countriesWhere security rules narrow the practical supplier choice considerably
ENERGY SHARE OF OPEX23%Network electricity consumption sitting within operator running costs
The second thing shaping the market is that supplier choice is a political question as much as a commercial one. Security restrictions across roughly 22 countries have removed particular vendors from consideration entirely, and replacement programmes in those markets consumed capital without adding a single unit of capacity. Where the practical choice narrows from five suppliers to two, pricing behaves accordingly and operators know it.
Open and disaggregated radio access is the industry's attempt to change that, by separating radio hardware from the software controlling it so the two can be bought from different suppliers. It grows at 7.5% against 5.0% for the market. Progress has been slower than its advocates promised, because integrating equipment from several suppliers turns out to be work somebody has to do and pay for.
"Operators talk about open radio access as a technology decision. It isn't. It's a procurement decision dressed as one, and every operator pursuing it can tell you exactly what they're paying now and exactly who they'd rather be negotiating against."
Director, Telecommunications Infrastructure and Network Equipment Practice · MMA Technology Practice · September 2026

Market Trends

Disaggregation Pursued For Procurement Rather Than Performance

Open radio access separates radio hardware from the software controlling it, so an operator can buy the two from different suppliers rather than accepting an integrated system from a single one. The technical arguments are real enough, though the commercial motive is a good deal plainer: five vendors hold 71% of the market and restrictions narrow that further in many countries. Open and disaggregated equipment grows at 7.5% against 5.0% for the market. Adoption has run behind advocacy, because somebody now has to pay to integrate what the vendor previously integrated.
Market Impact: Traffic compounds near 25% annually

Energy Cost Now Shapes Equipment Selection Directly

Network electricity consumption accounts for roughly 23% of operator running costs, and radio access equipment is where the great majority of it actually goes. Power efficiency per unit of capacity has consequently moved from a specification footnote to a genuine selection criterion, particularly across markets carrying either high or genuinely volatile electricity pricing. Vendors now compete on watts per gigabit in a way they simply did not a decade ago, and operators model energy cost across the full 8 year equipment life rather than only at the initial point of purchase.
Market Impact: India compounds at 7.9% yearly

Market Opportunities and Growth Drivers

Traffic Growth Forces Capacity Investment Regardless Of Revenue

Data traffic compounds at roughly 25% annually across most networks while operator service revenue has been broadly flat for more than a decade, which creates a demand floor rather than any kind of growth engine. Operators cannot simply decline to carry that traffic without degrading service and losing subscribers to competing networks that will carry it instead. Operator capital intensity sits near 17% of service revenue and has proved remarkably stable over time, because the investment is not discretionary in any meaningful sense whatever the operator's finance director might privately prefer.
Market Impact: Each merger removes 1 network

Buildout Continues Where Coverage Remains Genuinely Incomplete

India compounds at 7.9%, faster than any other market measured here, on network buildout still adding coverage and capacity rather than replacing what already exists. Broadly similar conditions hold across much of Southeast Asia and sub-Saharan Africa, where subscriber growth and coverage extension are continuing simultaneously. That is a different purchase from a Western replacement cycle: the operator is buying capability it does not yet have rather than newer versions of what it already runs. Volume and cost per site matter considerably more than feature depth in those particular tenders.
Market Impact: Capital intensity holds near 17%

Market Restraints and Challenges

Operator Consolidation Removes Networks From The Market

Each merger between operators in a market eventually removes a network, and a removed network stops buying equipment entirely rather than simply buying rather less of it. The root cause is that operators in mature markets cannot grow revenue and consolidation is now the only route to margin left available to them. Commercially this is comfortably the single largest downside risk to equipment demand anywhere. Mitigation is limited: vendors can win share within a consolidating market, and the combined operator still needs capacity, though it needs considerably fewer core sites.
Market Impact: Five vendors control 71% today

Capital Intensity Cannot Rise Against Flat Revenue

Operator capital spending sits near 17% of service revenue and has proved stubbornly stable, because investors will simply not fund a higher ratio against revenue that is not growing at all. The root cause is that telecom service pricing fell for two decades under competition while traffic obligations rose continuously throughout. Commercially this caps the entire equipment market at roughly the rate at which operator revenue itself grows. Mitigation runs through capacity per pound rather than volume, which is why vendors now compete on efficiency metrics rather than on absolute throughput.
Market Impact: Energy takes 23% of opex
3 additional market trends, 4 additional growth drivers, and 2 additional restraints and challenges are covered in the full report. Contact sales@marketmindsadvisory.com to access the complete intelligence.

Segment CAGR and Growth Architecture

Segmentation follows network domain, since each carries different replacement economics, different competitive intensity and different exposure to traffic growth. Six domains cover the market, running from radio access and its disaggregated variant through core, optical transport, fixed access and backhaul. Deployment geography and operator type are separate commercial dimensions handled elsewhere in this report.
telecom-network-infrastructure-market-market-share-analysis-1789993948848

Open And Disaggregated Radio Access Equipment

Open and disaggregated radio access grows at 7.5%, half again the market rate of 5.0%, and the reason is commercial rather than technical. Separating radio hardware from controlling software lets an operator buy the two from different suppliers, which matters when five vendors hold 71% of the market and security restrictions narrow the practical choice further in roughly 22 countries. Adoption has consistently run behind the advocacy, because integrating equipment from several suppliers is work that the incumbent vendor previously absorbed and somebody now has to fund. Operators holding strong internal engineering capability have progressed considerably further with it than those without any, which is why adoption looks so uneven between comparable networks.
CAGR 7.5%

Optical Transport And Transmission Equipment

Optical transport compounds at 6.1% because traffic growing at roughly 25% a year has to move between sites, and fibre capacity is the only economic way to carry it at that scale. Every radio site added or upgraded generates transport demand behind it, so this segment grows on radio access investment as well as on its own underlying traffic drivers. Competitive intensity here is somewhat lower than in radio access, since a considerably smaller group of suppliers holds genuine coherent optical capability at commercial scale. Energy efficiency per bit carried has become a genuine selection criterion here, given that network electricity now sits near 23% of total operator running costs across the industry.
CAGR 6.1%
Full segment breakdown across 6 segments available in the complete report.

Regional Architecture and Country Demand Map

East Asia holds 29% of network equipment spending, ahead of every other region, on the sheer scale of Chinese network deployment alongside continuing Japanese and South Korean investment. North America follows at 24% on high capital intensity across a small number of very large operators.

East Asia

East Asia takes 29% of network equipment spending, the largest regional share, driven overwhelmingly by the scale of Chinese network deployment rather than by any single technology position. Chinese operators run networks serving subscriber bases larger than most continents, and Huawei and ZTE both supply them from domestic manufacturing. Japanese and South Korean operators invest heavily in capacity per user rather than coverage, since coverage was completed years ago. Growth at 6.0% sits comfortably above the global rate here. Japanese operators have pursued open radio access more seriously than most, partly for supplier diversity reasons that have nothing to do with the technology itself. Regional equipment manufacturing capability is also considerable.
Share: 29% | CAGR: 6.0% (2026 to 2036)

North America

Twenty-four percent of equipment spending reaches North America, where a small number of very large operators invest at high capital intensity across enormous geographies. Security restrictions removed particular vendors entirely, which narrowed the practical supplier choice and forced replacement programmes consuming capital without adding capacity. Ericsson, Nokia and Samsung Networks compete for what remains of the market, and the narrowed field shapes pricing across every negotiation. Rural coverage obligations funded partly through federal programmes add demand that commercial economics alone would never have justified anywhere. Growth at 4.6% sits below the global rate in a market that is already comprehensively built out. Capital intensity remains high relative to most other regions.
Share: 24% | CAGR: 4.6% (2026 to 2036)
Regional intelligence for 5 additional markets available in the complete report: Western Europe, South Asia and Pacific, Latin America, Middle East and Africa, Eastern Europe. Contact sales@marketmindsadvisory.com.
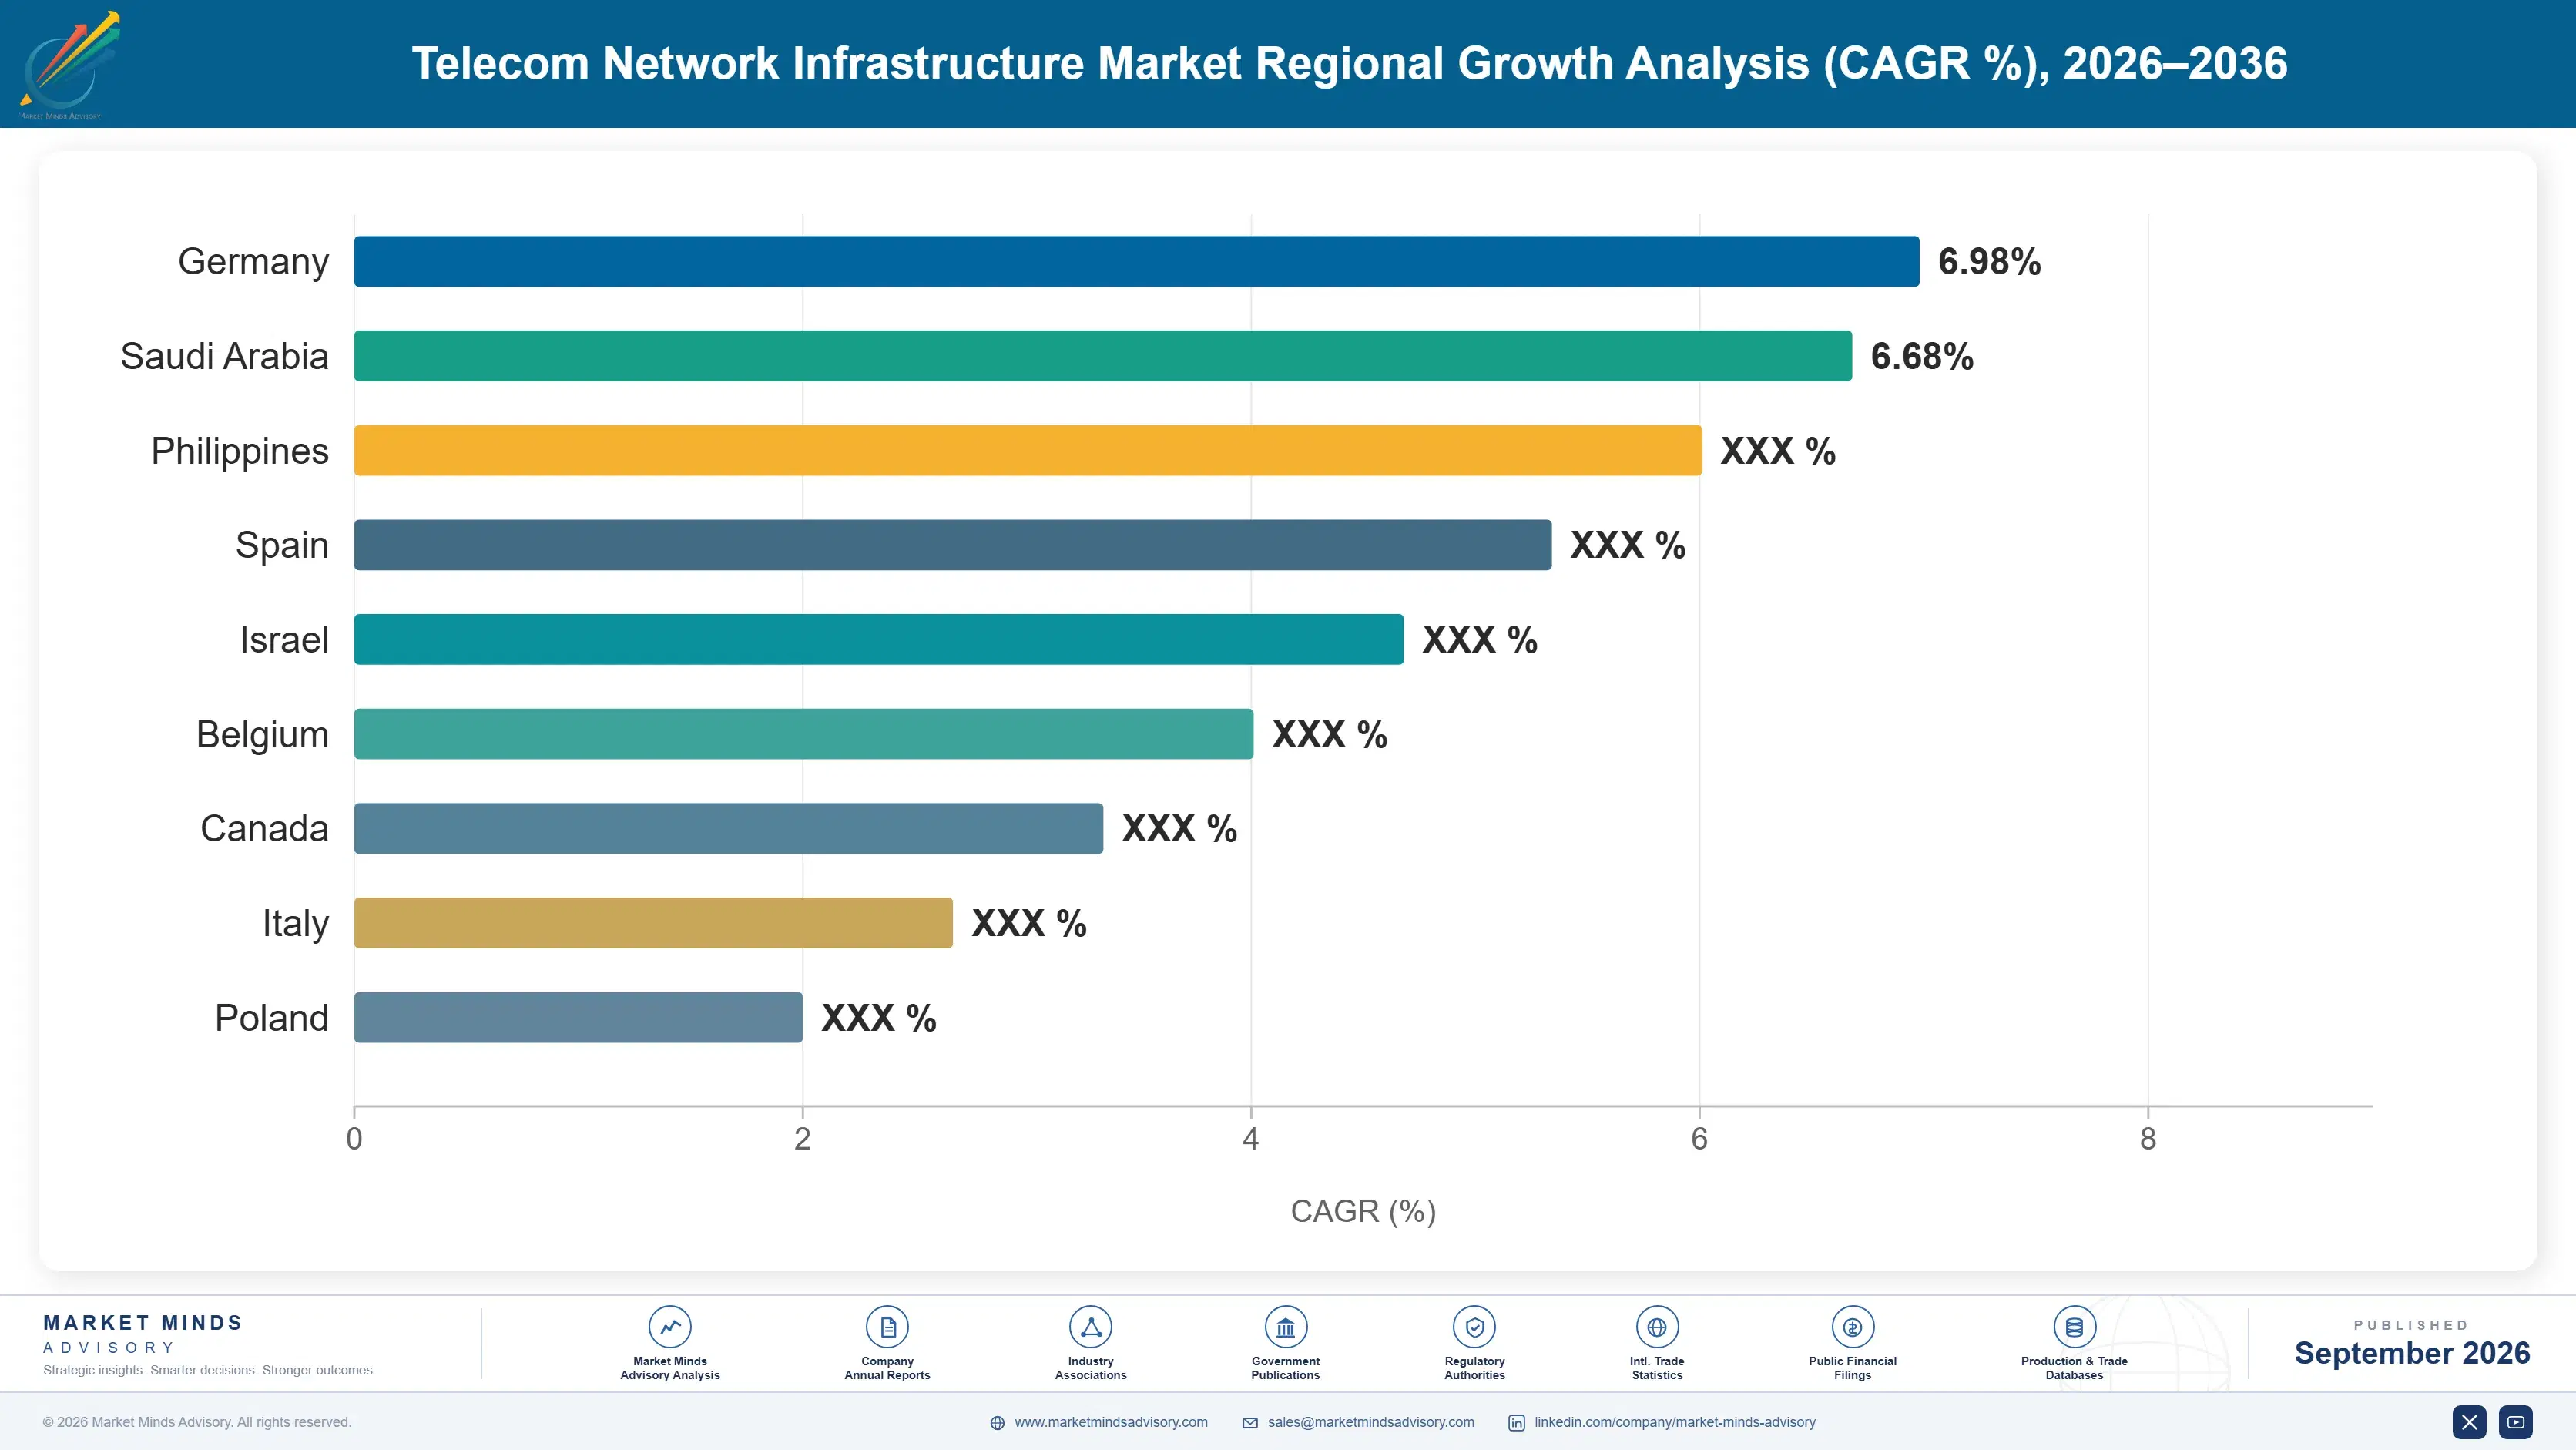
telecom-network-infrastructure-market-country-cagr-analysis-1789993949371

Where Network Equipment Deals Turn

Capital intensity will not rise against flat operator revenue, five vendors already hold 71% of a market where politics narrows the practical choice further still, and the fastest growing markets are busy building new coverage rather than replacing anything at all. The four levers below follow those conditions rather than any argument about technical capability.

Compete On Capacity Per Pound Spent

Traffic compounds near 25% annually while capital intensity holds near 17% of flat service revenue, which means every additional bit carried has to cost less than the last one. That arithmetic decides purchases more reliably than any feature comparison does. Vendors presenting absolute throughput are answering a question the operator's finance function did not ask. Vendors presenting cost per carried gigabit across the full 8 year equipment life are answering the only question that gets capital approved, which is an entirely different conversation from the one most vendors arrive prepared for.
Market Impact: Data traffic compounds near 25% every single year

Position Against A Narrowed Supplier Field

Security restrictions across roughly 22 countries have removed particular vendors from consideration entirely, and in those markets the practical choice narrows from five suppliers to two or three. That is a commercial position that no product advantage ever created, and it will not persist indefinitely as policy itself changes. Vendors treating a restricted market as a permanent entitlement price accordingly and lose the account when conditions shift. Building genuine capability and cost advantage while the field is narrow is the only thing that converts a policy position into a durable commercial one.
Market Impact: Restrictions now apply across fully 22 separate countries

Follow Coverage Buildout Rather Than Replacement Cycles

India compounds at 7.9% and Southeast Asian and African operators are extending coverage into geography that has never had it, which is a fundamentally different purchase from a Western replacement cycle. The operator is buying capability it does not have rather than newer versions of what it runs, so cost per site and deployment speed matter a great deal more than any feature depth does. Vendors organised around mature-market replacement selling frequently misread those tenders entirely and lose them on a price they could easily have matched had they understood the tender.
Market Impact: India alone compounds at fully 7.9% every year

Sell Power Efficiency As Operating Economics

Network electricity accounts for roughly 23% of operator running costs and radio access equipment consumes most of it, which over an 8 year service life frequently exceeds the purchase price difference between competing systems. Operators in markets carrying volatile electricity pricing now model this cost explicitly during evaluation. Vendors quoting watts per gigabit alongside capital cost are competing on total cost rather than on price. Those quoting hardware price alone are competing on the smaller of the two numbers and frequently losing to a system that costs more to buy.
Market Impact: Energy carries fully 23% of total operating cost

Who Controls the Margin Pool

Five vendors hold 71% of telecom network equipment revenue, one of the most concentrated positions in any capital goods industry. Huawei, Ericsson, Nokia, ZTE and Samsung Networks lead, though security restrictions across roughly 22 countries mean the practical choice in any given market is frequently narrower than five suppliers. All participants here are assessed on network equipment revenue rather than on total corporate revenue.
Competition runs on cost per carried gigabit and on power efficiency far more than on peak capability, because operators buy against flat revenue and a capital intensity ratio investors watch closely. The second dimension is which markets a vendor can actually sell into, which is determined by security policy rather than by anything commercial. That constraint has reshaped positions more thoroughly than any product cycle in the past decade.

Pressure is emerging from open and disaggregated equipment suppliers who compete for parts of a network rather than the whole of it, which is a route into accounts that integrated tenders closed. Rankings shift where coverage is still being built rather than where it is being replaced, particularly across India, Southeast Asia and Africa.
telecom-network-infrastructure-market-company-positioning-matrix-1789993949893

Competitive Moat and Risk Dimensions

ERICSSON

Moat: Unrestricted Global Market Access

Ericsson can sell into effectively every market including the roughly 22 countries where security restrictions removed other suppliers, a commercial position no product feature created. That access matters enormously in a concentrated industry where the practical supplier field frequently narrows to two or three. Combined with radio access capability at scale, it produces a position competitors cannot engineer toward.
ERICSSON

Risk: Policy Dependent Positioning

An advantage created by security policy can be reduced by security policy, and restrictions applied unevenly across European member states have already shifted more than once. Pricing that assumes a narrowed field becomes uncompetitive quickly if the field widens again. The durable position has to rest on capability and cost rather than on which competitors are currently excluded.
NOKIA

Moat: Optical And Radio Combination

Nokia holds genuine capability in both radio access and coherent optical transport, which matters because every radio site added generates transport demand behind it and operators increasingly buy the two together. Coherent optical capability at scale sits with a small group of suppliers, and combining it with radio access reaches tenders that specialists in either domain alone cannot address completely.
NOKIA

Risk: Mature Market Revenue Weighting

Revenue weights toward Western Europe and North America, where growth runs at 3.4% and 4.6% and operator consolidation removes networks permanently from the market. The faster growth is in coverage buildout across India, Southeast Asia and Africa, where cost per site dominates selection. Competing there requires a cost structure built for those tenders rather than for mature market ones.

Players Tracked

Prominent Players

Huawei
Ericsson
Nokia
ZTE
Samsung Networks

Other Key Players

Ciena
Juniper Networks
Cisco Systems
Fujitsu
NEC
Mavenir
Corning
CommScope
Adtran
Infinera
Rakuten Symphony
Casa Systems
Airspan Networks
Amphenol Antenna Solutions
Radisys

Recent Developments

MAY 2025

Indian Operators Extend Network Buildout Across Rural Coverage

Indian mobile operators extended network deployment into rural coverage areas alongside urban capacity upgrades, capacity development rather than any corporate transaction. Coverage buildout is a different purchase from a replacement cycle, because the operator is acquiring capability it does not currently have rather than newer versions of equipment already running.
Signal: Coverage tenders turn on cost per site and deployment speed rather than on any feature depth.
NOVEMBER 2024

Japanese Operators Broaden Open Radio Access Deployment

Japanese mobile operators broadened deployment of open and disaggregated radio access equipment across commercial networks, an organic deployment programme rather than any joint venture. Disaggregation separates radio hardware from controlling software so both can be purchased separately, which addresses supplier concentration rather than delivering technical performance gains.
Signal: Open radio access is a procurement strategy that happens to be expressed as a technology choice.
FEBRUARY 2025

European Operators Complete Restricted Vendor Replacement Programmes

Several European mobile operators completed replacement of network equipment from restricted suppliers under national security requirements, regulatory compliance work rather than any commercial upgrade. Those programmes consumed substantial capital without adding network capacity, which displaced investment that would otherwise have improved coverage or throughput for subscribers.
Signal: Replacement mandated purely on security grounds consumes entire capital budgets without ever producing any additional capacity.

What Network Equipment Costs

Semiconductors account for roughly 38% of network equipment cost, concentrated in custom baseband processors and radio frequency components sourced from a small number of foundries and specialist suppliers. Mechanical assembly, enclosures and thermal management take around 19%, since radio equipment mounts outdoors and must survive weather. Software development amortisation absorbs about 16%, and logistics and installation take most of the remaining balance across global deployment.
Semiconductor supply tightened severely through 2021 and 2022, extending lead times on network equipment from months into more than a year and forcing operators to defer deployments they had already funded. Ericsson Annual Report 2022 and Nokia Annual Report 2022 both record component availability as the principal constraint on delivery during that period. Vendors holding multi-year foundry commitments delivered considerably better than those buying capacity as needed.

The competitive disadvantage mechanism is foundry access rather than component price. A vendor with committed advanced-node capacity can quote delivery dates an operator will build a deployment plan around, while one without it cannot commit at all. Exposure concentrates among smaller vendors and open radio access entrants lacking the volume to secure priority allocation, which is a considerable barrier that has nothing to do with product capability.
telecom-network-infrastructure-market-cost-volatility-analysis-1789993950092

Commit Foundry Capacity Across Multi-Year Horizons

Semiconductors run roughly 38% of equipment cost and availability rather than price has repeatedly been the binding constraint on delivery. Multi-year foundry commitments secure allocation and let a vendor quote dates operators can plan deployments around. Vendors buying capacity as needed cannot commit to delivery, which loses tenders regardless of how competitive the product itself may be.

Design For Component Substitution Where Possible

Custom baseband silicon cannot be substituted, though many surrounding components can be if the design allows for it from the outset. Designing alternative parts into the specification before a shortage arrives costs engineering time and preserves delivery when supply tightens. Vendors discovering during a shortage that no qualified alternative exists have already lost the delivery window entirely.

Model Energy Cost Into Competitive Positioning

Network electricity sits near 23% of operator running costs, and across an 8 year service life the difference between competing systems frequently exceeds the purchase price gap. Quoting watts per gigabit alongside capital cost turns an engineering property into a commercial argument. Vendors competing on hardware price alone are competing on the smaller of the two numbers that matter.

Portfolio Architecture for Margin Defence

Margin architecture separates on how much software and integration sits inside the product. Microwave and satellite backhaul earns least, since the function is comparatively standard and several suppliers compete on hardware price. Fixed access and optical transport sit above it. Core network systems, open radio access software and coherent optical platforms earn most, because each carries software content and integration value that hardware comparison does not capture.
The volume versus premium tension runs between radio access volume and core network margin. Radio access is the largest category by far and the most price-exposed, since operators buy thousands of units and compare cost per site directly. Core network equipment earns considerably better on much smaller volume. Vendors abandoning radio volume to protect core margin lose the operator relationship that makes the core sale reachable at all.

High-value pools concentrate in core network systems and coherent optical transport, where capability is genuinely scarce and comparatively few suppliers can compete. Neither is won on price. Reaching them requires engineering depth accumulated across years and, in optical, access to component technology that a small group of suppliers holds. That is why concentration here has proved so persistent across successive technology generations.

Volume / Commodity-Adjacent

Microwave and satellite backhaul systems and basic fixed access aggregation, where the function is comparatively standard and several suppliers compete largely on hardware price. The ten point spread separates suppliers holding service and support attachment from those selling equipment transactionally.
Gross Margin: 24% to 34%

Premium / Certified

Radio access equipment and standard optical transport, where cost per carried gigabit and power efficiency determine selection across very large unit volumes. The ten point spread tracks manufacturing scale and foundry allocation, both of which vary considerably between the largest vendors and everybody else.
Gross Margin: 38% to 48%

Sustainability / Regulatory / Next-Generation

Core network systems, open radio access software and coherent optical platforms, where software content and scarce engineering capability rather than hardware cost determine value. The sixteen point spread reflects how much of the product is software, which differs enormously across this layer.
Gross Margin: 52% to 68%
telecom-network-infrastructure-market-portfolio-architecture-1789993950603

High-value Sub-segments and Strategic Watch-out

Open And Disaggregated Radio Access Equipment

Grows at 7.5% as operators pursue supplier diversity against a field where five vendors hold 71% of the market. The sixteen point spread here reflects software content. Integration work that the incumbent vendor once absorbed entirely now has to be funded by somebody else entirely.
Gross Margin: 52% to 68%

Optical Transport And Transmission Equipment

Grows at 6.1% because traffic compounding near 25% annually has to move between sites and fibre remains the only economic route for carrying it. The ten point spread reflects coherent optical capability. A comparatively small group of suppliers holds genuine coherent optical capability at commercial scale.
Gross Margin: 38% to 48%

Core Network And Packet Processing Systems

Grows at 5.4% on software content and virtualisation rather than on any growth in the number of core sites deployed. The sixteen point spread reflects overall software weighting. Consolidation between operators reduces the core site count faster than traffic growth manages to add to it.
Gross Margin: 52% to 68%

Microwave And Satellite Backhaul Systems

Grows at 3.2%, slowest of the six domains, as fibre transport displaces microwave wherever laying fibre is economically feasible at all. The ten point spread reflects service and support attachment. Remote and difficult geography keeps the category commercially viable for the time being at least.
Gross Margin: 24% to 34%

Why Vendor Positions Persist

The annuity here comes from network homogeneity rather than contract terms. A radio access network built on one vendor's equipment gets expanded with the same vendor's equipment, because mixing suppliers within one coverage area creates interference and handover problems somebody must engineer around. Equipment runs around 8 years and expansion happens continuously across that whole period. An incumbent vendor therefore sells into its own installed base for most of a decade.
Stickiness varies considerably by domain. Radio access is the most entrenched, since coverage areas must be internally consistent and engineering teams are trained on one system. Core network equipment is similarly sticky through integration depth. Optical transport is more substitutable at the edge, and microwave backhaul is genuinely competitive per link. Vendors frequently price all four as though equal defensibility applied, which it plainly does not.

The buyer has moved from network engineering toward finance and regulatory affairs, which changes what wins tenders. An engineering organisation evaluated peak capability and feature depth. A finance function evaluates cost per carried gigabit against a capital intensity ratio investors watch closely. A regulatory function determines which vendors are permissible. Vendors selling to engineering alone address one of three decision-makers who now matter.
telecom-network-infrastructure-market-end-use-penetration-index-1789993951099

What Decides Network Tenders

These are among the four positions where our research anticipates prominent divergence between winners and laggards over the coming forecast period. Each is grounded in the demand model, the regulatory perimeter, and the announced capacity pipeline.
01 / CAPACITY COST POSITIONING

Sell Cost Per Gigabit, Not Peak Throughput

Data traffic compounds at roughly 25% annually while operator capital intensity holds near 17% of service revenue that has been broadly flat for over a decade, so every additional bit carried has to cost less than the one before it. That arithmetic decides purchases far more reliably than any feature comparison ever manages to. Vendors presenting absolute peak throughput are answering a question that the operator's finance function never asked them, and the capital approval process reflects that mismatch precisely.
02 / POLICY POSITION DURABILITY

Build Capability While The Field Is Narrow

Security restrictions across roughly 22 countries removed particular vendors from consideration entirely, narrowing the practical supplier field from five down to two or three in each of those markets. That is a commercial position no product advantage created, and policy that produced it can equally reverse it as conditions change. Vendors treating a restricted market as a permanent entitlement price accordingly and then lose those accounts when the supplier field eventually widens again, which it has already done more than once.
03 / BUILDOUT MARKET COVERAGE

Win Coverage Tenders On Cost Per Site

India compounds at 7.9% and operators across Southeast Asia and Africa are extending coverage into geography that has never had any, which is a fundamentally different kind of purchase from anything a mature market replacement cycle involves. The operator is buying network capability it does not currently have at all, rather than newer versions of equipment it already runs. Cost per site and deployment speed decide those tenders outright, and vendors organised around mature market replacement selling routinely misread them completely.
04 / OPERATING COST ECONOMICS

Quote Power Alongside Every Capital Price

Network electricity accounts for roughly 23% of operator running costs and radio access equipment consumes most of that, which across a full 8 year service life frequently exceeds the entire purchase price difference between two competing systems. Operators in markets carrying volatile electricity pricing already model this cost explicitly during their evaluation process. Vendors quoting hardware price alone are competing on the smaller of the two numbers that actually determine the decision, and they frequently lose to a system costing more.

Engagement Snapshot From the Field

A live engagement with an industry participant carrying material or product regulatory and market exposure ahead of a defining policy shift, showing how our research translates into a defensible multi-year portfolio strategy.
MARKET MINDS ADVISORY · CLIENT ENGAGEMENT SUMMARY
Telecom Network Infrastructure Producer Strategic Portfolio Review and Transition Roadmap 2026·Investment Scenario on Telecom Network Infrastructure Exposure Evaluation 2025-26
CLIENT PROFILE
A mid-sized European mobile operator running a single-vendor radio access network across its national footprint, facing a mandated replacement programme for restricted equipment across part of that network. Capital intensity was already sitting above the level its investors were comfortable with, and the replacement would add considerable cost without adding any capacity anywhere in the network.
STRATEGIC CHALLENGE
Network engineering favoured replacing like with like from one of the two permitted suppliers, on integration grounds that were entirely legitimate. Finance objected that this would leave the operator with the same supplier concentration that had created the problem. Nobody had costed what open radio access would genuinely require in internal engineering capability.
MMA APPROACH
MMA costed the like-for-like replacement against a partial open radio access deployment, including the internal integration capability the second option required and which the operator did not currently have. We modelled energy consumption across an eight year service life for both options and assessed supplier pricing behaviour under narrowed and widened supplier fields. Work drew on 47 expert interviews conducted in Q4 2025.
KEY FINDINGS
  1. Like-for-like replacement carried a lower initial capital cost but left the operator negotiating against 2 permitted suppliers for the following 8 years.
  2. Open radio access deployment required internal integration engineering the operator would have needed to build, at a cost comparable to the capital saving.
  3. Energy consumption differed by enough across the eight year life to materially change the comparison between the two options (client-reported, unverified by MMA).
  4. Supplier pricing in the operator's own market had moved measurably since restrictions narrowed the field, which the finance function had long suspected but never actually demonstrated.
CLIENT PROFILE
A mid-sized European mobile operator running a single-vendor radio access network across its national footprint, facing a mandated replacement programme for restricted equipment across part of that network. Capital intensity was already sitting above the level its investors were comfortable with, and the replacement would add considerable cost without adding any capacity anywhere in the network.
STRATEGIC CHALLENGE
Network engineering favoured replacing like with like from one of the two permitted suppliers, on integration grounds that were entirely legitimate. Finance objected that this would leave the operator with the same supplier concentration that had created the problem. Nobody had costed what open radio access would genuinely require in internal engineering capability.
MMA APPROACH
MMA costed the like-for-like replacement against a partial open radio access deployment, including the internal integration capability the second option required and which the operator did not currently have. We modelled energy consumption across an eight year service life for both options and assessed supplier pricing behaviour under narrowed and widened supplier fields. Work drew on 47 expert interviews conducted in Q4 2025.
KEY FINDINGS
  1. Like-for-like replacement carried a lower initial capital cost but left the operator negotiating against 2 permitted suppliers for the following 8 years.
  2. Open radio access deployment required internal integration engineering the operator would have needed to build, at a cost comparable to the capital saving.
  3. Energy consumption differed by enough across the eight year life to materially change the comparison between the two options (client-reported, unverified by MMA).
  4. Supplier pricing in the operator's own market had moved measurably since restrictions narrowed the field, which the finance function had long suspected but never actually demonstrated.
RECOMMENDED STRATEGY
Phase 1: Phase one: deploy open radio access in one metropolitan area to build internal integration capability before committing the wider network to it. Phase 2: Phase two: replace the restricted equipment like-for-like everywhere else, since the mandated regulatory timeline did not permit building capability first. Phase 3: Phase three: quote energy consumption alongside capital cost in every future tender, which no previous evaluation the operator ran had ever done.
OUTCOME
The operator ran both approaches in parallel and built integration capability in one region while meeting its mandated replacement timeline elsewhere (client-reported, unverified by MMA). Supplier pricing in subsequent negotiations improved measurably once a credible alternative existed. Energy is now costed in every tender, which was the change that outlasted the engagement itself.

Frequently Asked Questions

Foundational context covering the market sizes, CAGR, scope, country, region and competition that inform every finding below. This section is provided to cover basics and most often pre-purchase conversations, answered from the MMA Primary Research Dataset.

What is the current size of the Telecom Network Infrastructure Market?

Global value reaches USD 123.9 billion in 2026, measured as network equipment revenue across six network domains. The 2025 base for the market is USD 118.0 billion.

How large will the Telecom Network Infrastructure Market be by 2036?

The market reaches USD 201.8 billion by 2036, an increase of USD 77.9 billion across the forecast period. That represents 1.63 times expansion from the 2026 base.

What is the CAGR for the Telecom Network Infrastructure Market 2026 to 2036?

The base case runs at 5.0% annually, with a bull case at 6.2% if the next generation standard restarts a replacement cycle and a bear case at 3.8% if operator consolidation removes networks faster than expected.

Which segment is growing fastest?

Open and disaggregated radio access equipment grows at 7.5%, half again the market rate of 5.0%. Operators pursue it for supplier diversity against a field where five vendors hold 71%.

Who are the major companies in the Telecom Network Infrastructure Market?

Huawei, Ericsson, Nokia, ZTE and Samsung Networks lead on network equipment revenue, together holding 71%. Ciena, Juniper Networks and NEC hold smaller positions across specific domains.

Which country is growing fastest?

India leads at 7.9%, on network buildout that is still adding coverage and capacity rather than replacing equipment already installed. Indonesia and Vietnam follow behind it.

Report Segmentation Architecture

The full report scope spans multiple orthogonal segmentation dimensions, with cross-tabulated demand data provided for each dimension pair. Coverage extends further to regional breakdowns, trend trajectories, and the competitive detail needed to support segment-level decision-making.

By Network Domain

  • Open And Disaggregated Radio Access Equipment
  • Optical Transport And Transmission Equipment
  • Radio Access Network Equipment
  • Core Network And Packet Processing Systems
  • Fixed Access And Broadband Aggregation
  • Microwave And Satellite Backhaul Systems

By End-Use Industry

  • Mobile Network Operators
  • Fixed Line And Broadband Providers
  • Cable And Converged Operators
  • Wholesale And Neutral Host Providers
  • Government And Defence Networks
  • Private Enterprise Networks

By Commercial Dimension

  • Direct Operator Tenders
  • Managed Service Contracts
  • Systems Integrator Delivery
  • Greenfield Coverage Deployment
  • Replacement And Upgrade Programmes
  • Regulatory Mandated Replacement

By Region

  • North America
  • Western Europe
  • East Asia
  • South Asia and Pacific
  • Latin America
  • Middle East and Africa
  • Eastern Europe

Scope, Methodology, and Coverage

Every figure in this report is reproducible from documented input assumptions. The scope below maps the historical period, the forecast horizon, the segmentation dimensions, and the countries covered, alongside the underlying primary and qualitative methodology.
Historical Period
2020 to 2025
Forecast Period
2026 to 2036
Base Year
2025 (USD billions; MMA Primary Research Dataset, September 2026)
Market Definition
This report covers telecom network infrastructure equipment by network domain: radio access network equipment, open and disaggregated radio access equipment, core network and packet processing systems, optical transport and transmission equipment, fixed access and broadband aggregation equipment, and microwave and satellite backhaul systems. It excludes handsets and customer premises equipment, network management software sold separately, tower and passive site infrastructure, data centre networking, and telecom operator services revenue.
Quantitative Units
USD millions, equipment revenue basis; deployed radio sites; network traffic growth as an annual percentage; capital intensity as a share of operator service revenue; equipment service life in years.
Segmentation Dimensions
Network domain; operator and end-use type; commercial procurement route; geography across seven regions.
Regions Covered
North America, Western Europe, East Asia, South Asia and Pacific, Latin America, Middle East and Africa, Eastern Europe
Countries Covered
China, Japan, South Korea, India, Indonesia, Vietnam, Australia, United States, Canada, Mexico, Brazil, Germany, France, United Kingdom, Italy, Spain, Poland, Saudi Arabia, United Arab Emirates, Nigeria.
Key Companies Profiled
Huawei, Ericsson, Nokia, ZTE, Samsung Networks, Ciena, Juniper Networks, Cisco Systems, Fujitsu, NEC, Mavenir, CommScope, Adtran, Infinera, Rakuten Symphony.
Quantitative Methodology
Primary survey, n=3,800 respondents, Q4 2025, six countries; demand-side model with trade association cross-validation
Qualitative Methodology
47 expert interviews, Q4 2025; applied to validate demand model assumptions, identify emerging dynamics, and assess competitive positioning
Report Format
PDF and XLSX data workbook (Word format preview document)
Publisher
Market Minds Advisory
Report Code
MMA-2026-TEC-671
Published
September 2026
Contact
sales@marketmindsadvisory.com | www.marketmindsadvisory.com

Purchase the full Telecom Network Infrastructure Market Report (2026 to 2036).

This report sizes the global telecom network infrastructure market from 2026 to 2036 across six network domains, six operator types and seven regions. It explains why traffic compounding near 25% annually against flat operator revenue caps the whole market, and why capital intensity holding at 17% of service revenue is the constraint every vendor argument has to answer. Security restrictions across roughly 22 countries are analysed as a commercial rather than technical force, alongside open radio access adoption. Cost composition is sourced to company annual reports and IEA analysis. Regional analysis explains why East Asia leads at 29% of spending.
Six network domains sized through to 2036
Traffic and revenue divergence quantified across the forecast
Vendor restriction effects assessed across affected markets
Twenty named vendors assessed on equipment revenue
Four revenue levers with quantified commercial impact
Anonymised European operator vendor strategy engagement documented fully

Built For The People Who Decide

From boardroom strategy to bench-side execution, this report is read cover-to-cover by leaders shaping the next decade of their industry, turning demand scenarios, market dynamics and valuation benchmarks into decisions.
CXOs/ Presidents/ VPs/ Managers
M&A and Corporate Development
Strategy Teams and R&D Heads
Procurement and Product Directors
Regulatory and Compliance Leaders
Investor Relations and Equity Analysts