Market Minds Advisory
Telecom Generator Market

Telecom Generator Market: Telecom Generator Market: Rating Migration, Managed Energy Contracts and Fuel Security, 2026 to 2036

Solar hybrids are removing generators from towers while edge computing adds far larger ones at aggregation sites, so unit counts fall and revenue keeps climbing on a rating shift nobody is tracking.

Lead Analyst

Published

September 2026

Make Smarter Decisions with Customized Research Insights

Request a free sample report and evaluate market opportunities, growth trends, and competitive dynamics relevant to your business needs.

2025 MARKET VALUE$2.9BMarket Size 2025
2036 FORECAST VALUE$5.4BBase Case , 2026 to 2036
CAGR 2026 TO 20365.8 %Bull 7.0% / Bear 4.6%
INCREMENTAL OPPORTUNITY$2.3BNet 10- year value creation
EXPANSION MULTIPLE1.76x2036 value over 2026 base
Strategic Levers
M&A Pipeline
Regional Outlook
Country Rankings
Competitive Intelligence
Segmental Deep-dive
Call-Us : 91 93563 13602

Executive Snapshot and Market Trajectory.

Two things are happening at once and they cancel in the headline number. Solar hybrids are removing generators from individual towers, while edge computing and network densification are adding much larger sets at aggregation points. Units fall, revenue rises, and the average rating climbs steadily. Nobody tracks that.
That migration decides where growth sits. Sets rated 60 to 150 kVA grow at 8.7%, half again the market rate of 5.8%, serving edge nodes and aggregation sites that did not exist as a category five years ago. Below 10 kVA, the classic tower genset, growth has almost stopped. Around 64% of tower sites now sit under managed energy service contracts. That buyer is new.
Five manufacturers hold 51% of measured shipment volume. The energy service company buying on a per-site fee optimises fuel consumption and service interval rather than purchase price, which is a different sale from the one this industry was built around. Fuel theft consumes roughly 19% of delivered site fuel in the worst markets, and emission standards have raised small-rating prices by about 27%. Neither number appears in any engine brochure. Both outrank the engine.
Market Definition
The telecom generator market covers diesel and gaseous fuel generating sets supplied for telecommunications infrastructure, spanning tower and base station backup, aggregation and edge computing nodes, mobile switching centres, exchange buildings and network operations facilities, across rating classes from below 10 kVA to above 500 kVA. Sizing is measured at manufacturer revenue. Fuel supply, site batteries, solar hybrid equipment, uninterruptible power supplies, rectifiers and standalone operations and maintenance services are excluded.
Base Year Value
$2.9B in 2025 (MMA Primary Research Dataset, September 2026)
Forecast Period
2026 to 2036, eleven discrete annual values
CAGR
5.8% base case. Bull 7.0%. Bear 4.6%.
Fastest Growth Segment
Sets Rated 60 to 150 kVA: 8.7% CAGR
Fastest Growth Country
India: 9.4% CAGR
Fastest Growth Region
South Asia and Pacific: 8.0% CAGR
Largest Region
Middle East and Africa: 28% of 2025 global value
Market Leaders
Cummins, Caterpillar, Kohler Energy, Mahindra Powerol, Kirloskar Oil Engines. Source: MMA Analysis based on company annual reports and measured shipment volume.
Primary Survey
n=3,800 procurement and R&D decision-makers, Q4 2025, six countries
Methodology
Demand-side build-up, cross-validated against public data, 47 expert interviews

Telecom Generator Market Forecast Scenarios

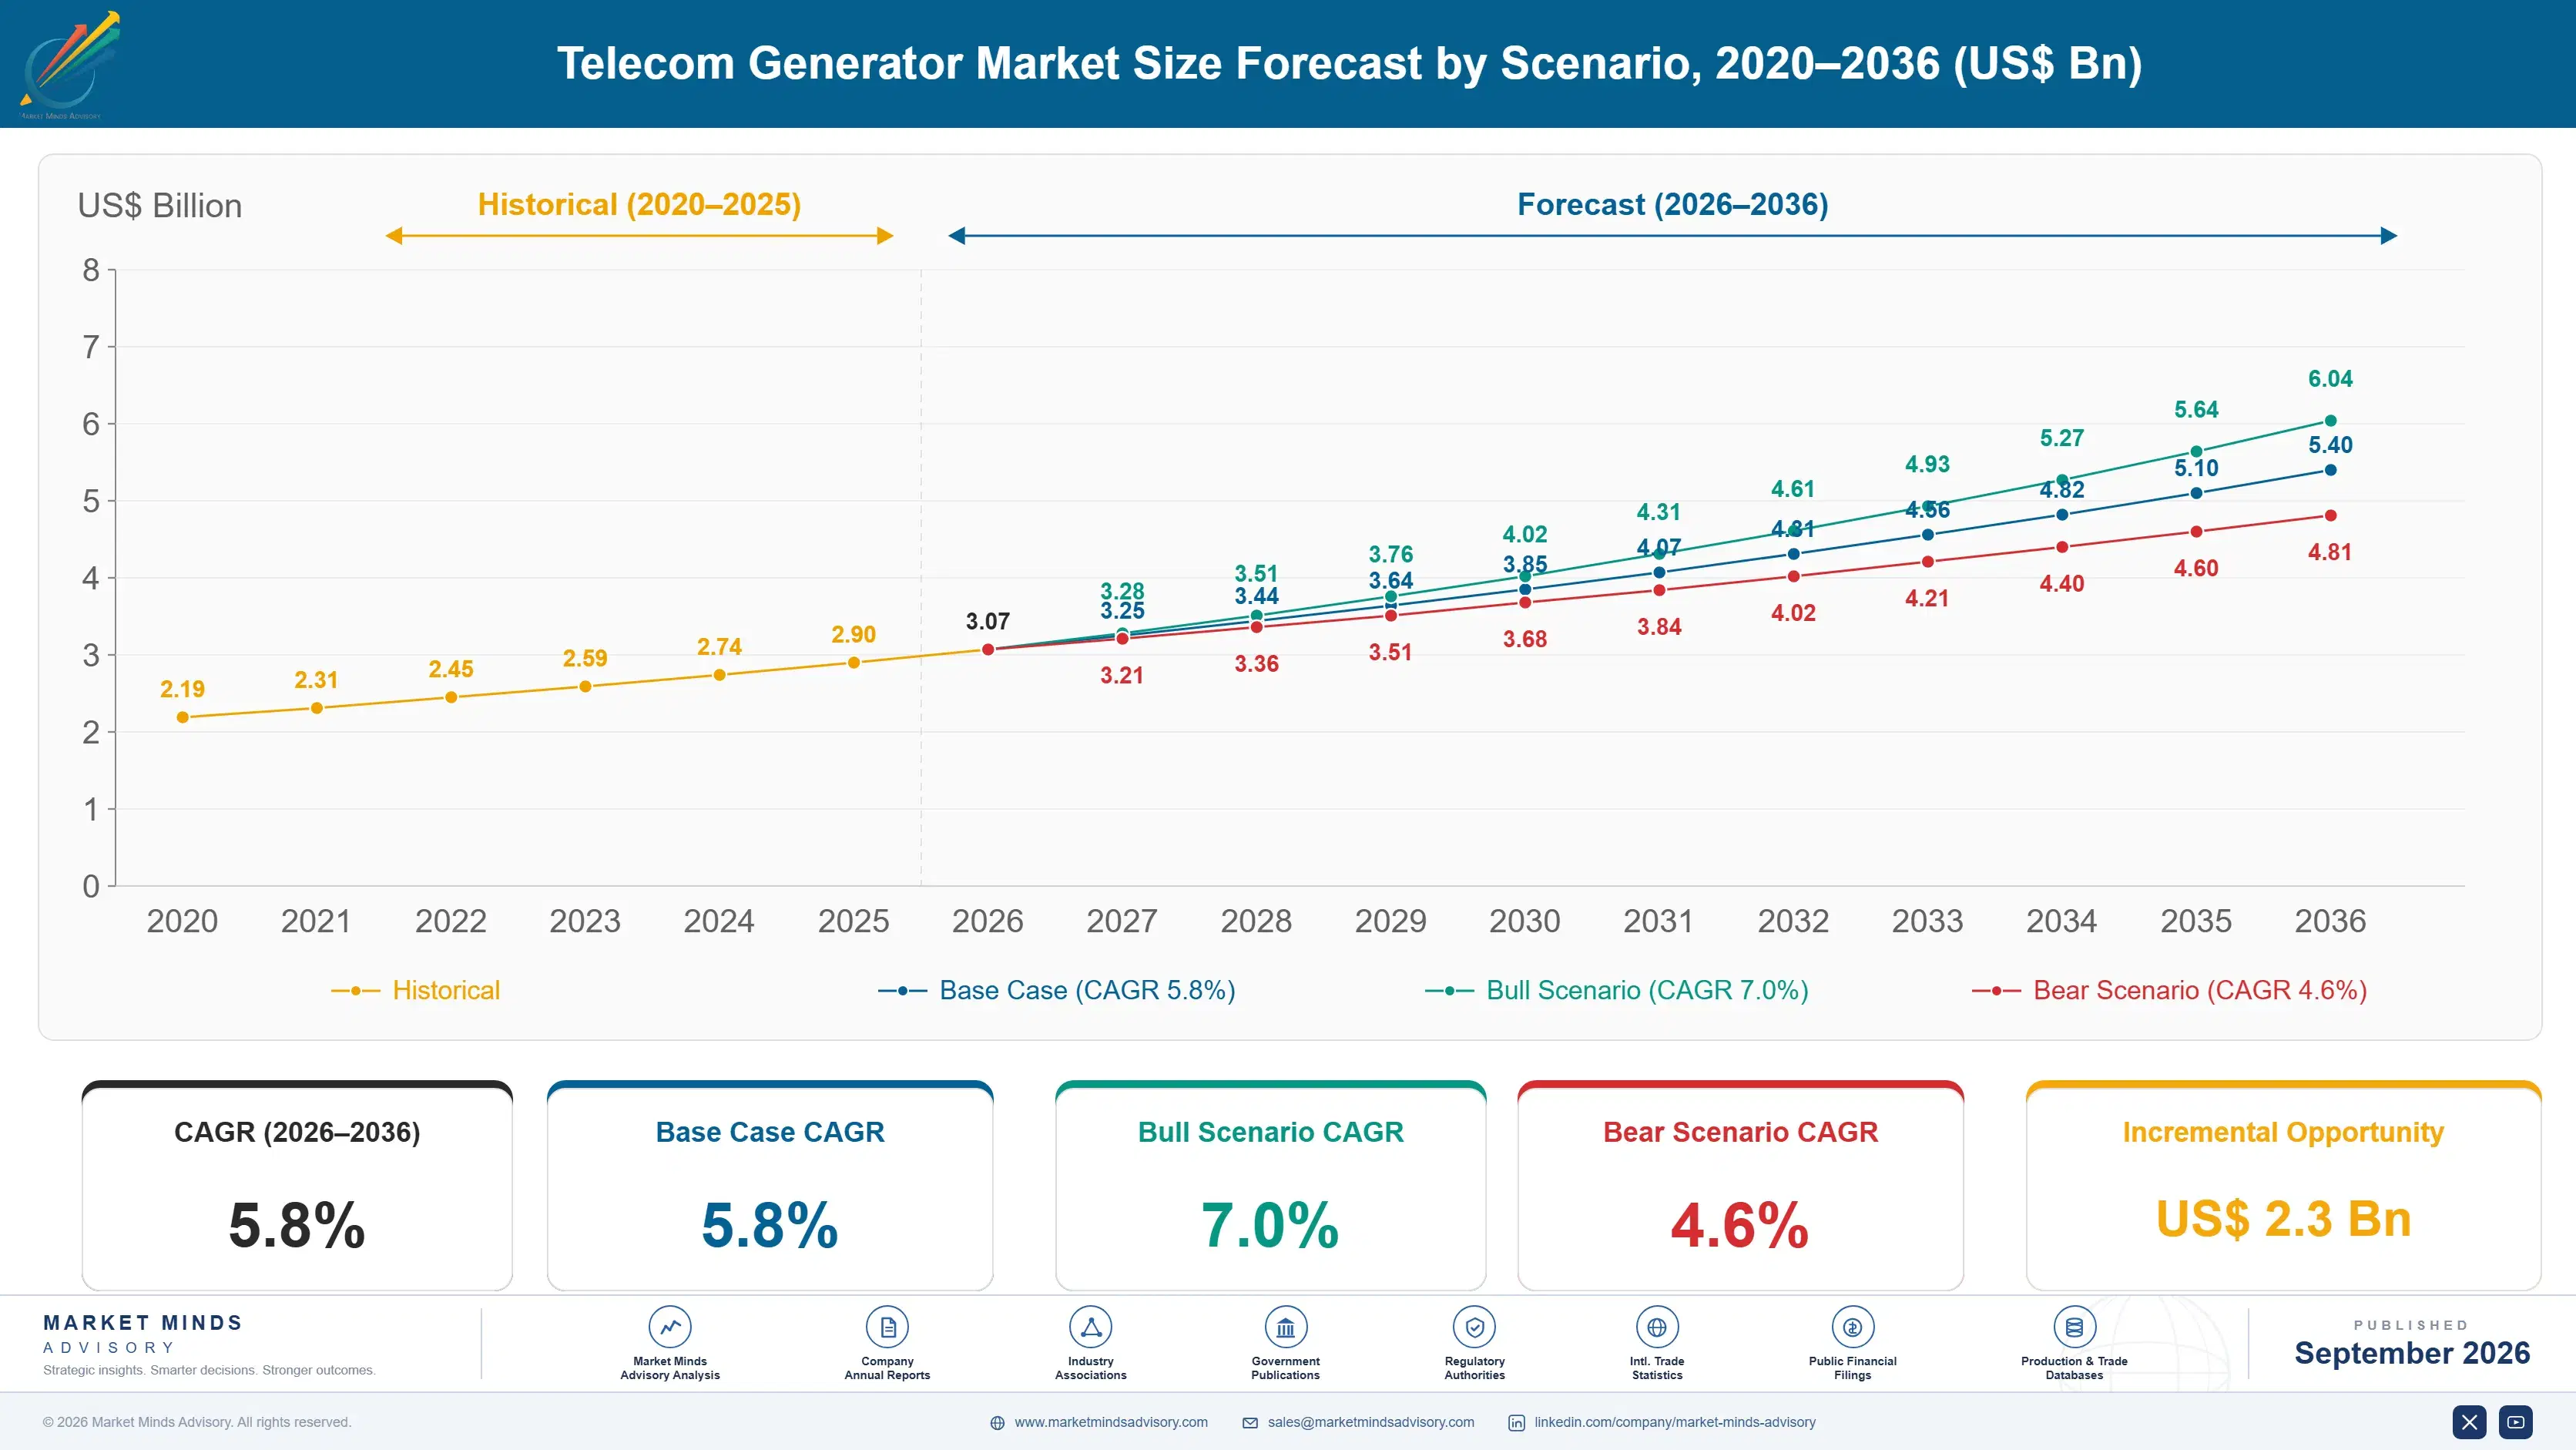
telecom-generator-market-size-forecast-scenario-1788412469452
Between 2020 and 2025 the market compounded at 4.6%, a figure concealing real decline in tower unit volumes offset by rising ratings and emission compliance pricing. Tower companies hybridising sites removed thousands of small sets from service across Africa and South Asia. At the same time network operators began building aggregation and edge sites with power requirements an order of magnitude above a base station.
The 5.8% base case rests on three commercial mechanisms. Edge computing and network densification are creating sites with substantial continuous load that require generator backup rather than battery ride-through. Emission standards including India's CPCB IV+ have raised prices on exactly the ratings telecom uses, lifting revenue independently of volume. And managed energy service contracts are professionalising procurement, which favours better engines with longer service intervals over the cheapest available machine.
The bull case is edge computing deployment accelerating faster than currently assumed, since each node carries a generator several times the size of the tower it sits beside. The bear case is battery costs falling far enough that lithium storage covers the full outage duration at aggregation sites too, removing the generator from the growing part of this market too.

Falling Unit Counts, Rising Average Ratings

The tower generator is being removed one site at a time. A solar array with lithium storage covers most of a base station's load in most climates, and the generator becomes a rarely used backup rather than a machine running eight hours a day. That reduces unit and replacement demand, and across Africa and South Asia the effect on small rating volumes is not reversing.
TOP FIVE CONCENTRATION51%Share of measured shipment volume held by leading manufacturers
DAILY RUNNING HOURS8 hoursGenerator running time daily at a typical unreliable-grid site
FUEL THEFT LOSS19%Portion of delivered site fuel lost to theft annually
SERVICE INTERVAL500 hoursRunning hours between scheduled service visits on telecom duty
MANAGED SERVICE SHARE64%Portion of tower sites powered under energy service contracts
COMPLIANCE PRICE UPLIFT27%Price increase from current emission standards on small ratings
What is replacing it sits further up the network. Aggregation sites, edge computing nodes and the small data centres operators are building to support low-latency services carry continuous load that batteries cannot ride through, and the generator required is often ten times a tower set. That is why sets rated 60 to 150 kVA grow at 8.7% while the classic tower ratings barely move at all.
The buyer changed alongside the product. Around 64% of tower sites now operate under managed energy service contracts, where a service company operates the power equipment and charges per site per month. That company earns on the gap between the fee and its fuel and maintenance cost, so it specifies consumption and service interval rather than purchase price, which suits established engine manufacturers.
"Everyone reads the falling tower genset numbers and concludes this market is dying. The average rating has been climbing for six years, and a single edge node generator is worth more than twenty of the tower sets that solar displaced. The units tell one story and the revenue tells the opposite one."
Director, Telecom Infrastructure and Site Power Practice · MMA Energy and Power Practice · September 2026

Market Trends

Edge Computing Moves The Rating Class Upward

Low-latency services require processing close to the user, and operators are building aggregation and edge nodes that carry continuous computing load rather than the intermittent radio load of a base station. Battery ride-through does not cover a multi-hour outage at those sites, so a generator is specified, and it is often ten times the rating of the tower set beside it. That single shift explains why revenue rises while unit counts fall. Sets rated 60 to 150 kVA grow at 8.7% against a market growing 5.8%, and almost none of it existed as a category five years ago.
Market Impact: Adds 3 sites per aggregation point
Managed Energy Contracts Professionalise The Specification

Tower companies increasingly buy site power as a service rather than owning generators, and around 64% of sites now sit under such contracts. The service company charges a fixed fee per site per month and keeps whatever it does not spend on fuel and maintenance, which makes fuel consumption and service interval the only numbers that matter to it. Purchase price becomes almost irrelevant to a buyer amortising equipment across a ten year contract. That inverts the commercial logic of a market long dominated by capital cost, and it favours manufacturers with genuine engine efficiency and long maintenance intervals.
Market Impact: Runs 8 hours every day

Market Opportunities and Growth Drivers

Network Densification Multiplies Aggregation Site Count

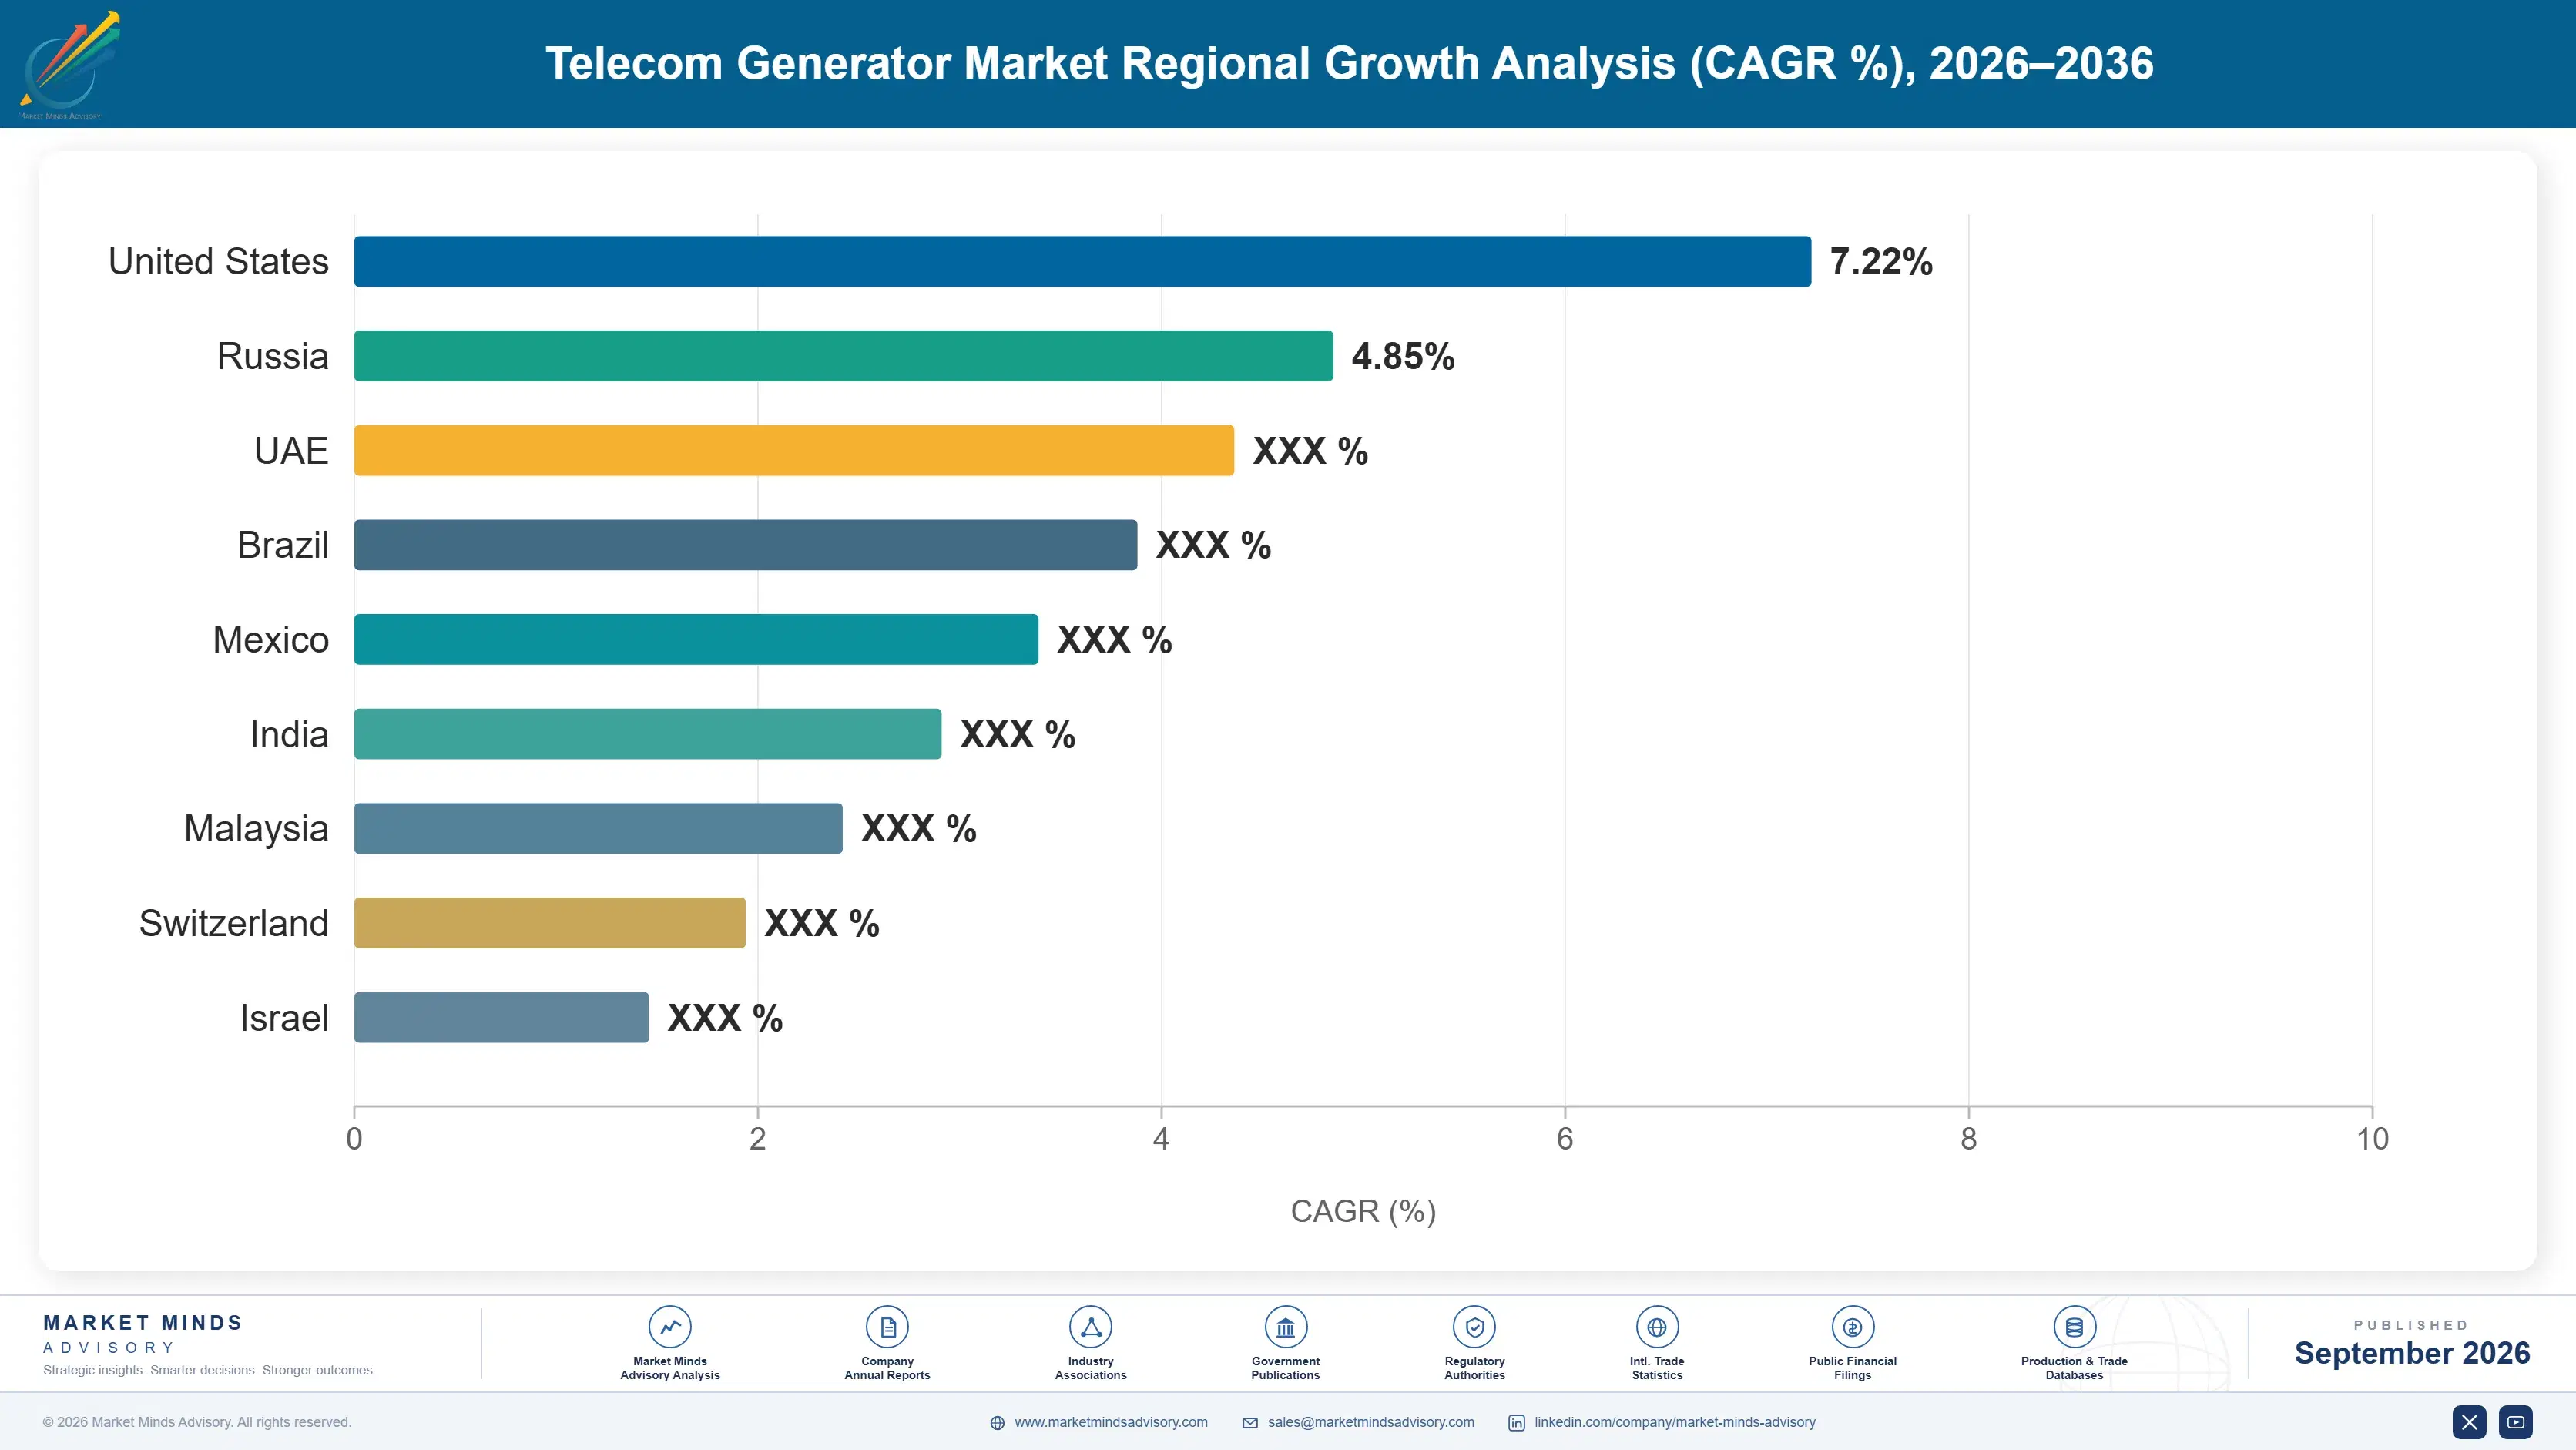
Higher frequency bands cover far less ground than the spectrum they supplement, so operators deploying them build many more sites, and those sites feed back through aggregation points that concentrate traffic and processing. Each aggregation point carries load a base station never did. Indian and Southeast Asian operators are densifying fastest, which is why India grows at 9.4% and leads every country in this market. The generator specified at these locations is a commercial machine rather than a telecom accessory, bought on service interval and fuel consumption. Nobody sells that machine as a telecom product.
Market Impact: Loses 19% of delivered fuel

Grid Absence Keeps African Site Power On Engines

A substantial share of African tower sites has no grid connection at all, and many more have one that supplies power for a fraction of the day, so generators run around eight hours daily on average. Solar hybridisation reduces that running time considerably but rarely eliminates the machine, because operators will not accept the outage risk of a fully solar site during extended cloud. The result is a large installed base requiring replacement on a defined cycle. Tower company consolidation across the continent has made that replacement demand unusually visible and plannable.
Market Impact: Cuts 5,000 running hours yearly

Market Restraints and Challenges

Fuel Theft Dominates Site Operating Economics

Roughly 19% of fuel delivered to sites in the worst affected markets never reaches the engine, lost to siphoning, delivery short-measure and collusion between drivers and site staff. The root cause is that diesel is a liquid currency in cash economies and telecom sites are unattended in remote places. Commercial impact falls on the energy service company, which is precisely why it specifies tank design, level sensing and remote monitoring more carefully than it specifies the engine. Mitigation runs through sealed tank systems, telemetry that reports consumption against generated kilowatt hours, and moving fuel supply responsibility onto the contractor.
Market Impact: Runs 10 times tower rating

Solar Hybridisation Erodes The Traditional Volume Base

Every hybridised tower reduces generator running hours by a large margin and extends replacement intervals accordingly, which removes both new unit demand and aftermarket revenue from the smallest rating classes. The root cause is simply that solar with lithium storage now costs less over a site's life than diesel delivered by road. Commercial impact is concentrated on manufacturers whose telecom business sits below 25 kVA. Participants are mitigating by moving up the rating range into edge and aggregation sites, by supplying hybrid-optimised sets designed for infrequent starting, and by selling through the managed service channel.
Market Impact: Covers 64% of tower sites
3 additional market trends, 4 additional growth drivers, and 2 additional restraints and challenges are covered in the full report. Contact sales@marketmindsadvisory.com to access the complete intelligence.

Segment CAGR and Growth Architecture

Segmentation follows rated output, which is how this equipment is designed, certified, priced and sold, and which maps precisely onto the network tier being served. Each class faces a different competitive situation, a different emission compliance burden and a different demand trajectory, and the divergence between the smallest and the middle classes is now extreme.
telecom-generator-market-market-share-analysis-1788412470006

Sets Rated 60 to 150 kVA

This class serves aggregation sites, edge computing nodes and the smaller operator data centres that network densification has created, and almost none of that demand existed as a distinct category five years ago. Load at these locations is continuous rather than intermittent, so battery ride-through is inadequate and a generator is specified as a matter of course. Procurement follows commercial and data centre practice rather than telecom site purchasing, with redundancy requirements and formal commissioning. Growth at 8.7% is half again the market rate of 5.8%. Established engine manufacturers hold this class comfortably, because the buyer evaluates service interval and fuel consumption rather than purchase price. Telecom specialists find this class difficult to enter.
CAGR 8.7%

Sets Rated 150 to 500 kVA

Mobile switching centres, exchange buildings, network operations facilities and operator data centres sit in this class, where power continuity carries contractual service level commitments and redundancy is standard rather than exceptional. Buyers here run load bank testing, demand documented maintenance histories and specify fuel storage for extended autonomy, which is a considerably more rigorous purchase than any tower site involves. Growth at 8.0% tracks operator data centre construction closely. Competition comes from the general commercial and industrial generator market rather than from telecom specialists, and the manufacturers who win are those already established in data centre supply. The redundancy requirement alone doubles the equipment on many of these sites. Extended fuel autonomy is specified routinely.
CAGR 8.0%
Full segment breakdown across 6 segments available in the complete report.

Regional Architecture and Country Demand Map

Demand follows grid absence, tower density and network densification rather than subscriber numbers or telecom revenue. Africa and South Asia together take more than half this market because that is where sites run on engines for a large part of every day. Subscriber counts mislead completely.

Middle East and Africa

A large share of African tower sites has no grid connection at all and many more receive power for only part of the day, so generators run around eight hours daily on average; the region at 28% sits far above the standard band ceiling of 6% for exactly that reason. Tower company consolidation has concentrated purchasing into a small number of sophisticated buyers who procure through managed energy service contracts. Fuel theft consumes roughly a fifth of delivered fuel and dominates specification decisions. Gulf demand is entirely different, centred on switching centres and data facilities where grid supply is reliable and generators serve genuine backup duty. Two entirely different buyers sit inside this one number.
Share: 28% | CAGR: 5.6% (2026 to 2036)

South Asia and Pacific

India leads regional growth at 9.4%, the fastest of any country, driven by network densification creating aggregation sites and by operator data centre construction, and the region sits at 24% against a standard band ceiling of 12% because tower counts here are the largest anywhere outside China. CPCB IV+ emission standards raised prices materially on the small ratings and pushed several domestic manufacturers out of the market. Indonesian and Philippine island sites depend heavily on engines. Bangladeshi and Pakistani tower power is transitioning to managed service contracts on the African model. Purchasing here is professionalising quickly, with lifecycle cost analysis replacing capital price comparison across the larger tower estates in the region.
Share: 24% | CAGR: 8.0% (2026 to 2036)
Regional intelligence for 5 additional markets available in the complete report: East Asia, North America, Western Europe, Latin America, Eastern Europe. Contact sales@marketmindsadvisory.com.
telecom-generator-market-country-cagr-analysis-1788412470530

Where Generator Margin Now Sits

Four positions carry margin in a market whose unit base is shrinking at the bottom and growing at the middle. Each depends on capability or channel position built before the shift completes, and manufacturers whose telecom business still sits below 25 kVA are defending ground that solar hybridisation is steadily taking from them. Timing decides the outcome.

Follow The Rating Migration Upward Deliberately

Edge and aggregation sites specify generators roughly 10 times the rating of the tower sets solar is displacing, and the 60 to 150 kVA class grows at 8.7% against a market at 5.8%. Manufacturers whose telecom position sits below 25 kVA are defending a shrinking base while the value migrates past them. Moving up requires commercial and data centre selling capability rather than telecom accessory selling, which is a different organisation. The transition has to be funded before the small rating business finishes declining. Nobody recovers a site that no longer needs an engine.
Market Impact: Targets ratings 10 times the tower set size

Sell To Energy Service Companies Not Operators

Around 64% of tower sites sit under managed energy service contracts, and the service company keeps whatever it does not spend on fuel and maintenance across a ten year term. That buyer evaluates fuel consumption and service interval and is largely indifferent to purchase price, which inverts the logic of a market long won on capital cost. Manufacturers with genuine efficiency and 500 hour service intervals are advantaged for the first time. Selling this way requires quantified lifecycle evidence that most sales organisations cannot produce. Most sales organisations still quote capital price into these conversations.
Market Impact: Reaches the 64% of sites under service contracts

Engineer Against Fuel Theft Directly Instead

Roughly 19% of delivered fuel never reaches the engine in the worst markets, which is a larger operating cost than maintenance and fuel efficiency combined. Sealed tank design, level sensing and telemetry reporting consumption against generated kilowatt hours address it directly, and the energy service company buying the machine cares about this more than about anything in the engine specification. Very few manufacturers treat theft as an engineering requirement rather than a customer problem. The ones that do win on evidence rather than argument. Telemetry evidence closes these sales quickly.
Market Impact: Recovers the 19% of site fuel currently lost

Certify Early For Tightening Emission Standards

CPCB IV+, Stage V and Tier 4 Final all require aftertreatment on ratings that used bare engines, and compliance raised small rating prices by roughly 27% while pushing several smaller manufacturers out entirely. Certification takes years and considerable capital, so the manufacturers who committed early now supply markets competitors cannot enter. Aftertreatment also has to be serviceable in remote locations by technicians without diagnostic equipment, which is a design problem separate from certification itself and one that few have solved properly. Field serviceability is where the remaining advantage sits. Certification alone is not the whole barrier.
Market Impact: Supports the whole 27% compliance price uplift properly

Who Controls the Margin Pool

Measured on shipment volume, the basis used throughout this section, the top five hold 51%. Concentration is higher than in general industrial generation because emission certification cost and telecom customer qualification both act as filters. The gap between leaders and the rest is service network reach and documented lifecycle cost evidence rather than engine technology, which is broadly comparable across established manufacturers.
Competition now runs on fuel consumption, service interval and remote monitoring rather than on capital price, because the buyer is increasingly an energy service company amortising equipment across a long contract. Indian manufacturers hold their domestic market comprehensively and export into African and South Asian markets on price. Chinese producers supply large volumes into the same territories. Established international brands hold the upper rating classes and operator data centre work.

Pressure builds from two directions. Solar hybridisation continues removing the smallest ratings from service, and manufacturers concentrated there will not recover that volume. And the growing part of the market is contested by general commercial and industrial generator suppliers who were never telecom specialists at all. Rankings shift where manufacturers moved up the rating range and built energy service company relationships rather than defending tower accounts.
telecom-generator-market-company-positioning-matrix-1788412471048

Competitive Moat and Risk Dimensions

CUMMINS

Moat: Service network and lifecycle evidence

An extensive global service and distributor network reaches the remote locations telecom sites occupy, which matters enormously to an energy service company carrying uptime obligations. Documented fuel consumption and maintenance interval data across a very large installed base gives the lifecycle evidence that this buyer now demands. Emission certification across every major standard opens markets that smaller manufacturers cannot enter.
CUMMINS

Risk: Exposure to small rating decline

A meaningful share of telecom volume sits in ratings that solar hybridisation is steadily removing from service, and no commercial response recovers a site that no longer needs an engine. Moving up the rating range brings the company against general industrial competitors rather than telecom specialists. Aftertreatment complexity has also raised warranty and field support cost on remote site products.
CATERPILLAR

Moat: Data centre specification position

Long-established position in data centre standby generation transfers directly to the operator data centres and edge facilities that now carry this market's growth, where procurement follows data centre practice rather than telecom purchasing. Dealer organisations provide commissioning, load bank testing and documented maintenance histories. The upper rating classes are where the company is strongest and demand is moving.
CATERPILLAR

Risk: Limited small rating relevance

The company holds little position in the small ratings that still constitute much of the African and South Asian tower installed base, which limits access to the replacement demand that base generates. Pricing at the upper end faces competition from manufacturers with lower cost structures moving upward. Dealer-led selling is expensive where energy service companies buy centrally rather than locally.

Players Tracked

Prominent Players

Cummins
Caterpillar
Kohler Energy
Mahindra Powerol
Kirloskar Oil Engines

Other Key Players

Himoinsa
Atlas Copco
Generac Power Systems
Yanmar
Denyo
Aksa Power Generation
Greaves Cotton
Ashok Leyland
Jubaili Bros
Pramac
Weichai Power
Guangxi Yuchai Machinery
Sudhir Power
Baudouin
Doosan Bobcat Portable Power

Recent Developments

APRIL 2025

African tower company signs multi-country managed energy services agreement

A tower infrastructure company signed a managed energy services agreement covering several thousand sites across multiple African markets, a service agreement rather than any joint venture or acquisition. Fuel security, uptime guarantees and hybridisation targets were reported as the principal contracted terms. Equipment ownership transferred with it.
Signal: The buyer of a telecom generator is now an energy service company rather than any telecommunications operator.
JULY 2024

India's CPCB IV+ emission standards take effect for generating sets

Revised Indian emission standards for generating sets came into force, requiring aftertreatment on rating classes that had previously used bare engines. Compliance raised equipment prices materially on the small and medium ratings that telecom infrastructure depends on across the country. Several smaller manufacturers left the market rather than fund certification.
Signal: Regulation lifted revenue in this market while simultaneously reducing the number of manufacturers able to supply it.
FEBRUARY 2025

Manufacturer expands Indian production of compliant generating sets

A generator manufacturer commissioned additional Indian assembly and testing capacity for emission-compliant rating classes, an organic capacity expansion rather than any acquisition. Network densification and operator data centre construction were cited as the demand drivers behind the investment. Small rating capacity was deliberately not expanded alongside it.
Signal: Capacity is being added in the middle rating classes precisely as the smallest ones lose volume to solar.

Engines, Alternators And Aftertreatment

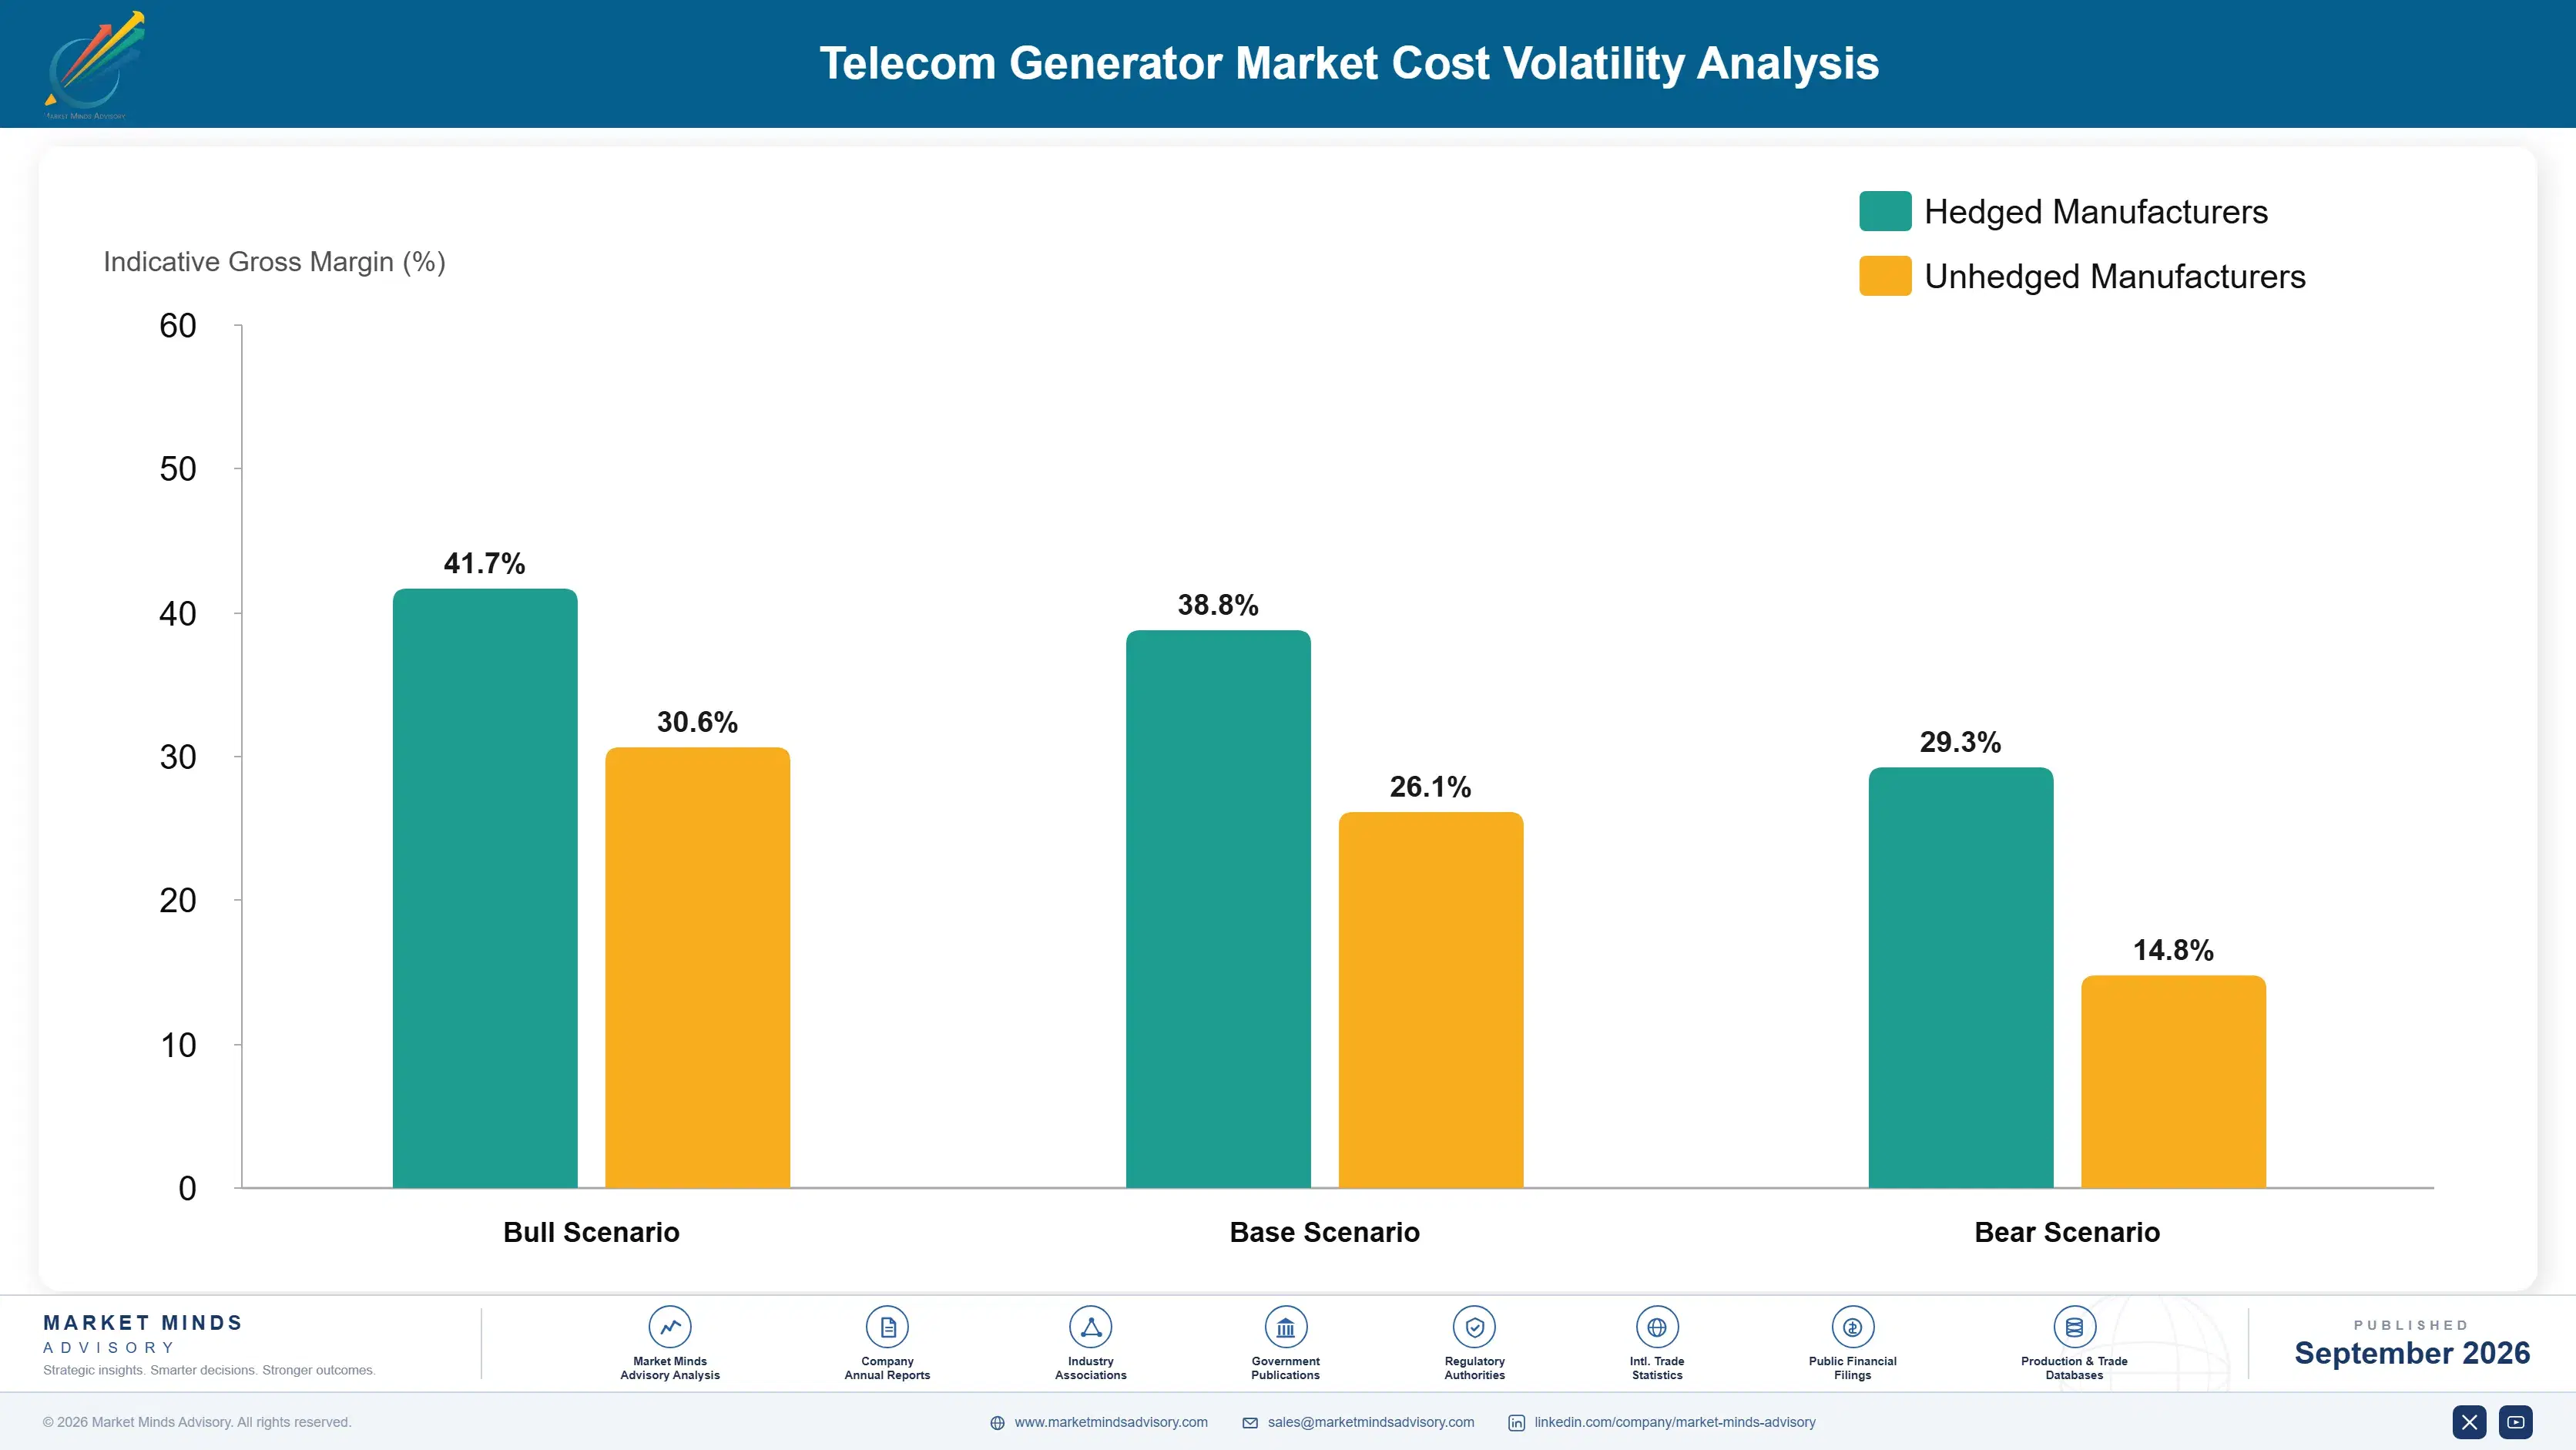
Engine and castings account for roughly 41% of manufactured cost, the alternator with its copper winding around 17%, aftertreatment systems between 9 and 15% depending on emission tier, and enclosure, control and assembly the balance. Aftertreatment depends on platinum group metals for catalyst loading, whose supply concentration in South Africa and Russia is documented in USGS commodity reporting each year.
Palladium and platinum pricing moved sharply through the 2021 to 2023 period, and copper rose from roughly USD 6,000 per tonne to above USD 10,000 across four years. Manufacturers who had priced multi-year telecom supply agreements before those movements absorbed the difference, and several disclosed margin pressure in results covering the window. Emission tier transitions compounded the effect by adding catalyst content exactly as catalyst metals became expensive.

The disadvantage mechanism is emission tier exposure combined with contract structure. A manufacturer selling into the newest emission tier carries the highest catalyst content and metals exposure; one selling into unregulated markets carries almost none. Long telecom supply agreements at fixed pricing turn that exposure into absorbed cost. Manufacturers with index-linked agreements and metals hedging pass it through instead, and the gap between the two is substantial.
telecom-generator-market-cost-volatility-analysis-1788412471242

Index-linked pricing on multi-year telecom agreements

Tying long supply agreement pricing to published copper and platinum group metal indices moves material movement back to the buyer, who in the case of an energy service company is already modelling commodity exposure across fuel anyway. Buyers accept it more readily than manufacturers expect, because a fixed multi-year price carries a visible risk premium.

Catalyst loading optimisation across emission tiers

Precious metal loading in aftertreatment can be reduced considerably through catalyst formulation and substrate design without losing compliance margin, and the engineering pays back quickly at current metals pricing. It requires specialist capability that most generator assemblers buy in rather than hold, which is why so few pursue it seriously. Metals pricing makes it pay quickly.

Alternator sourcing across multiple qualified suppliers

Qualifying alternators from several manufacturers rather than one gives negotiating position on a component representing nearly a fifth of cost, and it protects delivery when a supplier tightens. Qualification effort is modest compared with engine work, yet many manufacturers maintain a single source purely through inertia and long habit. Delivery security improves alongside the pricing position.

Portfolio Architecture for Margin Defence

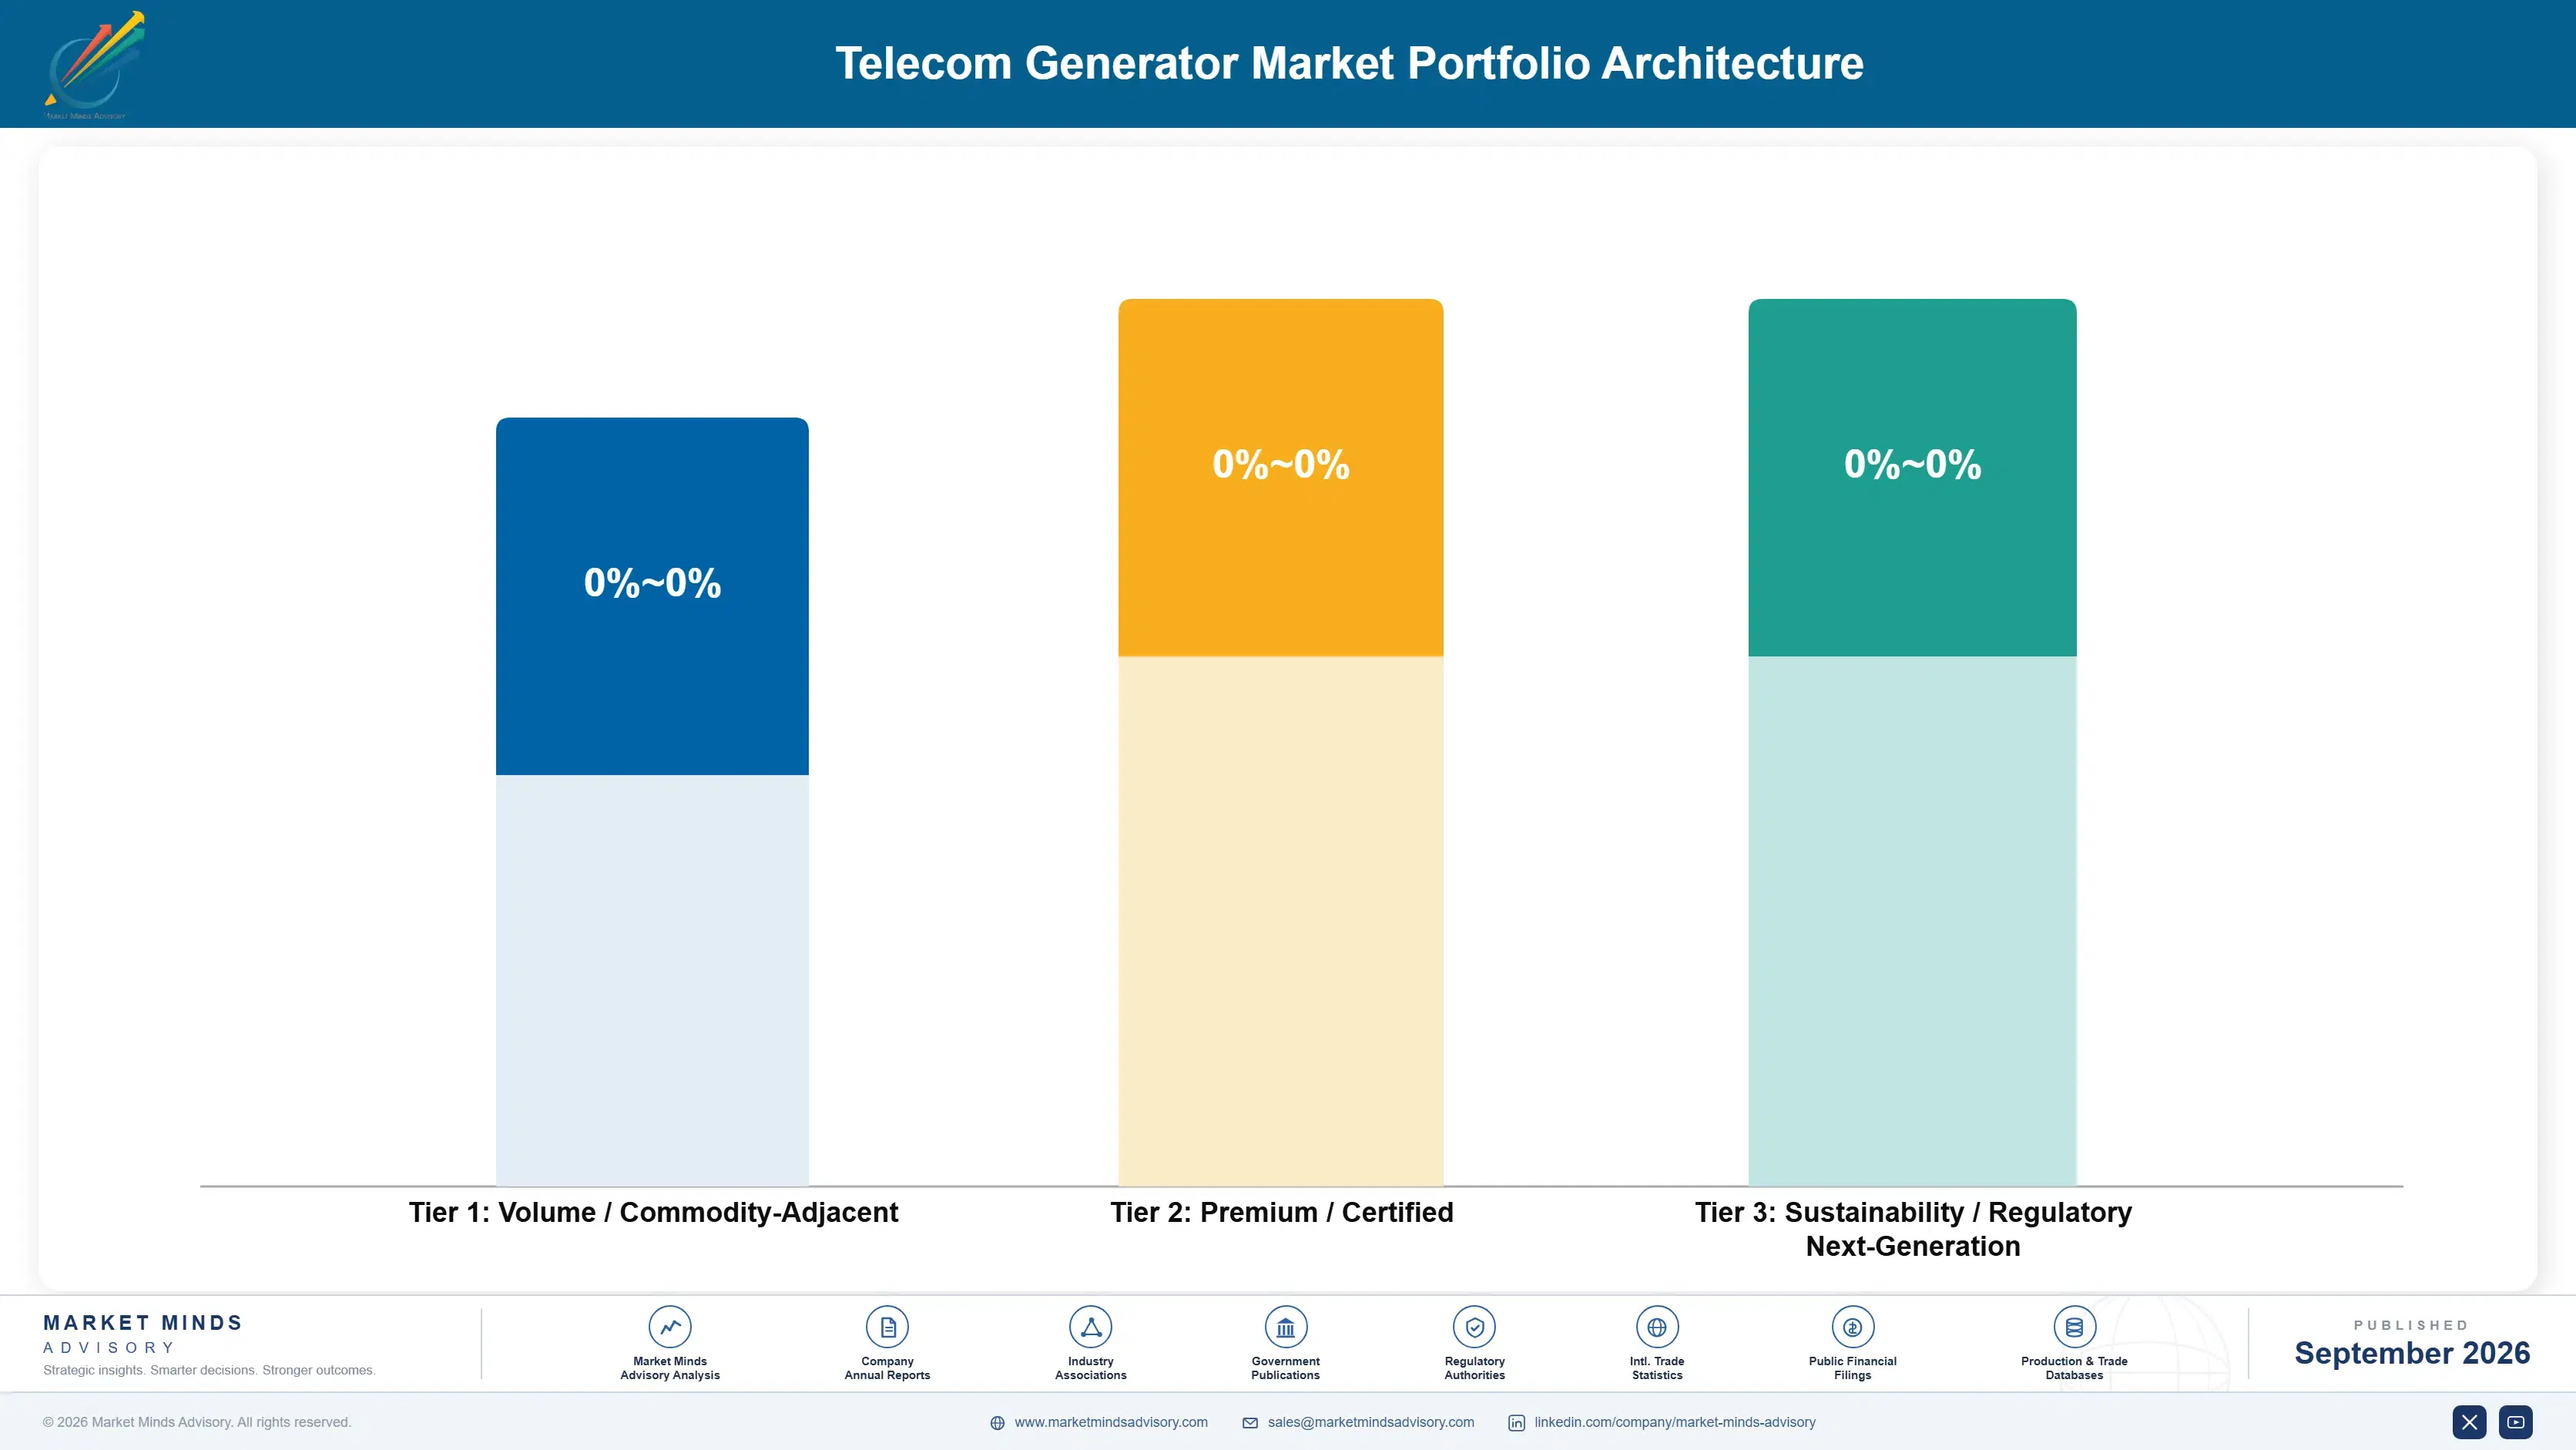
Margin separates by rating class and by who is buying. Small tower sets sold in unregulated markets compete against Chinese and Indian product on capital cost alone, and margin reflects that. Middle and upper class sets sold to energy service companies and operator data centres are evaluated on lifecycle cost and documented reliability, where a manufacturer prices against what the equipment saves rather than what a competitor quotes.
The volume against premium tension is resolving itself, uncomfortably. The volume tier is shrinking under solar hybridisation whether manufacturers like it or not, so the question is not whether to abandon it but how quickly to redeploy the capacity and the sales organisation. Manufacturers funding the move up the rating range from declining small-set cash flow are timing it correctly. Those still investing in tower-class product development are funding a retreat.

High-value pools sit where evaluation is rigorous: operator data centre generation, edge node supply and energy service company framework awards. Each requires documented lifecycle evidence, emission certification and service reach that a low-cost assembler cannot assemble at all. These pools are smaller in units than the tower base ever was and carry considerably more of the industry's profit.

Volume / Commodity-Adjacent

Small tower sets below 25 kVA sold on capital price into unregulated or lightly regulated markets. Margin depends on component sourcing and assembly scale, and the whole tier is contracting under solar hybridisation regardless of commercial effort.
Gross Margin: 12 to 18%

Premium / Certified

Middle rating sets sold to energy service companies on documented fuel consumption and service interval. The 7 point range reflects how much lifecycle evidence a manufacturer can actually produce and whether service reach supports the uptime commitment.
Gross Margin: 21 to 28%

Sustainability / Regulatory / Next-Generation

Operator data centre and edge node generation at the newest emission tiers, with redundancy, load bank testing and formal commissioning. The 10 point range reflects how differently data centre and telecom procurement price the same equipment.
Gross Margin: 26 to 36%
telecom-generator-market-portfolio-architecture-1788412471745

High-value Sub-segments and Strategic Watch-out

Edge Node And Data Centre Generation

Highest value pool and the destination of this market's growth, with ratings roughly ten times tower sets and procurement following data centre practice. Established data centre suppliers hold advantages that telecom specialists find difficult to overcome. This is where the whole of this market is now heading.
Gross Margin: 28 to 36%

Energy Service Company Frameworks

Covers 64% of tower sites and rewards fuel consumption and service interval over capital price for the first time in this market's history. Requires quantified lifecycle evidence that most sales organisations have never been asked to produce. Renewal turns on demonstrated uptime rather than price.
Gross Margin: 22 to 28%

Small Tower Backup Sets

The historic volume core, now contracting steadily as solar hybridisation reduces running hours and extends replacement intervals across Africa and South Asia. Cash generative today and permanently finished as a growth position. Manufacturers concentrated here will not recover the volume through commercial effort of any kind.
Gross Margin: 12 to 18%

Unregulated Market Bare Engines

Non-compliant machines sold where emission standards are absent or unenforced, competing purely on delivered price against Chinese and Indian product. Standards are spreading, and any capacity committed here has a short earning window remaining. The regulatory direction is entirely one way, and it is not reversing anywhere.
Gross Margin: 9 to 15%

Who Signs The Site Power Order

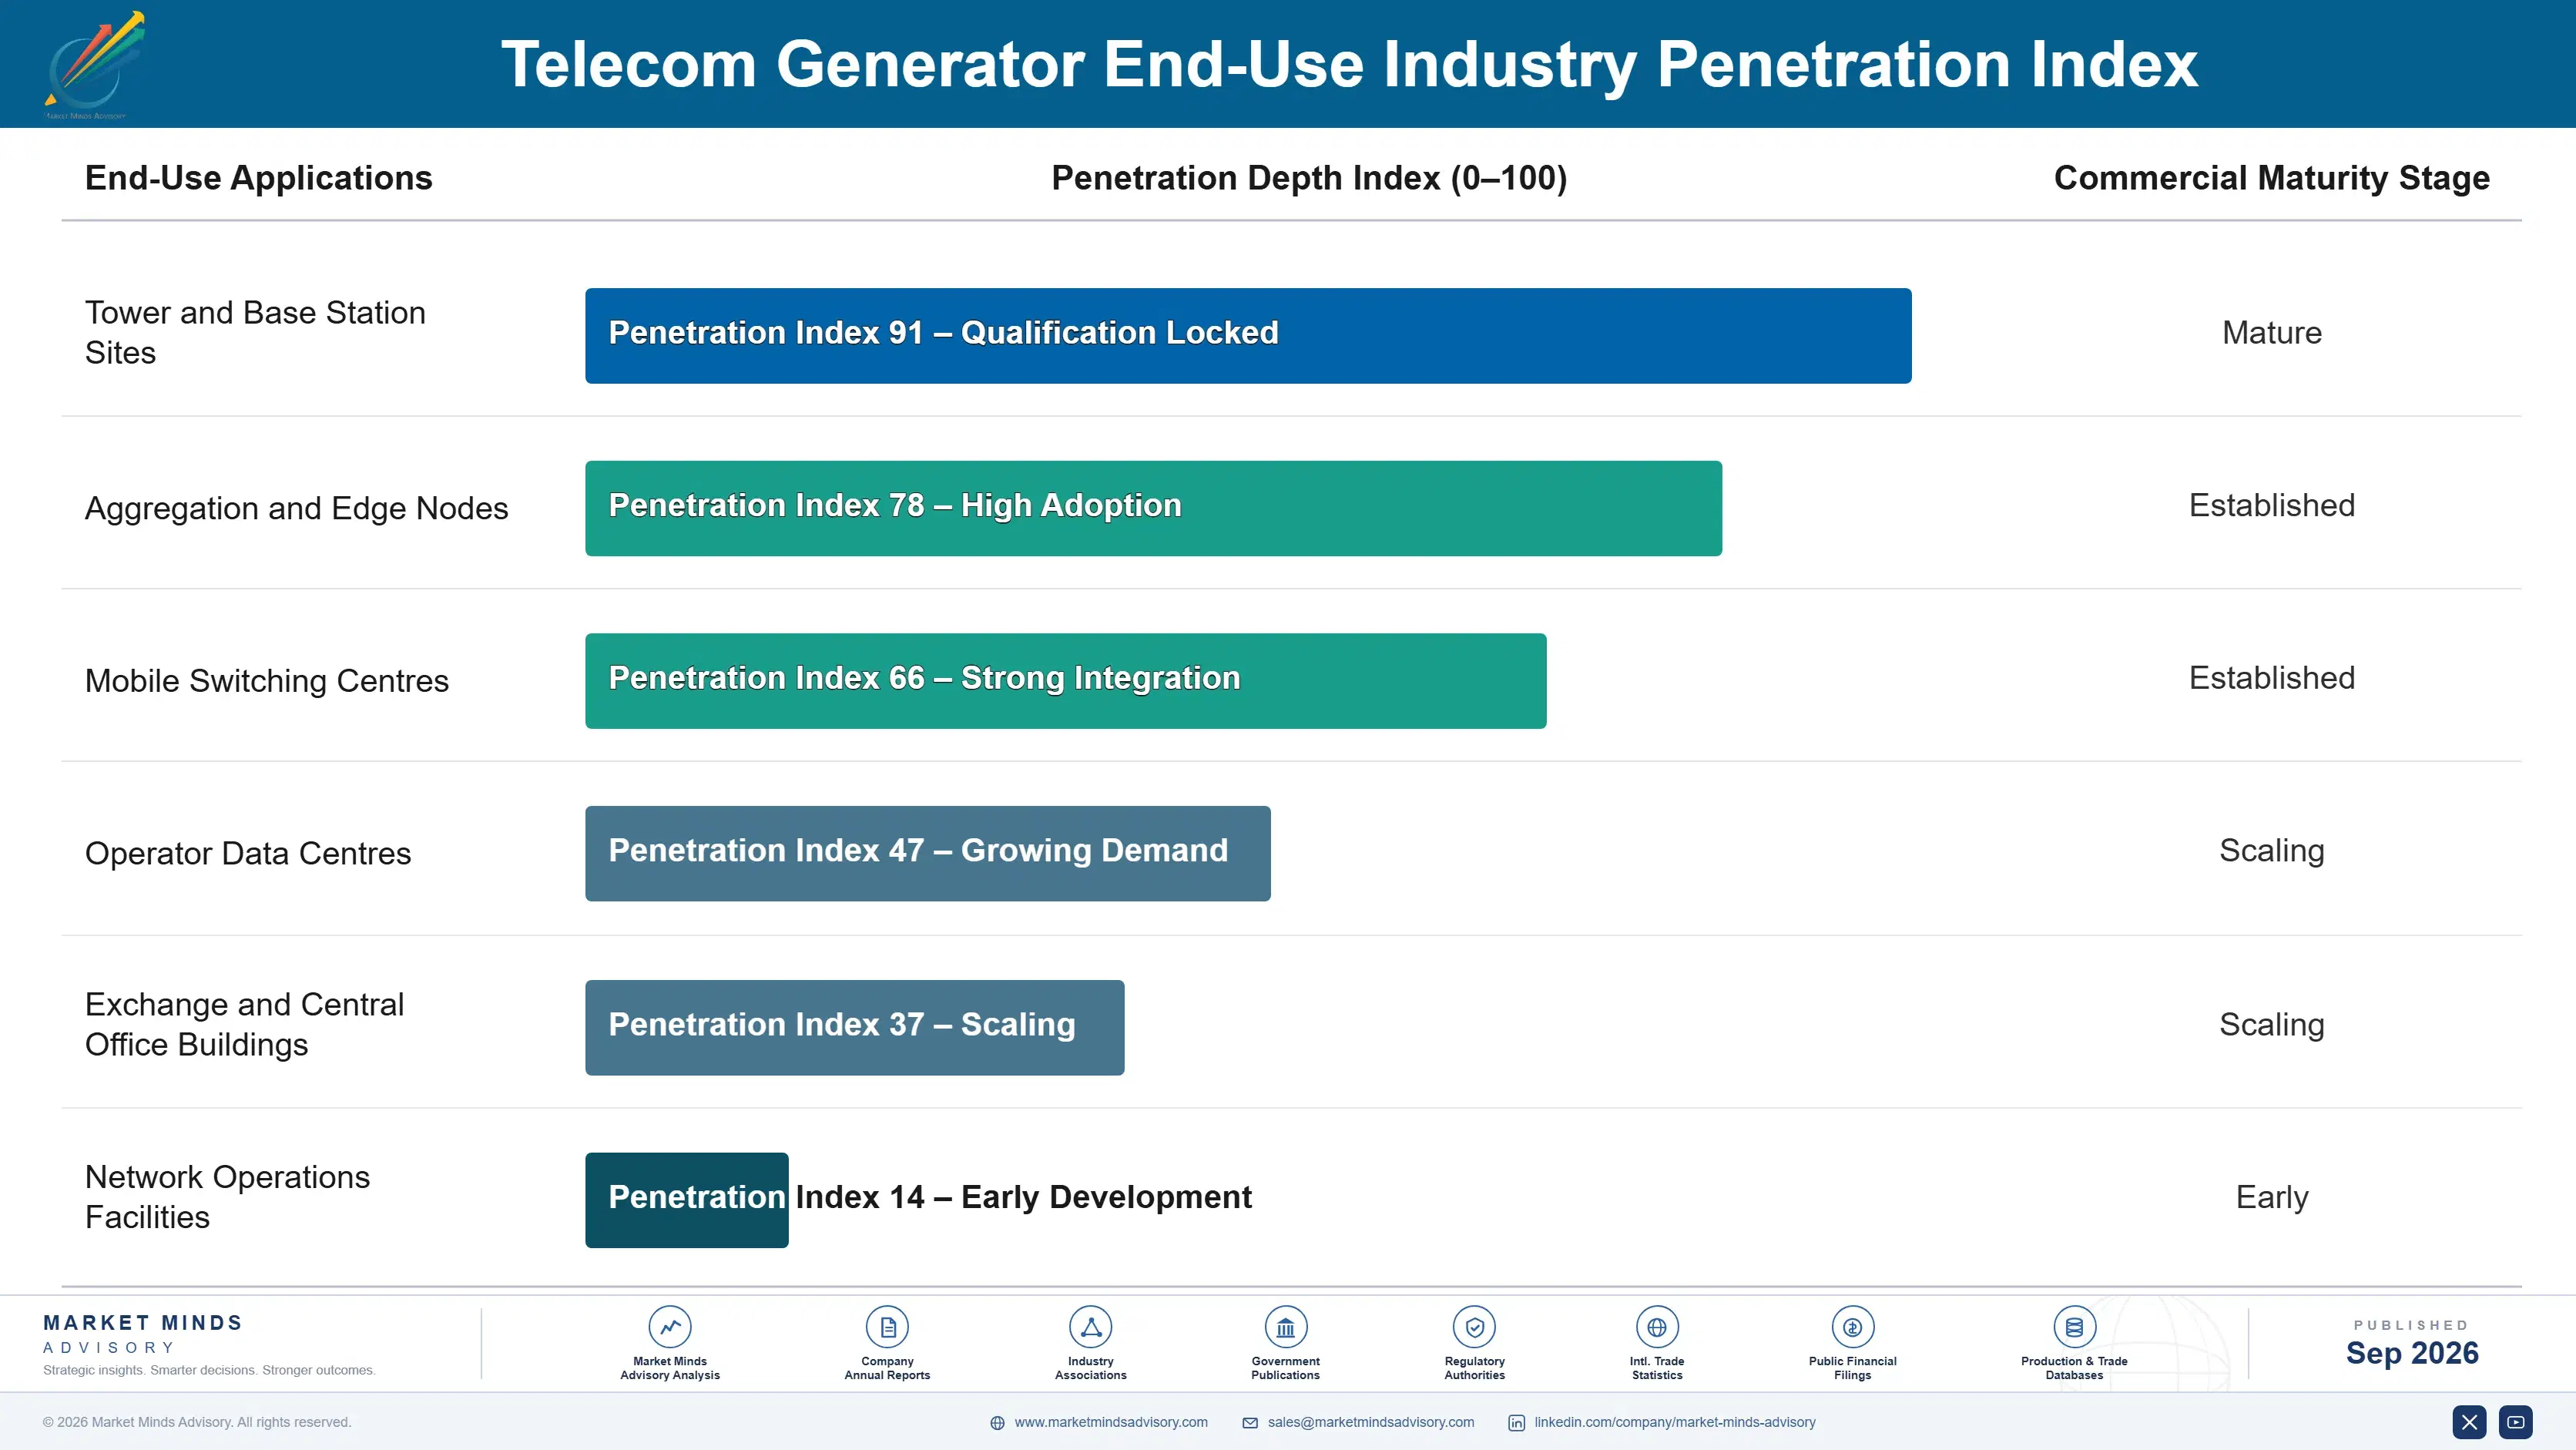
Annuity economics come from the managed energy service contract rather than from any replacement cycle. A service company signing a ten year agreement across thousands of sites commits equipment, spares and service in one decision, and the manufacturer holding that agreement supplies the whole estate without competing site by site. Renewal turns on demonstrated uptime and fuel performance rather than on price, which rewards manufacturers who can evidence both.
Adoption depth varies sharply by network tier. Energy service companies specify deeply, covering fuel curves, service intervals, telemetry and spare holdings, and switching supplier mid-contract is genuinely disruptive. Operator data centre teams specify to data centre standards with redundancy and commissioning requirements that telecom purchasing never involved. Smaller regional tower owners still buy transactionally on price and treat machines as interchangeable.

The buyer profile has changed completely. Site power was once specified by telecom network engineers who treated the generator as an accessory to the radio equipment. It now sits with energy service company operations directors modelling fuel and maintenance across a contract term, and with data centre facilities managers applying entirely different standards. Both ask for quantified evidence, which the telecom accessory sale never once required.
telecom-generator-market-end-use-penetration-index-1788412472266

Where Manufacturers Should Compete

These are among the four positions where our research anticipates prominent divergence between winners and laggards over the coming forecast period. Each is grounded in the demand model, the regulatory perimeter, and the announced capacity pipeline.
01 / RATING MIGRATION RESPONSE

Move up the range before small volumes finish declining

Edge and aggregation sites specify generators roughly ten times the rating of the tower sets that solar hybridisation is steadily removing, and the middle classes now grow at 8.7% against a market growing 5.8%. Manufacturers whose telecom position sits below 25 kVA are defending a base that will not recover whatever commercial effort is applied to it. Funding the move upward from declining small-set cash flow is the only sequence that works, and the window for it is not indefinite.
02 / SERVICE CHANNEL REALIGNMENT

Sell lifecycle cost to energy service companies

Around 64% of tower sites now sit under managed energy contracts where the service company keeps whatever it does not spend on fuel and maintenance across the whole of a ten year term. That buyer is largely indifferent to purchase price and evaluates consumption and service interval instead, which entirely inverts the logic of a market historically won on capital cost. Manufacturers with real efficiency advantages are rewarded for the first time, provided they can evidence those advantages quantitatively and credibly.
03 / FUEL SECURITY ENGINEERING

Treat theft as a design requirement, not a customer problem

Roughly 19% of delivered fuel never reaches the engine in the worst affected markets, which exceeds maintenance and efficiency savings combined by a considerably wider margin than anyone expects. Sealed tanks, level sensing and telemetry reporting consumption against generated kilowatt hours address it directly and matter more to the buyer far more than anything in the engine specification does. Very few manufacturers have engineered against it, which leaves the position wide open to whoever decides to take it seriously first.
04 / EMISSION CERTIFICATION TIMING

Certify early and design aftertreatment for remote service

Emission standards have raised small rating prices by roughly 27% and pushed several smaller manufacturers out of the market altogether, which lifted market revenue while considerably thinning the field of qualified suppliers. Certification takes several years and considerable capital, so early commitment buys market access that competitors cannot simply purchase later on. The considerably harder problem is making aftertreatment serviceable by technicians without diagnostic equipment in genuinely remote locations, and almost nobody in this industry has solved that properly yet.

Engagement Snapshot From the Field

A live engagement with an industry participant carrying material or product regulatory and market exposure ahead of a defining policy shift, showing how our research translates into a defensible multi-year portfolio strategy.
MARKET MINDS ADVISORY · CLIENT ENGAGEMENT SUMMARY
Telecom Generator Producer Strategic Portfolio Review and Transition Roadmap 2026·Investment Scenario on Telecom Generator Exposure Evaluation 2025-26
CLIENT PROFILE
An energy services company operating site power across several thousand telecom towers in four African markets under managed service contracts, with annual revenue reported at approximately USD 320 million (client-reported, unverified by MMA). Generators were procured on capital price from three suppliers, and fuel was purchased and delivered by the company itself under the contracted fee arrangement.
STRATEGIC CHALLENGE
Contracted fees were fixed while fuel and maintenance costs kept rising, and margin had compressed across two consecutive years without management being able to attribute the loss precisely. Fuel reconciliation showed enormous unexplained variance between sites. A proposed generator replacement programme could not be justified without knowing where the cost was actually going.
MMA APPROACH
MMA reconciled delivered fuel against generated kilowatt hours at site level across the four markets, separated theft from consumption inefficiency, and modelled generator replacement against fuel curves and service intervals rather than capital price. Supplier lifecycle evidence was tested against the client's own operating data rather than accepted as quoted.
KEY FINDINGS
  1. Roughly 19% of delivered fuel never reached an engine, and the variance concentrated at sites with unsealed tanks and no level telemetry rather than at sites with older generators.
  2. Fuel curve differences between the three suppliers were considerably larger than quoted, and the cheapest machine on capital price was the most expensive across a ten year contract term.
  3. Service interval extension from 250 to 500 hours on the better engines would remove a meaningful share of site visits, which are the second largest operating cost after fuel itself.
  4. Solar hybridisation had already cut running hours enough that generator sizing at many sites was substantially larger than the remaining duty actually required.
CLIENT PROFILE
An energy services company operating site power across several thousand telecom towers in four African markets under managed service contracts, with annual revenue reported at approximately USD 320 million (client-reported, unverified by MMA). Generators were procured on capital price from three suppliers, and fuel was purchased and delivered by the company itself under the contracted fee arrangement.
STRATEGIC CHALLENGE
Contracted fees were fixed while fuel and maintenance costs kept rising, and margin had compressed across two consecutive years without management being able to attribute the loss precisely. Fuel reconciliation showed enormous unexplained variance between sites. A proposed generator replacement programme could not be justified without knowing where the cost was actually going.
MMA APPROACH
MMA reconciled delivered fuel against generated kilowatt hours at site level across the four markets, separated theft from consumption inefficiency, and modelled generator replacement against fuel curves and service intervals rather than capital price. Supplier lifecycle evidence was tested against the client's own operating data rather than accepted as quoted.
KEY FINDINGS
  1. Roughly 19% of delivered fuel never reached an engine, and the variance concentrated at sites with unsealed tanks and no level telemetry rather than at sites with older generators.
  2. Fuel curve differences between the three suppliers were considerably larger than quoted, and the cheapest machine on capital price was the most expensive across a ten year contract term.
  3. Service interval extension from 250 to 500 hours on the better engines would remove a meaningful share of site visits, which are the second largest operating cost after fuel itself.
  4. Solar hybridisation had already cut running hours enough that generator sizing at many sites was substantially larger than the remaining duty actually required.
RECOMMENDED STRATEGY
Phase 1: Phase one: retrofit sealed tanks and fuel level telemetry across the highest variance sites before replacing any generating equipment at all. Phase 2: Phase two: reprocure generators on modelled lifecycle cost using the company's own fuel data rather than on supplier quoted consumption figures. Phase 3: Phase three: resize generating capacity at hybridised sites downward to match remaining duty and redeploy the displaced machines to sites elsewhere.
OUTCOME
Within ten months the client had retrofitted telemetry across the worst affected sites, reduced unreconciled fuel loss by 41%, and reported site operating margin up 6.3 percentage points across the four markets (client-reported, unverified by MMA). Generator reprocurement on lifecycle terms is proceeding through the coming year.

Frequently Asked Questions

Foundational context covering the market sizes, CAGR, scope, country, region and competition that inform every finding below. This section is provided to cover basics and most often pre-purchase conversations, answered from the MMA Primary Research Dataset.

What is the current size of the Telecom Generator Market?

The market was valued at USD 2.9 billion in 2025 and reaches USD 3.07 billion in 2026. Unit counts are falling at tower level while average ratings rise sharply.

How large will the Telecom Generator Market be by 2036?

MMA forecasts USD 5.40 billion by 2036, an increase of USD 2.33 billion over the 2026 base. That represents an expansion multiple of 1.76 times.

What is the CAGR for the Telecom Generator Market 2026 to 2036?

The base case CAGR is 5.8%, with a bull case of 7.0% and a bear case of 4.6%. The historical rate between 2020 and 2025 was 4.6%.

Which segment is growing fastest?

Sets rated 60 to 150 kVA grow at 8.7%, half again the market rate of 5.8%. They serve edge computing and aggregation sites that barely existed five years ago.

Who are the major companies in the Telecom Generator Market?

Cummins, Caterpillar, Kohler Energy, Mahindra Powerol and Kirloskar Oil Engines lead on measured shipment volume. Together they account for roughly 51% of the market today.

Which country is growing fastest?

India grows fastest at 9.4%, driven by network densification creating new aggregation sites and by operator data centre construction across all the major metropolitan markets.

Report Segmentation Architecture

The full report scope spans multiple orthogonal segmentation dimensions, with cross-tabulated demand data provided for each dimension pair. Coverage extends further to regional breakdowns, trend trajectories, and the competitive detail needed to support segment-level decision-making.

By Rated Output Class

  • Below 10 kVA
  • 10 to 25 kVA
  • 25 to 60 kVA
  • 60 to 150 kVA
  • 150 to 500 kVA
  • Above 500 kVA

By End-Use Industry

  • Tower and Base Station Sites
  • Aggregation and Edge Nodes
  • Mobile Switching Centres
  • Operator Data Centres
  • Exchange and Central Office Buildings
  • Network Operations Facilities

By Fuel and Procurement Model

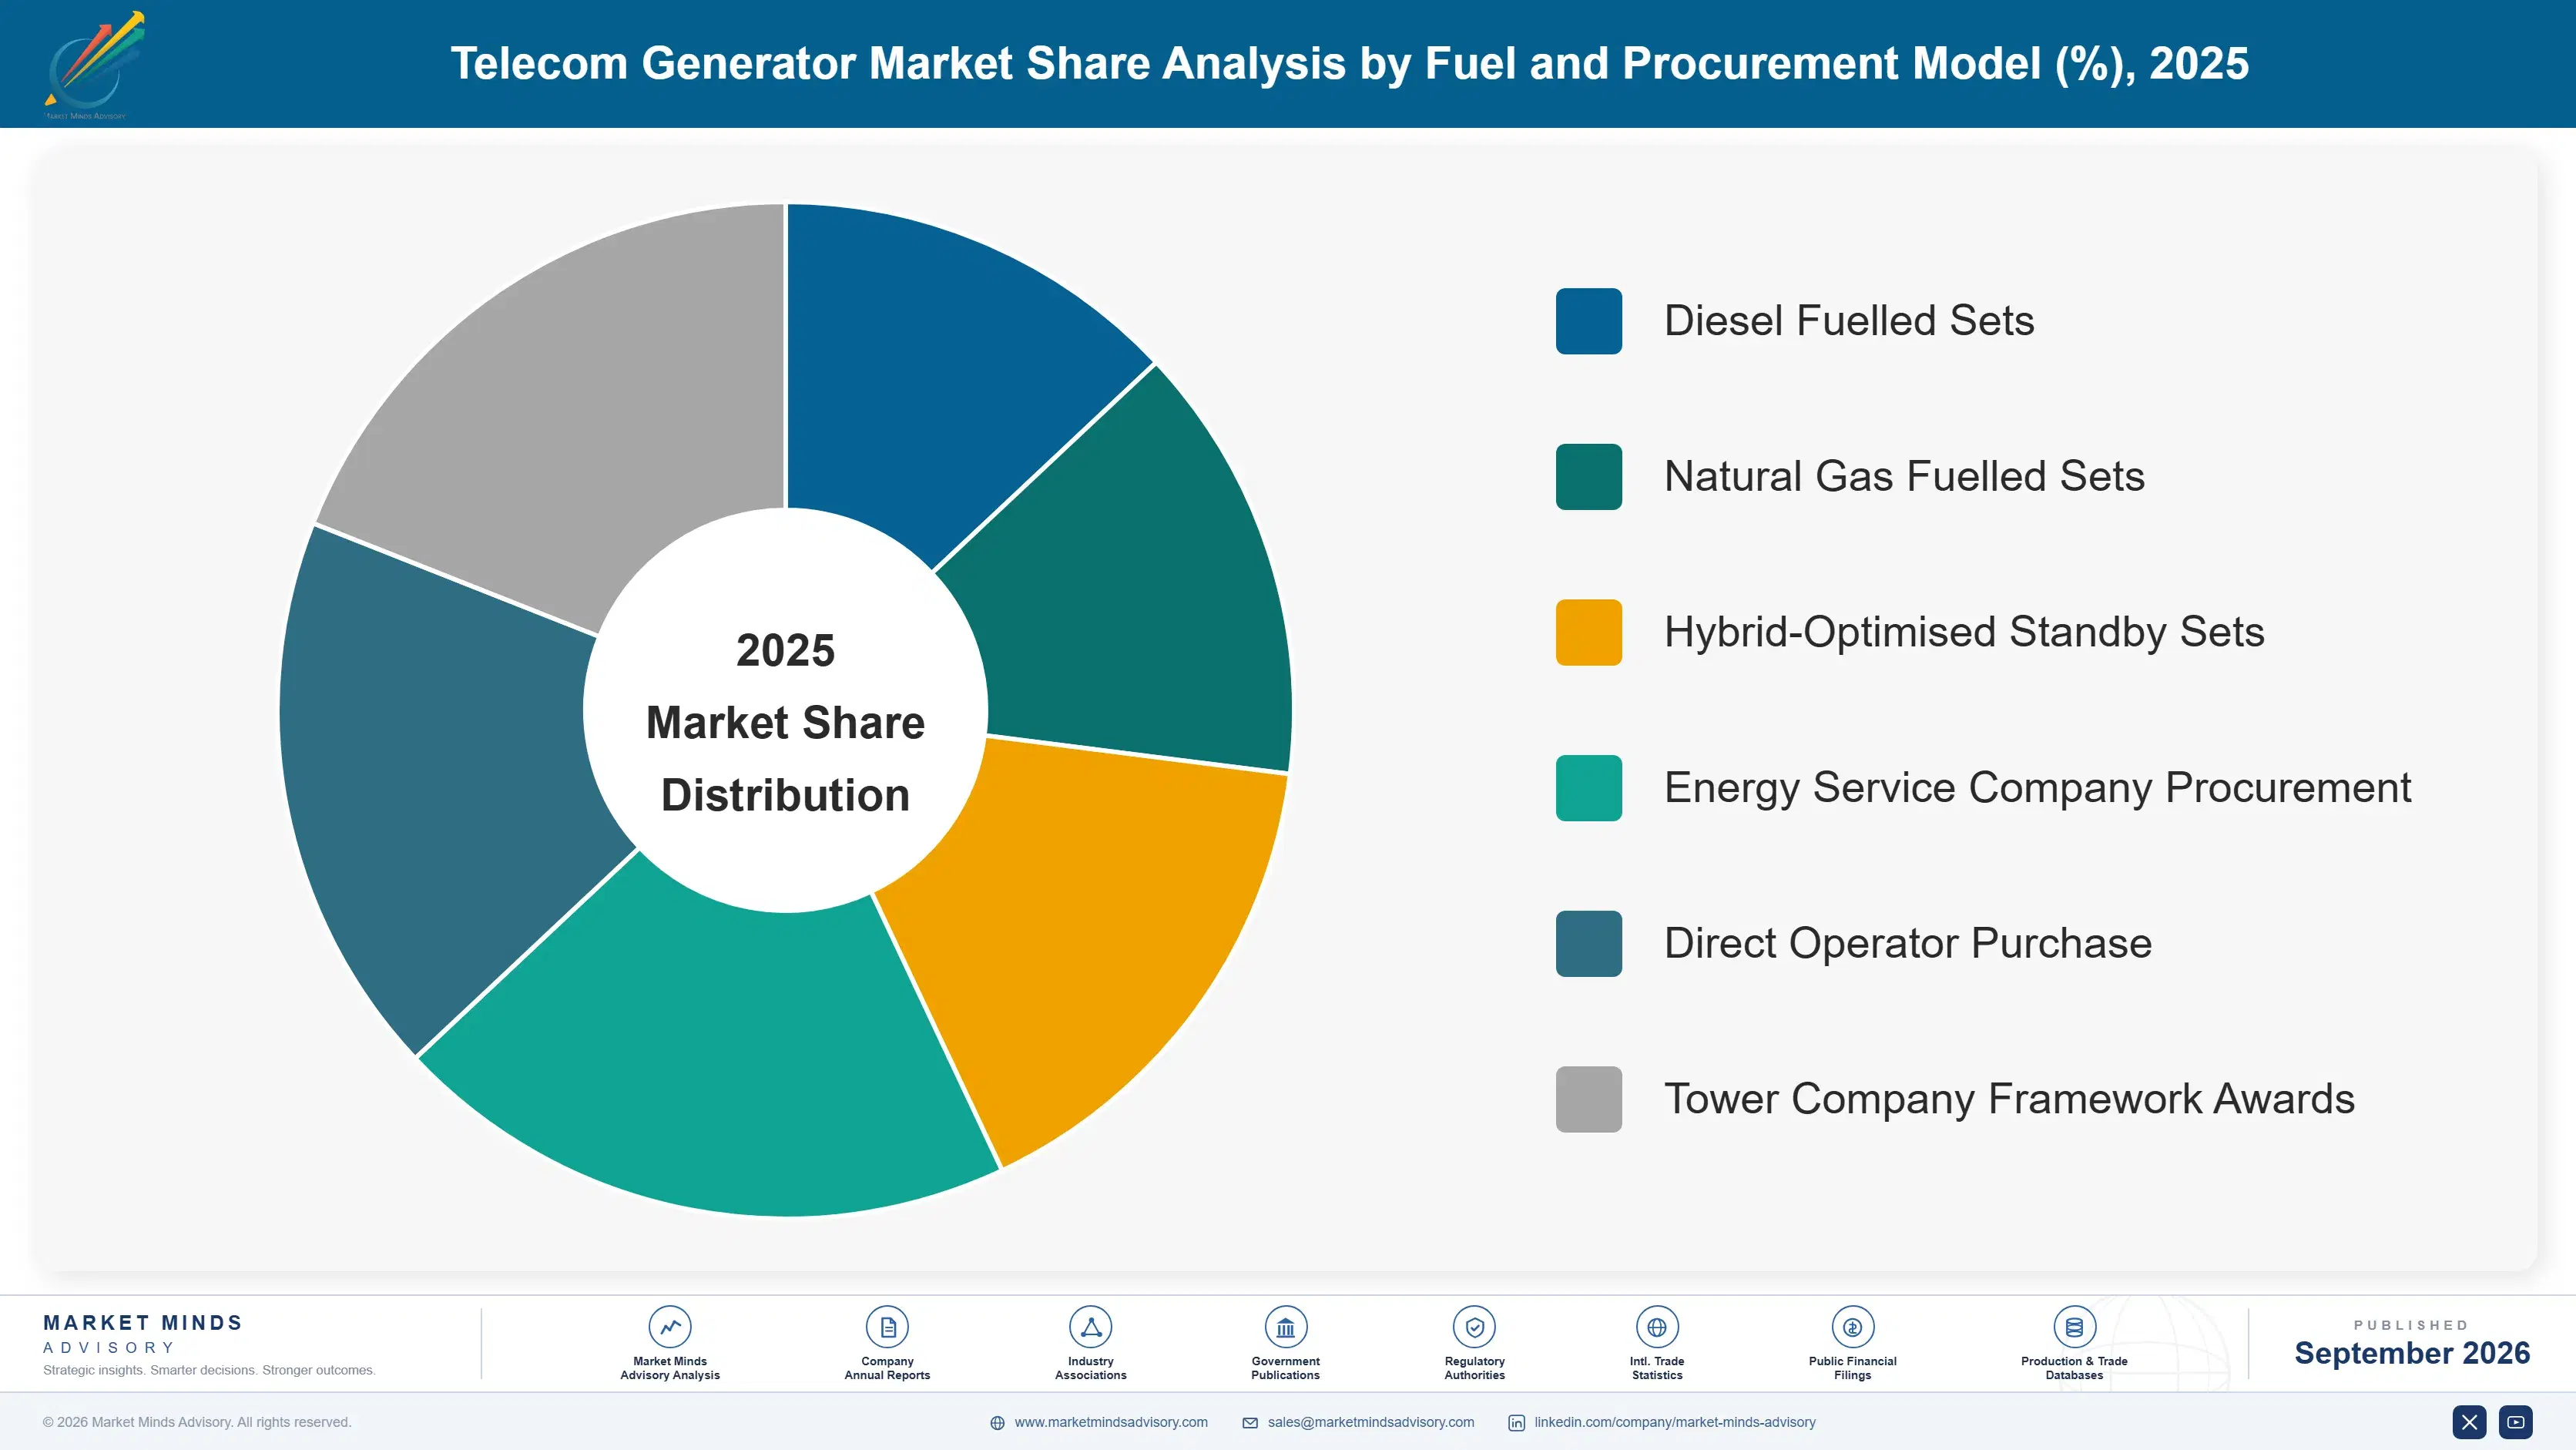
  • Diesel Fuelled Sets
  • Natural Gas Fuelled Sets
  • Hybrid-Optimised Standby Sets
  • Energy Service Company Procurement
  • Direct Operator Purchase
  • Tower Company Framework Awards

By Region

  • Middle East and Africa
  • South Asia and Pacific
  • East Asia
  • North America
  • Western Europe
  • Latin America
  • Eastern Europe

Scope, Methodology, and Coverage

Every figure in this report is reproducible from documented input assumptions. The scope below maps the historical period, the forecast horizon, the segmentation dimensions, and the countries covered, alongside the underlying primary and qualitative methodology.
Historical Period
2020 to 2025
Forecast Period
2026 to 2036
Base Year
2025 (USD billions; MMA Primary Research Dataset, September 2026)
Market Definition
The telecom generator market covers diesel and gaseous fuel generating sets supplied for telecommunications infrastructure, spanning tower and base station backup, aggregation and edge computing nodes, mobile switching centres, exchange buildings and network operations facilities, across rating classes from below 10 kVA to above 500 kVA. Sizing is measured at manufacturer revenue. Fuel supply, site batteries, solar hybrid equipment, uninterruptible power supplies, rectifiers and standalone operations and maintenance services are excluded.
Quantitative Units
USD billions at manufacturer revenue, with supporting unit shipments and installed capacity in megavolt-amperes by region
Segmentation Dimensions
Rated output class, end-use industry, fuel and procurement model, region
Regions Covered
Middle East and Africa, South Asia and Pacific, East Asia, North America, Western Europe, Latin America, Eastern Europe
Countries Covered
Nigeria, Kenya, Ghana, South Africa, Egypt, Saudi Arabia, India, Indonesia, Philippines, Bangladesh, Pakistan, China, Japan, United States, Brazil, Mexico, Germany, Poland
Key Companies Profiled
Cummins, Caterpillar, Kohler Energy, Mahindra Powerol, Kirloskar Oil Engines, Himoinsa, Atlas Copco, Generac Power Systems, Yanmar, Denyo, Aksa Power Generation, Greaves Cotton, Ashok Leyland, Jubaili Bros, Pramac, Weichai Power, Guangxi Yuchai Machinery, Sudhir Power, Baudouin, Doosan Bobcat Portable Power
Quantitative Methodology
Primary survey, n=3,800 respondents, Q4 2025, six countries; demand-side model with trade association cross-validation
Qualitative Methodology
47 expert interviews, Q4 2025; applied to validate demand model assumptions, identify emerging dynamics, and assess competitive positioning
Report Format
PDF and XLSX data workbook (Word format preview document)
Publisher
Market Minds Advisory
Report Code
MMA-2026-ENE-561
Published
September 2026
Contact
sales@marketmindsadvisory.com | www.marketmindsadvisory.com

Purchase the full Telecom Generator Market Report (2026 to 2036).

The full report separates unit volume from revenue by rating class throughout, which is the only way to see that this market is growing while its historic core contracts. It sizes six rating classes with individual growth rates, seven regions built from grid absence and network densification, and the managed energy service model that now decides most specifications. Competitive analysis covers twenty manufacturers on a consistent shipment volume basis, with lifecycle cost evidence and emission certification treated as the decisive variables. Input cost modelling breaks out engine, alternator and aftertreatment exposure by emission tier.
Six rating classes with individual growth rates
Unit volume separated from revenue throughout
Managed energy service contract penetration by market
Fuel theft loss quantified against delivered volumes
Twenty manufacturers on consistent shipment volume basis
Engine, alternator and catalyst cost exposure

Built For The People Who Decide

From boardroom strategy to bench-side execution, this report is read cover-to-cover by leaders shaping the next decade of their industry, turning demand scenarios, market dynamics and valuation benchmarks into decisions.
CXOs/ Presidents/ VPs/ Managers
M&A and Corporate Development
Strategy Teams and R&D Heads
Procurement and Product Directors
Regulatory and Compliance Leaders
Investor Relations and Equity Analysts