Market Minds Advisory
Telecom Equipment Market

Telecom Equipment Market: Telecom Equipment Market. Radio Access, Core Network, and Transmission Infrastructure

5G network densification and fiber broadband expansion are sustaining steady equipment replacement cycles as operators balance capacity upgrades against tightening capital expenditure budgets across most major global telecom markets industry-wide.

Lead Analyst

Published

September 2026

Make Smarter Decisions with Customized Research Insights

Request a free sample report and evaluate market opportunities, growth trends, and competitive dynamics relevant to your business needs.

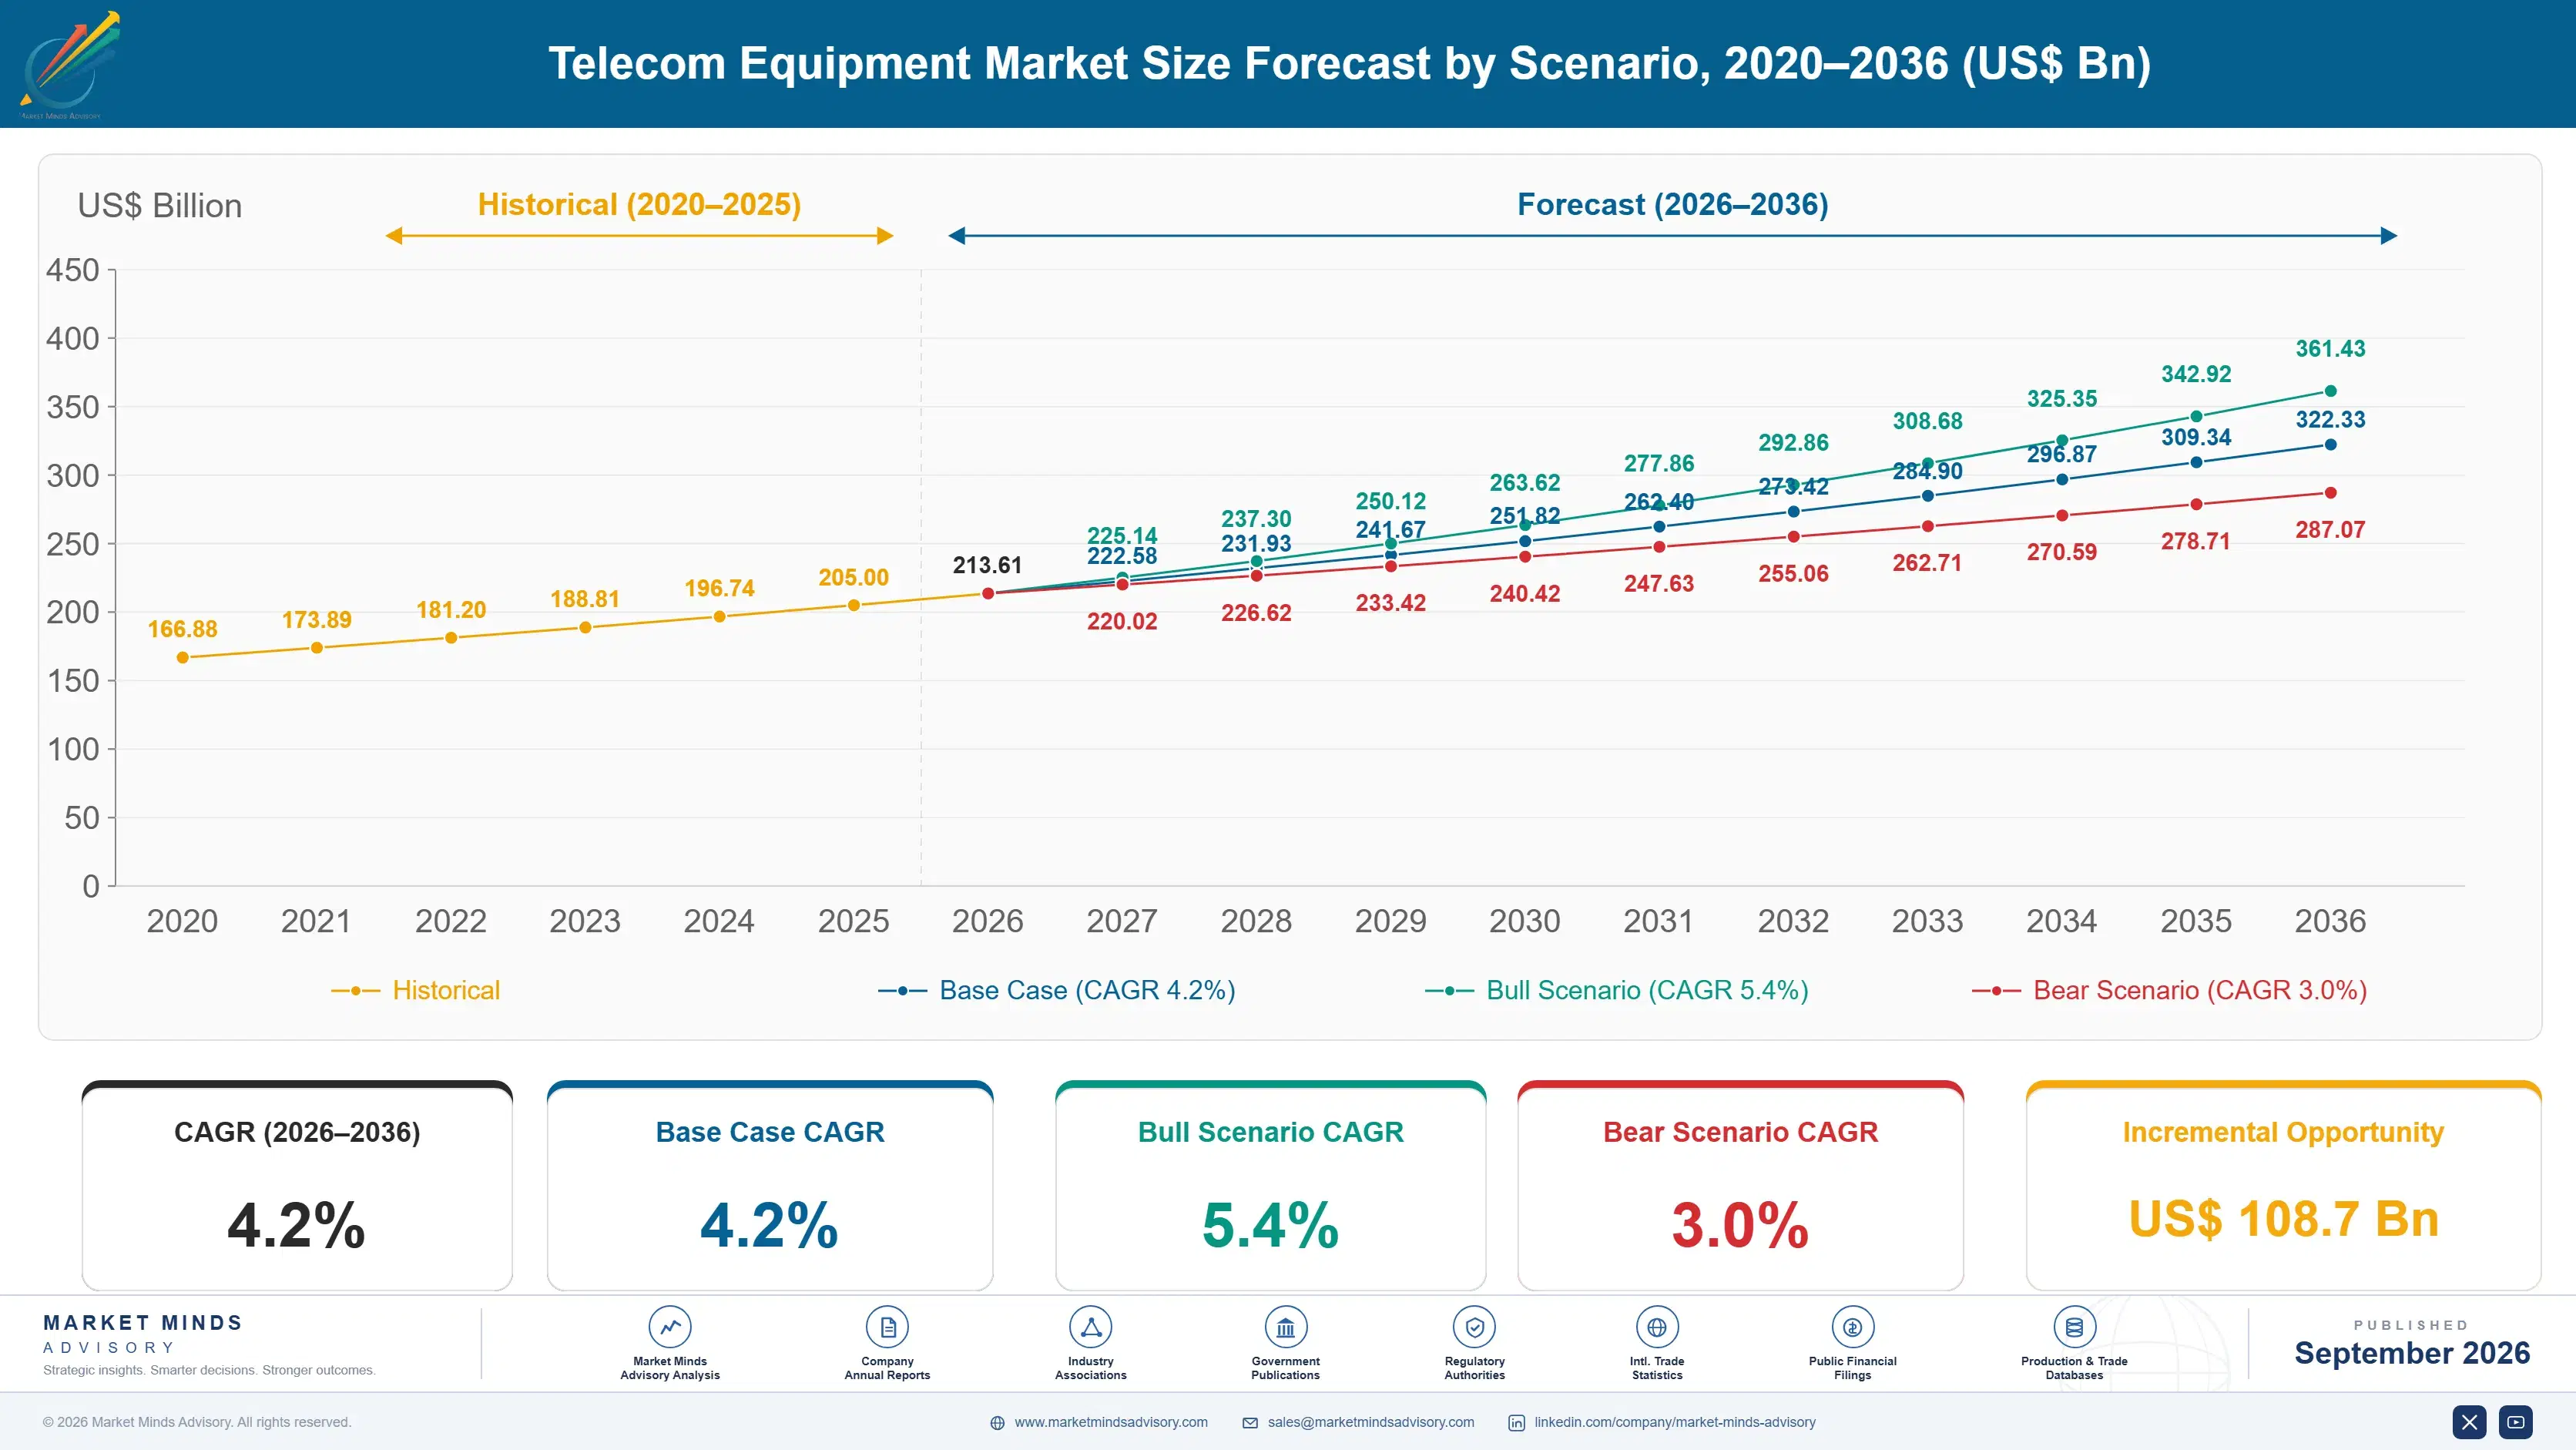
2025 MARKET VALUE$205.0BMarket Size 2025
2036 FORECAST VALUE$322.3BBase Case , 2026 to 2036
CAGR 2026 TO 20364.2 %Bull 5.4% / Bear 3.0%
INCREMENTAL OPPORTUNITY$108.7BNet 10- year value creation
EXPANSION MULTIPLE1.51x2036 value over 2026 base
Strategic Levers
M&A Pipeline
Regional Outlook
Country Rankings
Competitive Intelligence
Segmental Deep-dive
Call-Us : 91 93563 13602

Executive Snapshot and Market Trajectory.

5G network densification and fiber broadband expansion are sustaining steady equipment replacement cycles as operators balance capacity upgrades against tightening capital expenditure budgets across most major global telecom markets currently active worldwide. Operators now request quantified capacity return before approving broader network densification budget expansion across most large carrier deployments.
Radio access network equipment increasingly dominates new procurement decisions, since carriers prioritize densification investment over core network refresh cycles that already reached substantial completion across most developed markets in recent years. East Asia and North America together host the majority of global equipment procurement spending currently allocated to network infrastructure programs. Carriers increasingly treat equipment procurement as a multi-year capacity planning decision rather than a purely reactive infrastructure purchase.
Competitive dynamics favor established vendors with existing carrier certification relationships over newer standalone equipment entrants, since operator deployment cycles reward suppliers with proven multi-generation network reliability track records. Open RAN standardization efforts are reshaping near-term vendor selection priorities across most major carrier procurement programs globally. Suppliers investing early in Open RAN interoperability are positioned to capture disproportionate share as vendor diversification pressure continues expanding across most major carrier procurement programs and geographic markets globally.
Market Definition
The Telecom Equipment Market covers hardware infrastructure including radio access network, core network, transmission, and broadband access equipment deployed by telecommunications carriers and network operators worldwide. It excludes consumer devices, handsets, and standalone network management software platforms.
Base Year Value
$205.0B in 2025 (MMA Primary Research Dataset, September 2026)
Forecast Period
2026 to 2036, eleven discrete annual values
CAGR
4.2% base case. Bull 5.4%. Bear 3.0%.
Fastest Growth Segment
Radio Access Network Equipment: 7.6% CAGR
Fastest Growth Country
India: 6.0% CAGR
Fastest Growth Region
South Asia and Pacific: 6.0% CAGR
Largest Region
East Asia: 30% of 2025 global value
Market Leaders
Huawei, Nokia, Ericsson, Cisco Systems, and ZTE Corporation lead the market. Source: MMA Analysis, July 2026.
Primary Survey
n=3,800 procurement and R&D decision-makers, Q4 2025, six countries
Methodology
Demand-side build-up, cross-validated against public data, 47 expert interviews

Telecom Equipment Market Forecast Scenarios

telecom-equipment-market-size-forecast-scenario-1788422780826
Between 2020 and 2025, telecom equipment demand grew steadily as 5G rollout accelerated across major markets and fiber broadband expansion continued replacing legacy copper infrastructure, with a historical CAGR near 4.2 percent driven largely by radio access network densification investment across developed carrier markets. Growth moderated after 2023 as several markets completed initial 5G densification phases.
The base case assumes continued 5G network densification investment, expanding fiber broadband deployment tied to rural connectivity mandates, and steady core network capacity upgrades across most major carrier markets globally. These three mechanisms together sustain modest but reliable growth through 2036, reinforced by rising Open RAN adoption. Vendors with strong carrier certification track records capture a disproportionate share of this demand. Expanding private network deployment demand across most major telecom markets worldwide adds further demand support to this base case.
A stronger bull case emerges if governments accelerate rural broadband subsidy programs industry-wide, pulling forward equipment procurement meaningfully. The bear risk centers on carrier capital expenditure discipline, where a broader industry cost-cutting cycle would directly compress equipment orders across operators dependent on discretionary budgets. Suppliers diversifying across equipment categories weather this volatility better. Suppliers dependent on any single equipment category face the sharpest exposure.

Open RAN Standardization Reshapes Vendor Selection

Carrier procurement increasingly favors vendors demonstrating multi-generation network reliability track records over price alone, since equipment failures at scale carry service disruption costs that dwarf any unit price savings achieved during initial procurement. Vendors offering comprehensive field support and rapid replacement guarantees increasingly displace competitors relying purely on lower upfront hardware pricing, since total cost of ownership over an equipment lifecycle matters more to carriers than initial procurement discounts alone.
MARKET CONCENTRATIONCR5 68%top five vendors hold substantial global equipment revenue share
AVERAGE SYSTEM PRICE$285Ktypical radio access network base station equipment price range
OPEN RAN ADOPTION22%share of new radio access network deployments using open standards
FIBER BROADBAND PENETRATION58%share of broadband connections now served over fiber infrastructure
EQUIPMENT REPLACEMENT CYCLE8 yearstypical duration before carriers replace core network hardware equipment
ORDER BACKLOG LENGTH1.4 yearsaverage vendor order backlog across major carrier procurement programs
Open RAN standardization continues gaining traction among carriers seeking to reduce dependence on single-vendor radio access network architectures, though full interoperability across multiple equipment suppliers remains genuinely challenging in dense urban deployment environments. This dynamic favors vendors with proven interoperability testing capability over those relying primarily on proprietary integrated architectures, since carriers increasingly require multi-vendor compatibility as a formal procurement specification across new deployment programs.
Fiber broadband expansion is pulling investment toward transmission and access equipment suppliers with proven high-density deployment capability, a capability gap that favors established vendors over newer entrants lacking comparable large-scale rollout experience. This shift favors established equipment manufacturers with existing large-scale deployment logistics over newer entrants lacking comparable manufacturing and installation capacity, since procurement teams increasingly prefer vendors capable of national-scale rollout timelines.
"Carriers aren't buying the cheapest radio anymore. They're buying the vendor whose equipment won't page them at three in the morning."
Practice Lead, Telecommunications Infrastructure and Networks · MMA Network Infrastructure Hardware and Transmission Systems Practice · September 2026

Market Trends

Open RAN Standardization Gains Meaningful Carrier Traction

Carriers increasingly evaluate Open RAN architecture as a genuine strategy to reduce dependence on single-vendor radio access network equipment, treating multi-vendor interoperability as a formal risk mitigation priority rather than a purely experimental technology initiative. Roughly 22 percent of new radio access network deployments now use open standards, up meaningfully from levels reported just several years earlier as interoperability testing matures. Vendors offering certified Open RAN compliant equipment increasingly win competitive evaluations against suppliers still relying primarily on proprietary integrated architectures requiring substantial vendor lock-in across multi-year deployment commitments. Growth continues.
Market Impact: 51 percent report continued spending

Private Network Deployment Expands Enterprise Equipment Demand

Enterprises across manufacturing, logistics, and mining sectors increasingly deploy dedicated private cellular networks requiring specialized equipment distinct from traditional public carrier infrastructure, creating a genuinely new demand channel for telecom equipment vendors beyond conventional carrier procurement. Roughly 18 percent of surveyed enterprise technology buyers now report evaluating or deploying private network infrastructure, reflecting genuine operational interest rather than experimental pilot testing alone. Vendors with dedicated enterprise private network product lines increasingly capture this expanding demand, while carrier-only-focused equipment manufacturers struggle to compete credibly on enterprise-specific requirements and support models. Growth continues.
Market Impact: 34 percent cite subsidy as driver

Market Opportunities and Growth Drivers

5G Network Densification Sustains Radio Equipment Orders

Carriers deploying dense 5G small cell networks across urban and suburban coverage areas continue generating substantial radio access network equipment orders as densification programs extend into secondary and tertiary metropolitan markets beyond initial major city deployments. Roughly 51 percent of surveyed carriers report continued radio access network capital expenditure growth compared with prior-year budgets, reflecting sustained rather than declining densification investment priorities. Vendors with proven small cell manufacturing scale and rapid deployment logistics increasingly capture this expanding demand across most major carrier procurement programs and geographic markets currently active. Growth continues.
Market Impact: 29 percent delayed on capex

Rural Broadband Mandates Expand Fiber Equipment Demand

Government broadband subsidy programs across major markets increasingly fund fiber infrastructure deployment in underserved rural areas, directly sustaining transmission and access equipment order volume for vendors with proven high-density rural deployment capability and government program qualification experience. Roughly 34 percent of surveyed transmission equipment suppliers report rural broadband subsidy programs as a primary revenue driver behind recent order growth, a meaningfully higher share than reported several years earlier. Vendors with established government procurement relationships increasingly win contracts among carriers pursuing formal rural connectivity expansion programs across underserved geographic markets. Growth continues.
Market Impact: 26 percent report interoperability testing delays

Market Restraints and Challenges

Carrier Capital Expenditure Discipline Constrains Order Growth

Carriers facing investor pressure to improve free cash flow increasingly scrutinize network capital expenditure budgets more closely, extending equipment replacement cycles and delaying discretionary infrastructure upgrades beyond what technical requirements alone would otherwise dictate. The root cause traces to broader capital markets pressure on carrier profitability, not equipment vendor pricing specifically. Roughly 29 percent of surveyed carriers report capital expenditure discipline as a factor delaying planned equipment procurement in the past year. Some vendors are offering flexible financing arrangements to help carriers manage this budget constraint. This friction eases gradually.
Market Impact: 22 percent use open standards

Open RAN Interoperability Complexity Slows Full Adoption

Multi-vendor Open RAN deployments routinely encounter genuine interoperability challenges that single-vendor integrated architectures avoid entirely, particularly in dense urban environments where network performance requirements leave little margin for integration issues between different equipment suppliers. This friction slows the very vendor diversification that Open RAN standardization was designed to enable industry-wide. Roughly 26 percent of surveyed carriers report interoperability testing complexity as a factor delaying full Open RAN deployment. Some carriers are pursuing phased single-vendor Open RAN adoption before pursuing full multi-vendor architectures. This friction eases gradually across most large carrier markets.
Market Impact: 18 percent evaluate private network infrastructure
4 additional market trends, 3 additional growth drivers, and 3 additional restraints and challenges are covered in the full report. Contact sales@marketmindsadvisory.com to access the complete intelligence.

Segment CAGR and Growth Architecture

The market spans six equipment categories organized by network function, from radio access network hardware through optical networking equipment. Adoption pace varies sharply by category as 5G densification and fiber expansion reshape which segments see the fastest near-term growth across carriers. Vendors increasingly design roadmaps around this equipment divide rather than treating manufacturing scale as a secondary specification decision.
Section default visual

Radio Access Network Equipment

This segment covers base stations, small cells, and antenna systems deployed across carrier networks to provide wireless coverage and capacity, representing the largest single equipment category by carrier capital expenditure allocation currently in the market. Adoption is concentrated among carriers pursuing active 5G densification programs, where secondary and tertiary market coverage expansion continues driving substantial order volume beyond initial major city deployments completed earlier. Growth is outpacing every other segment as densification programs extend into previously underserved coverage areas across most major carrier markets globally. Vendors here compete heavily on small cell manufacturing scale and rapid deployment logistics rather than unit pricing alone. Program adoption is accelerating fastest among carriers with the largest remaining coverage gaps facing competitive pressure.
CAGR 7.6%

Optical Networking Equipment

This segment covers optical transport, wavelength division multiplexing, and fiber transmission equipment that carries the massive data volume growth driven by both 5G backhaul requirements and expanding fiber-to-the-home broadband deployment across residential and enterprise markets. Adoption is concentrated among carriers and infrastructure operators building high-capacity backbone networks capable of supporting exponentially growing data traffic across increasingly dense metropolitan and regional coverage areas. Bandwidth demand growth continues outpacing most carriers' existing transmission infrastructure capacity across major metropolitan markets. Growth here trails only radio access network equipment, reflecting similarly strong capacity-driven demand momentum. Suppliers investing early in wavelength density improvements are positioned to capture share as data traffic growth expands across most carrier and enterprise networks globally.
CAGR 6.4%
Full segment breakdown across 6 segments available in the complete report.

Regional Architecture and Country Demand Map

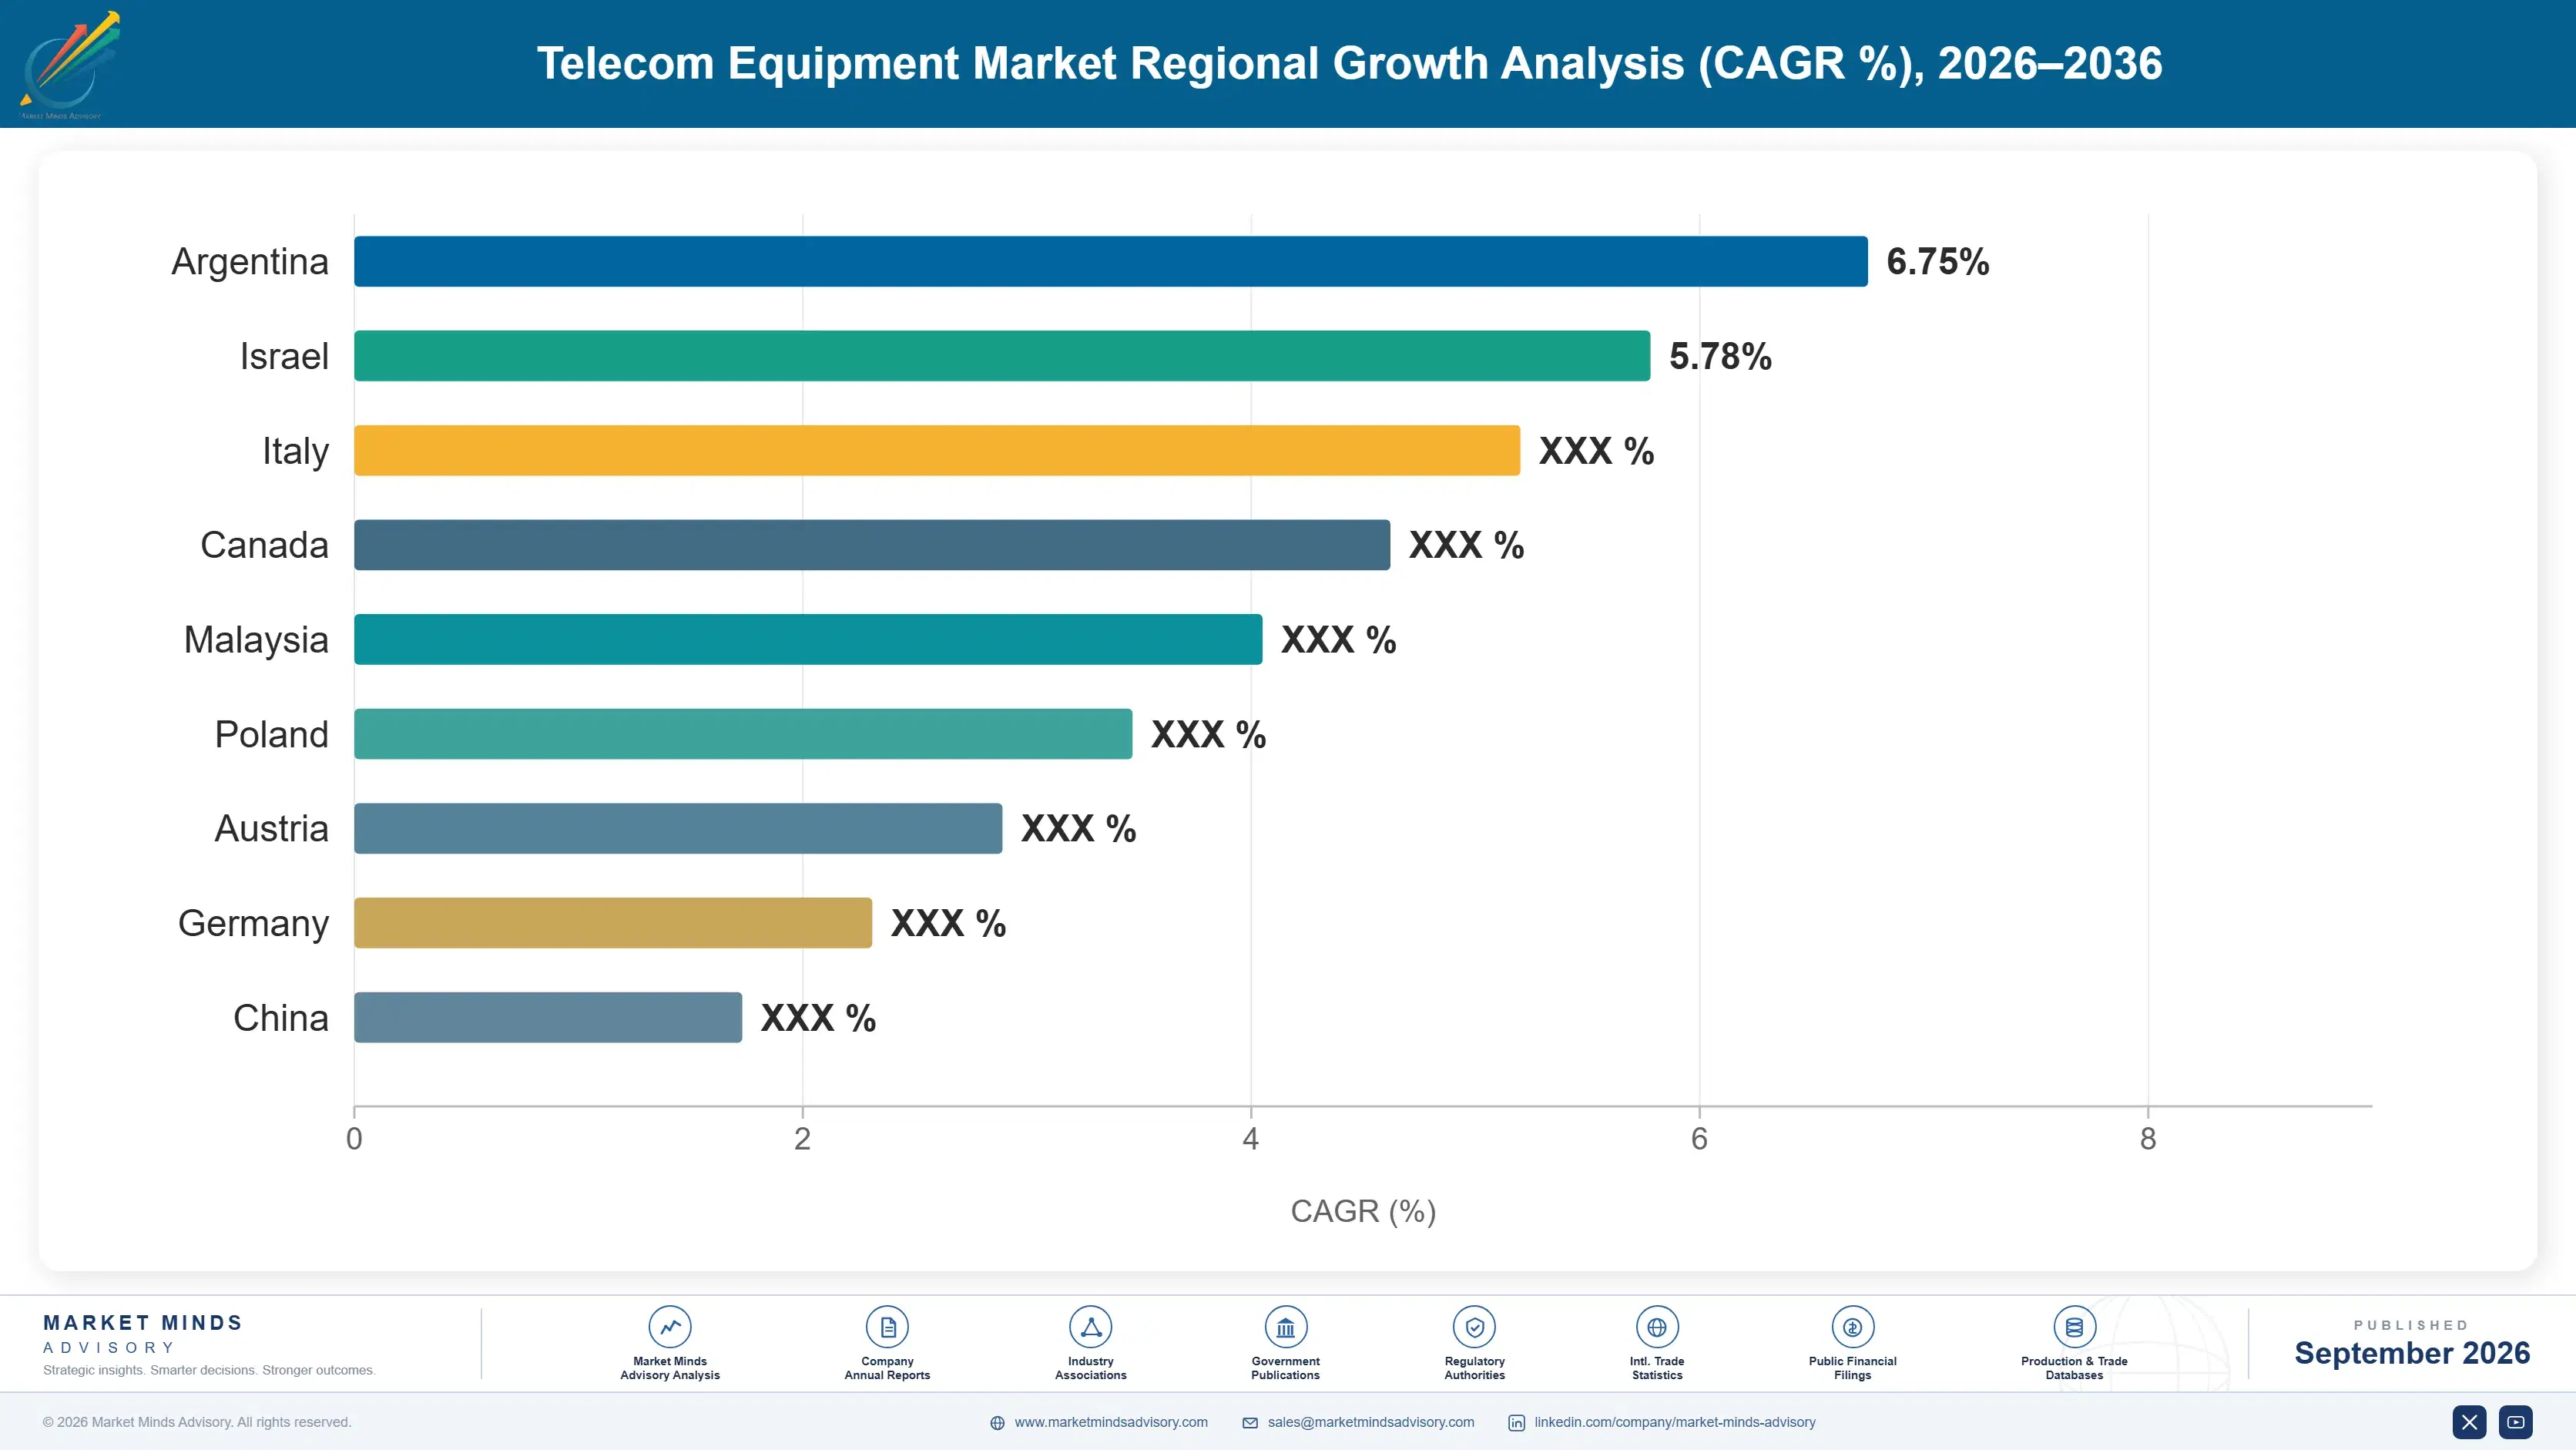
East Asia anchors global demand given concentrated equipment manufacturing scale and massive domestic network deployment volume across major domestic manufacturers. South Asia and Pacific expands fastest as regional carriers pursue accelerated 5G rollout across underserved population centers nationwide and expanding subscriber bases. North America follows closely behind.

North America

The United States accounts for the large majority of regional demand, reflecting concentrated carrier capital expenditure and the presence of major equipment vendors including Cisco Systems within domestic operations. Major carrier 5G densification programs and rural broadband subsidy initiatives sustain steady demand across multiple large carrier accounts nationwide. Canada contributes a smaller but meaningful share through comparable network infrastructure investment and equipment procurement programs. Established carrier certification relationships give United States and allied vendors a durable advantage over restricted international competitors seeking entry into domestic carrier programs specifically. This certification advantage compounds over successive procurement cycles nationally. Enterprise buyers also increasingly favor domestic vendor support networks for major deployments. Growth continues broadly.
Share: 25% | CAGR: 5.0% (2026 to 2036)

Western Europe

Germany, the United Kingdom, and France drive the bulk of regional demand, with major carriers pursuing 5G densification and fiber broadband expansion paralleling trends observed in other developed markets though security-driven vendor restrictions on certain suppliers shape procurement decisions distinctly. Growth trails North America and East Asia somewhat, reflecting a more mature installed base with fewer new network build-out programs relative to expanding markets elsewhere globally. Nordic countries show disproportionately high per-capita equipment investment relative to population size, reflecting strong digital infrastructure maturity. European Union security vendor diversity requirements continue reshaping regional procurement broadly. This regulatory framework benefits suppliers with established European operations. Multinational carriers standardize procurement across subsidiary operations broadly and consistently.
Share: 20% | CAGR: 2.8% (2026 to 2036)
Regional intelligence for 5 additional markets available in the complete report: East Asia, South Asia and Pacific, Latin America, Middle East and Africa, Eastern Europe. Contact sales@marketmindsadvisory.com.
telecom-equipment-market-market-share-analysis-1788422781366

Where Equipment Vendors Can Defend Margin

Vendors face mounting pressure to prove total cost of ownership value as carriers scrutinize capital expenditure more closely than in prior procurement cycles. Four commercial levers separate vendors sustaining premium pricing from those competing purely on unit hardware cost and basic feature parity alone across most segments. Certification depth remains the biggest differentiator separating durable winners from short-term commodity competitors.

Expand Open RAN Certification and Interoperability Depth

Vendors investing in mature Open RAN certification capture disproportionate share of the 22 percent of deployments now using open standards, since proven multi-vendor interoperability directly addresses the integration concerns dominating carrier procurement evaluations. This capability commands measurable pricing premiums over vendors offering only proprietary integrated architectures during competitive bids. Vendors slow to build this depth risk losing large carrier accounts entirely to better-positioned competitors with proven interoperability track records across comparable deployment environments and network topologies. Carriers evaluating multiple suppliers increasingly treat certification track record as the deciding factor above raw technical specification alone.
Market Impact: Captures share of the 22 percent using open standards

Build Dedicated Private Network Product Lines

Vendors offering dedicated enterprise private network equipment address the 18 percent of enterprise buyers now evaluating this infrastructure, positioning ahead of expanding manufacturing and logistics sector connectivity requirements across most industrial segments. This differentiation increasingly determines which vendors win early-mover contracts before broader industry-wide adoption accelerates further. Vendors without dedicated enterprise product lines struggle to match the response speed of specialized competitors already qualified on multiple industrial applications currently in commercial deployment. Enterprise buyers evaluating multiple suppliers increasingly weight demonstrated industrial deployment maturity heavily during formal procurement evaluations. Investment compounds quickly.
Market Impact: Addresses the 18 percent evaluating private networks now

Deepen Small Cell Manufacturing Scale Capacity

Vendors expanding small cell manufacturing capacity address the 51 percent of carriers reporting continued radio access network capital expenditure growth, capturing volume growth tied to accelerating densification across secondary and tertiary metropolitan markets. This positioning reduces dependence on any single major market's procurement timing that otherwise drives order volume volatility across the broader supply chain. Vendors building this capacity expand addressable market meaningfully beyond initial major-city deployments toward the larger secondary market segment. Carrier program managers increasingly favor suppliers already qualified on adjacent metropolitan categories for faster onboarding timelines. Growth continues here.
Market Impact: Addresses the 51 percent reporting continued spending now

Pursue Government Rural Broadband Program Qualification

Vendors pursuing formal government rural broadband program qualification address the 34 percent of transmission equipment suppliers citing subsidy programs as a primary revenue driver, positioning ahead of expanding rural connectivity mandate requirements across most major markets. This approach expands addressable market meaningfully beyond traditional urban carrier accounts toward the larger underserved rural infrastructure segment. Vendors building these qualifications expand addressable market among carriers pursuing formal rural connectivity expansion programs without relying entirely on urban-only procurement relationships. Government program managers increasingly favor suppliers already qualified on adjacent rural categories for faster onboarding timelines.
Market Impact: Addresses the 34 percent citing subsidy programs now

Who Controls the Margin Pool

Market concentration sits at roughly 68 percent among the top five vendors on a revenue basis, reflecting a field where manufacturing scale and carrier certification barriers concentrate share among established equipment vendors far more than typical technology-driven markets. The gap between leaders and mid-tier challengers remains wide, since certification track record and manufacturing capacity cannot be replicated quickly regardless of technical capability. New entrants face a genuine time disadvantage measured in years.
Current competitive activity centers on Open RAN certification, private network product expansion, and small cell manufacturing scale, with most major vendors racing to expand capability in whichever dimension they trail competitors most visibly. Security-driven vendor restrictions in several major markets continue reshaping competitive dynamics across affected carrier procurement programs. Open RAN certification program awards remain the single most contested battleground among the field's largest established suppliers currently.

Emerging pressure comes from Open RAN-native specialists partnering with systems integrators rather than pursuing full-stack vertical integration, gaining meaningful carrier access without bearing the full manufacturing investment themselves. Rankings could shift meaningfully if regulatory restrictions expand further across additional major carrier markets globally. This partnership model could meaningfully reshape which companies occupy the leading positions over the coming decade.
telecom-equipment-market-country-cagr-analysis-1788422781885

Competitive Moat and Risk Dimensions

HUAWEI

Moat: Deep Multi-Generation Manufacturing Scale

Huawei holds massive manufacturing capacity and multi-generation network deployment experience across both domestic and international carrier markets, built over decades of equipment manufacturing investment that newer entrants cannot replicate on any reasonable timeline. This scale advantage compounds into a durable position that competitors cannot shortcut through capital investment alone.
HUAWEI

Risk: Security-Driven Market Access Restrictions

Huawei's market access faces genuine restriction in several major Western markets due to security concerns, limiting its addressable carrier base regardless of technical capability or competitive pricing relative to unrestricted alternative vendors. Vendors with unrestricted market access increasingly win share in these affected regions. Regulatory clarity remains uncertain.
NOKIA

Moat: Strong Open RAN Certification Leadership

Nokia's early and sustained investment in Open RAN certification and interoperability testing gives it a genuine positioning advantage among carriers pursuing formal vendor diversification strategies, a differentiator built through years of dedicated standards development participation. This certification depth increasingly determines competitive outcomes as carriers prioritize interoperability above nearly every other factor.
NOKIA

Risk: Manufacturing Scale Lags Larger Rivals

Nokia's manufacturing scale trails the largest Asian competitors, leaving it comparatively less positioned to compete purely on unit cost during large-volume carrier procurement programs favoring lowest-cost qualified suppliers. Larger Asian competitors increasingly win price-sensitive procurement evaluations on manufacturing scale advantages. Cost-sensitive procurement increasingly favors these larger competitors.

Players Tracked

Prominent Players

Huawei
Nokia
Ericsson
Cisco Systems
ZTE Corporation

Other Key Players

Samsung Electronics
Ciena Corporation
Juniper Networks
CommScope
Corning
ADTRAN
Mavenir
NEC Corporation
Fujitsu
Ribbon Communications
Casa Systems
Airspan Networks
Comba Telecom
Radisys
Nordic Semiconductor

Recent Developments

FEBRUARY 2026

Nokia Wins Major Open RAN Carrier Contract

Nokia secured a multi-year contract to supply certified Open RAN equipment for a major carrier's network diversification program, expanding its certified interoperability product line across a new deployment category. The award reflects deepening carrier confidence in Nokia's certification track record. Industry analysts confirmed the deployment timeline.
Signal: Signals Open RAN certification depth continues determining which vendors win the largest contracts. Rivals lacking comparable certification face a gap.
OCTOBER 2025

Ericsson Expands Small Cell Manufacturing Capacity

Ericsson announced expanded small cell manufacturing capacity to address growing secondary market densification demand, building on its existing radio access network product line strength. The expansion reinforces manufacturing scale as an increasingly central competitive dimension among incumbents. Analysts view the move as strengthening Ericsson's competitive position.
Signal: Signals manufacturing scale investment continues concentrating around the fastest-growing category. Rivals are expected to respond with comparable capacity investment soon.
JUNE 2025

Cisco Systems Launches Private Network Platform

Cisco Systems introduced a new dedicated private network equipment platform targeting manufacturing and logistics enterprises, positioning ahead of anticipated enterprise connectivity demand growth across multiple industrial verticals. The launch reflects growing enterprise-focused product diversification. The move reflects mounting enterprise pressure on vendors to address specialized connectivity needs directly.
Signal: Signals enterprise private network demand is emerging as a genuine growth category industry-wide. Expect further enterprise product line expansion ahead.

Semiconductor Component and Manufacturing Exposure

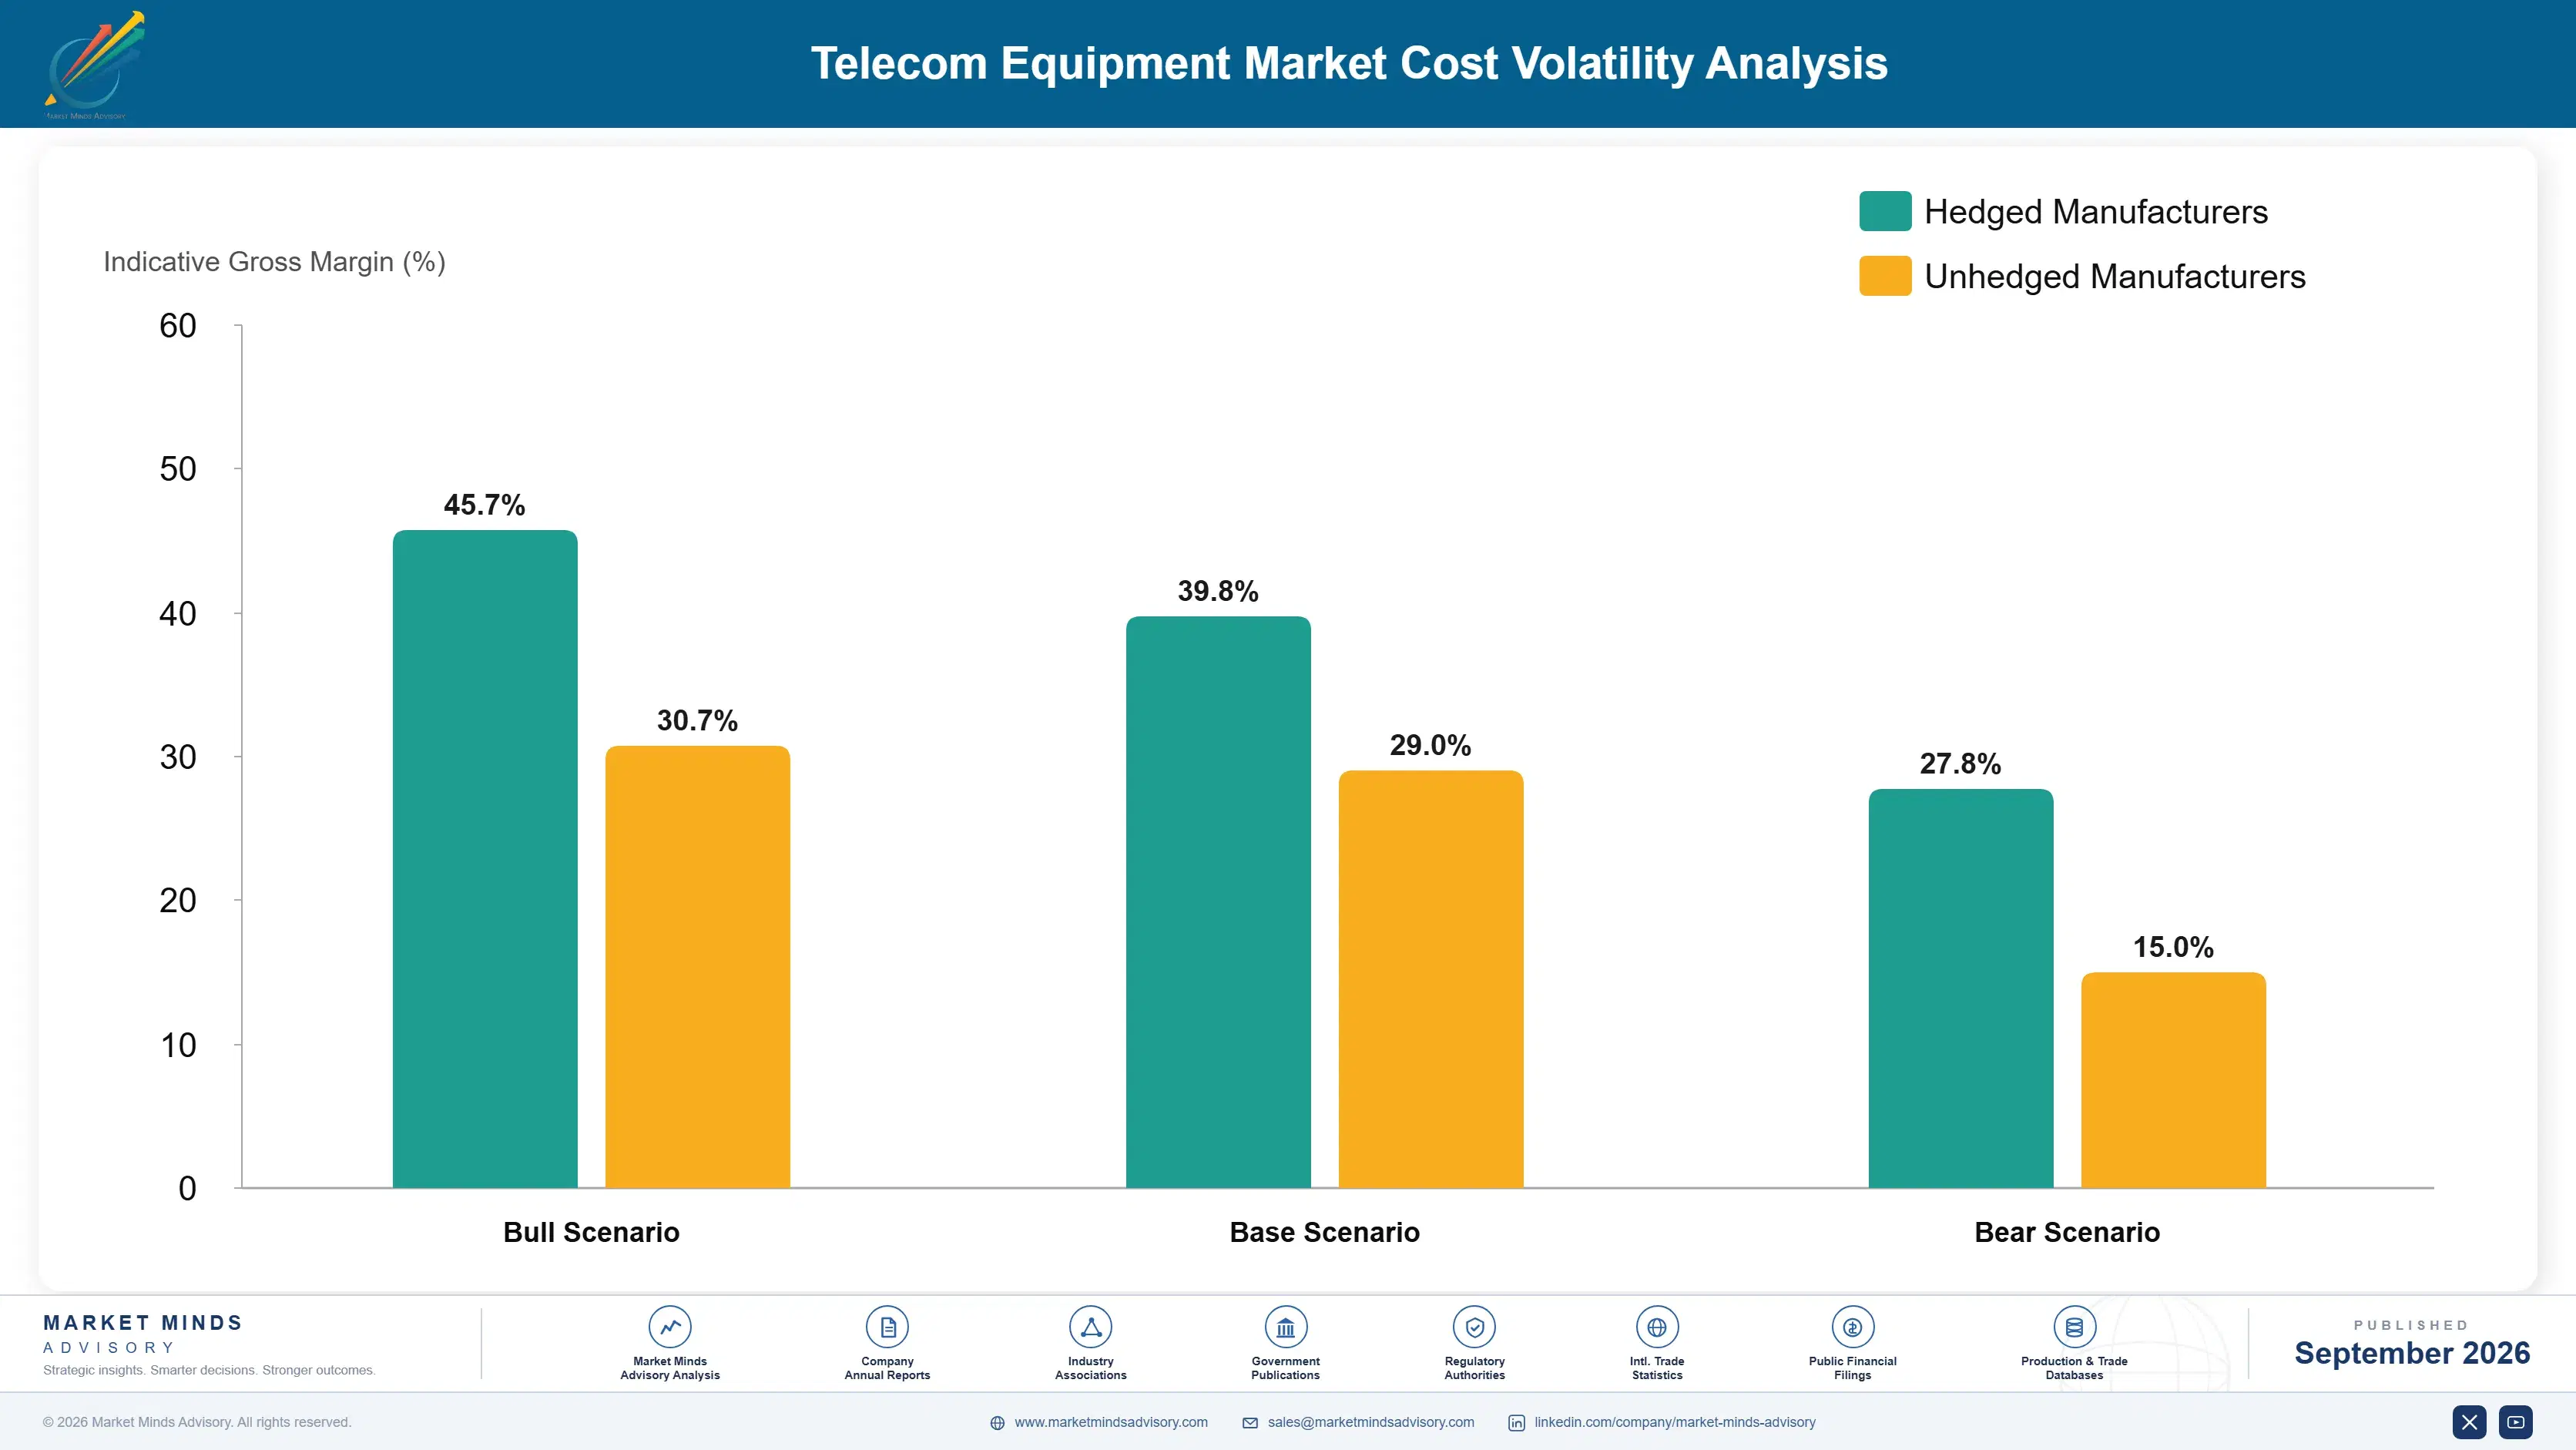
Radio frequency semiconductors, baseband processors, and optical components represent roughly 40 to 48 percent of platform COGS for telecom equipment manufacturers, sourced primarily from specialized semiconductor manufacturers concentrated in Taiwan, South Korea, and the United States. Precision manufacturing and enclosure fabrication represent a second cost category. Multi-year contracts help stabilize this cost category somewhat overall.
Semiconductor component pricing rose meaningfully during 2024 amid tightening advanced node manufacturing capacity, an effect documented in several major chip suppliers' annual reports citing extended lead times and rising input costs across the industry. Vendors with diversified sourcing relationships absorbed less of this cost increase than single-source dependent competitors. Analysts estimate the resulting component cost increase added roughly two to four percentage points of margin pressure for vendors unable to lock favorable terms across most product lines.

Smaller vendors lacking negotiating scale with major semiconductor manufacturers face a genuine cost disadvantage relative to larger incumbents able to negotiate volume-based pricing directly with foundry and component suppliers. This gap widens further as advanced node requirements climb, since next-generation equipment increasingly depends on the most advanced process technology available. Vendors serving smaller carrier accounts feel this most acutely.
telecom-equipment-market-company-positioning-matrix-1788422782080

Diversify Semiconductor Supplier Relationships

Vendors building relationships with multiple semiconductor manufacturers reduce single-source dependency risk, securing more resilient component pricing and availability even during periods of broader advanced node manufacturing capacity constraint across the industry. Vendors locking in favorable terms early gain a durable cost advantage over competitors renegotiating during periods of rising component pricing. Costs stabilize meaningfully.

Consolidate Manufacturing Across Product Lines

Vendors standardizing manufacturing processes across multiple equipment product lines reduce per-unit component cost meaningfully through shared purchasing volume, spreading fixed manufacturing investment across a broader base of qualified equipment models. Vendors locking in favorable terms early gain a durable cost advantage over competitors renegotiating during periods of manufacturing cost volatility broadly. Margins improve steadily.

Portfolio Architecture for Margin Defence

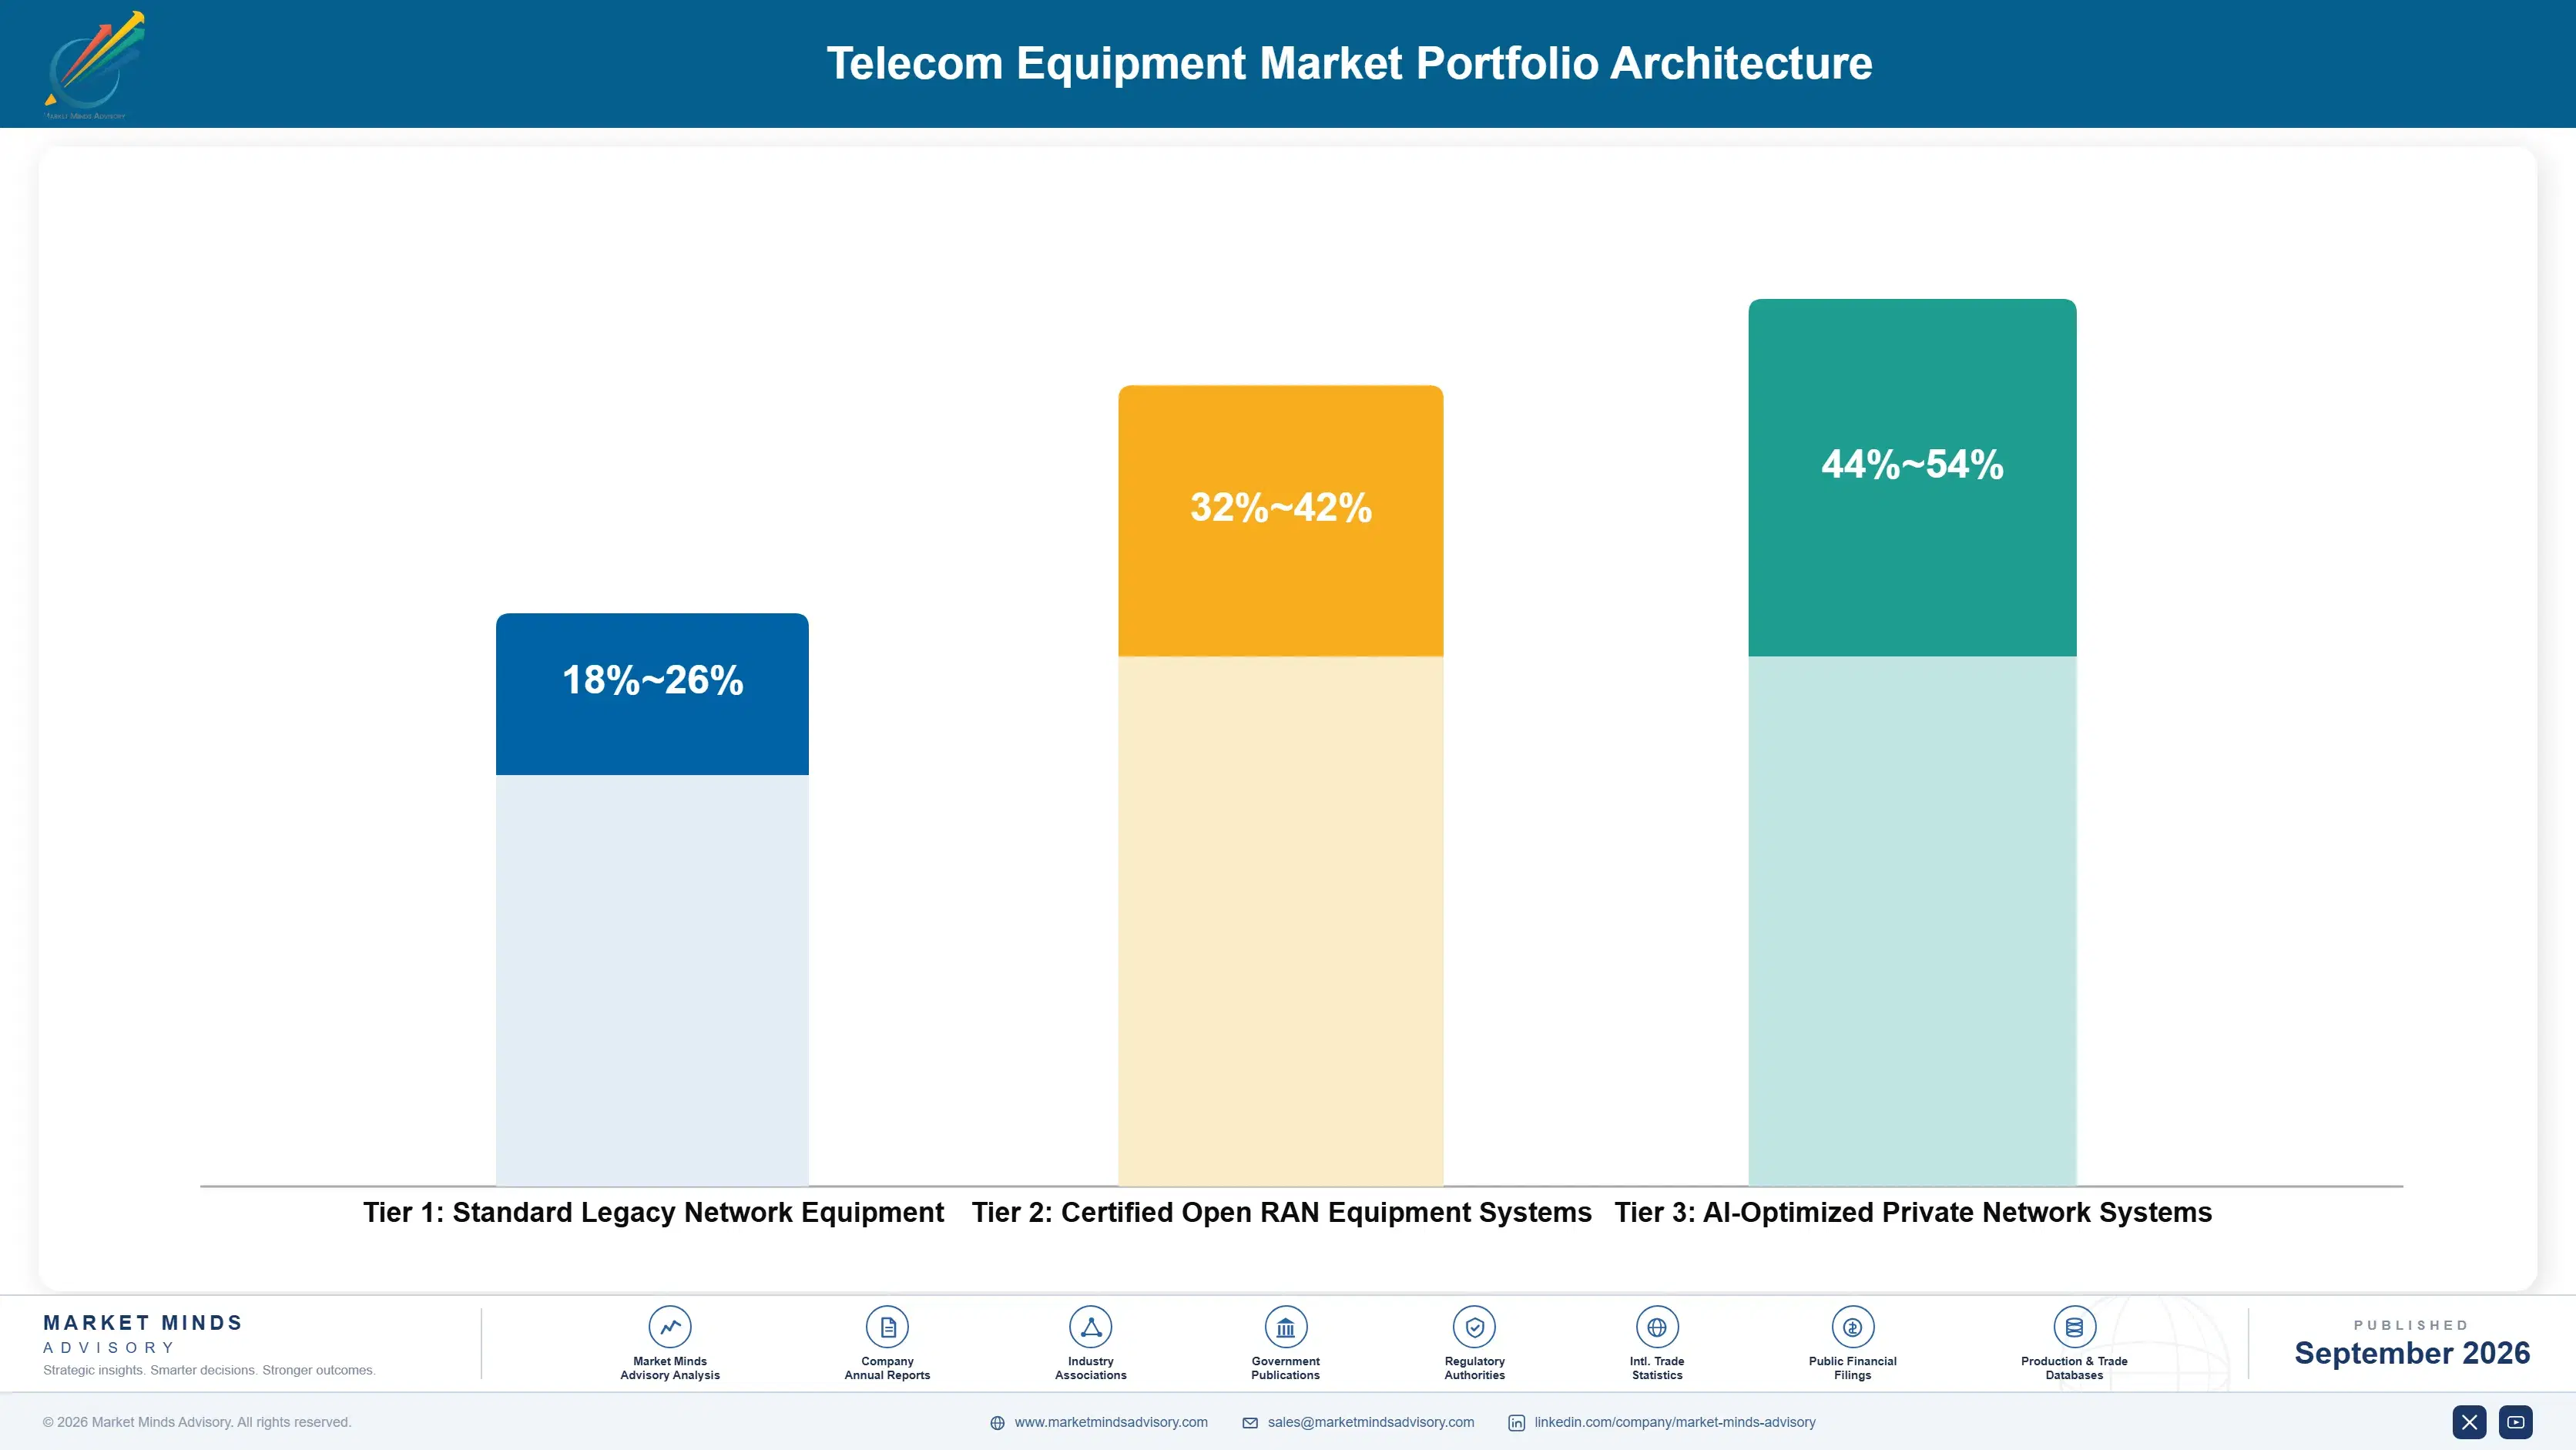
Vendors architect their portfolios around three distinct tiers separating commodity legacy equipment from certified Open RAN and next-generation private network systems commanding substantially higher margins tied to certification depth and interoperability testing across product lines. Tier boundaries increasingly reflect certification complexity rather than raw hardware specification, a shift favoring established vendors over newer commodity-focused entrants. This shift is reshaping vendor investment priorities industry-wide.
Volume tier products generate steady revenue at comparatively thin margins, while premium and next-generation certified tiers command substantially higher gross margins reflecting genuine certification barriers rather than pure hardware bundling alone across most vendor product lines currently offered. This tension between volume scale and premium margin defines much of current vendor investment strategy, since serving both segments simultaneously requires genuinely different certification and manufacturing capability.

High-value margin pools concentrate heavily among carriers requiring Open RAN certification depth and private network integration not offered within lower-priced commodity equipment product tiers across the broader supplier base currently active in the market. Suppliers increasingly steer investment toward these programs specifically, since the margin differential between commodity and certified tiers has widened considerably as standardization requirements expand. This trend is expected to continue through the forecast period.

Standard Legacy Network Equipment

Entry-level equipment for smaller carriers with limited certification complexity and standard network configurations already in service. These customers typically operate on tight per-site budgets and prioritize cost predictability over advanced feature depth.
Gross Margin: 18-26%

Certified Open RAN Equipment Systems

Interoperability-certified radio access network systems for mid-size to large carriers requiring standard vendor diversification compliance documentation. These systems represent the largest volume category by unit count across most carrier networks.
Gross Margin: 32-42%

AI-Optimized Private Network Systems

Full-stack platforms combining private network functionality and AI-driven optimization for the most demanding enterprise and carrier requirements available. Demand here continues climbing as standardization requirements expand across most carrier markets steadily.
Gross Margin: 44-54%
telecom-equipment-market-cost-volatility-analysis-1788422782575

High-value Sub-segments and Strategic Watch-out

Open RAN Certified Equipment Systems

High-value and high-growth category as vendor diversification accelerates, commanding premium pricing among vendors with proven interoperability certification depth and testing capability. This segment consistently outpaces every other product category in both revenue growth and new contract award volume. Investment compounds quickly across most carrier categories.
Gross Margin: 40-50%

Enterprise Private Network Systems

High-value with moderate growth as industrial adoption matures, commanding sustained premium pricing tied to demonstrated deployment reliability and specialized support outcomes. Vendors with mature industrial engineering increasingly command meaningful renewal pricing power within this maturing category. This gap keeps widening steadily across most competitive evaluations and industrial segments.
Gross Margin: 38-48%

Standard Legacy Network Equipment

Volume core category generating steady revenue at thinner margins, remaining the entry point for smaller carriers before eventual network upgrade paths emerge. Vendors increasingly view this segment as a customer relationship channel feeding eventual upgrades toward certified tiers. This funnel effect matters greatly for long-term vendor customer value.
Gross Margin: 20-28%

Legacy Copper Access Equipment

Strategic watch-out category facing steady decline as fiber broadband displaces older copper access technology across most carrier network modernization programs currently underway. Vendors are monitoring this segment closely for signs of accelerating decline as remaining holdout carriers eventually migrate. This transition remains gradual though inevitable across most carrier segments.
Gross Margin: 6-14%

Certification Cycles Build Durable Vendor Revenue

Telecom equipment vendors generate genuine annuity economics once a supplier wins carrier certification, since switching vendors mid-network requires re-certifying the entire equipment portfolio, a process spanning years that carriers rarely pursue once a supplier is qualified. This dynamic keeps incumbent vendors embedded across a carrier's full multi-decade network relationship, generating recurring maintenance and upgrade revenue well beyond the original certification win itself. This durability is a key reason certified vendors command premium value.
Adoption depth and stickiness vary meaningfully by end-use vertical: major national carriers embed vendor relationships deepest given network complexity and regulatory certification requirements, while smaller regional and rural carriers show comparatively shallower integration, often deferring equipment upgrades until scheduled major network refresh cycles rather than pursuing dedicated modernization programs. Enterprise buyers sit closest to major carriers in depth.

A generational shift in buyer profile is underway as carrier network architects increasingly drive equipment specification decisions earlier in network planning cycles, rather than treating vendor selection as a late-stage procurement consideration handled by separate purchasing teams. This earlier engagement favors vendors with strong systems integration credentials over pure hardware manufacturers lacking comparable design-stage relationships with carrier engineering teams. This shift carries implications for engineering team structure.
Section default visual

Where MMA Sees Telecom Equipment Heading

These are among the four positions where our research anticipates prominent divergence between winners and laggards over the coming forecast period. Each is grounded in the demand model, the regulatory perimeter, and the announced capacity pipeline.
01 / OPEN RAN CERTIFICATION PRIORITY

Open RAN certification depth deserves priority as diversification accelerates

Roughly 22 percent of new deployments now use open standards, making interoperability certification a genuine competitive moat rather than an optional capability most vendors historically treated as secondary to proprietary architecture. Vendors that build this depth now win the largest carrier diversification contracts before slower competitors catch up, since replicating years of interoperability testing history is not something capital alone can shortcut. This gap widens further as vendor diversification pressure continues expanding across most major carrier markets and geographic regions worldwide.
02 / PRIVATE NETWORK INVESTMENT

Enterprise private network products capture new industrial demand channel

Roughly 18 percent of enterprise buyers now evaluate private network infrastructure, positioning early movers ahead of expanding manufacturing and logistics sector connectivity requirements distinct from traditional carrier procurement channels. Vendors with dedicated enterprise product lines differentiate meaningfully from competitors still treating this as a peripheral extension of carrier-focused offerings rather than a genuine investment. This positioning advantage increasingly determines which vendors win early industrial contracts before broader industry-wide adoption accelerates across most major manufacturing, logistics, and mining sectors worldwide today.
03 / MANUFACTURING SCALE STRATEGY

Small cell capacity expansion captures densification volume growth

Roughly 51 percent of carriers report continued radio access network capital expenditure growth, representing genuine opportunity for vendors with manufacturing scale to capture volume tied to accelerating densification across secondary and tertiary metropolitan markets. Vendors that build credible manufacturing capacity smooth order volume across geographic markets less correlated with any single region's procurement timing or budget cycle. This diversification increasingly separates resilient vendors building capacity early from those fully exposed to unpredictable single-market timing risk and volatile carrier budget cycles.
04 / RURAL PROGRAM STRATEGY

Government qualification addresses expanding rural connectivity demand

Roughly 34 percent of transmission equipment suppliers cite subsidy programs as a primary revenue driver, reflecting genuine opportunity for vendors pursuing formal government rural broadband program qualification beyond traditional urban carrier procurement relationships and channels. Vendors building these qualifications expand addressable market meaningfully among carriers pursuing formal rural connectivity expansion programs across underserved geographic markets. This capability increasingly separates vendors capturing rural contracts from those confined entirely to urban-only procurement relationships lacking demonstrated rural program credibility and proven track record.

Engagement Snapshot From the Field

A live engagement with an industry participant carrying material or product regulatory and market exposure ahead of a defining policy shift, showing how our research translates into a defensible multi-year portfolio strategy.
MARKET MINDS ADVISORY · CLIENT ENGAGEMENT SUMMARY
Telecom Equipment Producer Strategic Portfolio Review and Transition Roadmap 2026·Investment Scenario on Telecom Equipment Exposure Evaluation 2025-26
CLIENT PROFILE
The client is a regional wireless carrier operating across a mid-size metropolitan footprint, facing board pressure to reduce vendor concentration risk after a single equipment supplier experienced a prolonged supply disruption affecting network expansion timelines. The engagement followed leadership frustration with limited negotiating leverage tied to single-vendor dependence across its radio access network. Annual radio access network capital expenditure reportedly exceeded ninety million dollars (client-reported, unverified by MMA) network-wide.
STRATEGIC CHALLENGE
The client's existing radio access network relied entirely on a single equipment vendor, leaving it exposed to supply disruption risk and limited pricing leverage, but leadership lacked internal expertise to evaluate whether Open RAN diversification would deliver acceptable network performance given integration complexity. Leadership needed a defensible technical business case before committing capital to a multi-year diversification program.
MMA APPROACH
MMA conducted primary interviews with the client's network engineering leadership and benchmarked three Open RAN certified vendors against interoperability track record, deployment timeline, and expected performance parity with the incumbent single-vendor architecture across the client's specific coverage topology. The engagement also weighed integration risk explicitly given the client's specific existing network topology and coverage requirements.
KEY FINDINGS
  1. Open RAN diversification across the highest-density coverage zones could plausibly reduce single-vendor concentration risk by roughly forty percent within eighteen months. This finding accelerated leadership's decision timeline considerably.
  2. Two of the three benchmarked vendors offered proven interoperability certification with the client's existing incumbent equipment for a phased hybrid approach. This compatibility reduced integration risk meaningfully.
  3. Network performance testing at comparable regional carriers that completed similar diversification showed no meaningful degradation in coverage or capacity metrics. This benchmark strengthened the internal business case considerably.
  4. Phased deployment starting with new coverage expansion zones reduced both integration risk and negotiating leverage loss compared with full-network conversion. This sequencing built organizational confidence before broader rollout.
CLIENT PROFILE
The client is a regional wireless carrier operating across a mid-size metropolitan footprint, facing board pressure to reduce vendor concentration risk after a single equipment supplier experienced a prolonged supply disruption affecting network expansion timelines. The engagement followed leadership frustration with limited negotiating leverage tied to single-vendor dependence across its radio access network. Annual radio access network capital expenditure reportedly exceeded ninety million dollars (client-reported, unverified by MMA) network-wide.
STRATEGIC CHALLENGE
The client's existing radio access network relied entirely on a single equipment vendor, leaving it exposed to supply disruption risk and limited pricing leverage, but leadership lacked internal expertise to evaluate whether Open RAN diversification would deliver acceptable network performance given integration complexity. Leadership needed a defensible technical business case before committing capital to a multi-year diversification program.
MMA APPROACH
MMA conducted primary interviews with the client's network engineering leadership and benchmarked three Open RAN certified vendors against interoperability track record, deployment timeline, and expected performance parity with the incumbent single-vendor architecture across the client's specific coverage topology. The engagement also weighed integration risk explicitly given the client's specific existing network topology and coverage requirements.
KEY FINDINGS
  1. Open RAN diversification across the highest-density coverage zones could plausibly reduce single-vendor concentration risk by roughly forty percent within eighteen months. This finding accelerated leadership's decision timeline considerably.
  2. Two of the three benchmarked vendors offered proven interoperability certification with the client's existing incumbent equipment for a phased hybrid approach. This compatibility reduced integration risk meaningfully.
  3. Network performance testing at comparable regional carriers that completed similar diversification showed no meaningful degradation in coverage or capacity metrics. This benchmark strengthened the internal business case considerably.
  4. Phased deployment starting with new coverage expansion zones reduced both integration risk and negotiating leverage loss compared with full-network conversion. This sequencing built organizational confidence before broader rollout.
RECOMMENDED STRATEGY
Phase 1: Phase one: deploy Open RAN equipment across new coverage expansion zones first, avoiding disruption to the existing certified network. This sequencing avoided any near-term coverage disruption. Phase 2: Phase two: expand diversification across the highest-density zones over eighteen months, aligned with scheduled equipment refresh cycles already planned. This pacing balanced risk against negotiating leverage gains. Phase 3: Phase three: track network performance and vendor negotiating leverage annually to validate projected benefits and inform future procurement decisions. This tracking supports future procurement strategy decisions.
OUTCOME
The client selected a vendor and began phased Open RAN deployment within six months of the engagement's conclusion. Early data suggests vendor concentration risk fell by roughly thirty-two percent (client-reported, unverified by MMA), with full network diversification expected to complete within two years. Network leadership cited the phased approach as a model for future vendor diversification efforts.

Frequently Asked Questions

Foundational context covering the market sizes, CAGR, scope, country, region and competition that inform every finding below. This section is provided to cover basics and most often pre-purchase conversations, answered from the MMA Primary Research Dataset.

What is the current size of the Telecom Equipment Market?

The global telecom equipment market reached approximately 205.0 billion dollars in 2025. 5G network densification and fiber broadband expansion are the primary drivers behind current market scale.

How large will the Telecom Equipment Market be by 2036?

MMA projects the market will reach approximately 322.33 billion dollars by 2036, expanding roughly 1.51 times from its 2026 base. Radio access network equipment accounts for the largest share of this growth.

What is the CAGR for the Telecom Equipment Market 2026 to 2036?

The market is projected to grow at a compound annual growth rate of 4.2 percent between 2026 and 2036. Bull and bear scenarios range from 3.0 percent to 5.4 percent depending on capital expenditure discipline.

Which segment is growing fastest?

Radio access network equipment is the fastest-growing segment, projected at a 7.6 percent CAGR, roughly 1.81 times the overall market rate. 5G densification programs drive this pace of growth.

Who are the major companies in the Telecom Equipment Market?

Leading vendors include Huawei, Nokia, Ericsson, Cisco Systems, and ZTE Corporation. The top five vendors together hold approximately 68 percent of the market on a revenue basis currently.

Which country is growing fastest?

India is the fastest-growing country market, projected at a 6.0 percent CAGR through 2036. Its massive carrier subscriber base and accelerated nationwide 5G rollout underpin this pace of growth.

Report Segmentation Architecture

The full report scope spans multiple orthogonal segmentation dimensions, with cross-tabulated demand data provided for each dimension pair. Coverage extends further to regional breakdowns, trend trajectories, and the competitive detail needed to support segment-level decision-making.

By Equipment Type

    By End-Use Deployment Setting

      By Network Architecture

        By Region

        • North America
        • Western Europe
        • East Asia
        • South Asia and Pacific
        • Latin America
        • Middle East and Africa
        • Eastern Europe

        Scope, Methodology, and Coverage

        Every figure in this report is reproducible from documented input assumptions. The scope below maps the historical period, the forecast horizon, the segmentation dimensions, and the countries covered, alongside the underlying primary and qualitative methodology.
        Historical Period
        2020 to 2025
        Forecast Period
        2026 to 2036
        Base Year
        2025 (USD billions; MMA Primary Research Dataset, September 2026)
        Market Definition
        The Telecom Equipment Market covers hardware infrastructure including radio access network, core network, transmission, and broadband access equipment deployed by telecommunications carriers and network operators worldwide. It excludes consumer devices, handsets, standalone network management software, and general enterprise IT hardware unrelated to telecom infrastructure.
        Quantitative Units
        USD billions, market share in percent, CAGR in percent
        Segmentation Dimensions
        Equipment type, end-use deployment setting, network architecture, region
        Regions Covered
        North America, Western Europe, East Asia, South Asia and Pacific, Latin America, Middle East and Africa, Eastern Europe
        Countries Covered
        United States, China, Germany, India, Japan, Brazil, and 19 additional countries across seven regions
        Key Companies Profiled
        Huawei, Nokia, Ericsson, Cisco Systems, ZTE Corporation, and 15 additional participants
        Quantitative Methodology
        Primary survey, n=3,800 respondents, Q4 2025, six countries; demand-side model with trade association cross-validation
        Qualitative Methodology
        47 expert interviews, Q4 2025; applied to validate demand model assumptions, identify emerging dynamics, and assess competitive positioning
        Report Format
        PDF and XLSX data workbook (Word format preview document)
        Publisher
        Market Minds Advisory
        Report Code
        MMA-2026-TEC-501
        Published
        September 2026
        Contact
        sales@marketmindsadvisory.com | www.marketmindsadvisory.com

        Purchase the full Telecom Equipment Market Report (2026 to 2036).

        This report provides a comprehensive assessment of the global telecom equipment market, covering segmentation, regional dynamics, competitive positioning, and input cost exposure through 2036. It draws on primary survey data from 3,800 respondents and 47 expert interviews conducted across six countries in the fourth quarter of 2025. Analysts detail Open RAN certification trends, private network product expansion, and margin economics across three distinct product tiers. The report also includes a detailed client case study illustrating a real network diversification engagement and its measured outcomes. Regional data is included throughout.
        Segment-level CAGR and market share forecasts
        Seven-region demand and pricing trend analysis
        Competitive positioning across twenty profiled vendors
        Input cost exposure and mitigation pathways
        Portfolio tier margin economics and watch segments
        Anonymized client engagement case study review

        Built For The People Who Decide

        From boardroom strategy to bench-side execution, this report is read cover-to-cover by leaders shaping the next decade of their industry, turning demand scenarios, market dynamics and valuation benchmarks into decisions.
        CXOs/ Presidents/ VPs/ Managers
        M&A and Corporate Development
        Strategy Teams and R&D Heads
        Procurement and Product Directors
        Regulatory and Compliance Leaders
        Investor Relations and Equity Analysts