Market Minds Advisory
Tattoo Removal Lasers Market

Tattoo Removal Lasers Market: A Better Machine Costs the Clinic Revenue

Picosecond systems clear a tattoo in fewer sessions, which reduces what a clinic earns from each patient, so the better device has to be sold against the buyer's own revenue model.

Lead Analyst

Alice Ballenger

Published

September 2026

Make Smarter Decisions with Customized Research Insights

Request a free sample report and evaluate market opportunities, growth trends, and competitive dynamics relevant to your business needs.

2025 MARKET VALUE$0.3BMarket Size 2025
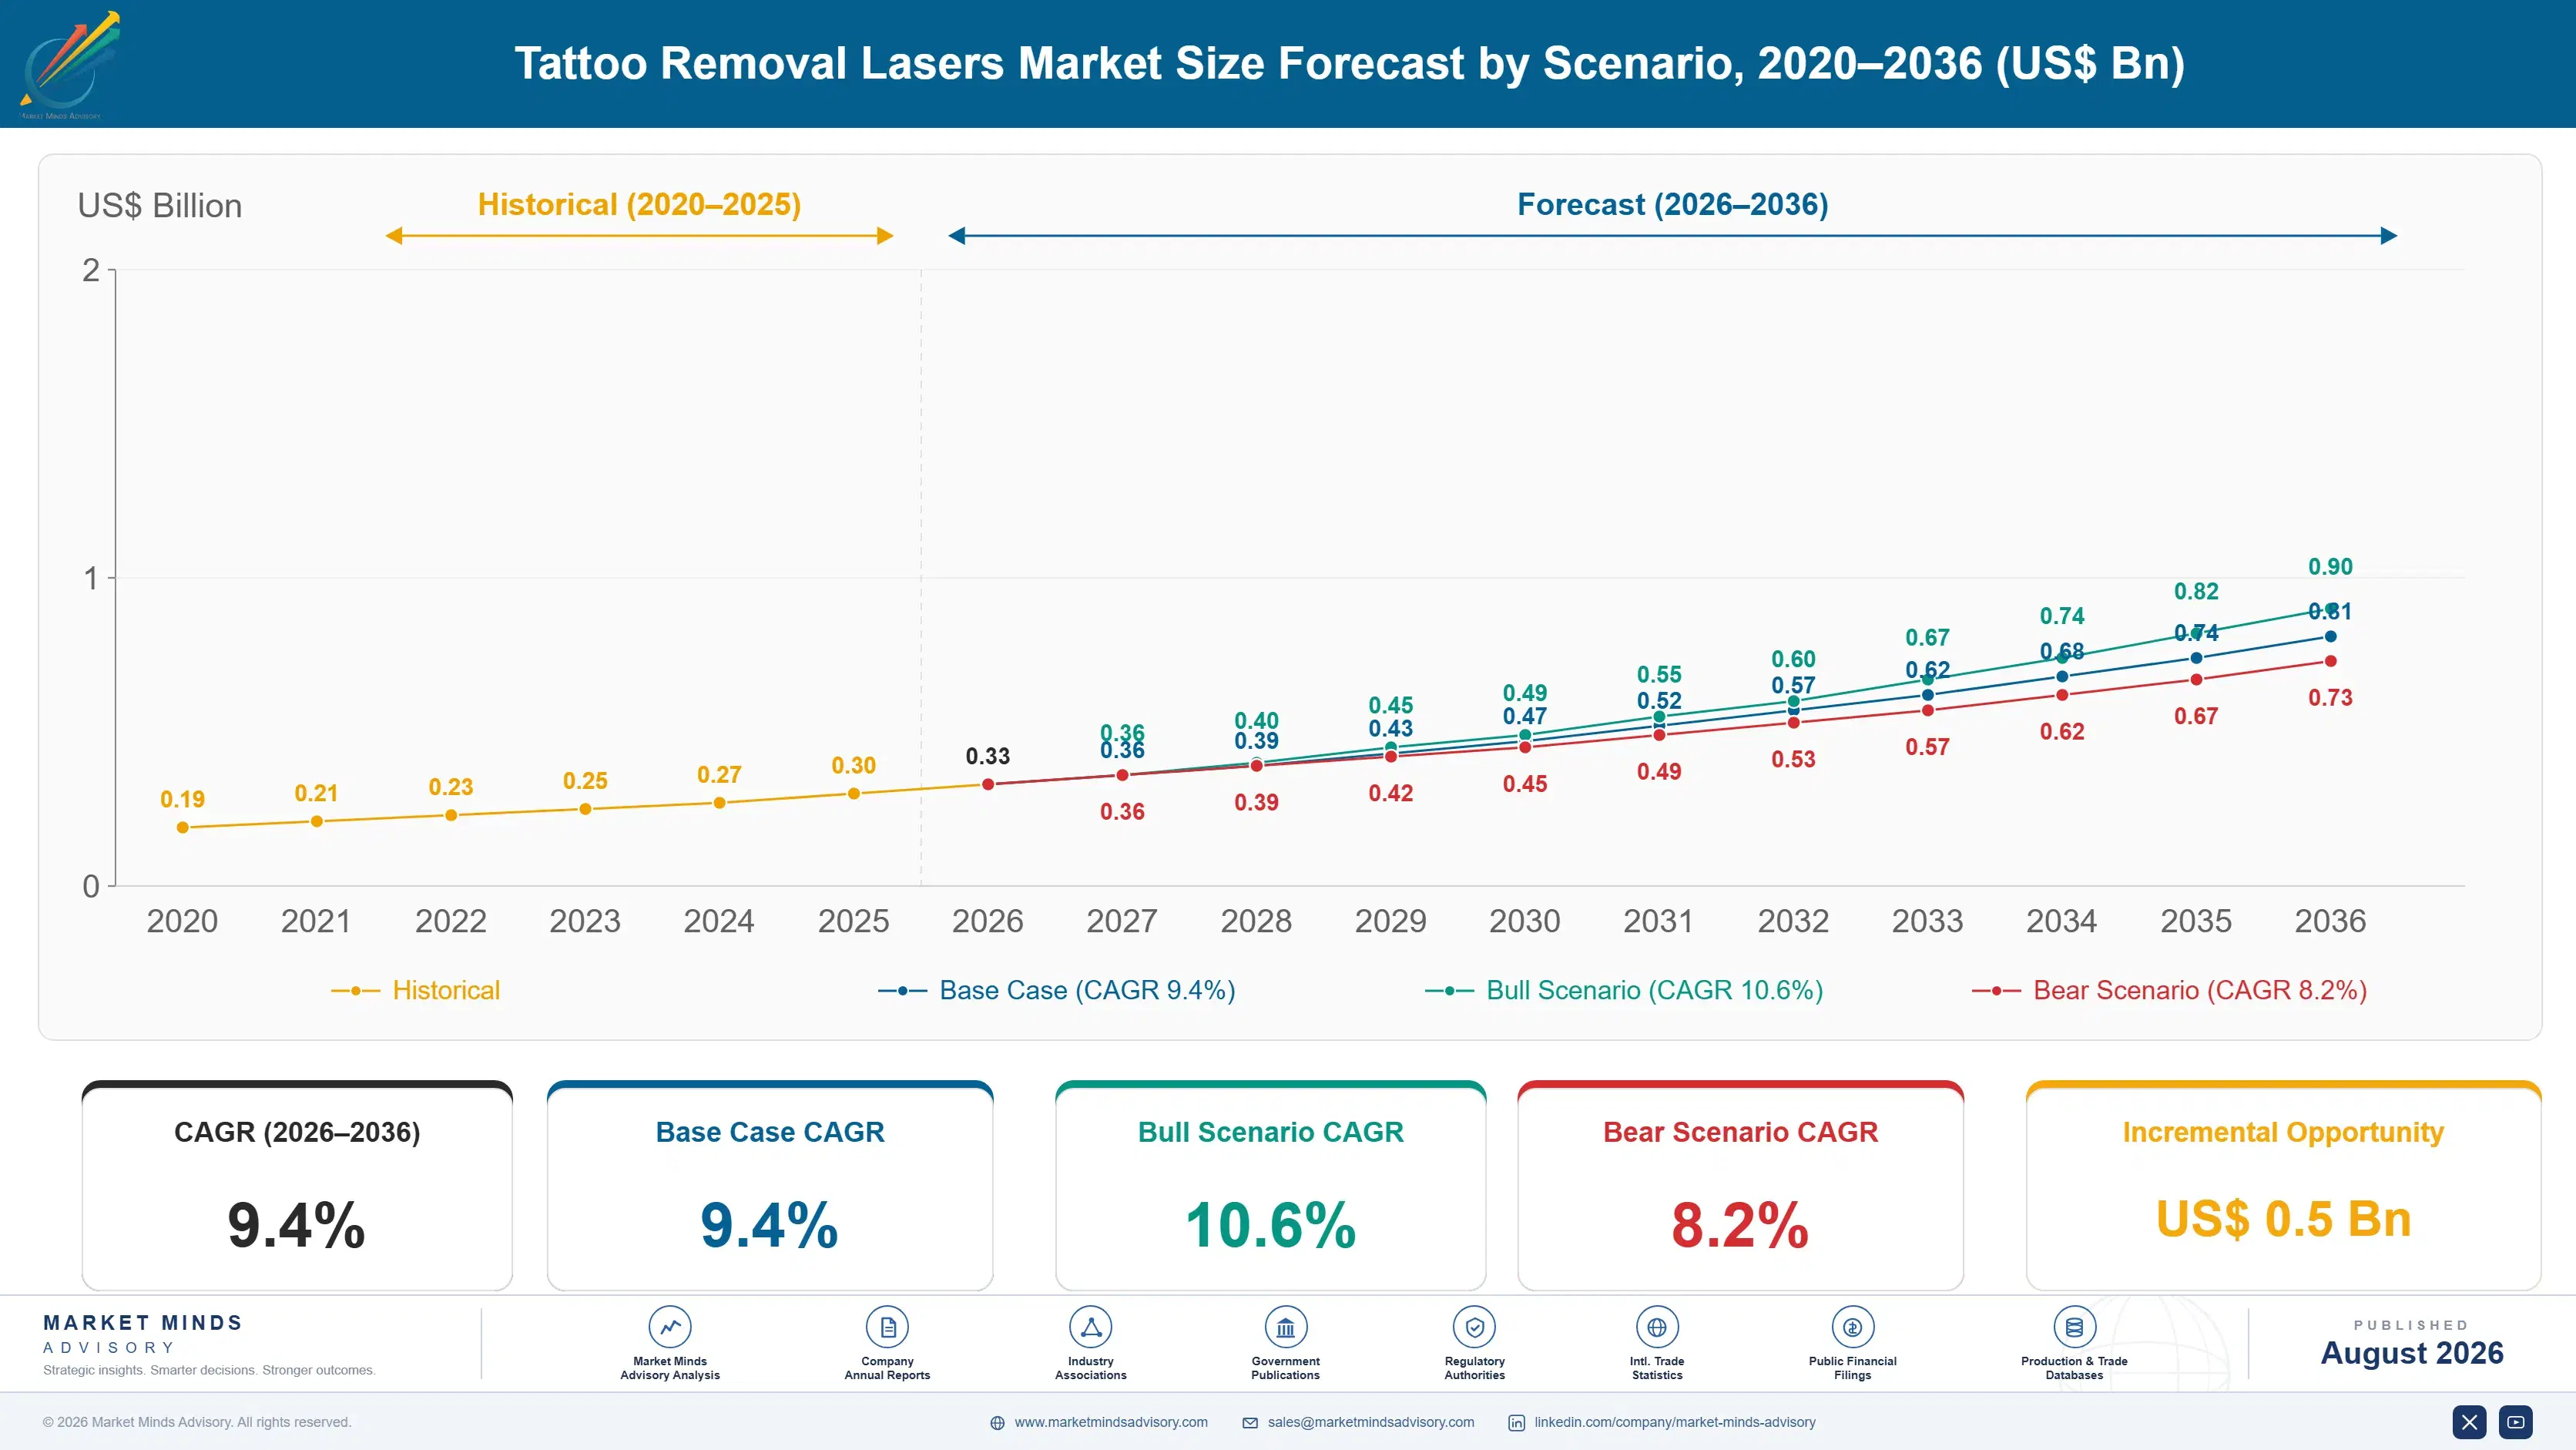
2036 FORECAST VALUE$0.9BBase Case , 2026 to 2036
CAGR 2026 TO 20369.4 %Bull 10.6% / Bear 8.2%
INCREMENTAL OPPORTUNITY$0.5BNet 10- year value creation
EXPANSION MULTIPLE2.46x2036 value over 2026 base
Strategic Levers
M&A Pipeline
Regional Outlook
Country Rankings
Competitive Intelligence
Segmental Deep-dive
Call-Us : 91 93563 13602

Executive Snapshot and Market Trajectory

A picosecond system clears a tattoo in around 38% fewer sessions than a nanosecond one, which sounds like an unambiguous improvement until you notice that the clinic buying it earns per session. A better machine reduces revenue per patient unless the clinic raises its session price.
That is the adoption barrier the industry rarely discusses, and it is commercial rather than clinical. Picosecond platforms also cost roughly 2.6 times a comparable nanosecond system, so the clinic is asked to spend considerably more capital in order to complete each patient sooner. Around 71% of systems are financed rather than bought, which makes the monthly payment the number that decides everything. That arithmetic decides most purchases.
Underneath both problems sits an unknown. Practitioners can identify the pigment chemistry in only about 12% of the tattoos they treat, because inks are mixtures whose composition was never disclosed to anybody. Session counts are therefore estimates, packages are quoted against uncertainty, and the device maker is selling a promise the clinic cannot reliably keep. Every overrun lands on the practitioner rather than on the manufacturer that made the performance claim in the first place.
Market Definition
Laser systems and platforms used for tattoo and pigmented lesion removal, covering Q-switched nanosecond neodymium systems, picosecond neodymium and alexandrite systems, Q-switched ruby and alexandrite systems, multi-wavelength combination platforms, fractional and adjunct laser devices, and portable and entry-level systems. Measured at manufacturer selling value including handpieces supplied with the system. Excludes hair removal and skin resurfacing devices sold without tattoo indications, topical removal products, surgical excision, consumable creams and aftercare, and clinical services.
Base Year Value
$0.3B in 2025 (MMA Primary Research Dataset, August 2026)
Forecast Period
2026 to 2036, eleven discrete annual values
CAGR
9.4% base case. Bull 10.6%. Bear 8.2%.
Fastest Growth Segment
Picosecond Nd:YAG and Alexandrite Systems: 14.1% CAGR
Fastest Growth Country
Brazil: 13.8% CAGR
Fastest Growth Region
South Asia and Pacific: 11.6% CAGR
Largest Region
North America: 32% of 2025 global value
Market Leaders
Cynosure Lutronic, Candela, Cutera, Lumenis, Alma Lasers. Source: MMA Primary Research Dataset, July 2026.
Primary Survey
n=3,800 procurement and R&D decision-makers, Q4 2025, six countries
Methodology
Demand-side build-up, cross-validated against public data, 47 expert interviews

Tattoo Removal Lasers Market Forecast Scenarios

tattoo-removal-lasers-market-size-forecast-scenario-1787639702662
Growth ran near 8.0% between 2020 and 2025, driven by picosecond platform adoption in higher end clinics while nanosecond systems continued serving the volume market on capital cost. Regulatory restriction of certain tattoo ink pigments across Europe changed the composition of inks being applied from 2022 onward, which will eventually alter the removal population without affecting current demand.
Base case 9.4% rests on three mechanisms. Picosecond systems grow at 14.1% as clinics accept the capital premium in exchange for shorter treatment courses and better outcomes on stubborn colours. Multi-wavelength combination platforms grow at 11.2% because a clinic buying one machine wants it to treat more than tattoos. And Brazil grows fastest of any country at 13.8% on tattoo prevalence and aesthetic clinic density together. Only one depends on clinical performance.
The bull case at 10.6% assumes clinics repricing sessions to reflect faster clearance, which would remove the revenue disincentive that currently slows picosecond adoption in mid market practices. The bear case at 8.2% is financing conditions tightening for small clinic buyers, since around 71% of systems are acquired on lease and the monthly payment rather than the clinical case decides most purchases.

The Machine That Shortens Your Own Revenue

There is an awkward fact at the centre of this market that manufacturers prefer not to state plainly. A clinic charges per session and a picosecond laser clears a tattoo in around 38% fewer sessions than a nanosecond system does. Unless the clinic raises its price per treatment, the better machine reduces the revenue it earns from every patient wanting a tattoo removed.
TOP FIVE CONCENTRATION44%Regulatory clearance and clinical evidence narrow the field somewhat
SESSIONS PER REMOVAL9Treatments typically required to clear a coloured tattoo fully
PICOSECOND PRICE MULTIPLE2.6xCapital cost against an equivalent nanosecond laser platform
INK COMPOSITION KNOWN12%Tattoos whose pigment content the practitioner can actually identify
SESSION REDUCTION ACHIEVED38%Fewer treatments needed using shorter photomechanical pulse durations
SYSTEMS ACQUIRED ON LEASE71%Share of systems financed rather than purchased outright by clinics
The capital side compounds that. A picosecond platform costs roughly 2.6 times a comparable nanosecond system, and around 71% of systems are acquired through leasing rather than outright purchase, because the buyer is usually a small clinic rather than a hospital. The decision is therefore a monthly payment weighed against expected patient throughput, and a device that shortens each patient's course is working against that arithmetic.
Both problems sit on top of a deeper uncertainty. Practitioners can identify the pigment chemistry in only around 12% of the tattoos they treat, because tattoo inks are proprietary mixtures whose composition was never disclosed and frequently varies between batches. Session counts of nine or more are estimates, packages get quoted against that uncertainty, and every outcome promise is one the clinic must then defend.
"Manufacturers keep selling faster clearance to businesses that bill by the session, and then wonder why the clinical argument does not close the sale. The clinics buying picosecond systems are the ones that already repriced, and almost nobody in the industry helps the rest of them work out how."
Director, Aesthetic and Dermatology Devices Practice · MMA Medical Devices Practice · August 2026

Market Trends

Faster clearance colliding with per session clinic billing

Picosecond systems clear a tattoo in roughly 38% fewer sessions, which is unambiguously better for the patient and directly reduces revenue per patient for a clinic billing by treatment. Adoption therefore concentrates among practices that have already moved to package pricing or raised session rates to reflect outcome rather than time. Manufacturers presenting the clinical case without addressing the revenue model are asking a small business to fund an improvement that shortens its own income from every case it takes on. The practices that have already repriced are also the practices best able to charge for outcomes.
Market Impact: Brazil growing fastest at 13.8%
Platform buyers wanting more than one indication treated

A clinic financing a system over several years wants it earning across as many indications as possible, which pushes demand toward multi-wavelength combination platforms treating pigmented lesions, vascular marks and skin revitalisation alongside tattoos. Growth at 11.2% follows that utilisation logic rather than any clinical preference about tattoo removal specifically. Single indication devices increasingly struggle to justify a monthly payment in practices where tattoo removal alone will not keep a treatment room occupied. Manufacturers presenting tattoo removal volume alone set the clinic up for a payback calculation that will not hold.
Market Impact: Clears in 38% fewer sessions

Market Opportunities and Growth Drivers

Tattoo prevalence and clinic density rising across Latin America

Brazil grows fastest of any country at 13.8%, combining unusually high tattoo prevalence with a dense and competitive aesthetic clinic sector where practices adopt new devices to differentiate themselves. Removal demand follows application with a lag of years rather than months, and the population that acquired tattoos through the past two decades is now reaching the ages at which removal interest peaks. Financing availability rather than clinical evidence tends to gate adoption in that market. Currency movement periodically makes imported capital equipment difficult to acquire regardless of demand. Financing availability gates adoption more than evidence does.
Market Impact: Composition known in 12% of cases

Stubborn colours pushing practices toward shorter pulse durations

Green, blue and certain yellow pigments respond poorly to nanosecond pulses and frequently leave residual ink after a full course of treatment, which produces dissatisfied patients whatever the practitioner explains beforehand. Picosecond systems fracture those pigments photomechanically and clear them considerably more reliably. Practices whose reputation depends on completing difficult cases rather than on volume throughput adopt for that reason, and they are also the practices most able to charge accordingly. Those practices are also the ones best positioned to charge for the difference, which makes the revenue objection considerably less binding than it is in volume oriented practices elsewhere.
Market Impact: Costs 2.6 times nanosecond systems

Market Restraints and Challenges

Unknown ink chemistry making session counts unpredictable

Practitioners can identify the pigment composition of only around 12% of the tattoos they treat, because inks are proprietary mixtures that vary between manufacturers and batches without any disclosure requirement in most markets. The root cause is regulatory rather than technical. Commercially it means a course of nine sessions is an estimate, packages are priced against uncertainty and patient dissatisfaction lands on the clinic. Test patching and conservative quoting are the mitigations practitioners actually use in practice. Nothing available to a manufacturer removes the underlying uncertainty. Conservative quoting protects the practitioner and slows the whole course.
Market Impact: Cuts sessions by around 38%

Capital cost against small business financing capacity

A picosecond platform costs roughly 2.6 times a comparable nanosecond system and around 71% of systems are acquired through leasing, because the buyer is generally a small clinic rather than an institution with a capital budget. The root cause is the structure of the customer base rather than any pricing decision. Commercially it makes the monthly payment the deciding number. Placement models, per treatment billing and utilisation guarantees are the mitigations manufacturers have begun offering. Higher borrowing costs suppress purchases regardless of how compelling the clinical evidence happens to be, an exposure no product improvement addresses.
Market Impact: Combination platforms growing at 11.2%
4 additional market trends, 3 additional growth drivers, and 2 additional restraints and challenges are covered in the full report. Contact sales@marketmindsadvisory.com to access the complete intelligence.

Segment CAGR and Growth Architecture

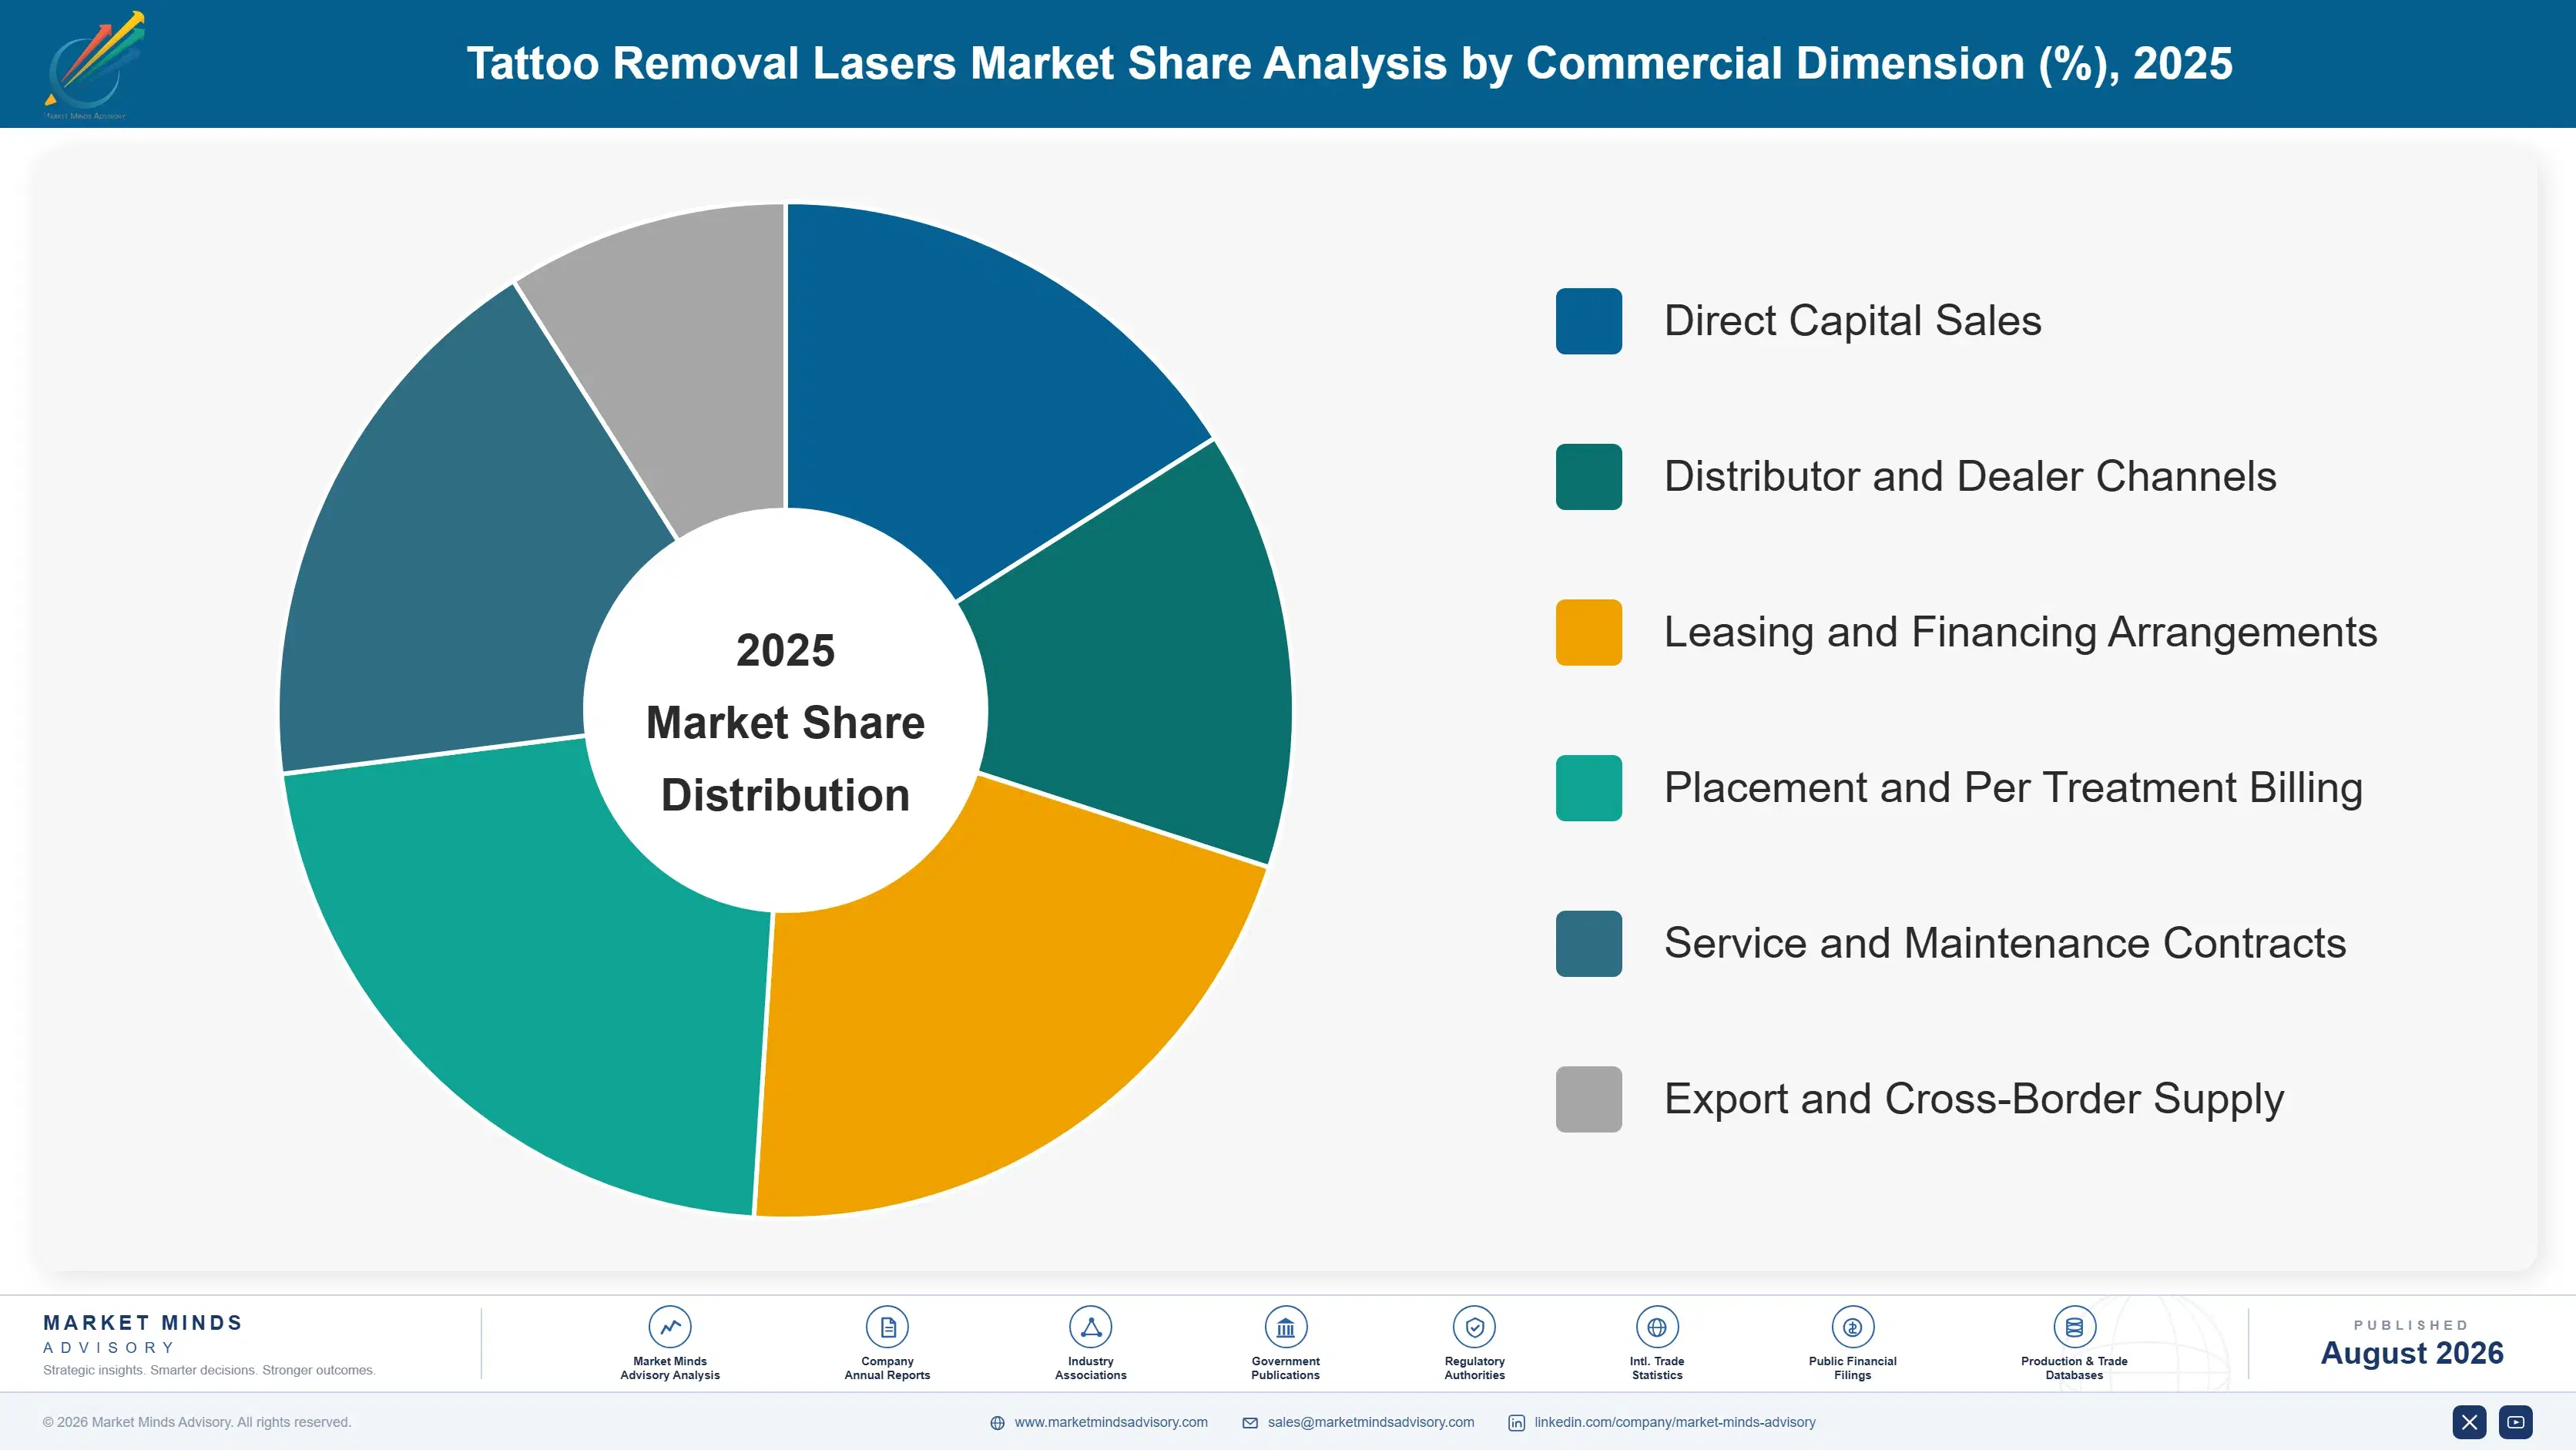
Six segments are split by laser technology, because pulse duration and wavelength together determine which pigments can be fractured, the session count a course requires, the capital the clinic must finance and the other indications the platform can treat. Handpiece options sit inside each technology. Clinic setting and channel are handled separately in the framework. Financing structure follows technology too.
tattoo-removal-lasers-market-market-share-analysis-1787639703228

Picosecond Nd:YAG and Alexandrite Systems

Growing at 14.1%, half again the market rate of 9.4%, picosecond systems deliver pulses short enough to fracture ink particles photomechanically rather than thermally, which clears tattoos in around 38% fewer sessions and handles green and blue pigments that nanosecond systems frequently leave behind entirely. Capital cost runs roughly 2.6 times a comparable nanosecond platform. Adoption concentrates among practices that have moved to package pricing or raised session rates, because a clinic billing per treatment is otherwise being asked to fund a device that shortens its own revenue from every case. Lower cost picosecond capability from Korean and Chinese manufacturers is now eroding that premium in the mid market. Session pricing is the barrier.
CAGR 14.1%

Multi-Wavelength Combination Platforms

At 11.2% combination platforms treat pigmented lesions, vascular marks and skin revitalisation alongside tattoos, which matters enormously to a clinic financing a system over several years and needing it to keep a treatment room occupied. The clinical argument for any single indication is secondary to the utilisation argument across all of them. Single indication devices increasingly struggle in mid market practices where tattoo removal volume alone cannot support a monthly lease payment, and that constraint is tightening as financing costs remain elevated across most markets. Clearance breadth across indications therefore matters more to these buyers than performance on any single one, which is a reversal of how device manufacturers usually construct their commercial arguments.
CAGR 11.2%
Full segment breakdown across 6 segments available in the complete report.

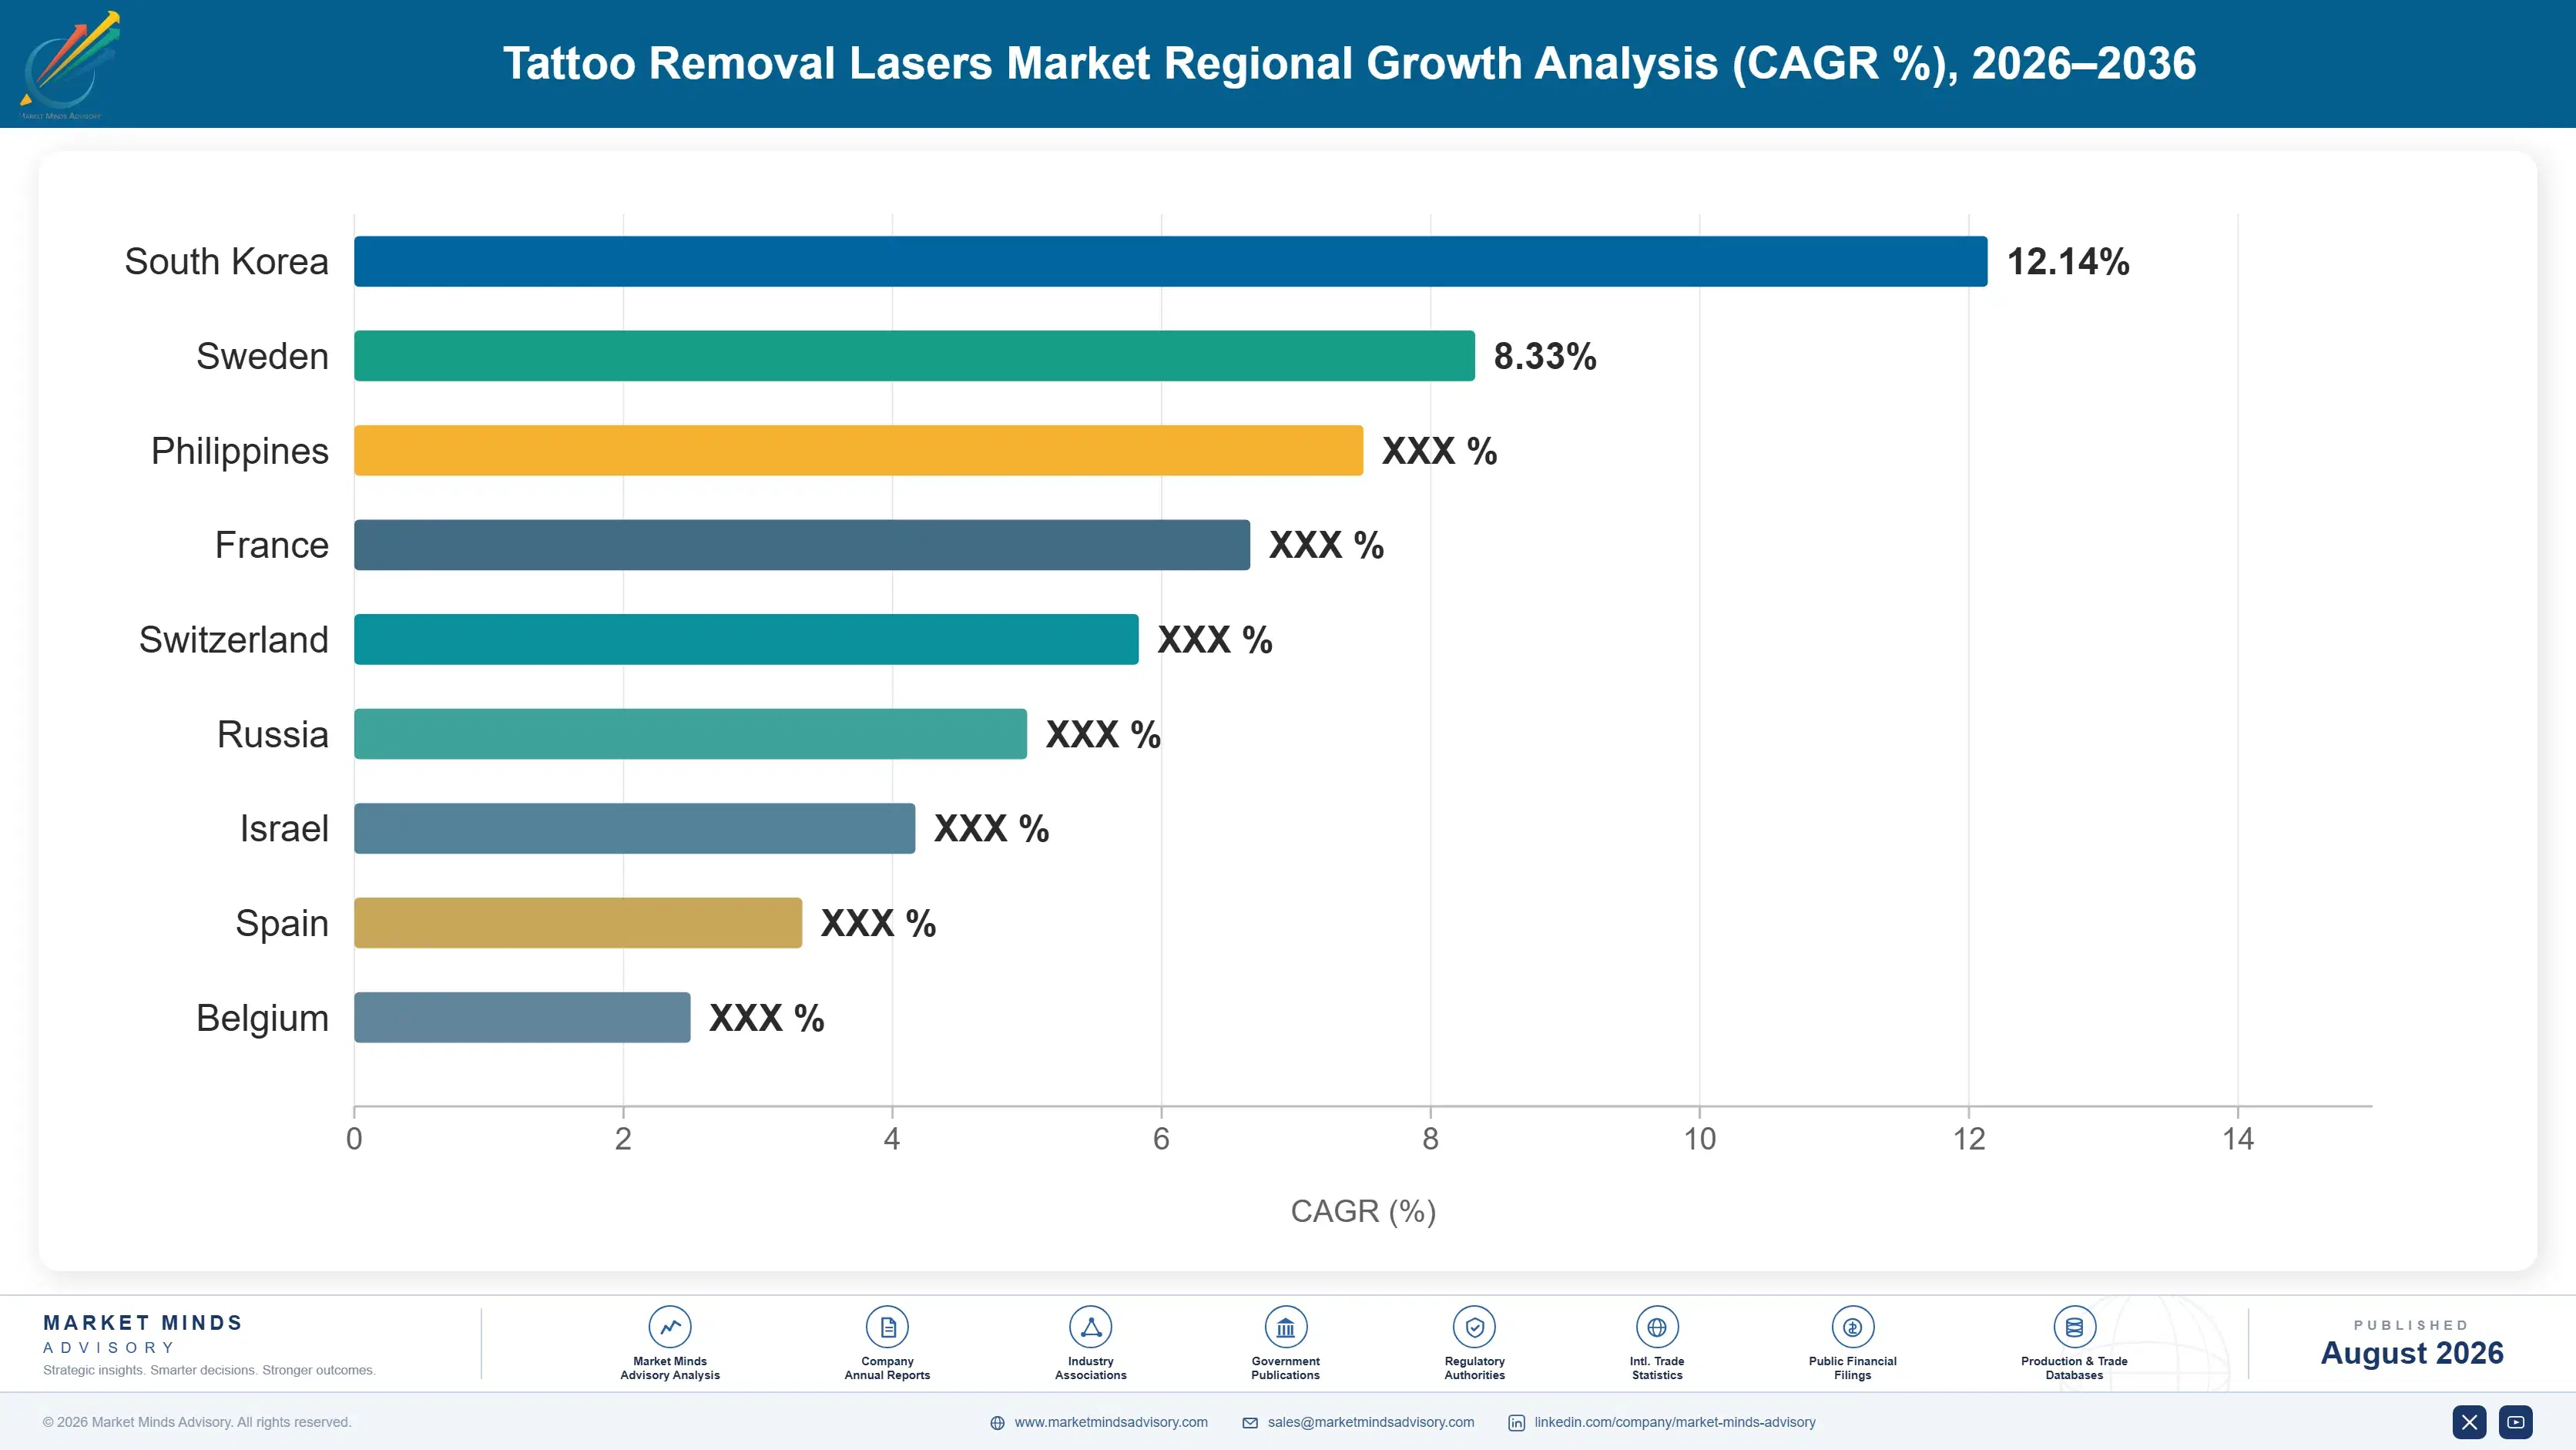
Regional Architecture and Country Demand Map

North America holds 32% of value because aesthetic device spending per head and tattoo prevalence are both the highest anywhere, and clinics there adopt higher specification platforms considerably earlier than other markets. South Asia and Pacific grows fastest of the seven regions covered here. All shares hold band.

North America

Aesthetic device spending per head is the highest anywhere and tattoo prevalence across the adult population exceeds most other markets, which together produce the largest removal demand base in the world. Medical spa proliferation has widened the buyer base considerably beyond dermatology practices, though it has also pushed the typical purchaser toward smaller businesses financing equipment rather than institutions with capital budgets. Package pricing is more common here than elsewhere, which eases the revenue objection to picosecond adoption. Growth at 8.4% reflects a mature and well equipped clinic base. Medical spa buyers finance rather than purchase in most cases, which makes payment structure decisive. Package pricing is more established here than elsewhere, which eases the objection considerably.
Share: 32% | CAGR: 8.4% (2026 to 2036)

Western Europe

Regulatory restriction of certain tattoo ink pigments from 2022 changed the chemistry of inks being applied across the region, which will eventually alter the removal population though it affects almost none of the tattoos currently being treated. Clinic regulation is stricter than in North America and practitioner qualification requirements limit how widely devices are placed. Package pricing is less established, which sharpens the revenue objection to faster clearing systems. Growth of 7.8% is the slowest anywhere on regulatory constraint and a mature installed base together. Practitioner qualification rules also limit how widely systems can be placed, which narrows the addressable buyer base relative to population. Picosecond adoption concentrates among premium urban practices rather than spreading through the mid market.
Share: 22% | CAGR: 7.8% (2026 to 2036)
Regional intelligence for 5 additional markets available in the complete report: East Asia, South Asia and Pacific, Latin America, Middle East and Africa, Eastern Europe. Contact sales@marketmindsadvisory.com.
tattoo-removal-lasers-market-country-cagr-analysis-1787639703787

Four Moves for a Clinic Balance Sheet

The clinical case for faster clearance is settled and it keeps failing to close sales, because a clinic billing per session earns less from a shorter course. Everything worth doing here addresses the buyer's revenue model, the monthly payment, the utilisation across indications, or the uncertainty the practitioner carries alone. None of them is a clinical argument.

Sell the repricing model alongside the device

A picosecond system clears in around 38% fewer sessions and a clinic billing per treatment loses revenue for it, which is why the clinical argument alone does not close. Manufacturers who help practices move to package or outcome pricing remove the objection rather than arguing past it. That is business consulting rather than device selling, it costs very little to provide, and almost nobody in this industry currently offers it to the mid market practices that need it most. The practices already buying picosecond systems repriced first, and they did it without any help.
Market Impact: Offsets the full 38% reduction in session count

Compete on monthly payment rather than capital price

Around 71% of systems are acquired through leasing because the buyer is a small business rather than an institution, which makes the monthly payment the number that actually decides the purchase. A picosecond platform at roughly 2.6 times the capital cost can still win on payment terms, placement structures or per treatment billing. Manufacturers quoting list price to a clinic owner are answering a question that owner is not the one asking. Placement and per treatment structures reach clinics that a capital sale simply cannot, and they align the manufacturer's revenue with utilisation rather than with a single transaction.
Market Impact: Reaches the 71% of purchases that are financed

Build utilisation across indications into the sale

A clinic needs a financed system earning across a treatment room's whole schedule, which is why combination platforms grow at 11.2% while single indication devices struggle. Presenting expected utilisation across pigmented lesions, vascular work and revitalisation alongside tattoo removal reframes the payback calculation entirely. Tattoo removal volume alone rarely supports a monthly payment in a mid market practice, and manufacturers who present it that way are setting the clinic up to be disappointed. Tattoo removal alone supports a treatment room in only a minority of practices, which manufacturers rarely acknowledge when presenting a payback case.
Market Impact: Serves the 11.2% growth in combination platform sales

Take the ink uncertainty off the practitioner

Practitioners know the pigment chemistry in only around 12% of cases, so a course of nine sessions is an estimate and every overrun lands on the clinic rather than on the manufacturer. Test protocols, treatment planning tools and outcome guidance shift some of that burden back to the party making the performance claim. It is the single most useful non-clinical support a manufacturer could offer and remarkably few of them provide anything resembling it. Shifting part of that burden back to the manufacturer is the single most useful non-clinical support available, and remarkably few provide anything resembling it.
Market Impact: Addresses the 88% of ink chemistry left unknown

Who Controls the Margin Pool

Participation is measured on annual system units shipped into tattoo and pigmented lesion applications, and the top five hold 44%. Concentration is moderate because regulatory clearance and clinical evidence create genuine barriers while laser manufacture itself does not. Cynosure Lutronic and Candela lead through clinical evidence depth and clinic distribution reach rather than through any advantage in laser engineering. The gap to challengers is evidence and distribution rather than engineering.
Competition runs on three fronts. Clinical evidence and regulatory clearance decide which indications a system can be marketed for at all. Distribution and financing capability decide access to the small clinic buyers who make up most of the market. And capital cost decides entry level and nanosecond volume, where Korean and Chinese manufacturers compete effectively. Commercial model design has become a fourth front, and it is where accounts are now being won and lost.

Pressure ahead comes from picosecond technology becoming available from lower cost manufacturers, and from clinic financing conditions constraining capital spending. Expect suppliers offering placement and per treatment models to gain share among mid market practices. Rankings shift on who solves the clinic revenue objection first. Concentration should fall as lower cost picosecond capability spreads.
tattoo-removal-lasers-market-company-positioning-matrix-1787639704339

Competitive Moat and Risk Dimensions

CYNOSURE LUTRONIC

Moat: Clinical evidence and clearance breadth

Regulatory clearances across a wide range of indications combined with published clinical evidence let the company market platforms for the multiple uses a financed clinic actually needs, which a narrower competitor cannot claim without repeating years of trial work. That breadth also supports the utilisation argument that decides most purchases in mid market practices financing equipment over several years.
CYNOSURE LUTRONIC

Risk: Small clinic financing sensitivity

Most buyers are small clinics acquiring systems on lease rather than institutions with capital budgets, which ties demand to financing conditions rather than to clinical merit or patient volume. Higher borrowing costs suppress purchases regardless of how compelling the evidence base happens to be, and no product improvement addresses that in any way.
CANDELA

Moat: Distribution reach and platform range

Distribution across dermatology practices, medical spas and clinic groups in most major markets reaches a fragmented buyer base that a manufacturer selling directly cannot cover economically. Combined with a platform range spanning entry level to picosecond systems, that lets the business serve a clinic through its whole growth path rather than at one point in it.
CANDELA

Risk: Low cost picosecond competition

Picosecond capability is becoming available from Korean and Chinese manufacturers at capital costs well below established western pricing, which compresses the premium that has justified the technology's position. That competition arrives fastest in exactly the price sensitive mid market where financing constraints already make purchasers most attentive to capital cost.

Players Tracked

Prominent Players

Cynosure Lutronic
Candela
Cutera
Lumenis
Alma Lasers

Other Key Players

Fotona
Astanza Laser
Quanta System
Bison Medical
Won Tech
Jeisys Medical
Aerolase
Lynton Lasers
Asclepion Laser Technologies
Deka
InMode
Sciton
Beijing Nubway
Sincoheren
Chengdu Ruikang

Recent Developments

MARCH 2026

Clinic group moves tattoo removal to package pricing before upgrading

A clinic group restructured tattoo removal onto package pricing based on outcome rather than session count, then upgraded to picosecond systems once the revenue model no longer penalised faster clearance across its treatment rooms. No manufacturer had assisted with the pricing transition at any point in the process.
Signal: The pricing change had to come first, which is the sequence manufacturers rarely help with at all
SEPTEMBER 2025

Manufacturer introduces per treatment billing for picosecond placement

A device manufacturer introduced per treatment billing on placed picosecond systems, removing the capital hurdle for clinics unable to finance a purchase at roughly 2.6 times nanosecond pricing and aligning its own revenue with clinic utilisation. Utilisation rather than a single transaction now drives the manufacturer's revenue from those placements.
Signal: Placement models reach the small clinic buyers that outright capital sales simply cannot reach at all
JANUARY 2026

Practitioner survey finds ink composition unknown in most treatments

A practitioner survey found pigment composition identifiable in only a small minority of tattoos presented for removal, confirming that session estimates are made against genuine uncertainty rather than any clinical assessment of the ink itself. Practitioners reported quoting conservatively to protect themselves against overruns. Test patching was widely used.
Signal: Session counts are estimates and the practitioner carries the consequence of getting them wrong every single time

Optics, Modules and Clearance

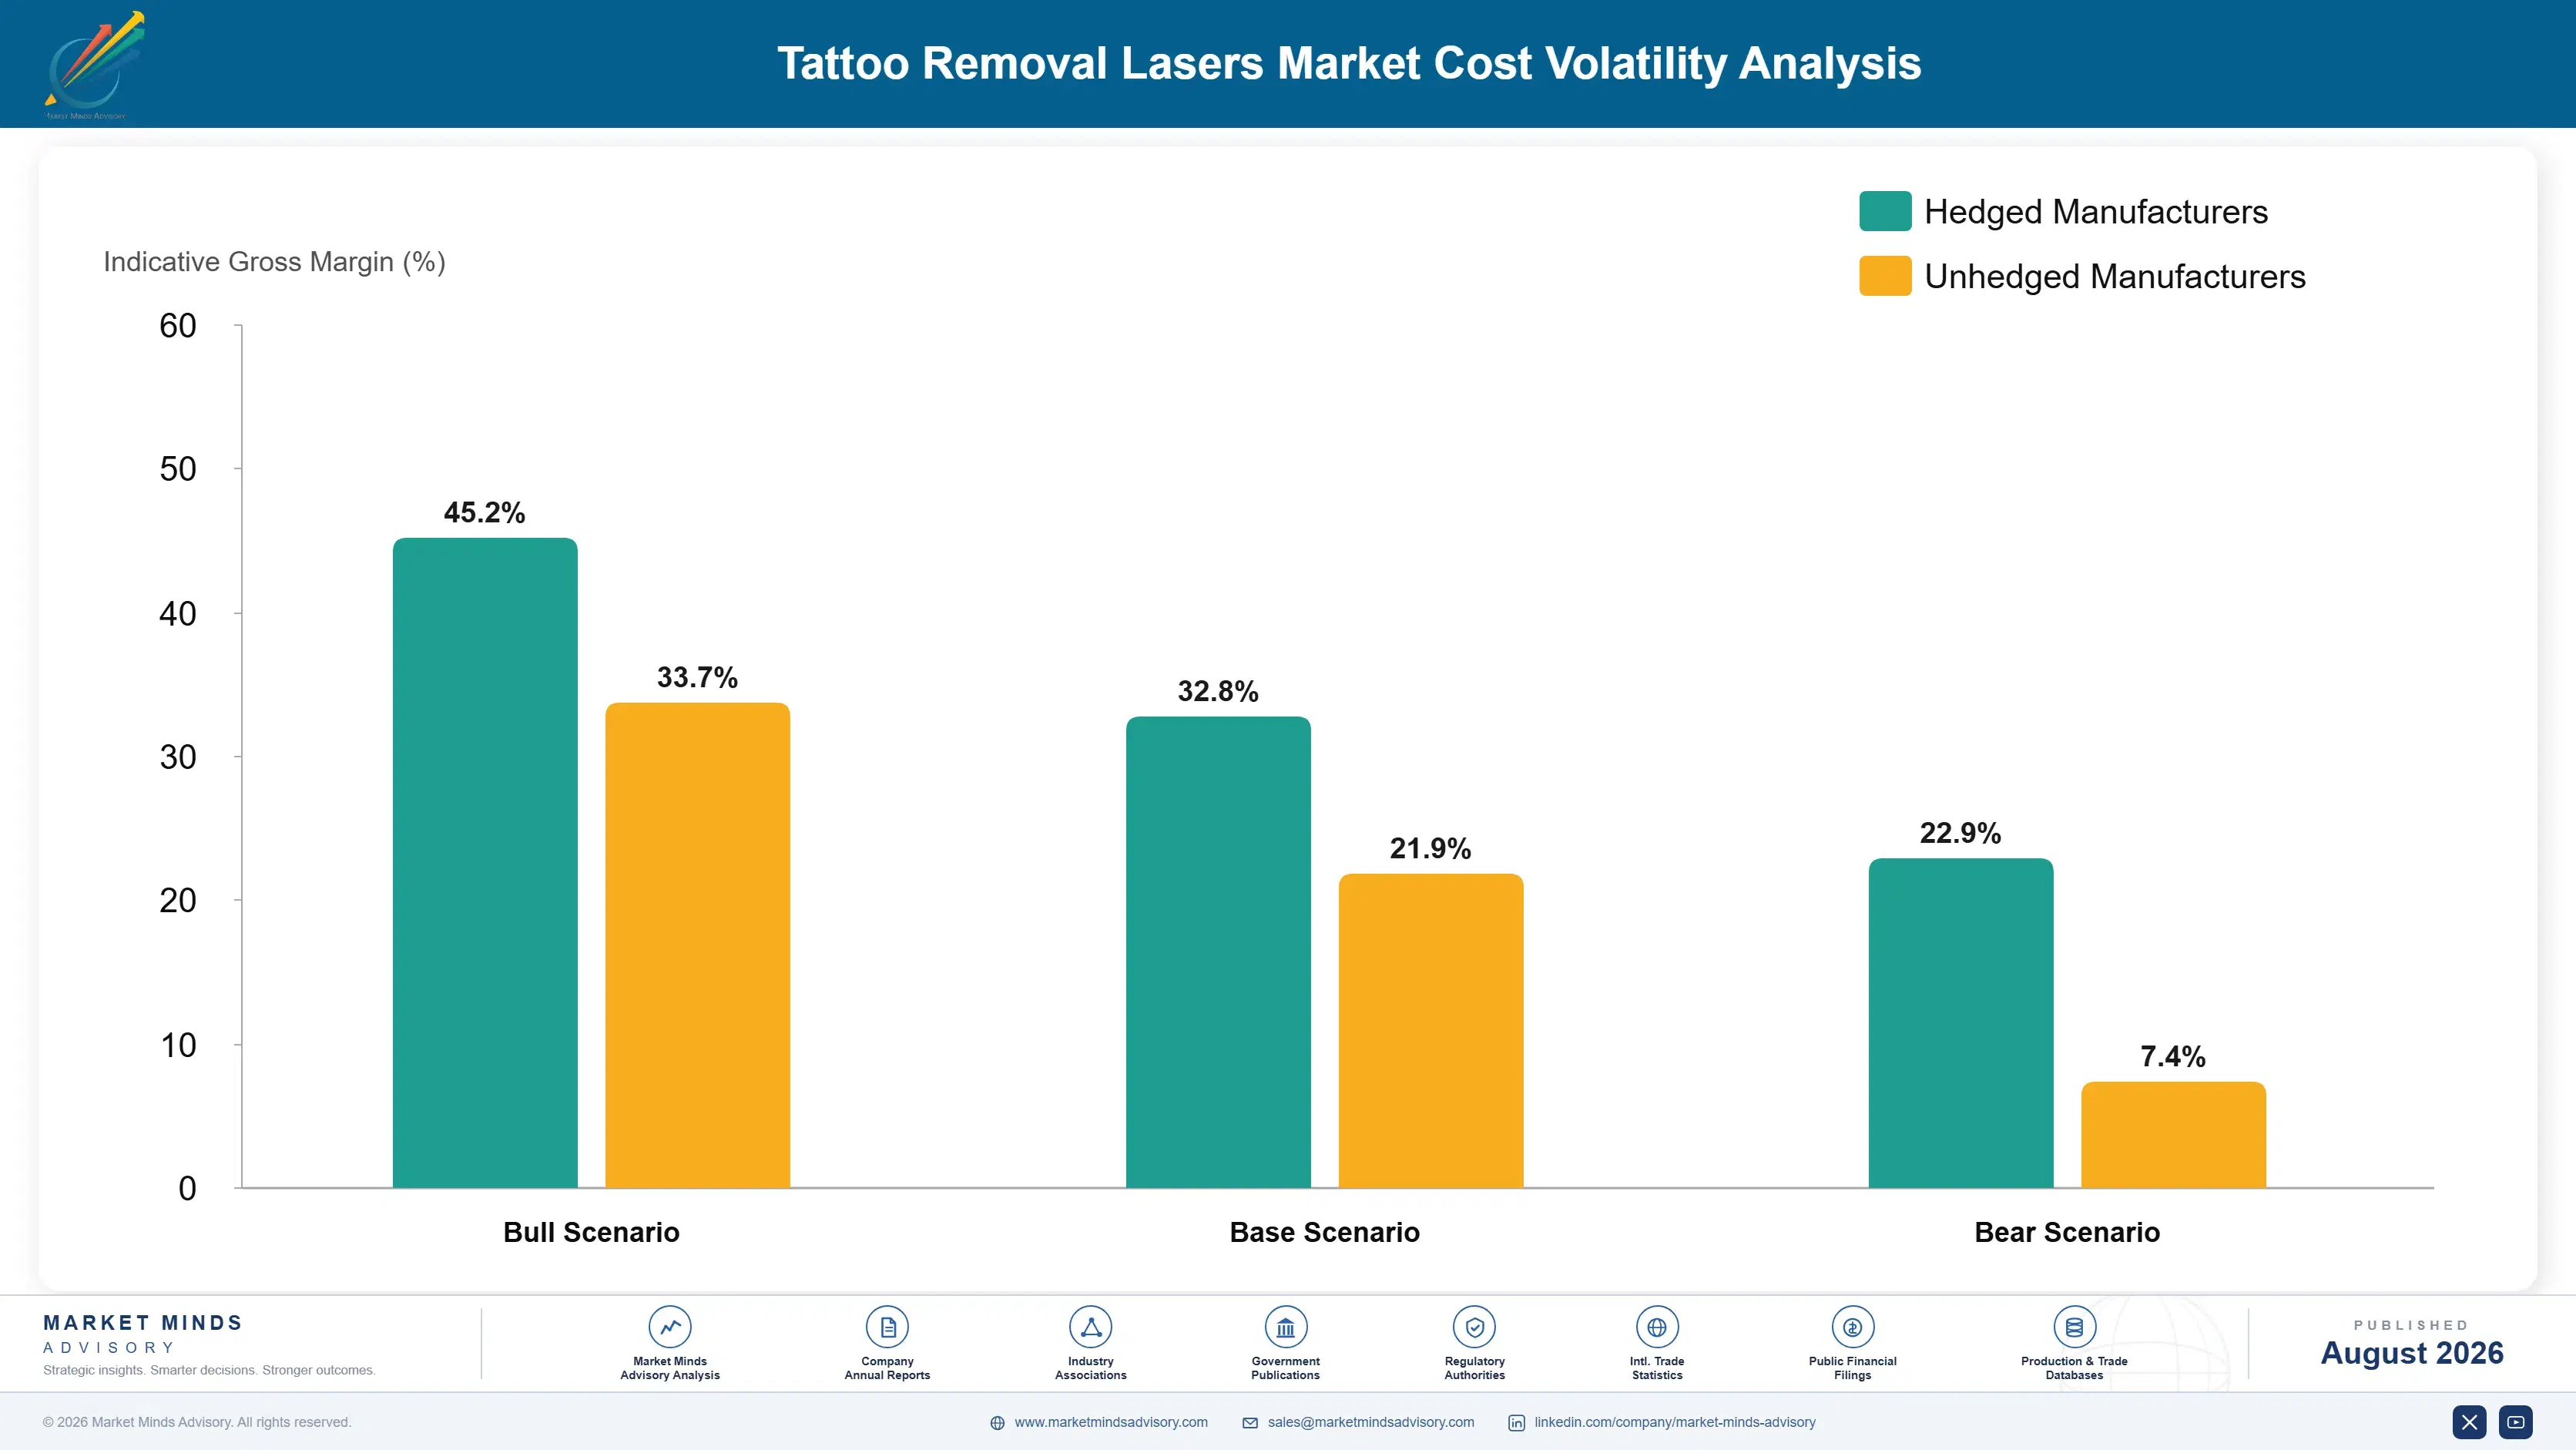
Laser modules, crystals and optical components carry around 37% of system cost, sourced from a small group of specialist suppliers with limited alternatives available. Power supplies, cooling systems and chassis take about 19%. Control electronics, software and user interface development account for around 14%. Regulatory clearance, clinical evidence generation, quality systems, service infrastructure and distribution margin absorb the balance across most manufacturers.
Specialist optical component availability tightened through recent years alongside broader electronics supply constraints, per published medical device sector reporting and Cutera and Lumenis annual reporting for 2025 on component and supply chain exposure. Manufacturers holding allocation with crystal and laser module suppliers shipped while others could not, and lead times on picosecond specific components extended well beyond normal planning horizons. Allocation discipline has become considerably more common across the industry since then.

Exposure divides on technology and on regulatory footprint rather than on manufacturing scale. A picosecond manufacturer carries more expensive and less available optical components than a nanosecond producer does. A manufacturer holding clearances across many indications and markets carries a substantial fixed regulatory cost that a single market entrant avoids entirely, which is why smaller manufacturers concentrate on fewer jurisdictions deliberately.
tattoo-removal-lasers-market-cost-volatility-analysis-1787639704538

Hold allocation agreements with specialist optical suppliers

Laser crystals and picosecond specific optical components come from very few suppliers and availability rather than price stopped shipments during the last constraint. Allocation agreements sized against committed production protect delivery when competitors cannot ship at all, which matters more in a market where a clinic waiting for a system will simply buy another one.

Amortise regulatory clearance across a broader platform range

Clearance and clinical evidence are fixed costs that do not scale with unit volume, which disadvantages manufacturers holding narrow ranges in many jurisdictions. Building platforms that share regulatory files across indications and models spreads that cost across more revenue and supports the utilisation argument that clinic buyers actually respond to. Shared files spread the cost across more revenue.

Shift revenue toward service and per treatment billing

Capital sales concentrate revenue at a point where small clinic financing capacity binds hardest, while service contracts and per treatment billing spread it across the system's operating life. That smooths revenue against financing cycles and reaches buyers who cannot fund a purchase at roughly 2.6 times nanosecond capital cost. It also smooths revenue across financing cycles.

Portfolio Architecture for Margin Defence

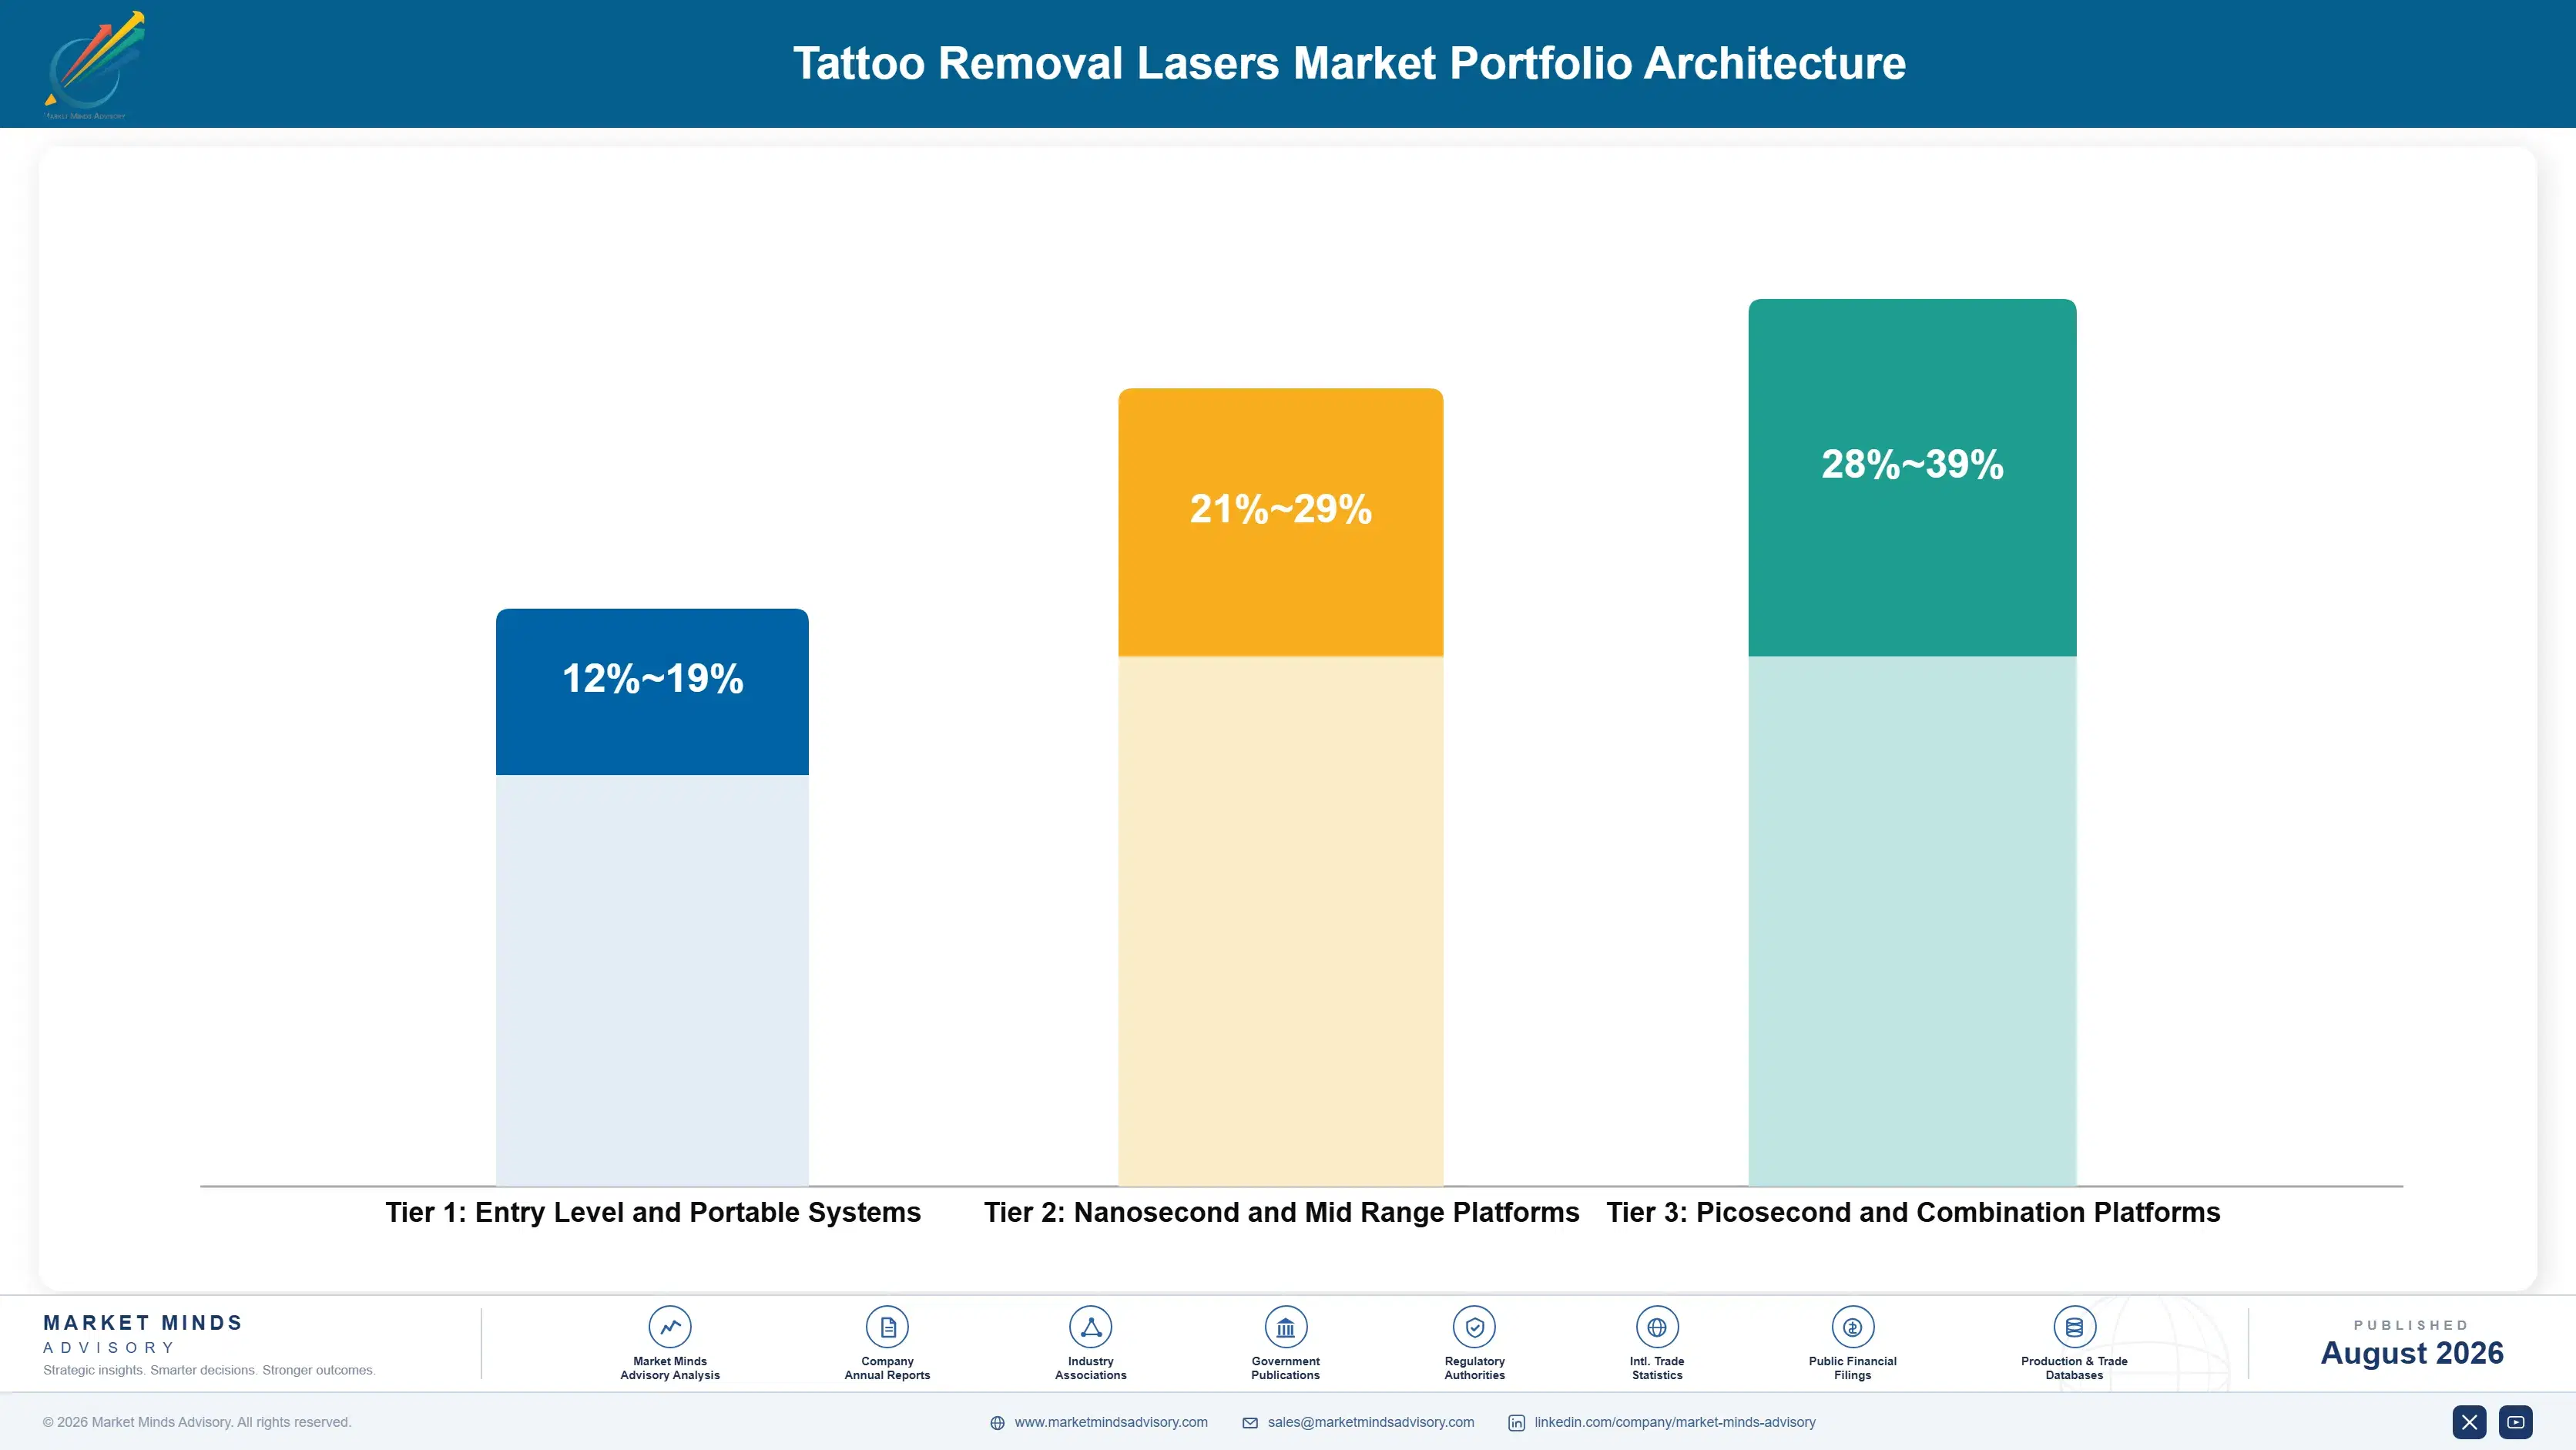
Margin here follows how the system is sold rather than what it does, because a capital sale to a financed small business and a placement with per treatment billing produce entirely different economics from identical hardware. Entry level and portable systems earn margins in the low to high teens, where Korean and Chinese manufacturers compete on capital cost and clinics compare specifications directly. Hardware specification is the whole comparison there.
Nanosecond and mid range platforms do better in the low to high twenties, because clinical evidence, service infrastructure and distribution support all matter to a buyer who cannot afford downtime on a financed asset, and those things narrow the field beyond what the hardware comparison alone would suggest. Downtime on a financed asset is expensive enough that service reputation frequently decides these purchases outright.

Picosecond and combination platforms hold the strongest position, reaching into the high thirties, where clearance breadth, utilisation across indications and outcome performance justify capital pricing at roughly 2.6 times nanosecond systems. Those margins reflect regulatory position and clinical evidence rather than any advantage in optical component cost or assembly efficiency. Very few manufacturers help a clinic reprice, which is what would actually justify the premium.

Entry Level and Portable Systems

Lower specification systems compared on capital cost by price sensitive clinics. The seven point range reflects manufacturing cost and distribution structure rather than any meaningful difference in clinical performance delivered.
Gross Margin: 12-19%

Nanosecond and Mid Range Platforms

Established platforms where clinical evidence and service infrastructure matter to a financed buyer. The eight point range reflects clearance breadth and how much downtime risk the clinic is prepared to carry.
Gross Margin: 21-29%

Picosecond and Combination Platforms

High specification systems justifying capital premiums through outcome and utilisation across indications. The eleven point range reflects clearance breadth and whether the manufacturer helps the clinic reprice its own service.
Gross Margin: 28-39%
tattoo-removal-lasers-market-portfolio-architecture-1787639705048

High-value Sub-segments and Strategic Watch-out

Picosecond Platform Supply

High value and the fastest growth at 14.1%, clearing tattoos in around 38% fewer sessions and handling pigments nanosecond systems leave behind. Lower cost competition is arriving fastest in the price sensitive mid market. Repricing has to happen first for the economics to work. Few help.
Gross Margin: 30-39%

Combination Platform Supply

High value and growing at 11.2% because a financed clinic needs a system earning across a whole treatment room schedule. Utilisation across indications decides these purchases far more than tattoo clearance data does. Single indication devices increasingly struggle to justify a monthly payment. Utilisation decides it.
Gross Margin: 28-36%

Entry Level System Supply

The volume core, compared on capital cost by clinics whose financing capacity binds hardest and where Korean and Chinese manufacturers now compete effectively on specification as well as price. Financing capacity binds hardest in exactly this segment. Korean and Chinese systems compete effectively on specification now.
Gross Margin: 12-19%

Clinic Revenue Model Exposure

The strategic watch-out. Faster clearance reduces per session revenue for most buyers, and the range reflects whether a manufacturer helps clinics reprice or simply presents clinical data and hopes. Clinical data alone does not answer the objection at all. Repricing support is what actually removes the barrier.
Gross Margin: 10-37%

Small Businesses With Lease Agreements

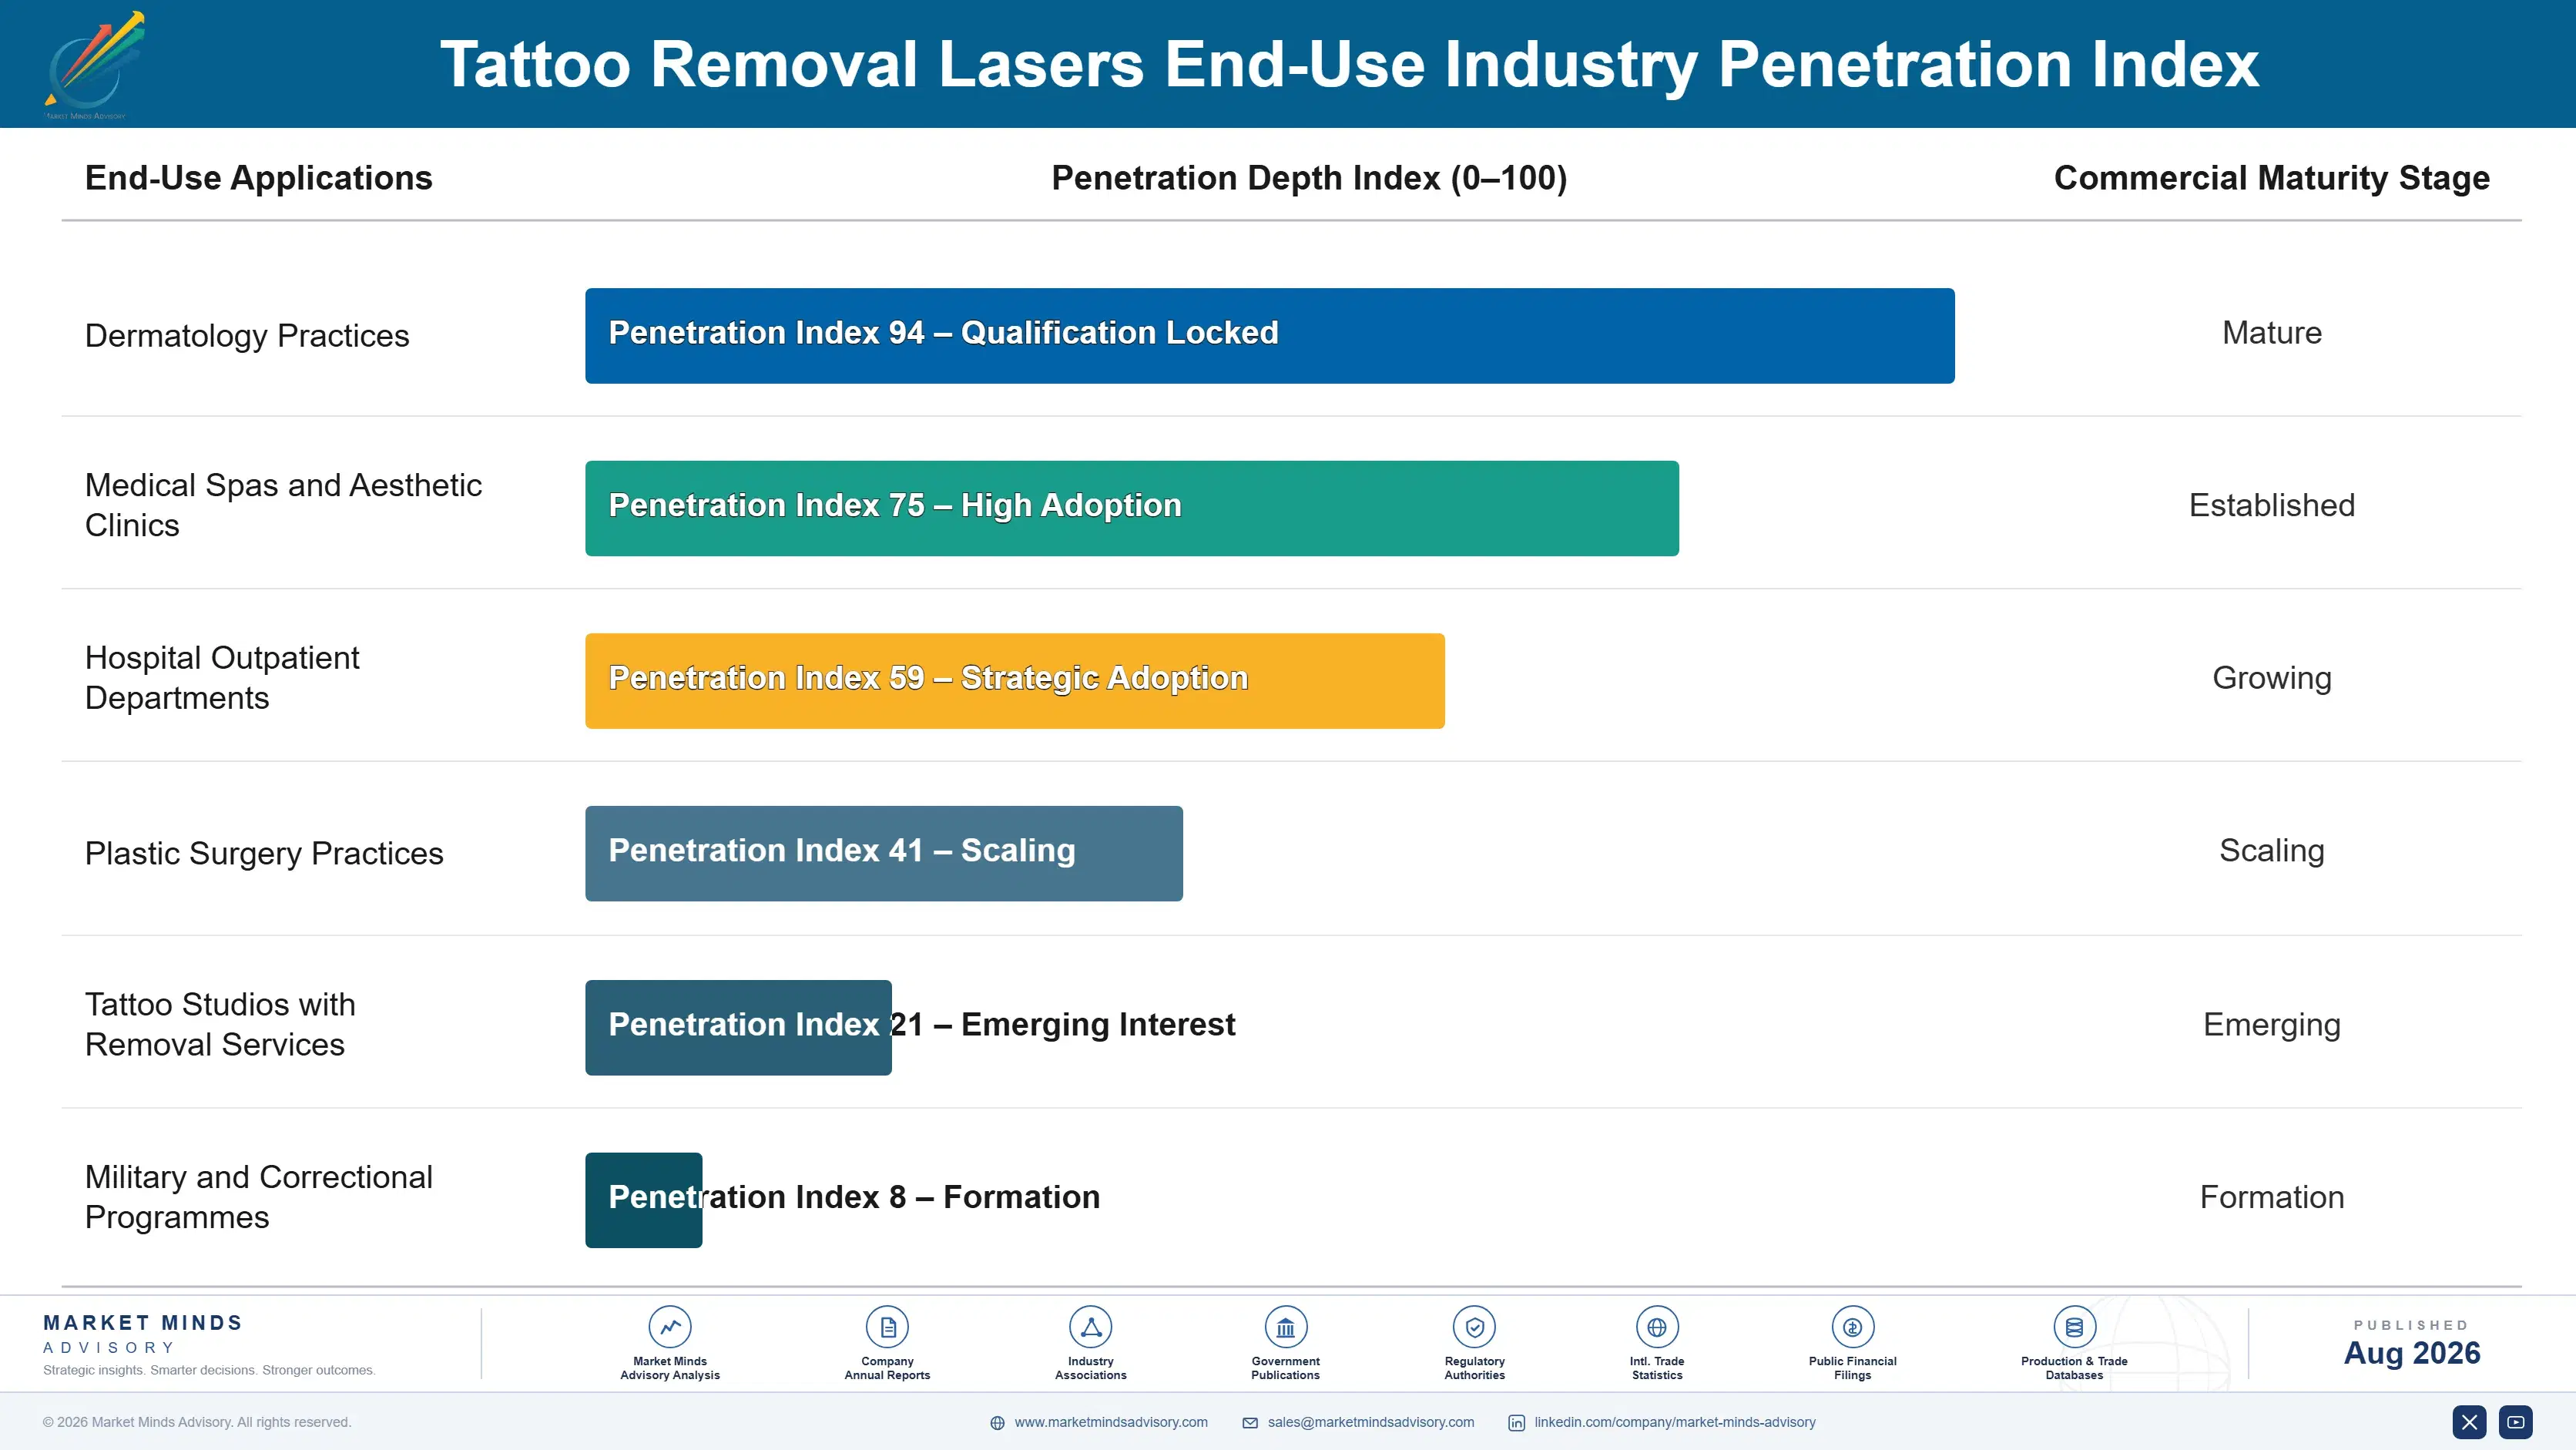
Demand comes overwhelmingly from small businesses rather than institutions, which shapes everything about how these systems are bought. A medical spa or single practitioner clinic finances a system over several years and evaluates it as a monthly payment against expected treatment room utilisation. Hospital and large group purchasing exists and represents a minority of units, behaving quite differently from the rest of the market.
Stickiness follows the financing term rather than any preference. A clinic on a multi-year lease is committed regardless of what appears afterwards, which makes the purchase moment unusually decisive and the replacement cycle predictable. Service relationships hold beyond the lease because downtime on a financed asset is expensive. Consumables and handpieces create a smaller recurring stream than in many device categories.

The deciding voices are also unusual. In a small clinic the practitioner and the owner are frequently the same person, weighing a clinical argument and a cash flow argument simultaneously and resolving them alone. In larger groups those roles separate, and the clinical case then has to survive a finance function that reads faster clearance as reduced revenue per patient rather than as better care.
tattoo-removal-lasers-market-end-use-penetration-index-1787639705563

Where We Would Put Effort

These are among the four positions where our research anticipates prominent divergence between winners and laggards over the coming forecast period. Each is grounded in the demand model, the regulatory perimeter, and the announced capacity pipeline.
01 / REVENUE MODEL SUPPORT

Help them reprice before you sell

A picosecond system clears a tattoo in around 38% fewer sessions and a clinic billing per treatment therefore earns less from every patient it takes on, which is why the clinical argument keeps failing to close the sale. Manufacturers who help practices move to package or outcome based pricing remove that objection instead of arguing past it. It is business consulting rather than device selling, it costs very little to provide, and virtually nobody in the industry currently offers it.
02 / FINANCING STRUCTURE COMPETITION

The monthly payment is the price

Around 71% of these systems are acquired through leasing because the buyer is generally a small clinic rather than an institution with a capital budget of its own to allocate. That makes the monthly payment the number deciding the purchase, and a picosecond platform at roughly 2.6 times capital cost can still win on payment structure, placement terms or per treatment billing. Manufacturers quoting a list price are answering a question that the clinic owner never actually asked them at all.
03 / UTILISATION CASE BUILDING

Tattoos alone will not fill a room

A financed system has to earn its keep across a treatment room's whole weekly schedule, which is exactly why combination platforms grow at 11.2% against a market rate of 9.4% while single indication devices increasingly struggle. Presenting the expected utilisation across pigmented lesions, vascular work and skin revitalisation alongside tattoo removal reframes the payback calculation completely and rather more favourably. Manufacturers presenting tattoo removal volume alone are setting a clinic up for a disappointment that will damage the relationship afterwards.
04 / INK UNCERTAINTY SUPPORT

Stop leaving the practitioner exposed

Practitioners can identify the pigment chemistry in only around 12% of tattoos presented for removal, so a course of nine sessions is an estimate and every single overrun then lands on the clinic rather than on the manufacturer making the performance claim. Test protocols, treatment planning tools and structured outcome guidance would shift part of that burden back to where it properly belongs. It is easily the most useful non-clinical support available and remarkably few manufacturers provide anything resembling it.

Engagement Snapshot From the Field

A live engagement with an industry participant carrying material or product regulatory and market exposure ahead of a defining policy shift, showing how our research translates into a defensible multi-year portfolio strategy.
MARKET MINDS ADVISORY · CLIENT ENGAGEMENT SUMMARY
Tattoo Removal Lasers Producer Strategic Portfolio Review and Transition Roadmap 2026·Investment Scenario on Tattoo Removal Lasers Exposure Evaluation 2025-26
CLIENT PROFILE
An aesthetic laser manufacturer selling nanosecond and picosecond tattoo removal platforms into clinics and medical spas across European and North American markets, at annual revenue near 84 million dollars (client-reported, unverified by MMA). Sales were organised around clinical evidence presentation and outright capital purchase. No placement or per treatment options were offered. Conversion was not analysed.
STRATEGIC CHALLENGE
Picosecond conversion rates were far below expectation despite strong clinical data and enthusiastic practitioner feedback, and competitors offering placement arrangements were winning accounts the business had spent months developing. Management could not explain the gap between clinical enthusiasm and purchase decisions. A commercial review was already underway. A decision was due.
MMA APPROACH
MMA interviewed clinics that had evaluated and declined the client's picosecond platforms, modelled clinic revenue under session and package pricing at different clearance rates, assessed financing structures offered across the competitive set, and quantified how far tattoo removal alone could support a treatment room. Interviews with 47 experts covered aesthetic practice management, dermatology and device financing.
KEY FINDINGS
  1. Clinics that declined the platform had almost universally understood and accepted the clinical case, then calculated that faster clearance would reduce revenue per patient under their existing session based pricing.
  2. Practices that had adopted picosecond systems had generally moved to package or outcome pricing beforehand, and none had received any help from a manufacturer in making that transition.
  3. Competitors winning accounts were offering placement and per treatment billing rather than better clinical data, which reached clinics whose financing capacity could not support a capital purchase.
  4. Tattoo removal volume alone supported a treatment room in only a minority of the practices examined, which meant single indication positioning was misjudging the utilisation case badly.
CLIENT PROFILE
An aesthetic laser manufacturer selling nanosecond and picosecond tattoo removal platforms into clinics and medical spas across European and North American markets, at annual revenue near 84 million dollars (client-reported, unverified by MMA). Sales were organised around clinical evidence presentation and outright capital purchase. No placement or per treatment options were offered. Conversion was not analysed.
STRATEGIC CHALLENGE
Picosecond conversion rates were far below expectation despite strong clinical data and enthusiastic practitioner feedback, and competitors offering placement arrangements were winning accounts the business had spent months developing. Management could not explain the gap between clinical enthusiasm and purchase decisions. A commercial review was already underway. A decision was due.
MMA APPROACH
MMA interviewed clinics that had evaluated and declined the client's picosecond platforms, modelled clinic revenue under session and package pricing at different clearance rates, assessed financing structures offered across the competitive set, and quantified how far tattoo removal alone could support a treatment room. Interviews with 47 experts covered aesthetic practice management, dermatology and device financing.
KEY FINDINGS
  1. Clinics that declined the platform had almost universally understood and accepted the clinical case, then calculated that faster clearance would reduce revenue per patient under their existing session based pricing.
  2. Practices that had adopted picosecond systems had generally moved to package or outcome pricing beforehand, and none had received any help from a manufacturer in making that transition.
  3. Competitors winning accounts were offering placement and per treatment billing rather than better clinical data, which reached clinics whose financing capacity could not support a capital purchase.
  4. Tattoo removal volume alone supported a treatment room in only a minority of the practices examined, which meant single indication positioning was misjudging the utilisation case badly.
RECOMMENDED STRATEGY
Phase 1: Phase one: build pricing model support for clinics, helping practices move to package pricing before the faster clearance argument is made to them at all. Phase 2: Phase two: introduce placement and per treatment billing structures, since around seven systems in ten are financed rather than purchased outright. Phase 3: Phase three: reposition picosecond platforms on utilisation across indications rather than on tattoo clearance performance alone. Utilisation is the real payback case.
OUTCOME
The manufacturer introduced placement arrangements and clinic pricing support during 2026, reporting picosecond conversion improving materially among practices offered both (client-reported, unverified by MMA). Clinical evidence presentation was retained but repositioned behind the commercial argument. Capital only selling was discontinued for mid market accounts. Placement volumes grew steadily.

Frequently Asked Questions

Foundational context covering the market sizes, CAGR, scope, country, region and competition that inform every finding below. This section is provided to cover basics and most often pre-purchase conversations, answered from the MMA Primary Research Dataset.

What is the current size of the Tattoo Removal Lasers Market?

MMA sizes it at USD 0.34 billion in 2025, rising to USD 0.37 billion in 2026. The figure covers laser systems for tattoo and pigmented lesion removal at manufacturer selling value.

How large will the Tattoo Removal Lasers Market be by 2036?

USD 0.91 billion by 2036, an incremental USD 0.54 billion over the 2026 base and an expansion multiple of 2.46 times. Picosecond systems account for a disproportionate share.

What is the CAGR for the Tattoo Removal Lasers Market 2026 to 2036?

9.4% in the base case, with a bull case at 10.6% and a bear case at 8.2%. The spread turns largely on clinic repricing behaviour and on equipment financing conditions.

Which segment is growing fastest?

Picosecond systems at 14.1%, half again the market rate of 9.4%. They clear tattoos in around 38% fewer sessions and handle pigments that nanosecond systems frequently leave behind.

Who are the major companies in the Tattoo Removal Lasers Market?

Cynosure Lutronic, Candela, Cutera, Lumenis and Alma Lasers lead on system units shipped. Fifteen further participants are profiled in the full report on that same basis.

Which country is growing fastest?

Brazil at 13.8%, combining unusually high tattoo prevalence with a dense and competitive aesthetic clinic sector where device adoption is itself a differentiation strategy. Removal follows application.

Report Segmentation Architecture

The full report scope spans multiple orthogonal segmentation dimensions, with cross-tabulated demand data provided for each dimension pair. Coverage extends further to regional breakdowns, trend trajectories, and the competitive detail needed to support segment-level decision-making.

By Laser Technology

  • Q-Switched Nanosecond Neodymium Systems
  • Picosecond Neodymium and Alexandrite Systems
  • Q-Switched Ruby and Alexandrite Systems
  • Multi-Wavelength Combination Platforms
  • Fractional and Adjunct Laser Devices
  • Portable and Entry-Level Systems

By End-Use Industry

  • Dermatology Practices
  • Medical Spas and Aesthetic Clinics
  • Hospital Outpatient Departments
  • Plastic Surgery Practices
  • Tattoo Studios with Removal Services
  • Military and Correctional Programmes

By Commercial Dimension

  • Direct Capital Sales
  • Distributor and Dealer Channels
  • Leasing and Financing Arrangements
  • Placement and Per Treatment Billing
  • Service and Maintenance Contracts
  • Export and Cross-Border Supply

By Region

  • North America
  • Western Europe
  • East Asia
  • South Asia and Pacific
  • Latin America
  • Middle East and Africa
  • Eastern Europe

Scope, Methodology, and Coverage

Every figure in this report is reproducible from documented input assumptions. The scope below maps the historical period, the forecast horizon, the segmentation dimensions, and the countries covered, alongside the underlying primary and qualitative methodology.
Historical Period
2020 to 2025
Forecast Period
2026 to 2036
Base Year
2025 (USD billions; MMA Primary Research Dataset, August 2026)
Market Definition
Laser systems and platforms used for tattoo and pigmented lesion removal, covering Q-switched nanosecond neodymium systems, picosecond neodymium and alexandrite systems, Q-switched ruby and alexandrite systems, multi-wavelength combination platforms, fractional and adjunct laser devices, and portable and entry-level systems. Measured at manufacturer selling value including handpieces supplied with the system. Hair removal and skin resurfacing devices sold without tattoo indications, topical removal products, surgical excision, consumable creams and aftercare, and clinical services are excluded from scope.
Quantitative Units
USD billions (current prices); system units shipped; USD per system by technology class
Segmentation Dimensions
Laser technology; clinical setting; commercial dimension; region
Regions Covered
North America, Western Europe, East Asia, South Asia and Pacific, Latin America, Middle East and Africa, Eastern Europe
Countries Covered
United States, Canada, Mexico, United Kingdom, Germany, France, Italy, Spain, South Korea, Japan, China, Taiwan, India, Australia, Thailand, Brazil, Argentina, Colombia, United Arab Emirates, Poland
Key Companies Profiled
Cynosure Lutronic, Candela, Cutera, Lumenis, Alma Lasers, Fotona, Astanza Laser, Quanta System, Bison Medical, Won Tech, Jeisys Medical, Aerolase, Lynton Lasers, Asclepion Laser Technologies, Deka, InMode, Sciton, Beijing Nubway, Sincoheren, Chengdu Ruikang
Quantitative Methodology
Primary survey, n=3,800 respondents, Q4 2025, six countries; demand-side model with trade association cross-validation
Qualitative Methodology
47 expert interviews, Q4 2025; applied to validate demand model assumptions, identify emerging dynamics, and assess competitive positioning
Report Format
PDF and XLSX data workbook (Word format preview document)
Publisher
Market Minds Advisory
Report Code
MMA-2026-MED-118
Published
August 2026
Contact
sales@marketmindsadvisory.com | www.marketmindsadvisory.com

Purchase the full Tattoo Removal Lasers Market Report (2026 to 2036).

The full report examines why clinical superiority keeps failing to convert into sales, because a clinic billing per session earns less from a system that clears faster. It sizes all six technology classes independently through 2036, models clinic revenue under alternative pricing structures at different clearance rates, and quantifies how financing capacity shapes purchasing across a fragmented small business buyer base. Regional chapters cover all seven regions with clinic setting analysed alongside device specification. Competitive profiling covers 20 participants on one consistent unit basis. Repricing behaviour is analysed by practice type throughout.
Six laser technology classes sized independently through 2036
Clinic revenue modelled under session and package pricing structures
Financing and placement structures compared across the competitive set
Treatment room utilisation assessed by indication and practice type
Ink composition uncertainty quantified against session count variance
Twenty participants profiled on one consistent system unit basis

Built For The People Who Decide

From boardroom strategy to bench-side execution, this report is read cover-to-cover by leaders shaping the next decade of their industry, turning demand scenarios, market dynamics and valuation benchmarks into decisions.
CXOs/ Presidents/ VPs/ Managers
M&A and Corporate Development
Strategy Teams and R&D Heads
Procurement and Product Directors
Regulatory and Compliance Leaders
Investor Relations and Equity Analysts