Market Minds Advisory
Tablet Market

Tablet Market: Consumer and Enterprise Slate Computing Devices.

Enterprise device refresh cycles and education technology mandates are pulling tablets past the smartphone-adjacent commodity slump, rewarding manufacturers who bundle detachable keyboards and management software over those still chasing consumer replacement volume alone.

Lead Analyst

Published

September 2026

Make Smarter Decisions with Customized Research Insights

Request a free sample report and evaluate market opportunities, growth trends, and competitive dynamics relevant to your business needs.

2025 MARKET VALUE$45.0BMarket Size 2025
2036 FORECAST VALUE$69.3BBase Case , 2026 to 2036
CAGR 2026 TO 20364.0 %Bull 5.0% / Bear 3.0%
INCREMENTAL OPPORTUNITY$22.5BNet 10- year value creation
EXPANSION MULTIPLE1.48x2036 value over 2026 base
Strategic Levers
M&A Pipeline
Regional Outlook
Country Rankings
Competitive Intelligence
Segmental Deep-dive
Call-Us : 91 93563 13602

Executive Snapshot and Market Trajectory.

The tablet market has settled into genuine maturity after a decade of boom and correction, with replacement cycles and enterprise procurement now driving volume more than the first-time adoption surges that defined the category's early growth years, forcing manufacturers to compete on software platforms rather than hardware novelty alone.
Enterprise and education procurement cycles are the primary commercial force here, concentrating growth in North America and East Asia, where corporate device refresh budgets and government education technology mandates both run further ahead of consumer replacement demand than in most other regions worldwide. Detachable two-in-one devices and ruggedized enterprise tablets absorb a meaningfully growing share of unit volume, since both applications value productivity features that pure consumer media tablets rarely prioritize in their base configurations.
Competitive intensity concentrates overwhelmingly among two platform-owning manufacturers who together account for the large majority of category revenue, a structure considerably more concentrated than most consumer electronics categories maintain across their product lines. Falling average selling prices in the commodity Android tablet tier are pushing smaller manufacturers toward niche enterprise and education applications where differentiated software and support services still command a meaningful price premium.
Market Definition
The Tablet Market covers portable slate-format computing devices with touchscreen interfaces exceeding seven inches diagonally, including consumer media tablets, detachable two-in-one devices, and ruggedized enterprise tablets sold with or without attachable keyboard accessories. It excludes smartphones, laptop computers with permanently attached keyboards, and e-readers designed solely for text display without general-purpose application support.
Base Year Value
$45.0B in 2025 (MMA Primary Research Dataset, September 2026)
Forecast Period
2026 to 2036, eleven discrete annual values
CAGR
4.0% base case. Bull 5.0%. Bear 3.0%.
Fastest Growth Segment
Detachable 2-in-1 Tablets for Enterprise and Education Markets: 8.0% CAGR
Fastest Growth Country
India: 7.5% CAGR
Fastest Growth Region
South Asia and Pacific: 6.0% CAGR
Largest Region
East Asia: 30% of 2025 global value
Market Leaders
Apple, Samsung, Lenovo, Amazon, and Huawei lead the global Tablet Market. Source: MMA Primary Research Dataset, July 2026, and company disclosures.
Primary Survey
n=3,800 procurement and R&D decision-makers, Q4 2025, six countries
Methodology
Demand-side build-up, cross-validated against public data, 47 expert interviews

Tablet Market Forecast Scenarios

tablet-market-size-forecast-scenario-1790005322134
Tablet shipment volume swung sharply between 2020 and 2025, surging during pandemic-driven remote work and education demand before correcting as replacement cycles lengthened and consumer spending normalized across most developed markets worldwide. The historical growth rate of 4.0% reflects this volatile period settling into steadier, more predictable replacement-driven demand by the end of the historical window.
The base case rests on three commercial mechanisms: enterprise device refresh cycles replacing aging fleets with detachable two-in-one devices that support hybrid work productivity across distributed teams, education technology budgets sustaining steady procurement volume across primary and secondary school systems worldwide, and emerging market consumer adoption continuing to grow as smartphone-adjacent computing becomes more affordable across price-sensitive demographics. Together these offset slowing replacement demand in saturated developed consumer markets through 2036.
A bull scenario centers on artificial intelligence features driving an accelerated replacement cycle as manufacturers position new tablets around on-device AI capabilities that older hardware simply cannot support at all today. The principal bear risk is that smartphones with increasingly large screens continue cannibalizing tablet demand in price-sensitive markets where consumers cannot justify owning both device categories simultaneously.

Platform Lock-In Now Drives Tablet Purchase Decisions

Tablet economics now resemble smartphones more than traditional computers, with two platform owners capturing the majority of category profit through tightly integrated hardware, software, and app store revenue rather than device margin alone at the point of sale. This structure leaves independent Android manufacturers competing primarily on price in a segment where platform lock-in increasingly determines purchase decisions more than raw specifications.
MARKET CONCENTRATION (CR5)78%share held by the five largest tablet manufacturers
ENTERPRISE APPLICATION SHARE22%shipment volume flowing into enterprise and education procurement
AVERAGE REPLACEMENT CYCLE3.8 yearstypical time between successive consumer tablet upgrade purchases
TOP PRODUCING COUNTRY SHARE68%final assembly output concentrated within a single leading country
DETACHABLE FORM FACTOR SHARE31%shipment volume using keyboard-attachable rather than slate designs
DISPLAY PANEL COST SHARE26%total device cost attributable to touchscreen display components
Pricing spans an unusually wide range for a mature product category: entry-level consumer tablets sell for a small fraction of premium enterprise-grade devices with detachable keyboards and stylus support, reflecting genuinely different use cases rather than simple feature tiering across the product lineup and price points. Enterprise and education buyers negotiate meaningful volume discounts through managed device programs unavailable to individual consumer purchasers.
Final assembly concentrates heavily within a small number of contract manufacturers operating at massive scale, while component sourcing for displays and processors spans a broader supplier base across East Asia and beyond. Enterprise procurement increasingly requires device management software integration and multi-year support commitments that favor established manufacturers with dedicated enterprise sales organizations over newer entrants lacking comparable support infrastructure.
"Nobody buys a tablet for the tablet anymore. They buy into whichever platform already owns their phone, their laptop, and increasingly their entire household's subscription bundle."
Director, Consumer Electronics and Devices Practice · MMA Technology Practice · September 2026

Market Trends

On-Device AI Features Drive New Replacement Cycle

Manufacturers are positioning new tablet generations around on-device artificial intelligence capabilities, including local language processing and image generation, that require processor and memory specifications older devices cannot support regardless of software updates. Roughly 25% of new tablet models launched in the past year specifically market AI-accelerated processors as a headline feature, up from essentially none three years earlier. This positioning gives manufacturers a genuine replacement cycle argument beyond incremental screen or camera improvements, potentially reversing the lengthening replacement cycles that have pressured unit volume growth in recent years across the category.
Market Impact: 22% of shipments now enterprise procurement

Detachable Two-in-One Devices Blur Laptop and Tablet Categories

Detachable two-in-one tablets with keyboard accessories and laptop-grade productivity software increasingly substitute for traditional laptops in both enterprise and education deployments, blurring the historical distinction between the two device categories entirely and permanently. These detachable devices now account for roughly 31% of tablet unit shipments, up substantially from a smaller share five years ago as hybrid work arrangements normalized flexible device usage patterns across most industries. Manufacturers straddling both categories are capturing share from pure laptop makers unable to match the tablet form factor's flexibility for mobile and classroom use cases.
Market Impact: 15% of volume flows through education

Market Opportunities and Growth Drivers

Enterprise Device Refresh Cycles Sustain Steady Replacement Demand

Corporate IT departments are refreshing aging tablet fleets on standard three to four year cycles, replacing devices originally purchased for pandemic-era remote work with newer models supporting current device management and security software requirements across the entire enterprise fleet, infrastructure, and support contracts. Enterprise procurement now accounts for roughly 22% of total tablet shipment volume, a meaningfully larger share than before distributed work became standard practice across most large organizations worldwide. This refresh-driven demand provides a predictable baseline that operates independently of consumer discretionary spending cycles and general economic conditions.
Market Impact: 18% of buyers rely on phones

Education Technology Budgets Sustain Steady Procurement Volume

Government and institutional education technology budgets continue funding tablet procurement for primary and secondary school digital learning programs, sustaining volume that operates largely independent of consumer market cycles and household spending patterns entirely across most regions, countries, and school districts. Education-specific tablet shipments have grown steadily even during periods when consumer tablet sales declined sharply, reflecting multi-year budget commitments that school districts rarely reverse once implemented at scale. Roughly 15% of total tablet unit volume now flows through education procurement channels, providing manufacturers serving this segment meaningful revenue stability year after year.
Market Impact: Cycles now stretch to 3.8 years

Market Restraints and Challenges

Larger Smartphones Continue Cannibalizing Tablet Demand

Smartphones with screens now exceeding 6.5 inches diagonally satisfy much of the media consumption and light productivity use case that originally justified tablet purchases, particularly in price-sensitive markets where consumers cannot afford both device categories. The root cause is that smartphone display technology improvements have narrowed the practical usability gap between large phones and small tablets faster than manufacturers anticipated. Roughly 18% of former tablet buyers in surveyed emerging markets now report relying solely on their smartphone instead. Manufacturers are mitigating this by emphasizing productivity features and screen real estate that smartphones genuinely cannot replicate.
Market Impact: 25% of new models feature AI

Lengthening Replacement Cycles Suppress Unit Volume Growth

Consumer tablet replacement cycles have lengthened considerably as incremental generation-to-generation improvements fail to justify upgrade costs for users satisfied with existing device performance and battery life over time. The root cause is that tablets, unlike smartphones, do not carry the same carrier subsidy and contract renewal incentives that historically accelerated phone replacement timing. Average consumer replacement cycles now stretch to 3.8 years, up meaningfully from shorter cycles common a decade ago. Manufacturers are mitigating this by pursuing enterprise and education channels with more predictable multi-year procurement and refresh commitments in place.
Market Impact: 31% of shipments are now detachable
3 additional market trends, 4 additional growth drivers, and 2 additional restraints and challenges are covered in the full report. Contact sales@marketmindsadvisory.com to access the complete intelligence.

Segment CAGR and Growth Architecture

The Tablet Market segments by form factor and end-use across six categories spanning consumer slate, detachable two-in-one, and ruggedized enterprise designs, reflecting the primary purchasing decision buyers make when specifying a device for a given use case. Two segments outpace the market average, driven respectively by enterprise and education procurement of detachable and ruggedized devices.
tablet-market-market-share-analysis-1790005322675

Detachable 2-in-1 Tablets for Enterprise and Education Markets

Detachable two-in-one tablets for enterprise and education markets are the fastest-growing segment, expanding as corporate IT departments and school districts standardize on devices that function as both tablet and laptop replacement across hybrid work and classroom settings alike and across grade levels. These devices carry meaningfully higher average selling prices than pure consumer slate tablets, reflecting the keyboard accessory, productivity software licensing, and device management integration that enterprise and education buyers require of every vendor. Manufacturers with established enterprise sales organizations and device management software partnerships benefit from multi-year procurement contracts that individual consumer sales channels rarely offer, while newer entrants face lengthy enterprise qualification processes before earning comparable volume.
CAGR 8.0%

Ruggedized Enterprise Tablets for Field Service Applications

Ruggedized enterprise tablets for field service applications form the second-fastest segment, growing as logistics, utilities, and manufacturing companies equip field technicians with durable devices that survive drops, dust, and extreme temperature conditions standard consumer tablets cannot withstand at all under field conditions or extended outdoor use. These devices command substantial price premiums over consumer equivalents, reflecting specialized certification testing and the smaller production volumes inherent to niche industrial applications across the sector and its many use cases. Suppliers serving this segment typically maintain dedicated industrial sales teams and long-term service contracts that differ substantially from consumer retail distribution models, creating a genuine and lasting barrier to entry for consumer-focused manufacturers.
CAGR 7.0%
Full segment breakdown across 6 segments available in the complete report.

Regional Architecture and Country Demand Map

Tablet demand concentrates wherever consumer purchasing power and enterprise device budgets are highest, with East Asia leading on both massive domestic consumption and near-total final assembly concentration, while North America still anchors the largest overall platform revenue and enterprise procurement spending worldwide today and tomorrow.

North America

North America hosts Apple's design headquarters and the largest concentration of enterprise and education technology budgets globally, giving the region outsized influence over both product specification and app platform development. Corporate device refresh programs at major employers sustain steady enterprise tablet procurement independent of consumer retail cycles, while school district digital learning initiatives across major states provide a further stable demand channel. The region's high average selling prices, driven by premium device preference among consumers, mean North America generates outsized revenue relative to its unit shipment share of the global market. Apple's platform lock-in effect keeps consumer replacement demand concentrated among existing iPad owners rather than switching to competing platforms.
Share: 26% | CAGR: 4.0% (2026 to 2036)

Western Europe

Germany, France, and the United Kingdom's enterprise and education procurement programs sustain steady Western European tablet demand, reflecting government digital learning initiatives comparable to those driving North American education procurement across the region. European data privacy regulations increasingly influence enterprise tablet purchasing decisions, favoring vendors who can clearly demonstrate compliant device management and data handling practices across the device lifecycle and supply chain. Consumer replacement demand has slowed quite considerably as European households reach genuine market saturation, shifting the region's overall growth increasingly toward enterprise and education channels rather than first-time consumer adoption alone. Regional retail distribution remains dominated by the very same two platform owners that lead the market globally.
Share: 20% | CAGR: 2.5% (2026 to 2036)
Regional intelligence for 5 additional markets available in the complete report: East Asia, South Asia and Pacific, Latin America, Middle East and Africa, Eastern Europe. Contact sales@marketmindsadvisory.com.
tablet-market-country-cagr-analysis-1790005323205

Where Tablet Vendors Actually Capture Margin

Tablet vendors capture value beyond raw device sales through four commercial mechanisms that reward platform depth and enterprise relationships over hardware margin alone in this maturing category. App store revenue share, enterprise device management contracts, accessory attachment, and education channel exclusivity all matter more here than one-time unit sale profit or list price alone.

Capturing App Store and Subscription Revenue Share

Platform-owning vendors capture a meaningful percentage of every app purchase and subscription made on their tablets, generating recurring revenue that continues long after the initial device sale closes at retail. This app store revenue share typically runs 15 to 30% of transaction value, compounding across a device's multi-year usage life into revenue that can meaningfully exceed the original hardware margin captured at the point of sale. This dynamic gives platform owners a lasting incentive to price hardware competitively since the real profit accrues afterward through the ongoing platform relationship itself.
Market Impact: Typically runs 15 to 30% of transaction value

Securing Multi-Year Enterprise Device Management Contracts

Vendors that bundle device management software and multi-year support contracts alongside hardware sales capture recurring enterprise revenue beyond the initial procurement transaction, since managed device programs typically renew automatically absent a very specific reason to switch providers entirely. These management contracts often span 3 to 5 years and include software licensing fees that continue regardless of hardware refresh timing, creating a revenue stream considerably more stable than one-time unit sales alone could ever provide. This favors vendors with dedicated enterprise software divisions over pure hardware manufacturers lacking comparable software capability.
Market Impact: Contracts most often span 3 to 5 years

Driving Accessory Attachment Rates on Premium Devices

Vendors selling keyboard cases, styluses, and other accessories alongside premium tablets capture meaningful incremental revenue per device sold, since these accessories often carry higher margin percentages than the base hardware itself commands. Accessory attachment rates on premium detachable tablets reach roughly 45% of unit sales, adding substantially to per-customer revenue beyond the headline device price advertised on the shelf at retail. This attachment revenue increasingly factors into how vendors price base hardware, sometimes accepting thinner device margin to drive accessory platform lock-in across the broader product line and customer base.
Market Impact: Attachment now reaches roughly 45% on premium units

Winning Exclusive Education Channel Distribution Agreements

Vendors that secure exclusive or preferred distribution agreements with school districts and education technology resellers lock in multi-year procurement volume that competitors cannot easily displace once implemented across a district's curriculum. These education distribution relationships often span a full 4 to 6 years tied closely to curriculum technology adoption cycles, providing predictable volume that operates independent of broader consumer market conditions and economic cycles entirely. Vendors with dedicated education sales teams and curriculum software partnerships capture disproportionate share of this channel relative to their overall market position and installed base.
Market Impact: Distribution deals often span 4 to 6 years

Who Controls the Margin Pool

Revenue concentration in the Tablet Market sits at a CR5 of 78%, evaluated on tablet shipment revenue disclosed or estimated across each vendor's device portfolio. Apple and Samsung lead by an enormous margin over the next tier, drawing on platform lock-in and brand loyalty that smaller Android manufacturers cannot replicate regardless of hardware specification parity. The gap between the second and third-ranked vendor is substantial, reflecting extreme concentration relative to most consumer electronics.
Current competitive activity centers on enterprise and education channel expansion, with vendors publicizing device management partnerships and curriculum software integrations ahead of institutional procurement cycles. Several vendors have opened dedicated enterprise sales organizations, treating account management as a genuine differentiator beyond hardware specifications. Price competition remains most intense in the commodity Android consumer tier, where Chinese manufacturers compete aggressively on cost.

Emerging pressure comes from smartphones with expanding screen sizes that continue narrowing the practical distinction between large phones and small tablets in price-sensitive markets. Rankings could shift meaningfully if a well-capitalized entrant secures broad enterprise device management adoption, since institutional contracts carry multi-year exclusivity that reorders standing for years. Vendors without diversified enterprise and education exposure risk remaining dependent on cyclical consumer demand.
tablet-market-company-positioning-matrix-1790005323726

Competitive Moat and Risk Dimensions

APPLE

Moat: iPadOS Platform Integration

Apple's tightly integrated hardware, software, and services platform creates exceptional customer retention, since switching away from an iPad means abandoning accumulated app purchases, iCloud data, and cross-device continuity with iPhones and Mac computers. This platform depth commands premium pricing that Android competitors, lacking comparable integration, cannot match without sacrificing margin substantially.
APPLE

Risk: Limited Enterprise Customization Flexibility

Apple's closed platform approach limits the deep customization and device management flexibility that some large enterprise customers require for specialized industrial or regulated applications. Competitors offering more open Android-based enterprise platforms can better serve customers needing extensive custom software integration that Apple's controlled environment restricts by design.
SAMSUNG ELECTRONICS

Moat: Broad Price Tier Coverage

Samsung's product lineup spans from budget consumer tablets to premium stylus-enabled devices, letting the company capture customers across nearly every price point rather than ceding budget or premium segments to specialized competitors. This breadth provides revenue diversification that protects Samsung from category-specific downturns affecting only one price tier or use case.
SAMSUNG ELECTRONICS

Risk: Weaker Software Platform Depth

Samsung's Android-based software platform, while improved considerably in recent years, still lacks the app optimization depth and cross-device integration that keeps Apple customers loyal across multiple device categories. Closing this gap would require sustained software investment that competes for resources against Samsung's broader smartphone and consumer electronics priorities.

Players Tracked

Prominent Players

Apple
Samsung Electronics
Lenovo
Amazon
Huawei

Other Key Players

Xiaomi
Microsoft
Google
ASUS
Acer
Honor
Realme
Vivo
OPPO
TCL Electronics
Alcatel
Onyx International
Chuwi
Teclast
Panasonic

Recent Developments

MARCH 2025

Zhengzhou Facility Adds Production Lines

Apple expanded iPad production capacity at its Zhengzhou, China assembly facility, adding dedicated lines for the latest generation devices following rising order backlogs from enterprise and education customers. The organic capacity expansion supports anticipated demand growth as institutional device refresh cycles continue across major markets globally.
Signal: Signals sustained institutional demand pull for dedicated production capacity across major global education markets today and tomorrow
AUGUST 2025

Multi-Year School District Agreement Signed

Samsung signed a multi-year supply agreement with a leading North American school district consortium to provide Galaxy Tab devices across the consortium's expanding one-to-one device program. The agreement, not a joint venture or equity arrangement, commits both parties to fixed volume and technical support terms extending across multiple academic years.
Signal: Locks in dedicated education device supply ahead of the consortium's expanding one-to-one program rollout schedule and budget
JANUARY 2026

Acquisition Adds Ruggedized Device Technology

Lenovo acquired a smaller ruggedized tablet design startup specializing in field service applications for logistics and utility companies, adding specialized intellectual property to its existing enterprise device portfolio. The acquisition strengthens Lenovo's position in the fastest-growing ruggedized segment without requiring years of internal development from a standing start.
Signal: Adds specialized ruggedized device intellectual property without years of costly internal development effort required elsewhere entirely

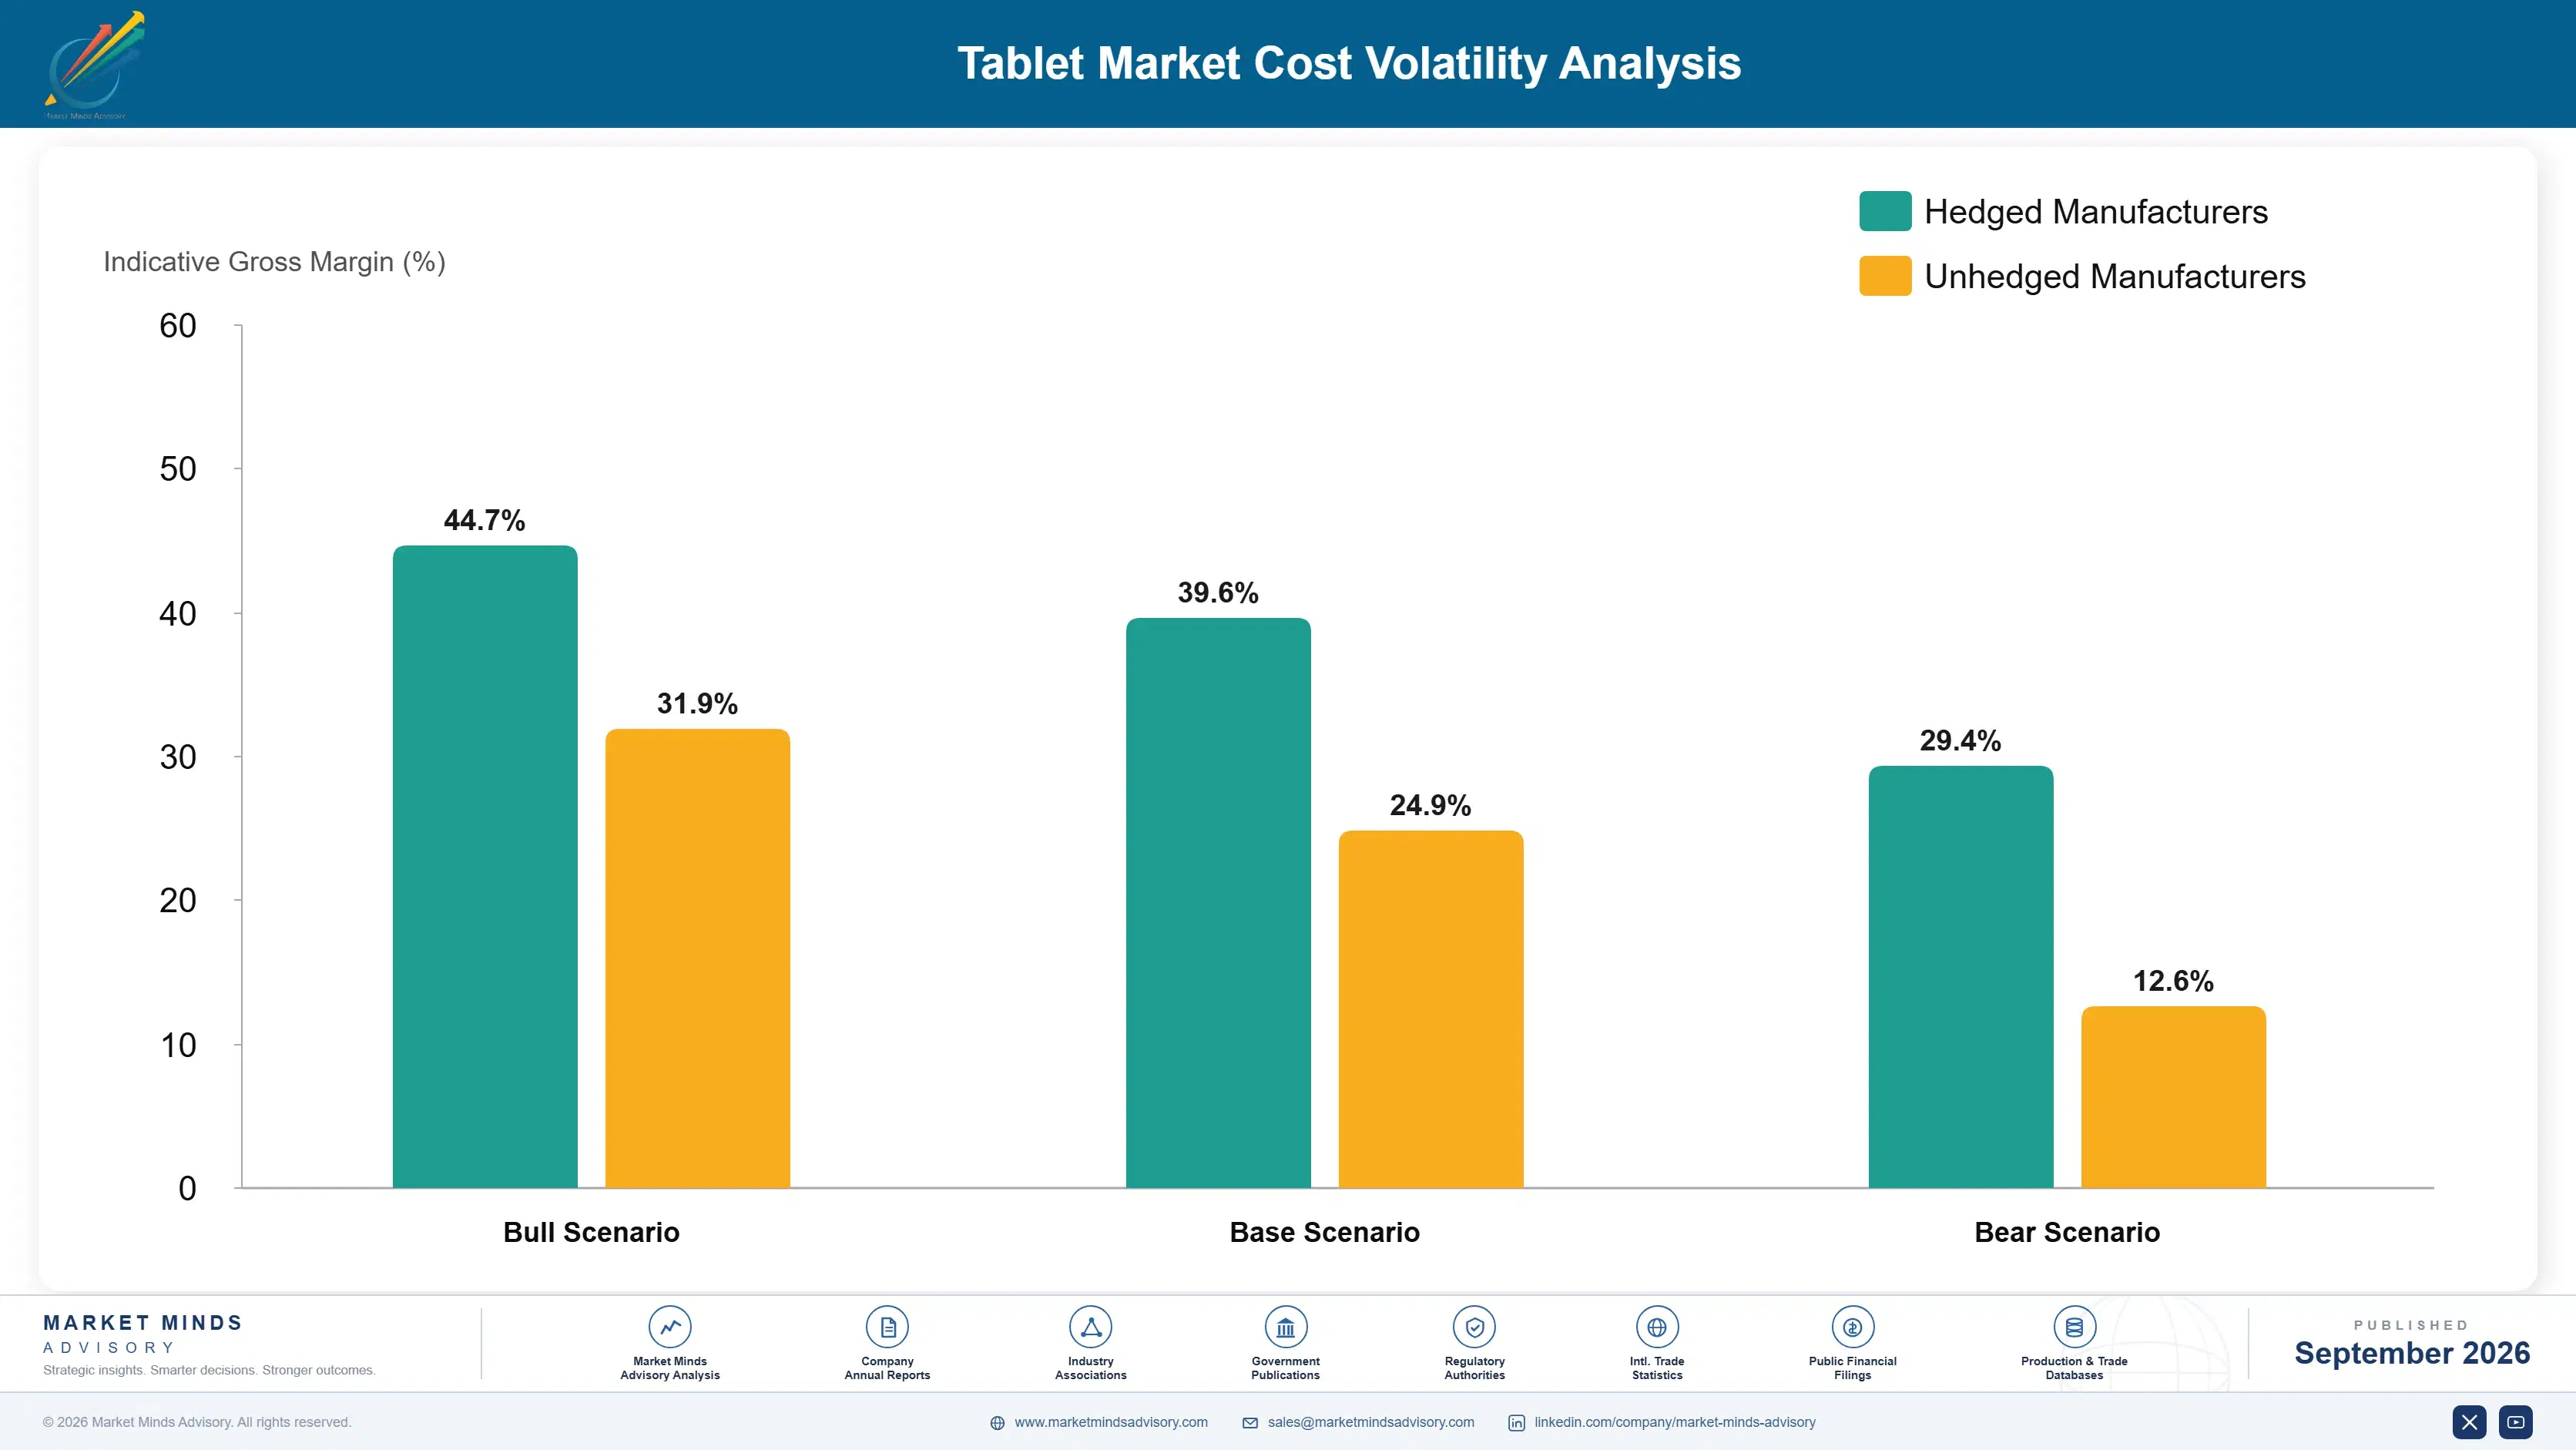
Display Panel and Processor Supply Exposure

Display panels and application processors together account for roughly 45% of tablet production cost, sourced from a concentrated set of specialty semiconductor and panel manufacturers in South Korea, Taiwan, and Japan that few competitors can match at comparable scale or reliability. Battery and enclosure components represent a further 20% of cost, with assembly capacity concentrated overwhelmingly in China.
Display panel pricing spiked sharply during the 2021-2022 global semiconductor shortage, when smartphone, laptop, and tablet manufacturers competed directly for the same constrained panel and chip capacity, according to the US Department of Commerce's semiconductor supply chain review. Lead times for premium display panels stretched from a typical eight weeks to beyond twenty weeks at the peak, forcing several manufacturers to delay new product launches by multiple quarters during the disruption.

Vendors without long-term panel and processor supply agreements or in-house component manufacturing face a lasting cost disadvantage during upcycles, since spot-market pricing can run well above contracted rates when capacity tightens industry-wide across every major supplier. Vertically integrated manufacturers like Apple and Samsung absorb less margin pressure than smaller assemblers dependent entirely on external component allocation decisions.
tablet-market-cost-volatility-analysis-1790005323923

Securing Multi-Year Display Panel Supply Agreements

Large buyers are increasingly negotiating multi-year display panel and processor supply agreements directly with manufacturers, trading committed volume for insulation against spot-market price swings during industry cycles and downturns. This approach worked well for vendors already under contract during the 2021-2022 shortage, avoiding the worst lead-time extensions that spot-market buyers experienced across the industry.

Dual-Sourcing Critical Display and Processor Components

Vendors are qualifying displays and processors from more than one manufacturer per product line, reducing exposure to any single supplier's capacity constraints or geopolitical trade restrictions on critical components. This raises qualification cost modestly but protects continuity when demand surges or export restrictions affect any single supplier's home country, a scenario buyers now weigh explicitly.

Investing in Vertical Integration for Critical Components

Some vendors are investing directly in display panel and processor design capability rather than relying entirely on external suppliers, reducing exposure to spot-market pricing during industry upcycles. This vertical integration took years to build for companies that now benefit most, giving early movers a durable cost advantage over assemblers during periods of tight supply.

Portfolio Architecture for Margin Defence

Tablet vendors organize their portfolios across three margin tiers reflecting genuinely different commercial relationships, from commodity Android consumer tablets up through certified enterprise and education devices to premium platform-integrated flagship tablets sold at the highest price points. Gross margin varies substantially across tiers, concentrating at the top where platform lock-in and brand loyalty keep competition thin.
Volume tier products compete on unit cost and specification against a broad field of Chinese manufacturers, offering limited differentiation and correspondingly thin margin across most product lines and price points. Premium tier platform-integrated tablets earn margin through accumulated app store revenue and cross-device lock-in that customers value well beyond the marginal cost of the hardware itself, creating durable pricing power that commodity Android vendors cannot access.

The tension between commodity Android volume and premium platform product lines shapes research and development allocation decisions, since capital committed to budget hardware cannot easily flex toward premium platform development during a sudden shift in customer requirements or preferences. Vendors maintaining strength in both categories use commodity volume revenue to fund the multi-year software and services investment needed to build genuine platform lock-in.

Volume / Commodity-Adjacent

Budget Android tablets competing on unit cost and basic specification against a broad field of established Chinese manufacturers with limited differentiation across the product line, price points, and target markets.
Gross Margin: 8-15%

Premium / Certified

Enterprise and education-certified tablets with device management integration and multi-year support commitments, priced for reliability and certification depth rather than raw specification alone across the entire device fleet and budget cycle.
Gross Margin: 22-30%

Sustainability / Regulatory / Next-Generation

Premium platform-integrated flagship tablets with on-device AI capability, commanding the widest margin given strong brand loyalty and accumulated app store and services revenue streams built up over many years of platform investment.
Gross Margin: 35-42%
tablet-market-portfolio-architecture-1790005324433

High-value Sub-segments and Strategic Watch-out

Detachable Tablets for Enterprise and Education

This segment combines the fastest unit growth in the category with above-average gross margin, as institutional buyers pay for productivity features and device management integration. Vendors with proven enterprise sales organizations are positioned to capture disproportionate value through the next decade of hybrid work adoption.
Gross Margin: 28-35%

Ruggedized Tablets for Field Service Use

Field service and industrial applications drive strong growth alongside healthy margin, since durability and certification requirements justify substantial price premiums over consumer equivalents at scale. This combination of solid growth and above-average margin makes it a priority investment area for vendors expanding beyond consumer electronics.
Gross Margin: 30-38%

Consumer Media Tablets for General Entertainment

This segment remains the volume core of the market, generating the bulk of unit shipments even as growth slows and margin compresses under sustained price competition from budget Android manufacturers. It funds operating scale but contributes proportionally less to overall profit than its shipment volume suggests.
Gross Margin: 10-18%

Budget Tablets for Emerging Market Consumers

Growth here trails the market average today, but rising smartphone-adjacent computing affordability could accelerate demand faster than currently modeled across price-sensitive developing markets worldwide and emerging economies broadly. Vendors should watch qualification activity in this adjacent segment closely over the next two to three years.
Gross Margin: 8-14%

Platform Lock-In Sustains Replacement Loyalty

Tablet revenue behaves like an annuity once a vendor establishes platform lock-in, since switching platforms means abandoning accumulated app purchases, cloud data, and cross-device continuity that took years to build. A single device sale generates recurring app store and subscription revenue across the device's multi-year usage life without renewed sales effort, provided the platform remains compelling enough to retain the customer.
Stickiness varies meaningfully by end-use vertical: enterprise and education deployments carry the deepest lock-in given device management integration and curriculum software dependencies that take years to migrate away from, while individual consumer purchases turn over more freely as replacement cycles lengthen and price sensitivity increases. Field service and ruggedized applications sit between these extremes, tied to equipment refresh cycles longer than consumer tablets but shorter than enterprise IT infrastructure generally.

Buyer profiles are shifting generationally as IT procurement officers and curriculum technology specialists increasingly hold purchasing authority once shared with generalist device buyers, and they prioritize total cost of ownership and management software compatibility over raw hardware specifications. This shift favors vendors who invest in dedicated enterprise and education sales organizations over those relying on legacy consumer retail relationships built around hardware features alone.
tablet-market-end-use-penetration-index-1790005324922

Where Tablet Strategy Should Focus Next

These are among the four positions where our research anticipates prominent divergence between winners and laggards over the coming forecast period. Each is grounded in the demand model, the regulatory perimeter, and the announced capacity pipeline.
01 / INSTITUTIONAL CHANNEL PRIORITY

Prioritize Institutional Sales Over Consumer Volume Chasing

Enterprise and education channel development is the single highest-value investment available to tablet vendors today, since institutional device management contracts generate recurring software revenue across multi-year procurement cycles with minimal renewed sales effort required. Vendors chasing consumer volume instead compete on price in a segment with thinner margin and no platform moat protecting share against established platform owners. The relationship investment required to build institutional sales capability pays back many times over across a single procurement cycle spanning several years.
02 / APP PLATFORM REVENUE DEVELOPMENT

Deepen App Store and Subscription Revenue Beyond Hardware

App store revenue share typically runs 15 to 30% of transaction value, compounding across a device's multi-year usage life into revenue that can meaningfully exceed the original hardware margin captured at the point of sale itself. Vendors that invest in software platform depth now capture this recurring value rather than competing purely on hardware specification against Android manufacturers offering comparable components. Waiting risks ceding this durable, high-margin revenue stream permanently to the two platform owners already dominant in the category.
03 / RUGGEDIZED SEGMENT INVESTMENT

Build Ruggedized Capability for Field Service Applications

Ruggedized enterprise tablets for field service applications command substantial price premiums over consumer equivalents, reflecting specialized certification requirements that most consumer-focused manufacturers currently lack entirely and cannot easily replicate on their own without years of investment. Building this capability now positions a vendor ahead of logistics, utilities, and manufacturing companies expanding field technician device deployment across their operations and workforce. Vendors that remain purely consumer-focused will continue ceding this growing, higher-margin segment to specialized industrial device manufacturers already firmly established there.
04 / DISPLAY SUPPLY CHAIN SECURITY

Secure Display Panel Supply Before the Next Shortage

The 2021-2022 semiconductor shortage proved that vendors without secured display panel supply face lead-time extensions that cost customer relationships for years afterward across the entire industry and supply chain as a whole. Securing multi-year supply agreements now, while negotiating leverage still favors buyers, protects against a repeat episode as enterprise and education demand both keep climbing steadily across every major region. Vendors that wait until the next tightness cycle begins will negotiate from a materially weaker position than those who act now.

Engagement Snapshot From the Field

A live engagement with an industry participant carrying material or product regulatory and market exposure ahead of a defining policy shift, showing how our research translates into a defensible multi-year portfolio strategy.
MARKET MINDS ADVISORY · CLIENT ENGAGEMENT SUMMARY
Tablet Producer Strategic Portfolio Review and Transition Roadmap 2026·Investment Scenario on Tablet Exposure Evaluation 2025-26
CLIENT PROFILE
The client is a regional school district consortium serving forty thousand students across twelve districts, with an annual technology procurement budget exceeding $22 million (client-reported, unverified by MMA). The consortium was launching a one-to-one device initiative requiring tablets for every enrolled student and needed to evaluate vendor options balancing cost, durability, and curriculum software compatibility.
STRATEGIC CHALLENGE
The consortium's technology committee lacked experience negotiating device procurement at this scale, having previously purchased devices individually at each district rather than through a coordinated consortium agreement. Leadership was uncertain which vendor would deliver the best combination of device durability, total cost of ownership, and curriculum software compatibility across such a diverse district population.
MMA APPROACH
MMA conducted structured interviews with the consortium's technology and procurement leadership alongside primary survey benchmarking data on device durability and total cost of ownership across comparable education deployments nationally and internationally in scope. The analysis mapped available vendor options against the consortium's specific durability requirements, budget constraints, and curriculum software needs.
KEY FINDINGS
  1. Devices with reinforced cases and extended warranty coverage showed meaningfully lower total replacement costs over a typical four-year deployment cycle overall and at scale.
  2. Two of five evaluated vendors offered consortium-wide volume pricing that reduced per-device cost by roughly 18% versus individual district purchasing arrangements alone.
  3. Curriculum software compatibility varied significantly across vendors, with some vendors requiring costly additional licensing fees for full classroom functionality and premium features.
  4. Bundled device management software reduced the consortium's internal IT support burden meaningfully compared to unmanaged device deployment models (client-reported, unverified by MMA).
CLIENT PROFILE
The client is a regional school district consortium serving forty thousand students across twelve districts, with an annual technology procurement budget exceeding $22 million (client-reported, unverified by MMA). The consortium was launching a one-to-one device initiative requiring tablets for every enrolled student and needed to evaluate vendor options balancing cost, durability, and curriculum software compatibility.
STRATEGIC CHALLENGE
The consortium's technology committee lacked experience negotiating device procurement at this scale, having previously purchased devices individually at each district rather than through a coordinated consortium agreement. Leadership was uncertain which vendor would deliver the best combination of device durability, total cost of ownership, and curriculum software compatibility across such a diverse district population.
MMA APPROACH
MMA conducted structured interviews with the consortium's technology and procurement leadership alongside primary survey benchmarking data on device durability and total cost of ownership across comparable education deployments nationally and internationally in scope. The analysis mapped available vendor options against the consortium's specific durability requirements, budget constraints, and curriculum software needs.
KEY FINDINGS
  1. Devices with reinforced cases and extended warranty coverage showed meaningfully lower total replacement costs over a typical four-year deployment cycle overall and at scale.
  2. Two of five evaluated vendors offered consortium-wide volume pricing that reduced per-device cost by roughly 18% versus individual district purchasing arrangements alone.
  3. Curriculum software compatibility varied significantly across vendors, with some vendors requiring costly additional licensing fees for full classroom functionality and premium features.
  4. Bundled device management software reduced the consortium's internal IT support burden meaningfully compared to unmanaged device deployment models (client-reported, unverified by MMA).
RECOMMENDED STRATEGY
Phase 1: Phase 1 (Vendor Evaluation and Pilot): Evaluate finalist vendors and run a limited pilot deployment across two participating school districts. Phase 2: Phase 2 (Consortium-Wide Procurement Agreement): Negotiate a unified volume pricing agreement covering all twelve participating school districts and their budgets. Phase 3: Phase 3 (Phased Rollout): Deploy devices across the remaining districts on a staggered schedule tied to each district's budget cycle.
OUTCOME
The consortium selected a vendor offering consortium-wide volume pricing and bundled device management software, reducing per-device cost meaningfully compared to prior individual district purchasing arrangements. The phased rollout completed on schedule across all twelve participating districts and within the original allocated budget (client-reported, unverified by MMA).

Frequently Asked Questions

Foundational context covering the market sizes, CAGR, scope, country, region and competition that inform every finding below. This section is provided to cover basics and most often pre-purchase conversations, answered from the MMA Primary Research Dataset.

What is the current size of the Tablet Market?

The Tablet Market is valued at $45.0 billion in 2025. This reflects global shipment revenue for consumer, enterprise, and education slate computing devices across all form factors.

How large will the Tablet Market be by 2036?

The market is projected to reach $69.28 billion by 2036, up from $46.8 billion in 2026. That expansion represents a 1.48 times multiple over the eleven-year forecast period.

What is the CAGR for the Tablet Market 2026 to 2036?

The market is forecast to grow at a 4.0% compound annual growth rate between 2026 and 2036. Bull and bear scenarios range from 5.0% to 3.0%, reflecting consumer replacement cycle uncertainty.

Which segment is growing fastest?

Detachable two-in-one tablets for enterprise and education markets lead growth at 8.0% CAGR, roughly 2.0 times the overall market rate. Demand comes from hybrid work and classroom device standardization.

Who are the major companies in the Tablet Market?

Apple, Samsung Electronics, Lenovo, Amazon, and Huawei lead the global market by shipment volume. Together they hold a CR5 of 78% based on total tablet shipment revenue.

Which country is growing fastest?

India leads country-level growth at a 7.5% CAGR, driven by rapidly expanding digital literacy programs and rising smartphone-adjacent computing affordability. This outpaces the broader South Asia and Pacific regional average.

Report Segmentation Architecture

The full report scope spans multiple orthogonal segmentation dimensions, with cross-tabulated demand data provided for each dimension pair. Coverage extends further to regional breakdowns, trend trajectories, and the competitive detail needed to support segment-level decision-making.

By Primary Market Dimension

  • Consumer Slate Tablets
  • Detachable Two-in-One Tablets
  • Ruggedized Enterprise Tablets
  • Budget Tablets
  • Premium Flagship Tablets
  • Kids and Education Tablets

By End-Use Industry

  • Consumer and Personal Use
  • Enterprise and Corporate
  • Education
  • Field Service and Industrial
  • Healthcare and Retail

By Commercial Dimension

  • Direct-to-Consumer Retail Sales
  • Enterprise Device Management Contracts
  • Education Channel Distribution
  • Carrier and Distributor Sales

By Region

  • North America
  • Western Europe
  • East Asia
  • South Asia and Pacific
  • Latin America
  • Middle East and Africa
  • Eastern Europe

Scope, Methodology, and Coverage

Every figure in this report is reproducible from documented input assumptions. The scope below maps the historical period, the forecast horizon, the segmentation dimensions, and the countries covered, alongside the underlying primary and qualitative methodology.
Historical Period
2020 to 2025
Forecast Period
2026 to 2036
Base Year
2025 (USD billions; MMA Primary Research Dataset, September 2026)
Market Definition
The Tablet Market covers portable slate-format computing devices with touchscreen interfaces exceeding seven inches diagonally, including consumer media tablets, detachable two-in-one devices, and ruggedized enterprise tablets sold with or without attachable keyboard accessories. It excludes smartphones, laptop computers with permanently attached keyboards, and e-readers designed solely for text display without general-purpose application support.
Quantitative Units
USD billions (current prices); unit shipment volume where applicable
Segmentation Dimensions
By Primary Market Dimension; By End-Use Industry; By Commercial Dimension; By Region
Regions Covered
North America, Western Europe, East Asia, South Asia and Pacific, Latin America, Middle East and Africa, Eastern Europe
Countries Covered
USA, China, Germany, France, UK, Japan, South Korea, India, Australia, Canada, Brazil, Mexico, Indonesia, Vietnam, Thailand, Malaysia, UAE, Saudi Arabia, South Africa, Nigeria, Turkey, Poland, Netherlands, Italy, Spain, Sweden, Switzerland, Argentina, Colombia, Singapore, and additional markets relevant to this sector
Key Companies Profiled
Apple, Samsung Electronics, Lenovo, Amazon, Huawei, Xiaomi, Microsoft, Google, ASUS, Acer, Honor, Realme, Vivo, OPPO, TCL Electronics, Alcatel, Onyx International, Chuwi, Teclast, Panasonic
Quantitative Methodology
Primary survey, n=3,800 respondents, Q4 2025, six countries; demand-side model with trade association cross-validation
Qualitative Methodology
47 expert interviews, Q4 2025; applied to validate demand model assumptions, identify emerging dynamics, and assess competitive positioning
Report Format
PDF and XLSX data workbook (Word format preview document)
Publisher
Market Minds Advisory
Report Code
MMA-2026-TEC-971
Published
September 2026
Contact
sales@marketmindsadvisory.com | www.marketmindsadvisory.com

Purchase the full Tablet Market Report (2026 to 2036).

This report delivers a comprehensive assessment of the global Tablet Market, covering sizing, segmentation, competitive dynamics, and regional demand patterns through 2036. It profiles twenty leading vendors across platform owners, Android manufacturers, and specialized enterprise device makers, examining how enterprise procurement and on-device AI features are reshaping replacement economics. The analysis draws on primary survey data from 3,800 respondents and 47 expert interviews conducted in the fourth quarter of 2025. Readers gain a structured view of where platform value concentrates and how sourcing strategy should evolve.
Detailed twenty-vendor competitive profiles and positioning
Full seven-region demand share and CAGR breakdown
Six-segment product growth and margin tier analysis
In-depth display panel supply chain risk assessment
Enterprise and education channel strategy guidance
Anonymized client device procurement engagement case study

Built For The People Who Decide

From boardroom strategy to bench-side execution, this report is read cover-to-cover by leaders shaping the next decade of their industry, turning demand scenarios, market dynamics and valuation benchmarks into decisions.
CXOs/ Presidents/ VPs/ Managers
M&A and Corporate Development
Strategy Teams and R&D Heads
Procurement and Product Directors
Regulatory and Compliance Leaders
Investor Relations and Equity Analysts