Market Minds Advisory
Synthetic Zeolite Y Adsorbent Market

Synthetic Zeolite Y Adsorbent Market: The Sale Happened When the Plant Was Designed

Most replacement charges are bought against a process licensor's own approved specification, so a materially better adsorbent frequently cannot be sold into a plant that would otherwise happily use it.

Lead Analyst

Bilal Shaikh

Published

September 2026

Make Smarter Decisions with Customized Research Insights

Request a free sample report and evaluate market opportunities, growth trends, and competitive dynamics relevant to your business needs.

2025 MARKET VALUE$0.3BMarket Size 2025
2036 FORECAST VALUE$0.7BBase Case , 2026 to 2036
CAGR 2026 TO 20366.4 %Bull 7.6% / Bear 5.2%
INCREMENTAL OPPORTUNITY$0.3BNet 10- year value creation
EXPANSION MULTIPLE1.86x2036 value over 2026 base
Strategic Levers
M&A Pipeline
Regional Outlook
Country Rankings
Competitive Intelligence
Segmental Deep-dive
Call-Us : 91 93563 13602

Executive Snapshot and Market Trajectory

Around 71% of replacement charges are bought against a specification the process licensor approved when the unit was designed, frequently decades ago. A materially better adsorbent therefore cannot be sold into that plant, because using it would mean revisiting a licensed process design nobody wants to reopen.
That makes the commercial contest happen at licensing rather than at purchasing. A supplier written into a process design package captures replacement charges for the unit's whole operating life, which runs to many bed changes at roughly four year intervals. Suppliers calling on plant procurement are arriving many years after the decision was actually taken. The strongest technical argument does not reopen a licensed design that is currently working.
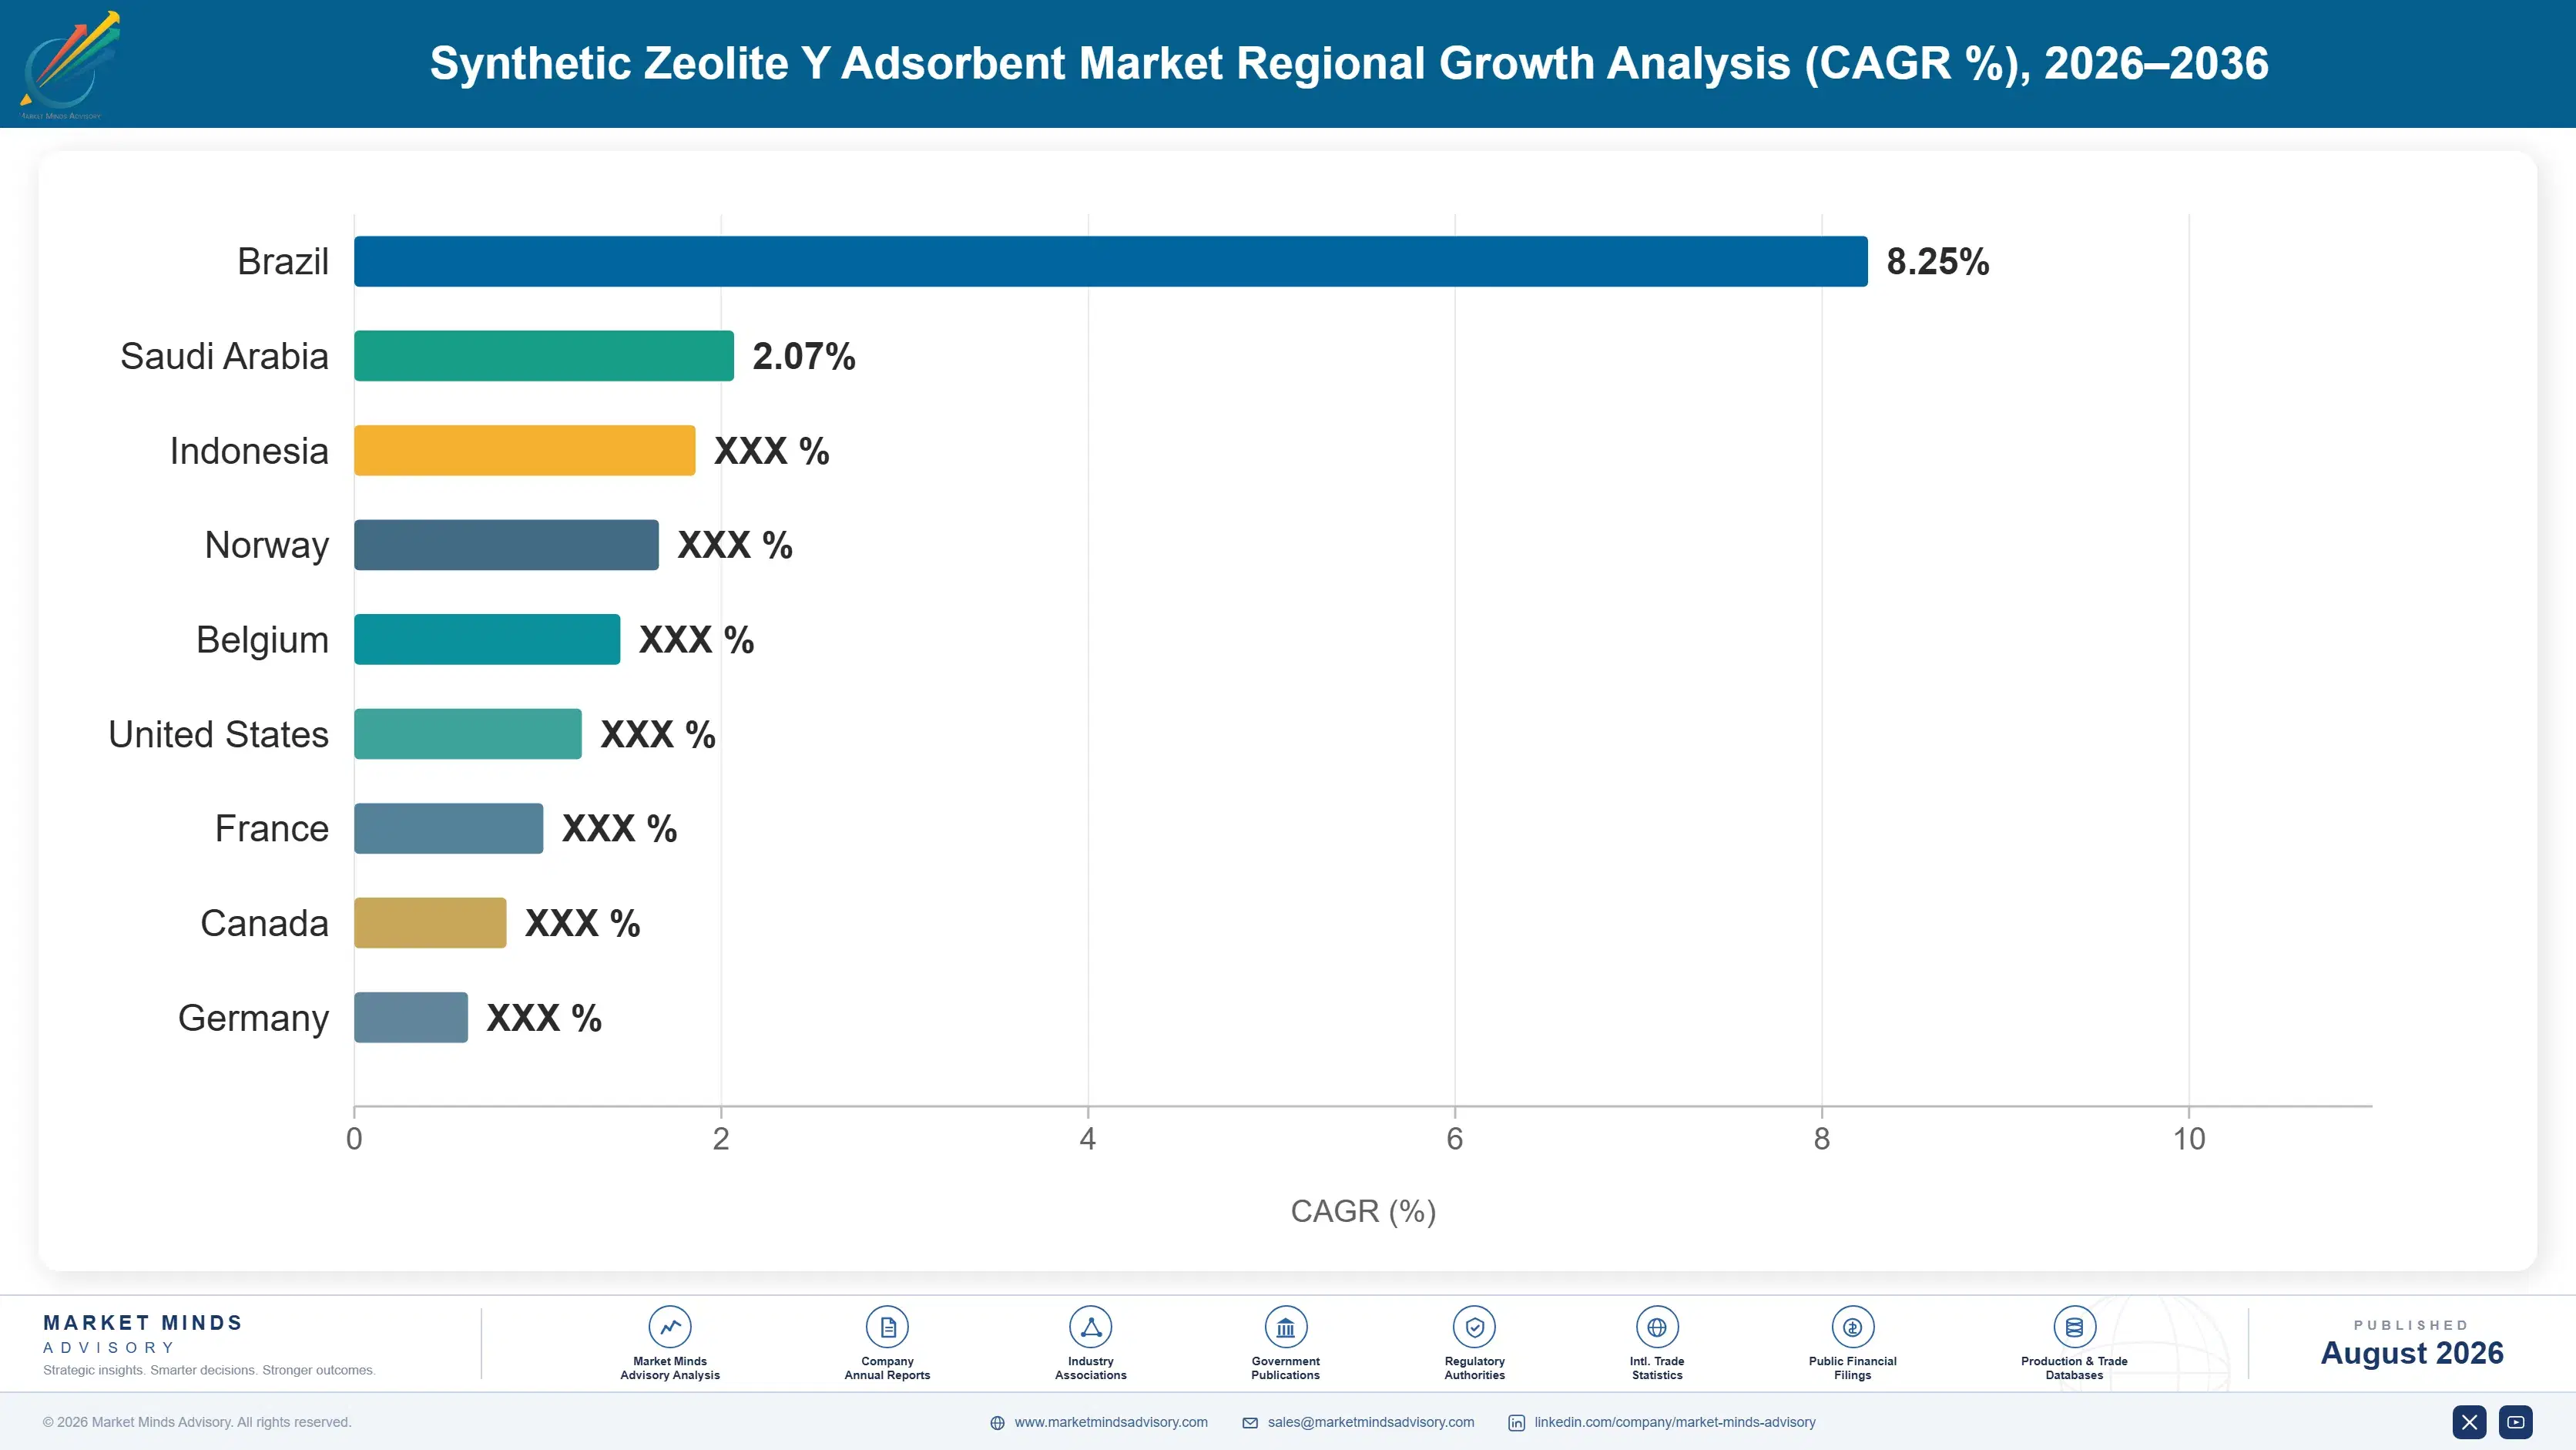
Growth is arriving from outside that structure entirely. Water and emerging contaminant treatment grows at 9.6% because high silica zeolite Y is one of the few regenerable options for certain fluorinated compounds, and those buyers have no licensor telling them what to specify. Saudi Arabia leads all countries at 9.8% on petrochemical capacity. That segment is decided on genuine technical comparison rather than on any inherited specification, which makes it a different commercial business entirely.
Market Definition
Synthetic faujasite type zeolite Y supplied as an adsorbent, covering refinery and petrochemical gas drying, hydrocarbon and aromatics separation, sulphur and mercaptan removal, air and industrial gas purification, water and emerging contaminant treatment, and refrigerant and insulating glass drying. Measured at producer selling value including bound and formed products. Excludes zeolite Y supplied as a catalyst or catalyst component, zeolites A and X, activated carbon, silica gel, alumina adsorbents, and ion exchange resins.
Base Year Value
$0.3B in 2025 (MMA Primary Research Dataset, August 2026)
Forecast Period
2026 to 2036, eleven discrete annual values
CAGR
6.4% base case. Bull 7.6%. Bear 5.2%.
Fastest Growth Segment
Water and Emerging Contaminant Treatment: 9.6% CAGR
Fastest Growth Country
Saudi Arabia: 9.8% CAGR
Fastest Growth Region
South Asia and Pacific: 8.2% CAGR
Largest Region
East Asia: 30% of 2025 global value
Market Leaders
Honeywell UOP, Arkema, Tosoh, W. R. Grace, Zeochem. Source: MMA Primary Research Dataset, July 2026.
Primary Survey
n=3,800 procurement and R&D decision-makers, Q4 2025, six countries
Methodology
Demand-side build-up, cross-validated against public data, 47 expert interviews

Synthetic Zeolite Y Adsorbent Market Forecast Scenarios

synthetic-zeolite-y-adsorbent-market-trend-size-forecast-scenario-1787639660994
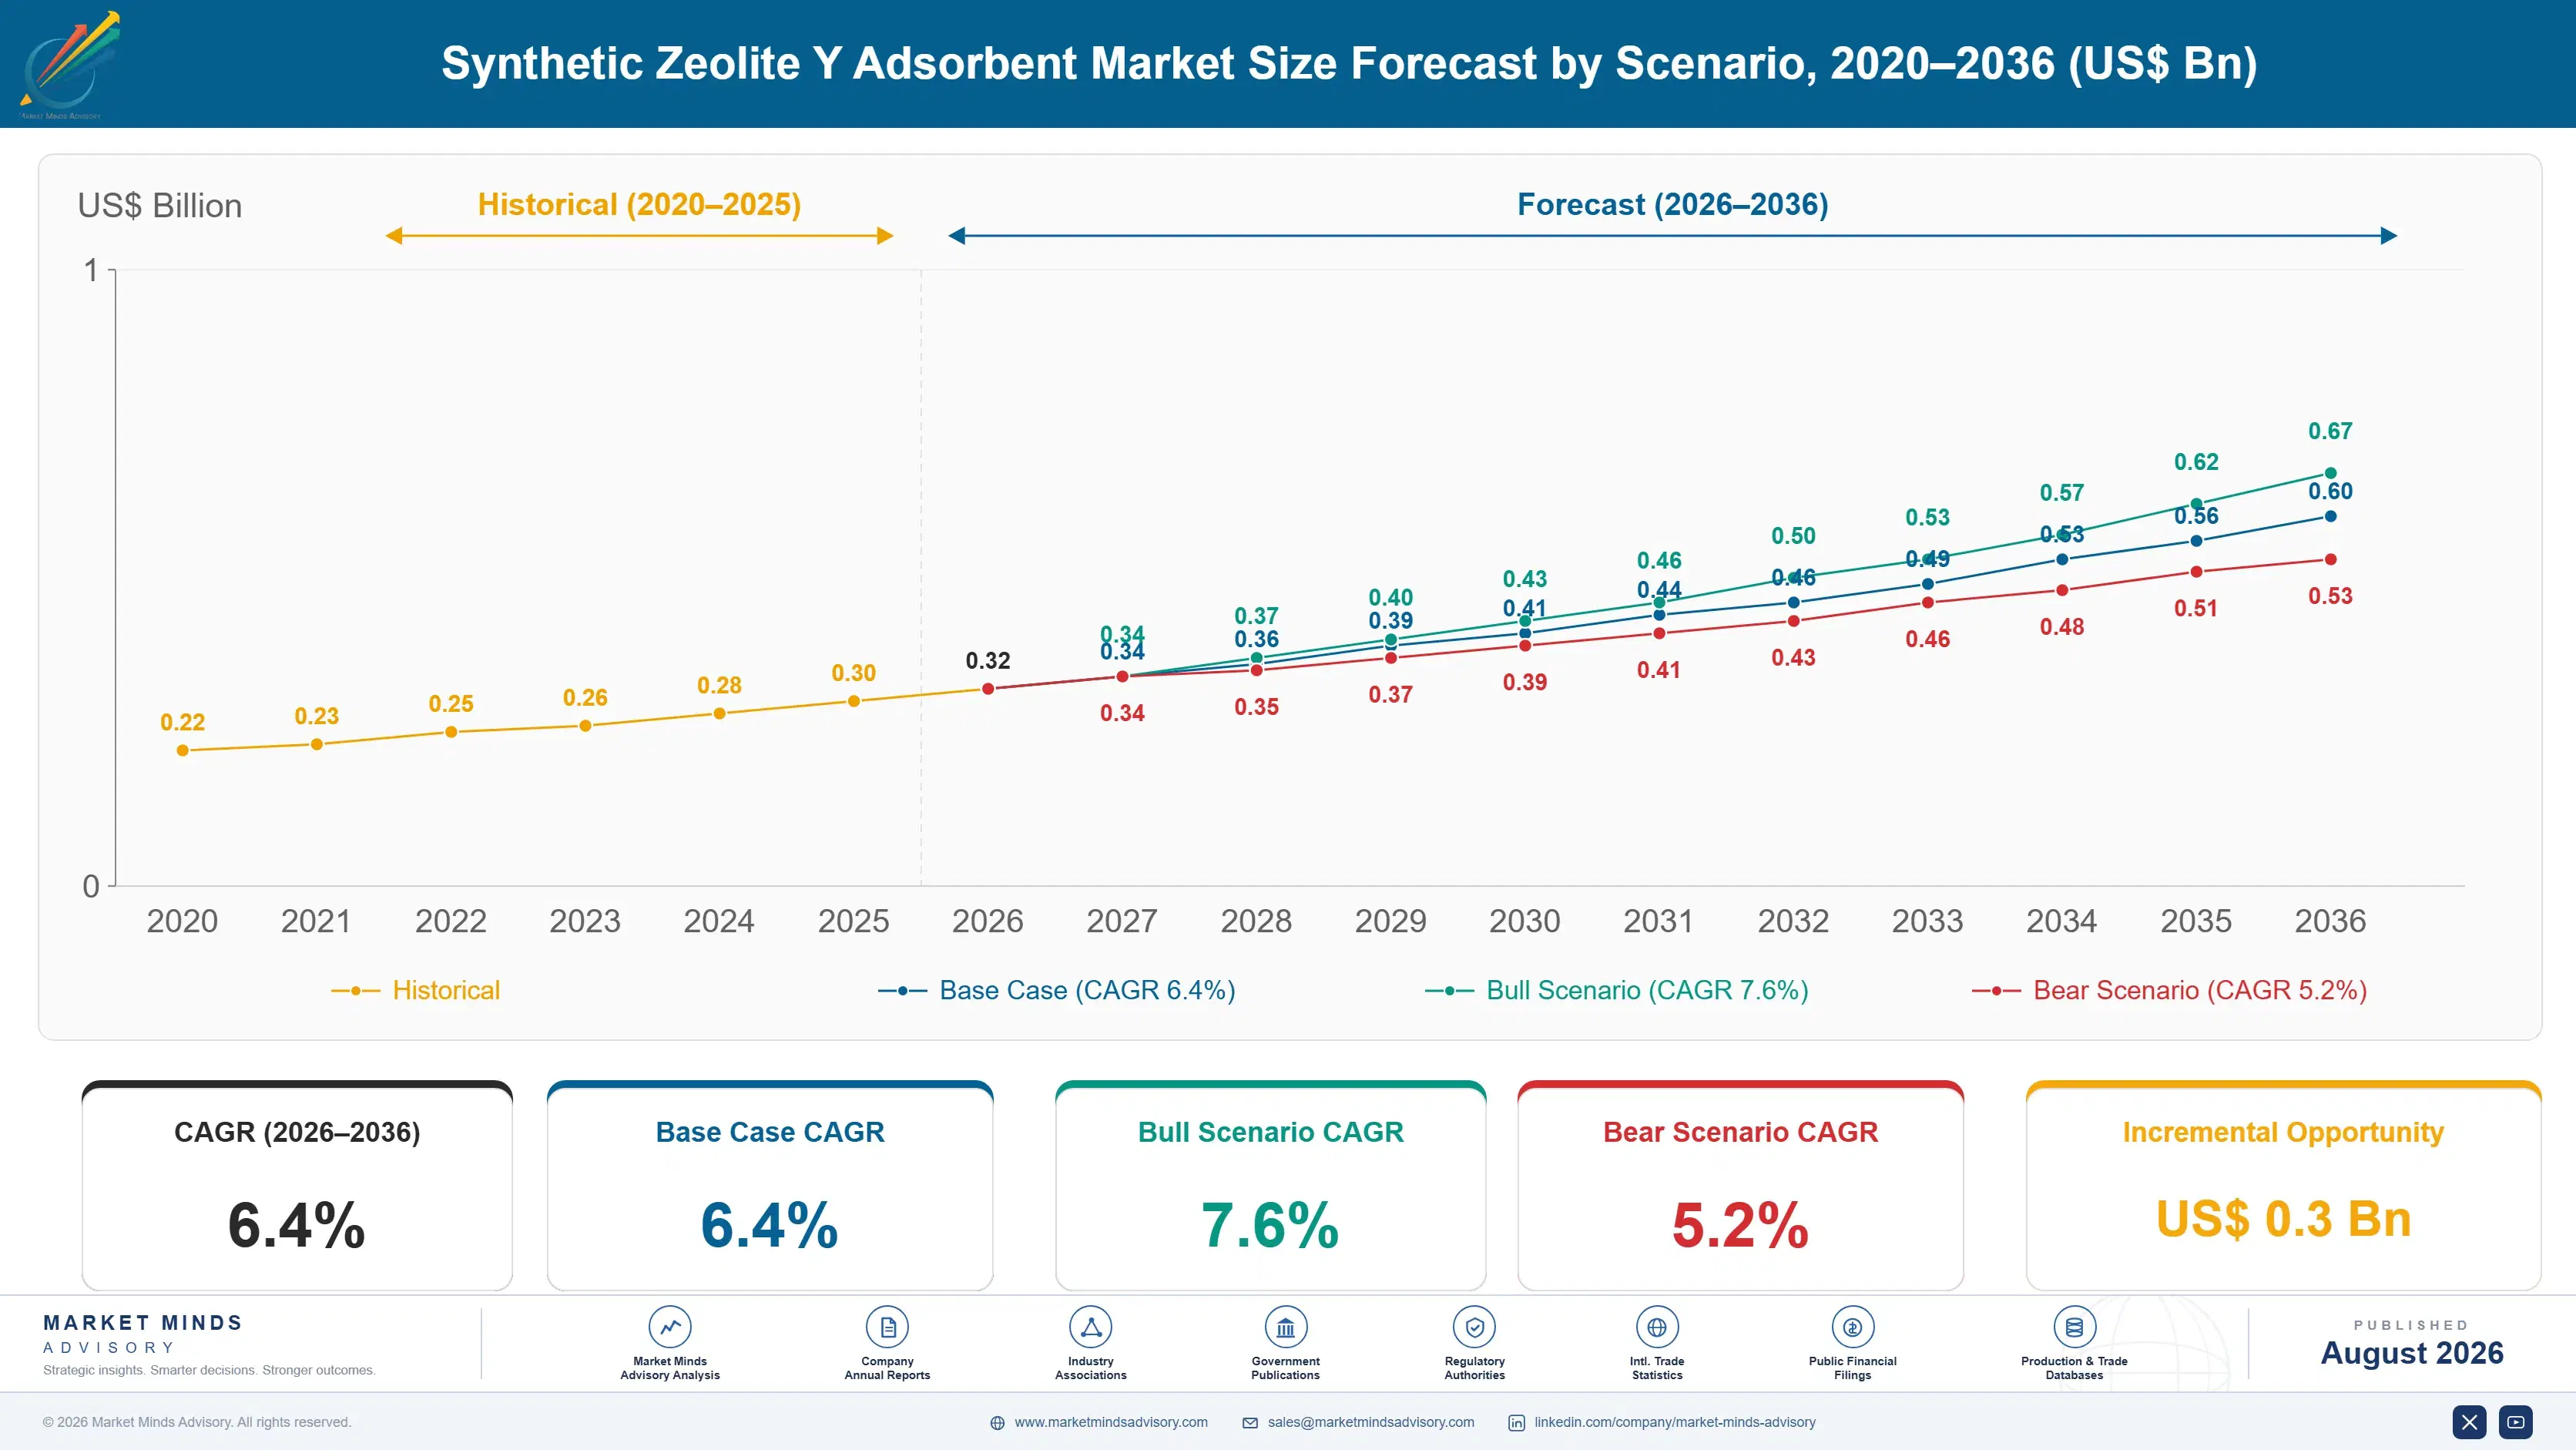
Growth ran near 5.4% between 2020 and 2025, tracking refinery and petrochemical utilisation more closely than any adsorbent specific variable. Replacement charge demand follows installed unit count with a lag of several years and moves very little in between. Water treatment applications began contributing meaningfully late in the period as emerging contaminant regulation appeared, and that demand behaved quite unlike the licensed process business.
Base case 6.4% rests on three mechanisms. Water and emerging contaminant treatment grows at 9.6% as regulation on fluorinated compounds tightens and regenerable adsorbents compete against single use carbon. Hydrocarbon and aromatics separation grows at 8.2% on petrochemical capacity additions in the Gulf and Asia. And Saudi Arabia grows fastest of any country at 9.8% as new petrochemical and refining capacity commissions. Two of the three sit outside the licensor structure entirely.
The bull case at 7.6% assumes emerging contaminant regulation extending across more jurisdictions, which would create adsorbent demand entirely outside the licensor structure that governs the rest of this market. The bear case at 5.2% is refinery rationalisation in developed markets closing units faster than Gulf and Asian capacity commissions, which would shrink the installed base carrying replacement demand.

Specified Once, Bought for Decades

A plant buying a replacement adsorbent charge is usually not making a purchasing decision at all. Around 71% of charges are bought against the specification a process licensor wrote into the design package, and departing from it means engaging the licensor, revalidating performance guarantees and accepting risk on a unit that currently runs. Almost nobody does that to save money on an adsorbent, whatever the alternative offers.
TOP FIVE CONCENTRATION64%Licensor approval and synthesis capability both narrow the field
PORE APERTURE7.4 AOpening size admitting branched hydrocarbons and aromatic molecules
CAPACITY LOSS PER CYCLE0.4%Adsorption capacity lost through each thermal regeneration cycle
BED REPLACEMENT INTERVAL4 yearsService period before a charge reaches breakthrough on specification
LICENSOR SPECIFIED SHARE71%Charges bought against a process licensor approved specification
HIGH SILICA YIELD LOSS34%Material lost through dealumination steps producing premium grades
The commercial consequence is that this market is decided years before any purchase order exists. A supplier written into a process design package collects replacement business across the unit's operating life, at roughly four year bed intervals, without competing again. A supplier calling on plant procurement is arriving after the decision, and no technical argument reopens a licensed design that is working.
Zeolite Y earns its position through geometry. A twelve ring aperture near 7.4 angstroms admits branched hydrocarbons and aromatics that smaller pore zeolites exclude entirely, which makes it the material of choice where the molecule being removed is bulky. It is less selective than narrower zeolites precisely because the door is wider, so it is specified for capacity on large molecules rather than for sharp separation of small ones.
"Every supplier in this business runs a technical sales team calling on refineries, and roughly seven charges in ten were decided by a licensor before those refineries were built. The people worth calling on are process engineering firms designing units that do not exist yet."
Director, Catalysts and Separation Materials Practice · MMA Chemicals and Materials Practice · August 2026

Market Trends

Emerging contaminant rules creating demand outside licensed processes

Regulation on fluorinated compounds and other persistent contaminants in water has created adsorbent demand from utilities and industrial dischargers who have no process licensor specifying what they buy. High silica zeolite Y is one of few regenerable options competing against single use activated carbon, and regenerability matters when the captured contaminant must then be destroyed rather than landfilled. Growth at 9.6% comes from buyers making genuine technical comparisons rather than following an inherited specification. That window is open now because the application is new enough that nobody has yet written an inherited specification into it, and it will not last.
Market Impact: Separation demand growing at 8.2%
Gulf petrochemical commissioning shifting the installed base east

New refining and petrochemical capacity commissioning across Saudi Arabia and the wider Gulf installs units whose adsorbent specifications are being written now, while developed market rationalisation removes units carrying legacy specifications. Saudi Arabia grows fastest of any country at 9.8% on that basis. The installed base is therefore not simply growing but relocating, and suppliers whose licensor relationships were built around North American and European engineering are following the wrong design offices. Design offices in Riyadh, Shanghai and Mumbai now write specifications that will govern replacement demand for decades, and most western suppliers have no coverage of them.
Market Impact: Loses only 0.4% per cycle

Market Opportunities and Growth Drivers

Petrochemical separation duty expanding with aromatics capacity

Aromatics complexes and associated separation units require adsorbents handling bulky molecules that narrower pore zeolites cannot admit, which is precisely where a twelve ring aperture near 7.4 angstroms is necessary rather than merely convenient. Hydrocarbon and aromatics separation grows at 8.2% as capacity additions concentrate in the Gulf and Asia. Each new complex writes adsorbent specifications during design, which makes commissioning pipelines the most useful demand indicator available to any supplier. Suppliers organised around operating plants are reaching those specifications long after they have already been fixed in a design package.
Market Impact: Closes 71% of charge demand

Regenerability displacing single use adsorbents on disposal cost

Where a captured contaminant must be destroyed rather than landfilled, a single use adsorbent becomes a waste disposal problem as well as a consumable, while a regenerable one concentrates the contaminant for treatment. That calculation increasingly favours zeolite systems over activated carbon in water applications despite higher initial cost. Disposal regulation rather than adsorption performance is what changes the comparison, and it is tightening across several jurisdictions simultaneously. Capacity retention through cycling matters more than initial capacity in that comparison, since a bed that must be replaced annually defeats the economics whatever it adsorbs.
Market Impact: Loses around 34% in processing

Market Restraints and Challenges

Licensed specifications closing plants to better materials

Around 71% of replacement charges are bought against a licensor approved specification, and departing from it means engaging the licensor, revalidating guarantees and carrying risk on an operating unit. The root cause is that process licensing transfers technical responsibility along with the design. Commercially it means product improvement cannot be sold into most of the installed base. Licensor engagement during design and qualification into new process packages are the only routes that actually work. Both take years and neither involves the plant at all. Neither route runs through the operating plant at all.
Market Impact: Water treatment growing at 9.6%

Dealumination yield loss raising premium grade cost sharply

High silica zeolite Y delivers the hydrothermal stability and hydrophobicity that demanding applications require, and reaching it means steaming and acid extraction steps that lose around 34% of the material. The root cause is that framework aluminium must be removed after crystallisation rather than avoided during it. Commercially it makes premium grades far more expensive than their synthesis suggests. Direct synthesis at higher silica ratios is the pathway being pursued without commercial success yet. Every input cost is multiplied across the surviving material, which is why premium grades price far above their raw material bill.
Market Impact: Saudi Arabia growing at 9.8%
4 additional market trends, 3 additional growth drivers, and 2 additional restraints and challenges are covered in the full report. Contact sales@marketmindsadvisory.com to access the complete intelligence.

Segment CAGR and Growth Architecture

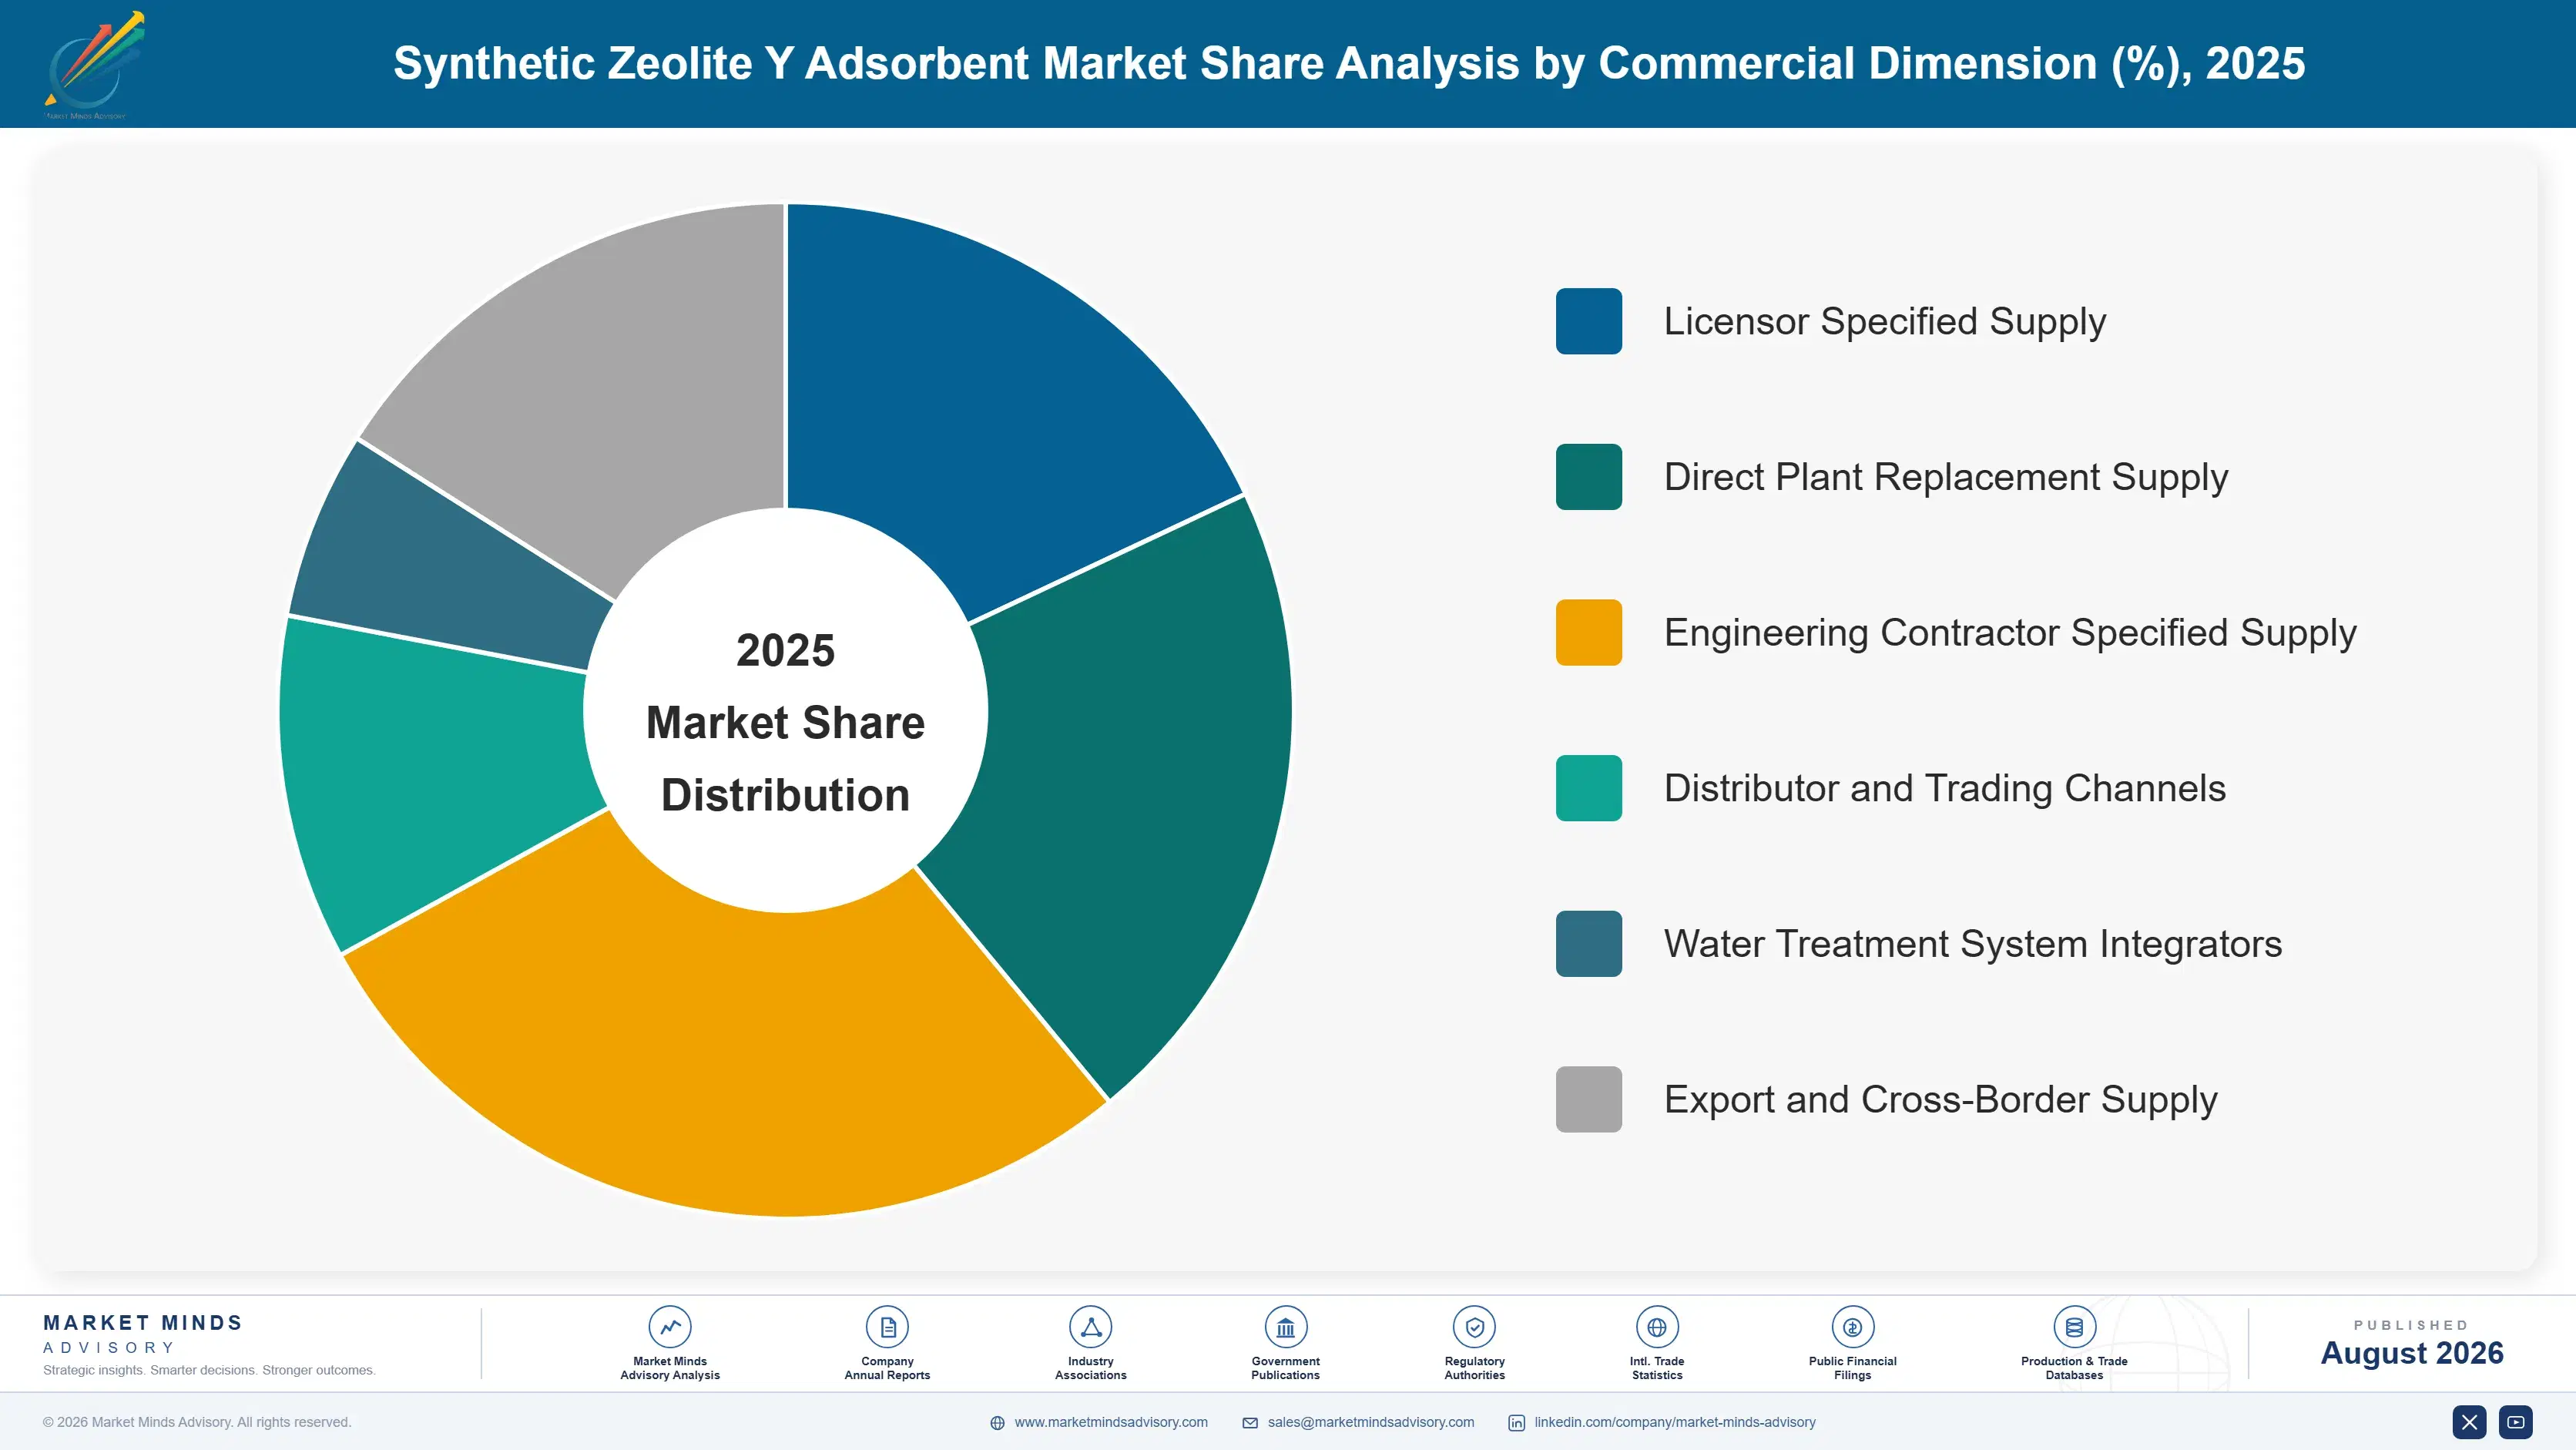
Six segments are split by application, because application determines the molecule being adsorbed and therefore the pore chemistry required, the regeneration regime, whether a process licensor controls the specification and the price the material commands. Bead and pellet forms sit inside each application. Silica ratio grades and channel are handled separately in the framework. Specification authority varies by application too.
synthetic-zeolite-y-adsorbent-market-trend-market-share-analysis-1787639661607

Water and Emerging Contaminant Treatment

Growing at 9.6%, half again the market rate of 6.4%, this covers removal of fluorinated compounds and other persistent contaminants from drinking water and industrial discharge, where high silica zeolite Y offers regenerability that single use activated carbon cannot. Regeneration matters most where the captured contaminant must be destroyed rather than landfilled, since a spent carbon bed becomes a hazardous waste problem. Buyers here are utilities and industrial dischargers with no process licensor dictating specification, which makes this the one segment decided on genuine technical comparison. Regeneration performance across cycles rather than initial capacity is what utilities actually evaluate. Disposal regulation on spent carbon is tightening across several jurisdictions at once, which strengthens the comparison further.
CAGR 9.6%

Hydrocarbon and Aromatics Separation

At 8.2% this covers separation duties in aromatics complexes and petrochemical units where the molecules being handled are too bulky for narrower pore zeolites to admit at all. A twelve ring aperture near 7.4 angstroms is a technical necessity here rather than a preference, which narrows the material choice considerably before any commercial discussion begins. Specification is written during process design and carried through the unit's operating life, so the commercial contest happens with engineering contractors and licensors years before any plant commissions. A twelve ring aperture is a hard requirement rather than a preference here, which means the competitive field is narrowed by physics before anybody discusses price or delivery at all.
CAGR 8.2%
Full segment breakdown across 6 segments available in the complete report.

Regional Architecture and Country Demand Map

East Asia holds 30% of value on petrochemical capacity and domestic zeolite manufacture at scale. North America follows at 24% on a large installed refining base carrying steady replacement charge demand. South Asia and Pacific grows fastest of the seven regions covered here. All shares hold in band.

North America

A large installed refining and petrochemical base carries steady replacement charge demand against specifications largely written by American process licensors decades ago. Emerging contaminant regulation on fluorinated compounds is more advanced here than anywhere, which makes water treatment the fastest growing regional application by some distance. Refinery rationalisation removes units gradually and takes their replacement demand with them. Growth at 5.8% reflects water treatment expansion offsetting a slowly contracting refining installed base. Specification authority still rests largely with American process licensors, which advantages the suppliers holding those approval positions considerably. Water treatment is now the fastest growing regional application by a wide margin, and it is decided entirely outside the licensor structure that governs everything else.
Share: 24% | CAGR: 5.8% (2026 to 2036)

Western Europe

Refining capacity has been contracting steadily for years, which removes installed units and the replacement charge demand attached to them permanently rather than temporarily. Petrochemical separation duty holds better than fuels refining. Emerging contaminant regulation is tightening and water treatment applications are growing, though from a smaller base than in North America. European producers hold strong positions in specialty grades and licensor relationships. Growth of 5.0% is the slowest anywhere on a contracting industrial base. Licensor relationships remain valuable for export projects even as the domestic installed base shrinks, which is where regional suppliers now find their growth. Domestic replacement demand will keep contracting as refining capacity closes, whatever happens to export project activity.
Share: 20% | CAGR: 5.0% (2026 to 2036)
Regional intelligence for 5 additional markets available in the complete report: East Asia, South Asia and Pacific, Latin America, Middle East and Africa, Eastern Europe. Contact sales@marketmindsadvisory.com.
synthetic-zeolite-y-adsorbent-market-trend-country-cagr-analysis-1787639662141

Four Moves Before the Order Exists

Seven charges in ten are decided by a specification written during process design, which means most commercial effort in this industry is spent arguing with people who cannot change their minds. The moves that matter reach engineering offices, follow commissioning pipelines and find the buyers who have no licensor at all. All four require different people.

Qualify into process design packages rather than plants

Around 71% of replacement charges follow a licensor approved specification and a unit runs for decades on roughly four year bed intervals, so a supplier written into the design package captures that whole stream without competing again. Reaching licensors and engineering contractors is slow, technical and unglamorous work that pays across an operating life. Selling to plant procurement afterwards is arguing against a decision made before the plant was built. Approval positions also renew themselves as licensors extend designs into new projects, which compounds the return on the original technical work considerably.
Market Impact: Captures 71% of all the replacement charge demand

Build the water treatment position while it is open

Water and emerging contaminant treatment grows at 9.6% and its buyers are utilities and industrial dischargers with no process licensor dictating specification, which makes it the one segment decided on technical comparison. Regenerability against single use carbon is the argument, and it strengthens wherever disposal regulation tightens. That window is open now precisely because the application is new enough that nobody has written an inherited specification into it. Validation with a utility also holds well afterwards, since revalidating a treatment system carries regulatory cost the utility would rather avoid entirely.
Market Impact: Serves the full 9.6% water treatment segment growth

Follow commissioning pipelines rather than existing accounts

New units write their adsorbent specifications during design, and commissioning pipelines in the Gulf and Asia are public years in advance. Saudi Arabia grows at 9.8% on that basis. A supplier tracking those projects reaches the engineering office while specification is still open, which is the only moment the decision is genuinely contestable. Suppliers organised around existing refinery relationships are following an installed base that is relocating away from them. Project pipelines are published years ahead and almost nobody in this industry systematically tracks them. Coverage of those design offices is cheap relative to what it decides.
Market Impact: Follows 9.8% Saudi capacity growth in every year

Attack the dealumination yield loss directly

Producing high silica grades loses around 34% of the material through steaming and acid extraction, which makes premium products far more expensive than their synthesis cost implies. Direct synthesis at higher silica ratios would remove that loss entirely and no competitor has commercialised it. The research is difficult and the prize is a step change in premium grade economics rather than an incremental efficiency gain of the usual kind. Nobody has commercialised a route to it, which is exactly why the prize is worth pursuing rather than incremental. The economics change in a step rather than gradually.
Market Impact: Recovers up to 34% of the yield loss

Who Controls the Margin Pool

Participation is measured on annual adsorbent production tonnage, and the top five hold 64%. Concentration is high because licensor approval positions and consistent crystallisation capability both take years to establish, and neither can be bought. Honeywell UOP leads by combining process licensing with adsorbent supply, which lets it specify its own material into designs competitors then cannot displace. The gap to challengers is approval position rather than synthesis capability.
Competition runs on three fronts. Licensor approval decides access to the majority of replacement demand before any plant exists. Crystallisation and dealumination capability decide which grades a producer can make consistently. And delivered cost decides the applications where no licensor specification applies, where Chinese producers compete effectively. Specification authority itself has become a fourth front, as design offices relocate toward the regions building capacity.

Pressure ahead comes from water treatment demand arriving outside the licensor structure, and from Asian engineering contractors writing specifications that western licensors once controlled. Expect suppliers to compete harder for design office relationships. Rankings shift on who reaches the new engineering centres first. Concentration should hold while licensor approval remains the barrier.
synthetic-zeolite-y-adsorbent-market-trend-company-positioning-matrix-1787639662683

Competitive Moat and Risk Dimensions

HONEYWELL UOP

Moat: Process licensing and adsorbent supply

Licensing separation and refining processes while also supplying the adsorbents those designs specify creates a position no material supplier can attack from outside, since the specification and the product come from the same organisation. That combination captures replacement demand across a unit's operating life without any competitive purchasing event ever occurring at the plant.
HONEYWELL UOP

Risk: Asian engineering contractor displacement

Specifications for new capacity in China and increasingly across Asia are being written by domestic engineering contractors rather than by western licensors, which removes the mechanism this position depends upon entirely. That shift is commercial and geographic rather than technical, and no improvement in adsorbent performance addresses it in any way.
ARKEMA

Moat: Specialty grade synthesis capability

Consistent crystallisation and dealumination capability across specialty grades supports applications where hydrothermal stability and hydrophobicity decide performance, and where a producer that cannot hold specification simply does not qualify. That capability takes years to develop and is genuinely difficult to replicate, particularly for the highest silica grades that lose substantial material in processing.
ARKEMA

Risk: Licensor specification dependence

Without a process licensing arm, access to most replacement demand depends on being approved into somebody else's design package, which is a position held at another organisation's discretion. Losing an approval or failing to reach a new engineering centre removes access to a whole installed base regardless of how good the material happens to be.

Players Tracked

Prominent Players

Honeywell UOP
Arkema
Tosoh
W. R. Grace
Zeochem

Other Key Players

BASF
Clariant
Zeolyst International
Axens
Union Showa
Luoyang Jianlong Micro-nano
Shanghai Hengye Molecular Sieve
Jalon Micro-Nano
Sinopec Catalyst
PQ Corporation
Chemiewerk Bad Kostritz
Interra Global
KNT Group
Sorbead India
Wuxi Wanda Molecular Sieve

Recent Developments

MARCH 2026

Utility selects regenerable zeolite over carbon on disposal grounds

A water utility selected a regenerable high silica zeolite system over granular activated carbon for fluorinated contaminant removal, citing the disposal cost and regulatory handling of spent carbon rather than any difference in adsorption performance between the two. Regeneration performance across cycles decided the technical comparison. Capacity was comparable.
Signal: Disposal regulation rather than adsorption capacity is deciding these water treatment comparisons almost every time now
SEPTEMBER 2025

Gulf petrochemical project writes adsorbent specification during design

A Gulf petrochemical project selected adsorbent suppliers during process design, fixing specifications that will govern replacement charges across the unit's operating life at roughly four year intervals for several decades ahead. No competing supplier was consulted after the design package was fixed. The decision closed quietly.
Signal: The commercial decision is taken years before the plant exists and rarely reopens afterwards for anybody outside
DECEMBER 2025

Asian engineering contractor specifies domestic adsorbent for new complex

An Asian engineering contractor specified domestically produced adsorbent for a new petrochemical complex, in a role that western process licensors would previously have filled. The specification will carry through the unit's whole replacement cycle. Western suppliers were not consulted at any stage of the design process.
Signal: Specification authority is moving to Asian design offices, taking the installed base with it as it goes

Silicate, Aluminate and Calcination

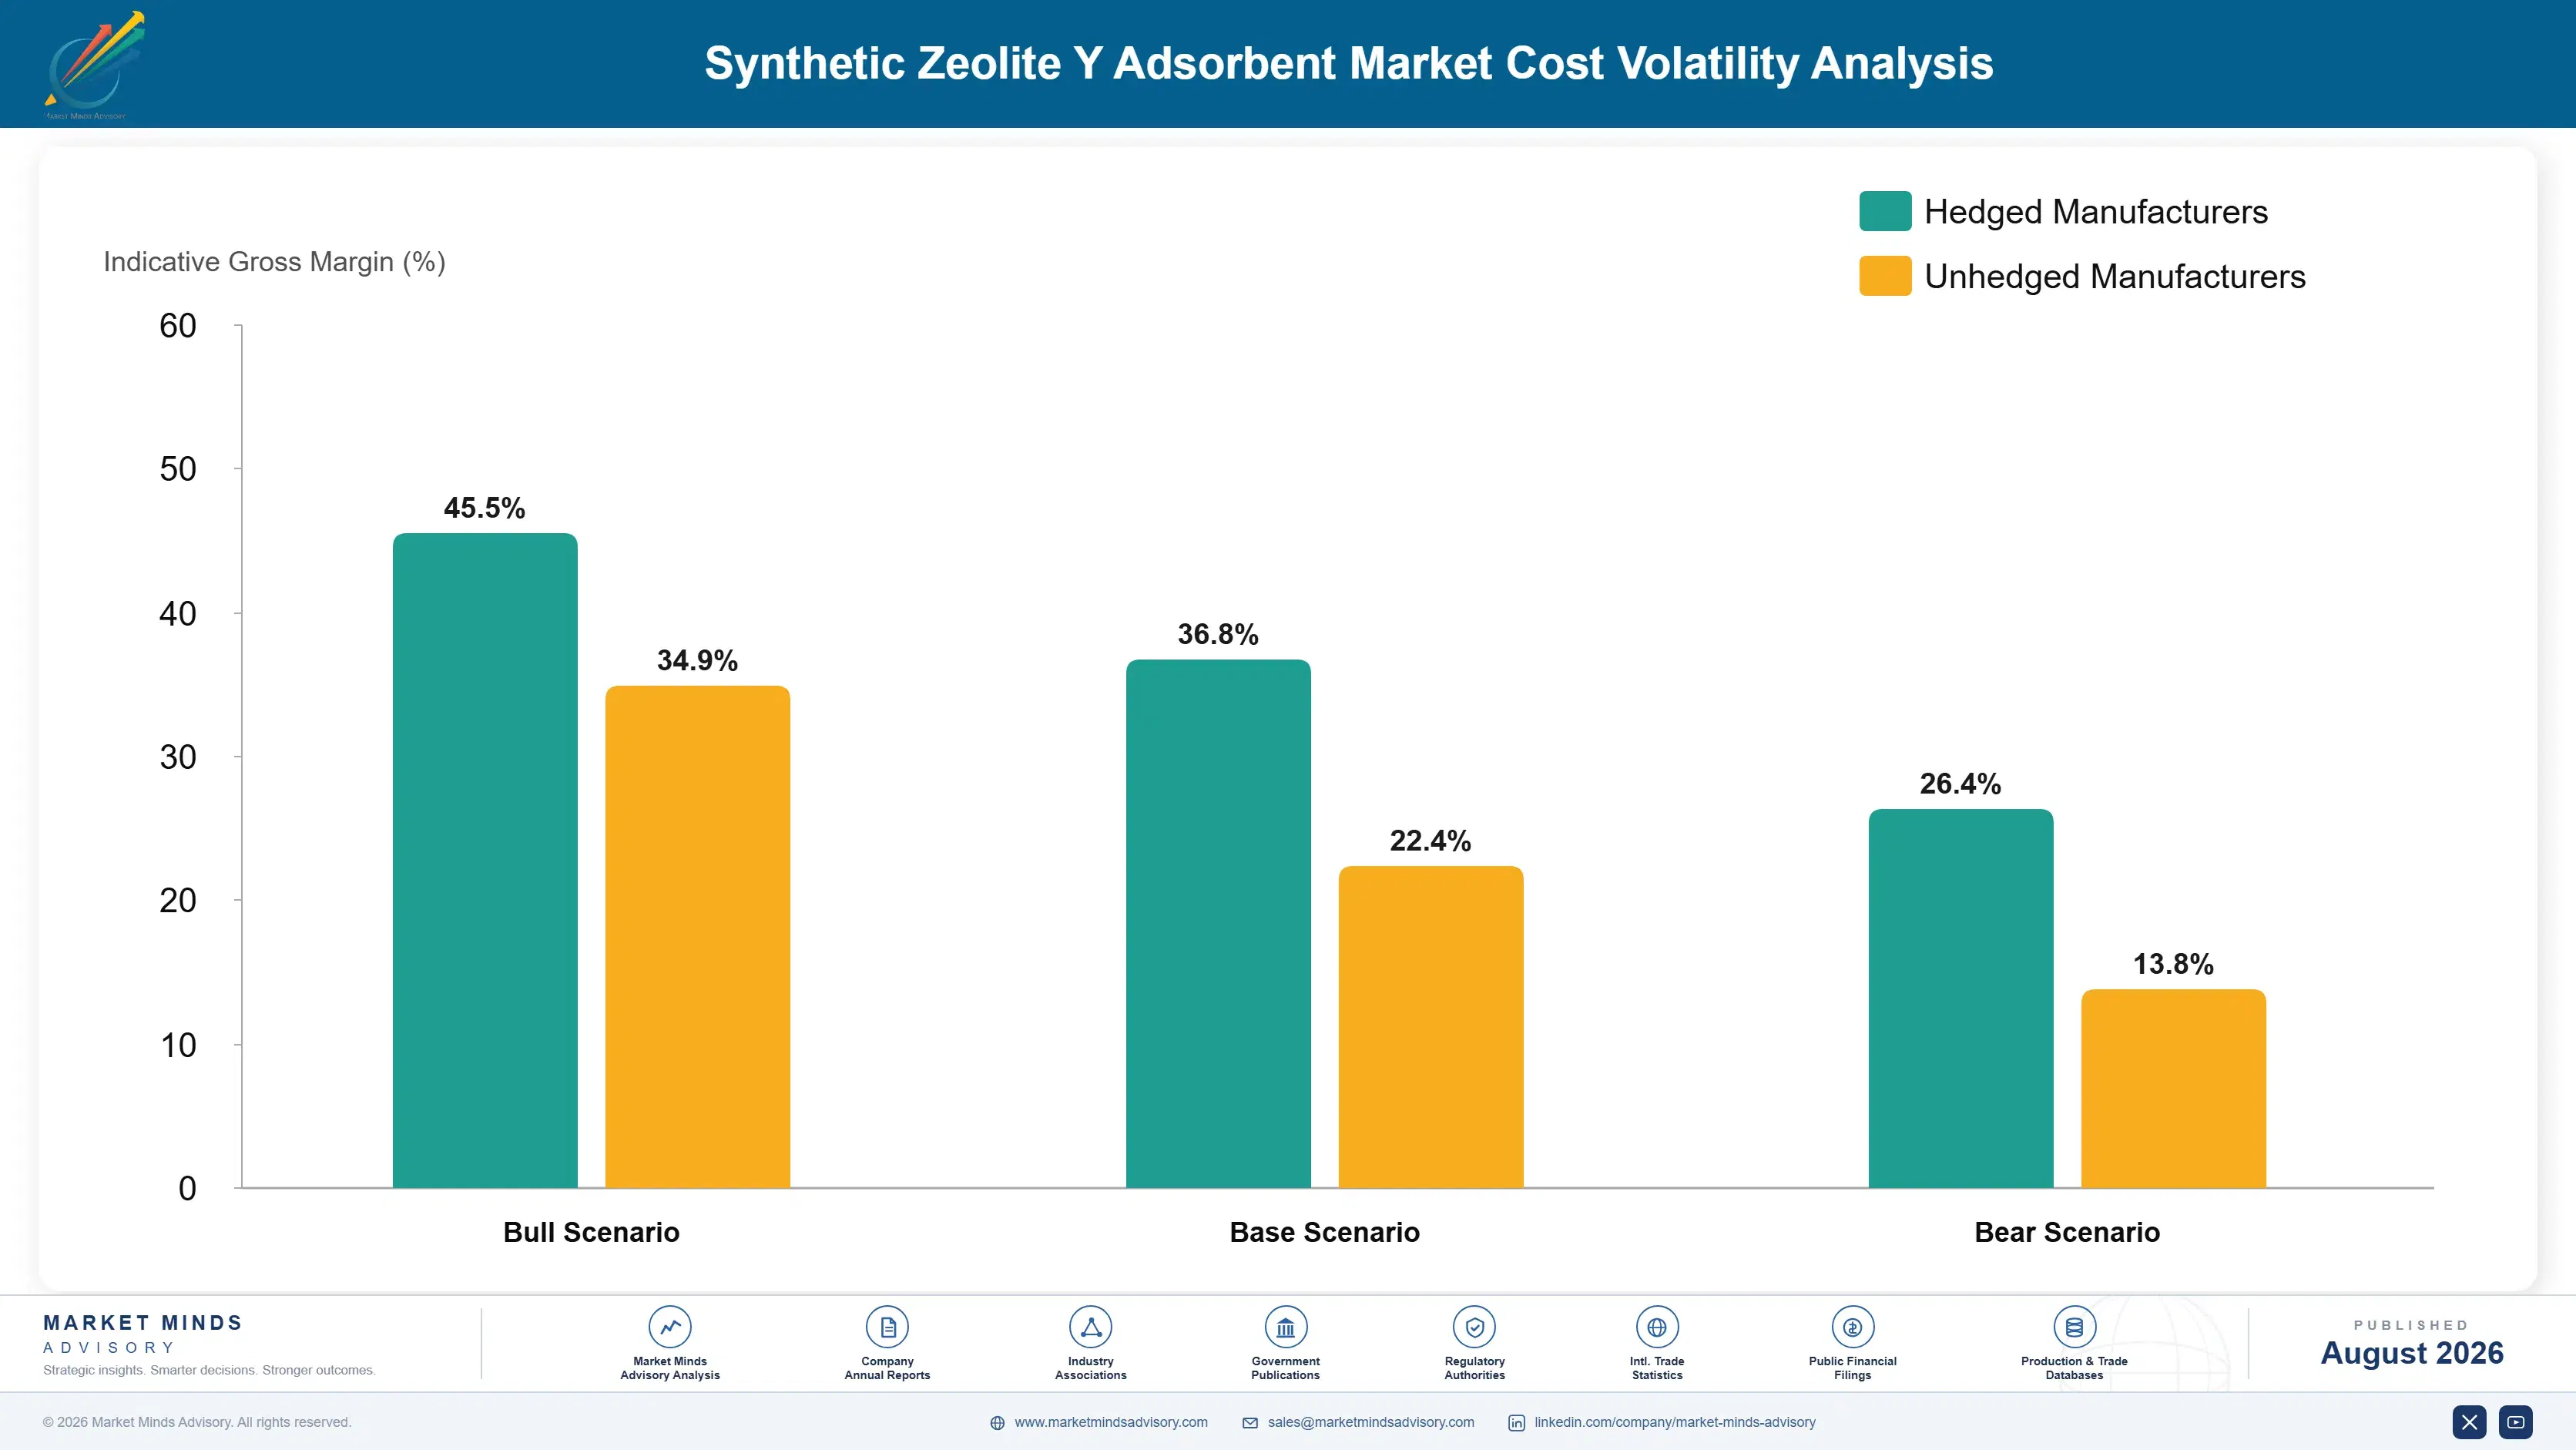
Sodium silicate and sodium aluminate carry around 38% of production cost, both energy intensive to manufacture and priced against caustic soda and industrial energy. Energy for crystallisation, filtration, drying and calcination takes about 27%, which is high because the process runs hot for extended periods. Binders and forming aids account for around 11%. Acid, water treatment, packaging and freight absorb the balance across most producers.
Industrial energy and caustic soda pricing both moved sharply through 2022, per IEA industrial energy reporting alongside Arkema and Tosoh annual reporting for 2025 on specialty materials cost exposure. Zeolite manufacture absorbed that movement more heavily than most inorganic chemicals because crystallisation and calcination are both prolonged high temperature steps that offer very little scope for reduction. Siting decisions since have weighted energy far more heavily than before.

Exposure divides on grade and on energy position rather than on scale. A producer making standard grades carries silicate, aluminate and energy in proportion. A producer making high silica grades additionally loses around 34% of material in dealumination, which multiplies every input cost across the surviving product. Chinese producers carry lower energy cost and compete hardest in applications where no licensor specification protects the incumbent.
synthetic-zeolite-y-adsorbent-market-trend-cost-volatility-analysis-1787639662887

Pursue direct synthesis at higher silica ratios

Dealumination loses around a third of the material to reach the silica ratios demanding applications require, which multiplies every input cost across what survives. Direct synthesis at higher ratios would remove that loss entirely rather than reducing it, which is a step change rather than an efficiency gain and remains commercially unsolved by anybody.

Recover and reuse dealumination process streams

Steaming and acid extraction generate aluminium bearing streams currently treated as effluent, which carries disposal cost on top of the material already lost. Recovering usable aluminium compounds from those streams addresses two cost lines at once and reduces the environmental burden that increasingly attracts regulatory attention at zeolite plants. Regulatory attention is rising too.

Site calcination capacity against industrial energy pricing

Crystallisation and calcination together carry over a quarter of production cost and run hot for extended periods, which makes regional industrial energy pricing a genuine competitive variable. European producers found this out during the last cost cycle, and siting decisions since have weighted energy alongside customer proximity considerably more heavily. Customer proximity rarely coincides with cheap energy.

Portfolio Architecture for Margin Defence

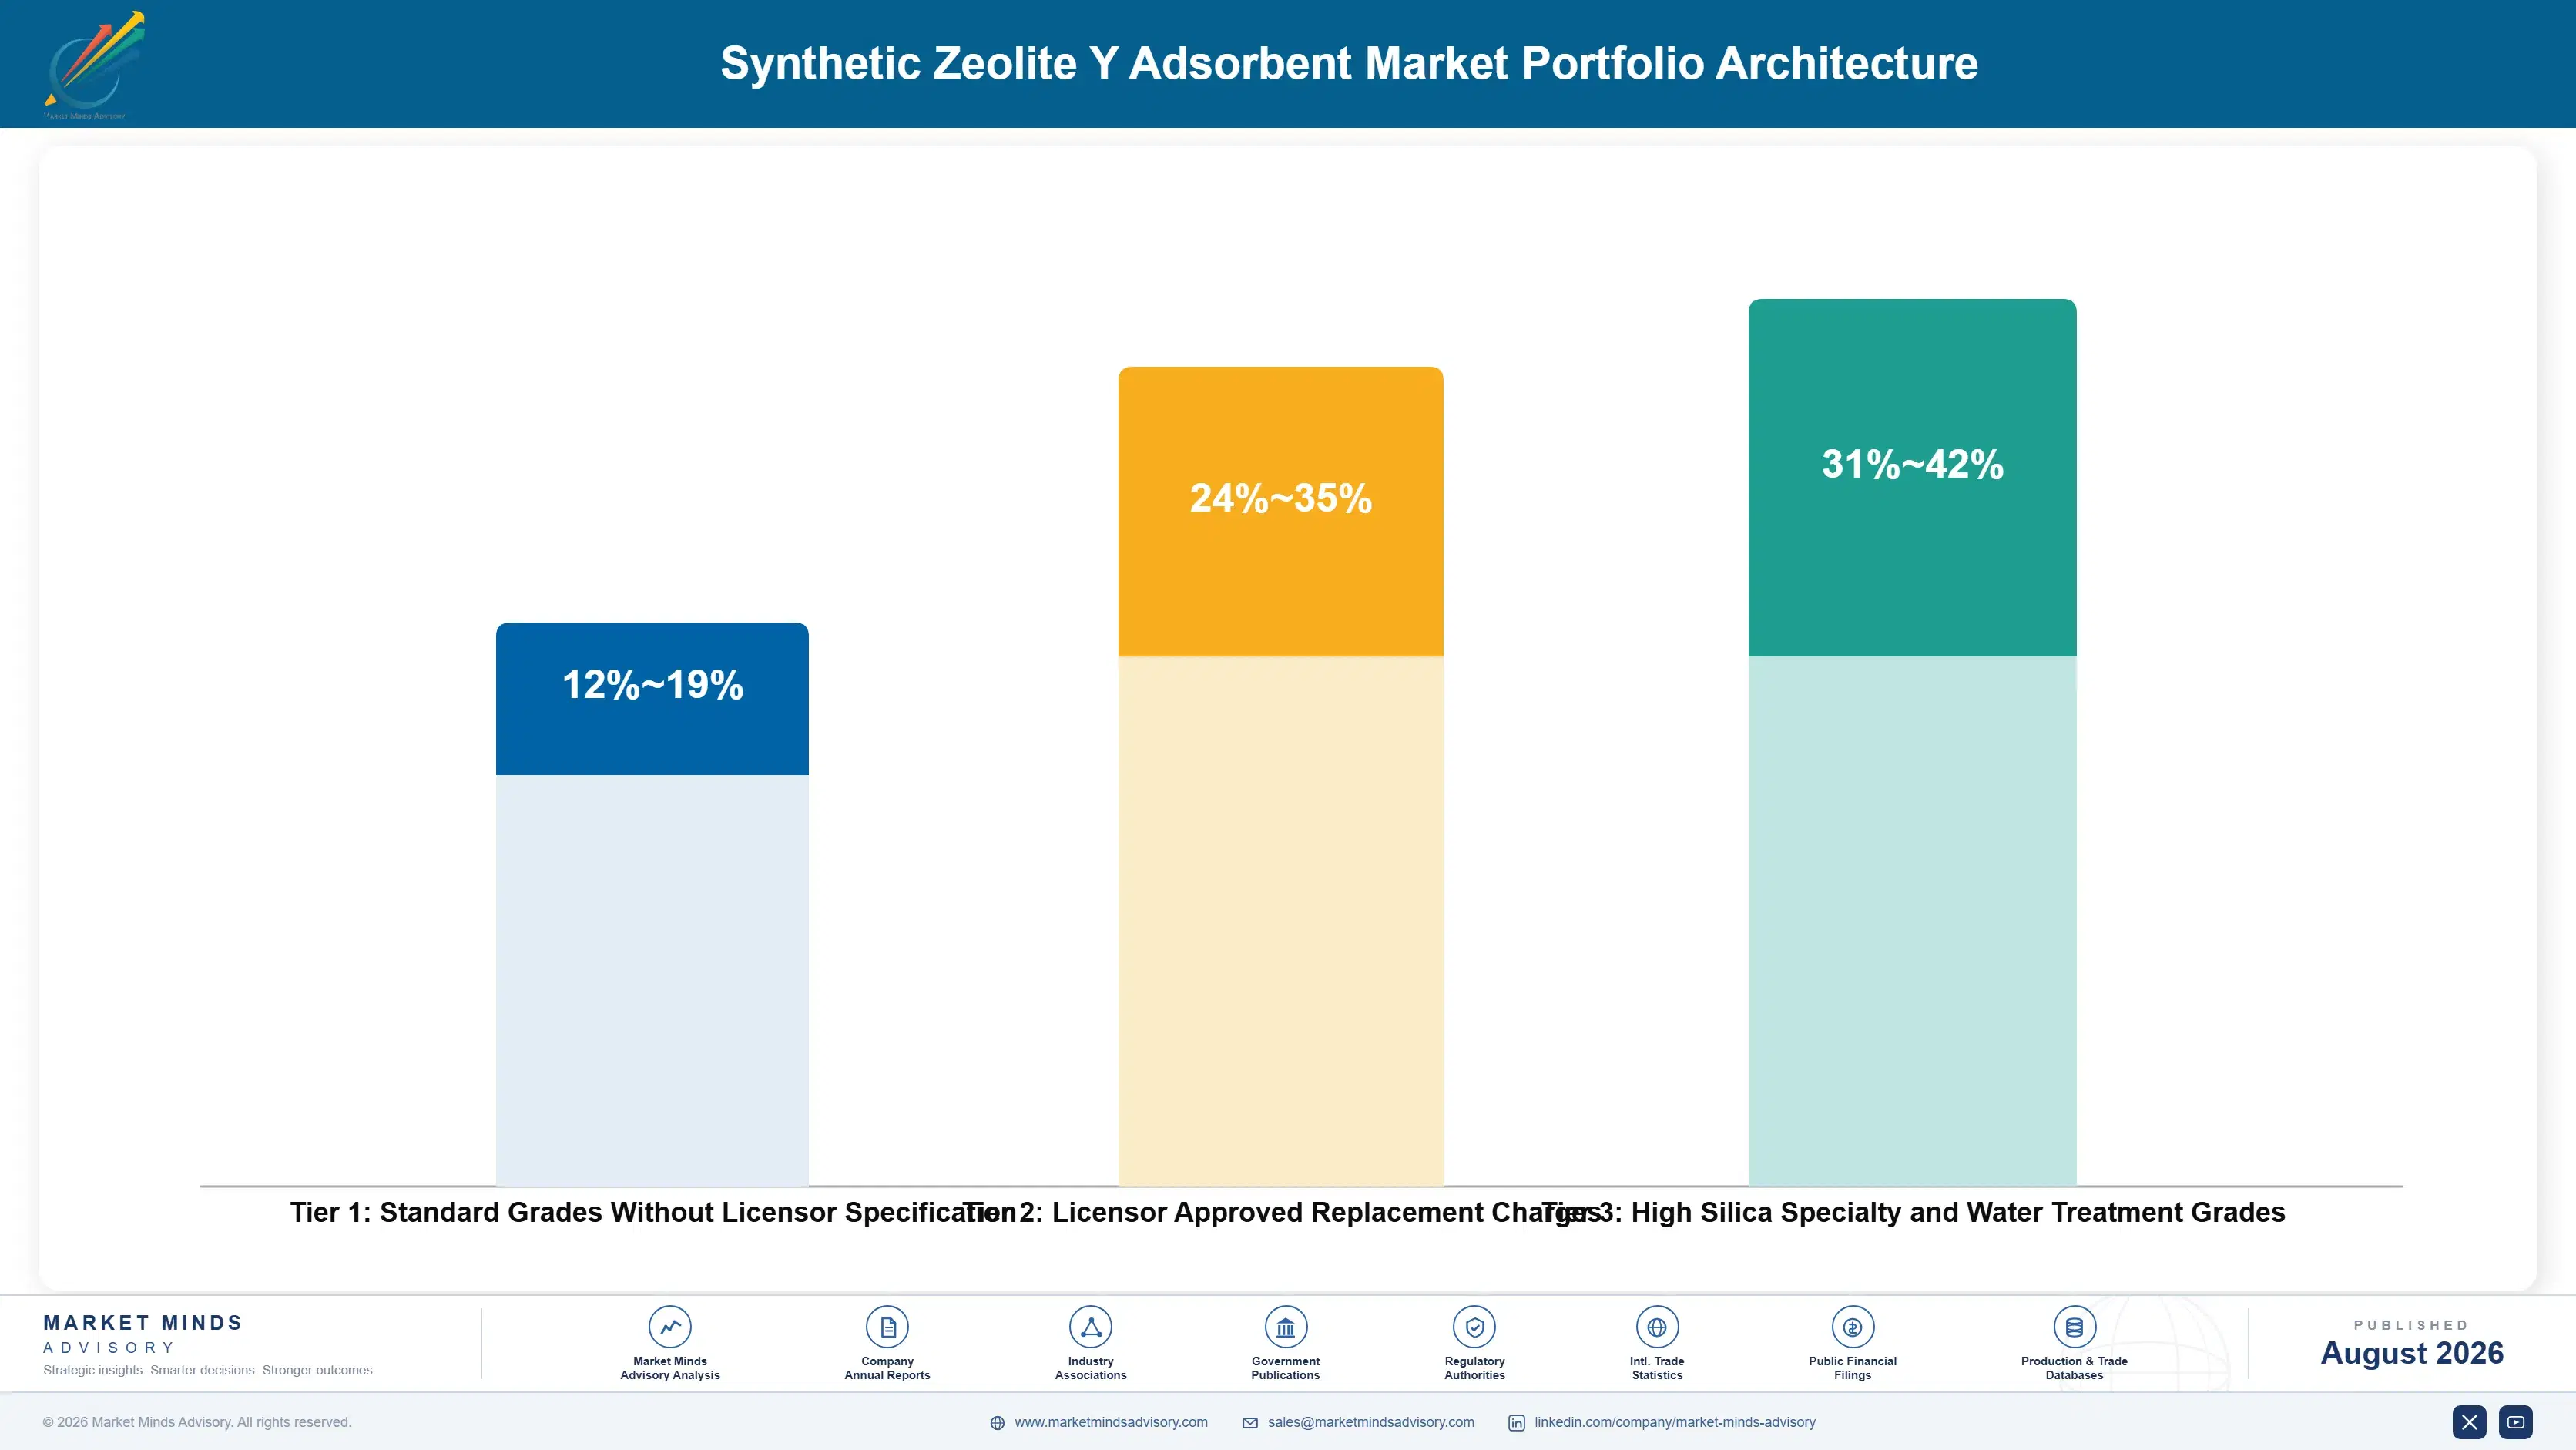
Margin here follows specification control rather than material quality, because a producer written into a licensed design faces no competitive purchasing event at all. Standard grades sold into applications without licensor specification earn margins in the low to high teens, where Chinese producers compete on delivered cost and buyers compare adsorption capacity directly. Nothing protects an incumbent there. Adsorption capacity is the whole comparison.
Licensor approved replacement charges do better in the mid twenties to mid thirties, because the plant cannot readily substitute without engaging the licensor, and the supplier collects that business across a unit's operating life at roughly four year intervals without competing again for it. That is the most durable commercial relationship available anywhere in this industry. Approval positions also renew as licensors extend designs into further projects.

High silica specialty and water treatment grades hold the strongest position, reaching into the low forties, where hydrothermal stability, hydrophobicity and regenerability decide performance and few producers can hold specification consistently. Those margins reflect synthesis capability and the material lost reaching those grades rather than any commercial advantage. Material lost in dealumination is carried entirely by the surviving product. Very few producers hold the highest silica grades consistently.

Standard Grades Without Licensor Specification

Conventional adsorbent sold where no design specification constrains the buyer. The seven point range reflects energy cost position and manufacturing scale rather than any difference in adsorption performance delivered. Capacity is compared directly.
Gross Margin: 12-19%

Licensor Approved Replacement Charges

Charges bought against a design package specification across a unit's operating life. The eleven point range reflects the strength of the approval position and whether alternatives have been qualified alongside.
Gross Margin: 24-35%

High Silica Specialty and Water Treatment Grades

Grades where hydrothermal stability, hydrophobicity and regenerability decide selection. The eleven point range reflects synthesis capability and how much material is lost reaching the required silica ratio. Few producers hold specification consistently.
Gross Margin: 31-42%
synthetic-zeolite-y-adsorbent-market-trend-portfolio-architecture-1787639663387

High-value Sub-segments and Strategic Watch-out

Water Treatment Grades

High value and the fastest growth at 9.6%, and the only segment where buyers make genuine technical comparisons rather than following an inherited licensor specification written during process design. Disposal regulation on spent carbon frequently decides the comparison rather than adsorption capacity. Regenerability is the argument.
Gross Margin: 33-42%

Licensor Approved Charges

High value and durable, capturing replacement demand at roughly four year intervals across a unit's whole operating life without any competitive purchasing event occurring at the plant. The decision was taken during design, often decades before the charge is ordered. No competitive purchasing event ever occurs.
Gross Margin: 26-35%

Standard Unspecified Grades

The volume core, where adsorption capacity is compared directly and Chinese producers compete effectively on delivered cost with no specification protecting any incumbent supplier. Delivered cost decides every order and no design package protects anybody. Chinese producers compete hard on cost across these applications. Price decides.
Gross Margin: 12-19%

Specification Authority Shift

The strategic watch-out. Asian engineering contractors increasingly write specifications western licensors once controlled, and the range reflects whether a supplier has reached those design offices yet. No improvement in adsorbent performance addresses that shift in any way. Coverage of new design offices is the only real answer available.
Gross Margin: 10-40%

Design Offices and Utilities

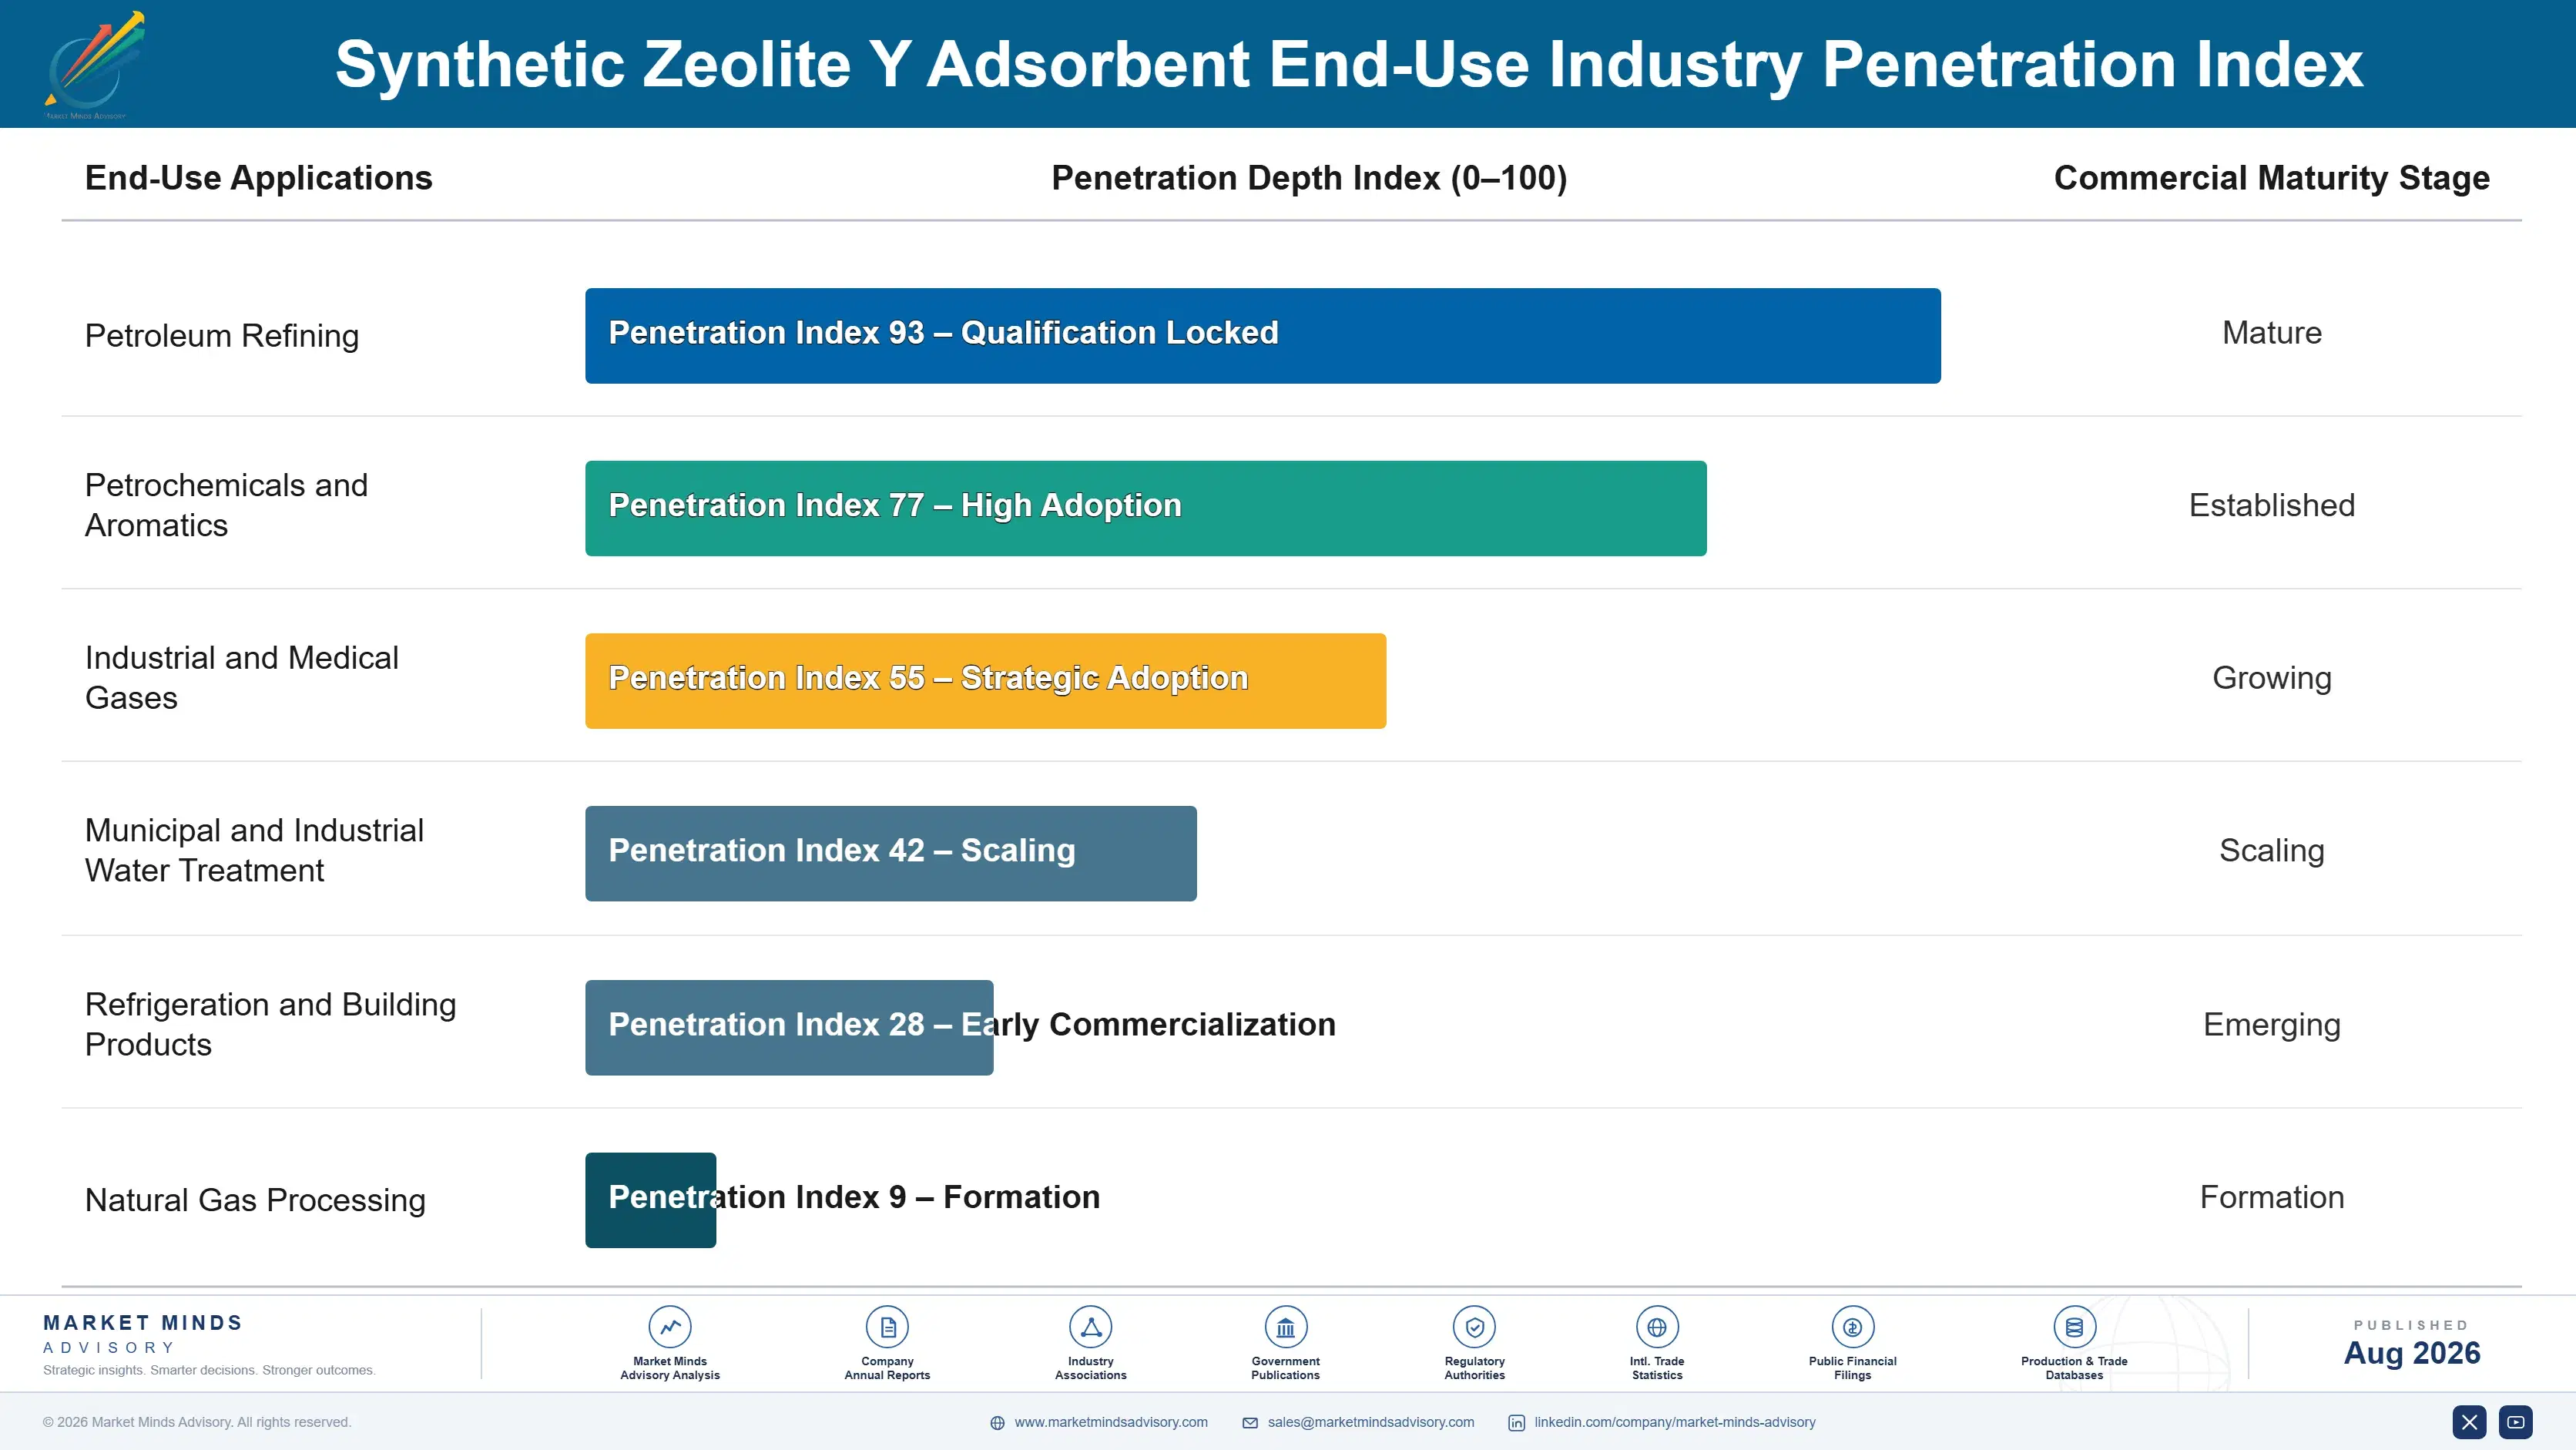
Demand splits between buyers who inherited a specification and buyers who write their own. A refinery replacing a charge is executing a decision taken during design, often decades ago and by somebody who has since retired. A water utility selecting an adsorbent for contaminant removal is comparing regenerable and single use options on their merits, with disposal cost frequently deciding it. The two behave nothing alike commercially.
Stickiness follows specification rather than satisfaction. A licensor approved position holds across a unit's whole operating life without any competitive event, which makes it the most durable commercial relationship available in this industry. Unspecified supply reopens at every charge. Water treatment positions hold once a system is installed and validated, since revalidation carries regulatory cost for the utility.

The deciding functions therefore sit outside the customer as often as inside it. Engineering contractors and process licensors decide most of this market during design work for plants that do not exist. Plant procurement executes rather than decides. Utility and industrial water functions decide genuinely, which is why that segment behaves so differently from the rest of the market. Most suppliers call on the wrong one.
synthetic-zeolite-y-adsorbent-market-trend-end-use-penetration-index-1787639663878

Where We Would Put Effort

These are among the four positions where our research anticipates prominent divergence between winners and laggards over the coming forecast period. Each is grounded in the demand model, the regulatory perimeter, and the announced capacity pipeline.
01 / DESIGN PACKAGE QUALIFICATION

Sell to people building plants that do not exist

Around 71% of replacement charges follow a specification written into a licensed process design package, and the unit then runs for decades buying replacement charges at roughly four year intervals without ever competing again. A supplier written into that design package therefore collects the whole replacement stream without ever competing again. Calling on plant procurement afterwards means arguing against a decision taken before the plant was built, by people who have in many cases left the industry altogether since then.
02 / WATER SEGMENT ENTRY

The one buyer with no licensor

Water and emerging contaminant treatment grows at 9.6% against a market rate of 6.4%, and its buyers are utilities and industrial dischargers who compare regenerable and single use adsorbents on their genuine technical merits alone. Disposal regulation covering spent carbon frequently decides that comparison rather than any difference in adsorption capacity. That window is open precisely because the application is new enough that no inherited specification governs it yet, and it will certainly not stay open indefinitely once positions harden.
03 / COMMISSIONING PIPELINE TRACKING

The installed base is relocating eastward

New refining and petrochemical capacity commissioning across the Gulf and Asia writes its own adsorbent specifications during the design phase, while developed market rationalisation permanently removes the older units carrying legacy specifications with them. Saudi Arabia grows fastest of any country at 9.8% on precisely that basis, and the wider Gulf follows it. Suppliers whose licensor relationships were built around North American and Western European engineering offices are following an installed base that is steadily and permanently moving away from them.
04 / DEALUMINATION YIELD RESEARCH

A third of the material never reaches a customer

Reaching the silica ratios that demanding applications require costs around 34% of the material through steaming and acid extraction, which multiplies every single input cost across whatever material survives the process. Direct synthesis at higher ratios would remove that loss rather than merely reducing it, and no competitor anywhere has yet commercialised any viable route to it. The research involved is genuinely difficult and the prize on offer is a step change in premium grade economics rather than an incremental improvement.

Engagement Snapshot From the Field

A live engagement with an industry participant carrying material or product regulatory and market exposure ahead of a defining policy shift, showing how our research translates into a defensible multi-year portfolio strategy.
MARKET MINDS ADVISORY · CLIENT ENGAGEMENT SUMMARY
Synthetic Zeolite Y Adsorbent Producer Strategic Portfolio Review and Transition Roadmap 2026·Investment Scenario on Synthetic Zeolite Y Adsorbent Exposure Evaluation 2025-26
CLIENT PROFILE
A European adsorbent producer manufacturing zeolite Y grades for refinery and petrochemical customers across regional and export markets, at annual revenue near 74 million euros (client-reported, unverified by MMA). Commercial effort was organised around technical sales calling directly on operating plants and their procurement functions. No licensor relationships existed. Water treatment had never been served.
STRATEGIC CHALLENGE
Technical sales activity had produced very little conversion despite favourable performance data, and volumes were declining as European refining capacity closed. Management wanted to know whether the products were uncompetitive or whether something else was preventing them from winning business. A restructuring plan was pending. Capacity utilisation was falling. A decision was overdue.
MMA APPROACH
MMA traced how adsorbent specifications were actually set across the client's target plants, quantified the share of demand governed by licensor design packages, sized water treatment and unspecified applications separately, and mapped commissioning pipelines in growth regions against the client's commercial coverage. Interviews with 47 experts covered process licensing, refinery operations and water treatment engineering.
KEY FINDINGS
  1. Around seven charges in ten across the client's target plants were governed by licensor approved specifications the plant had neither authority nor appetite to change.
  2. Technical sales calls were reaching procurement functions that executed decisions rather than making them, which explained the conversion rate far better than any product comparison did.
  3. Water treatment applications in the client's own region were growing quickly and being awarded on genuine technical comparison, with no supplier holding an entrenched position yet.
  4. The client had no relationship with any of the engineering contractors specifying adsorbents for the Gulf and Asian projects that will carry replacement demand for decades.
CLIENT PROFILE
A European adsorbent producer manufacturing zeolite Y grades for refinery and petrochemical customers across regional and export markets, at annual revenue near 74 million euros (client-reported, unverified by MMA). Commercial effort was organised around technical sales calling directly on operating plants and their procurement functions. No licensor relationships existed. Water treatment had never been served.
STRATEGIC CHALLENGE
Technical sales activity had produced very little conversion despite favourable performance data, and volumes were declining as European refining capacity closed. Management wanted to know whether the products were uncompetitive or whether something else was preventing them from winning business. A restructuring plan was pending. Capacity utilisation was falling. A decision was overdue.
MMA APPROACH
MMA traced how adsorbent specifications were actually set across the client's target plants, quantified the share of demand governed by licensor design packages, sized water treatment and unspecified applications separately, and mapped commissioning pipelines in growth regions against the client's commercial coverage. Interviews with 47 experts covered process licensing, refinery operations and water treatment engineering.
KEY FINDINGS
  1. Around seven charges in ten across the client's target plants were governed by licensor approved specifications the plant had neither authority nor appetite to change.
  2. Technical sales calls were reaching procurement functions that executed decisions rather than making them, which explained the conversion rate far better than any product comparison did.
  3. Water treatment applications in the client's own region were growing quickly and being awarded on genuine technical comparison, with no supplier holding an entrenched position yet.
  4. The client had no relationship with any of the engineering contractors specifying adsorbents for the Gulf and Asian projects that will carry replacement demand for decades.
RECOMMENDED STRATEGY
Phase 1: Phase one: redirect technical resource from plant calls toward process licensors and engineering contractors, where specifications are actually decided. That is where the specifications get written. Phase 2: Phase two: build a water treatment commercial position while no inherited specification governs the segment and no supplier holds an entrenched position. Phase 3: Phase three: establish coverage of Gulf and Asian commissioning pipelines, since the installed base carrying future demand is being built there.
OUTCOME
The producer redirected its technical sales organisation toward licensors and engineering contractors during 2026 and secured two water treatment installations (client-reported, unverified by MMA). Direct plant calling was substantially reduced, and Gulf project coverage was established. Technical headcount was redeployed rather than reduced. Coverage was rebuilt around design offices.

Frequently Asked Questions

Foundational context covering the market sizes, CAGR, scope, country, region and competition that inform every finding below. This section is provided to cover basics and most often pre-purchase conversations, answered from the MMA Primary Research Dataset.

What is the current size of the Synthetic Zeolite Y Adsorbent Market?

MMA sizes it at USD 0.34 billion in 2025, rising to USD 0.36 billion in 2026. The figure covers faujasite type zeolite Y supplied as an adsorbent at producer selling value.

How large will the Synthetic Zeolite Y Adsorbent Market be by 2036?

USD 0.67 billion by 2036, an incremental USD 0.31 billion over the 2026 base and an expansion multiple of 1.86 times. Water treatment accounts for a disproportionate share of that.

What is the CAGR for the Synthetic Zeolite Y Adsorbent Market 2026 to 2036?

6.4% in the base case, with a bull case at 7.6% and a bear case at 5.2%. The spread turns on emerging contaminant regulation against developed market refinery rationalisation.

Which segment is growing fastest?

Water and emerging contaminant treatment at 9.6%, half again the market rate of 6.4%. It is also the only segment where buyers compare adsorbents on genuine technical merit.

Who are the major companies in the Synthetic Zeolite Y Adsorbent Market?

Honeywell UOP, Arkema, Tosoh, Grace and Zeochem lead on production tonnage. Fifteen further participants are profiled in the full report on that same consistent basis.

Which country is growing fastest?

Saudi Arabia at 9.8%, as new refining and petrochemical capacity commissions and writes adsorbent specifications during design rather than inheriting them from older units. Design decisions are being taken there now.

Report Segmentation Architecture

The full report scope spans multiple orthogonal segmentation dimensions, with cross-tabulated demand data provided for each dimension pair. Coverage extends further to regional breakdowns, trend trajectories, and the competitive detail needed to support segment-level decision-making.

By Application

  • Refinery and Petrochemical Gas Drying
  • Hydrocarbon and Aromatics Separation
  • Sulphur and Mercaptan Removal
  • Air and Industrial Gas Purification
  • Water and Emerging Contaminant Treatment
  • Refrigerant and Insulating Glass Drying

By End-Use Industry

  • Petroleum Refining
  • Petrochemicals and Aromatics
  • Industrial and Medical Gases
  • Municipal and Industrial Water Treatment
  • Refrigeration and Building Products
  • Natural Gas Processing

By Commercial Dimension

  • Licensor Specified Supply
  • Direct Plant Replacement Supply
  • Engineering Contractor Specified Supply
  • Distributor and Trading Channels
  • Water Treatment System Integrators
  • Export and Cross-Border Supply

By Region

  • North America
  • Western Europe
  • East Asia
  • South Asia and Pacific
  • Latin America
  • Middle East and Africa
  • Eastern Europe

Scope, Methodology, and Coverage

Every figure in this report is reproducible from documented input assumptions. The scope below maps the historical period, the forecast horizon, the segmentation dimensions, and the countries covered, alongside the underlying primary and qualitative methodology.
Historical Period
2020 to 2025
Forecast Period
2026 to 2036
Base Year
2025 (USD billions; MMA Primary Research Dataset, August 2026)
Market Definition
Synthetic faujasite type zeolite Y supplied as an adsorbent, covering refinery and petrochemical gas drying, hydrocarbon and aromatics separation, sulphur and mercaptan removal, air and industrial gas purification, water and emerging contaminant treatment, and refrigerant and insulating glass drying. Measured at producer selling value including bound and formed products. Zeolite Y supplied as a catalyst or catalyst component, zeolites A and X, activated carbon, silica gel, alumina adsorbents, and ion exchange resins are excluded from scope.
Quantitative Units
USD billions (current prices); thousand tonnes produced; USD per tonne by application grade
Segmentation Dimensions
Application; end-use industry; commercial dimension; region
Regions Covered
North America, Western Europe, East Asia, South Asia and Pacific, Latin America, Middle East and Africa, Eastern Europe
Countries Covered
United States, Canada, Germany, France, Netherlands, Belgium, Italy, United Kingdom, China, Japan, South Korea, Taiwan, India, Singapore, Australia, Brazil, Mexico, Saudi Arabia, United Arab Emirates, Poland
Key Companies Profiled
Honeywell UOP, Arkema, Tosoh, W. R. Grace, Zeochem, BASF, Clariant, Zeolyst International, Axens, Union Showa, Luoyang Jianlong Micro-nano, Shanghai Hengye Molecular Sieve, Jalon Micro-Nano, Sinopec Catalyst, PQ Corporation, Chemiewerk Bad Kostritz, Interra Global, KNT Group, Sorbead India, Wuxi Wanda Molecular Sieve
Quantitative Methodology
Primary survey, n=3,800 respondents, Q4 2025, six countries; demand-side model with trade association cross-validation
Qualitative Methodology
47 expert interviews, Q4 2025; applied to validate demand model assumptions, identify emerging dynamics, and assess competitive positioning
Report Format
PDF and XLSX data workbook (Word format preview document)
Publisher
Market Minds Advisory
Report Code
MMA-2026-CHM-143
Published
August 2026
Contact
sales@marketmindsadvisory.com | www.marketmindsadvisory.com

Purchase the full Synthetic Zeolite Y Adsorbent Market Report (2026 to 2036).

The full report locates the commercial decision in this market at process design rather than at purchasing, because roughly seven charges in ten follow a specification written before the plant was built. It sizes all six applications independently through 2036, quantifies the share of demand governed by licensor specification, and maps commissioning pipelines against specification authority by region. Regional chapters cover all seven regions with installed base analysed separately from new capacity. Competitive profiling covers 20 participants on one consistent tonnage basis. Specification authority is tracked by design office throughout.
Six applications sized independently through 2036
Licensor specified demand quantified separately from open purchasing
Commissioning pipelines mapped against specification authority by region
Water treatment demand assessed against single use adsorbent alternatives
Dealumination yield economics modelled across silica ratio grades
Twenty participants profiled on one consistent production tonnage basis

Built For The People Who Decide

From boardroom strategy to bench-side execution, this report is read cover-to-cover by leaders shaping the next decade of their industry, turning demand scenarios, market dynamics and valuation benchmarks into decisions.
CXOs/ Presidents/ VPs/ Managers
M&A and Corporate Development
Strategy Teams and R&D Heads
Procurement and Product Directors
Regulatory and Compliance Leaders
Investor Relations and Equity Analysts