Market Minds Advisory
Synthetic Quartz Market

Synthetic Quartz Market: optical specification, fusion energy intensity and semiconductor qualification

Purity stopped being the differentiator here years ago; what separates suppliers now is flatness, homogeneity and birefringence measured to tolerances that eliminate most producers before pricing is ever discussed at all.

Lead Analyst

Bilal Shaikh

Published

September 2026

Make Smarter Decisions with Customized Research Insights

Request a free sample report and evaluate market opportunities, growth trends, and competitive dynamics relevant to your business needs.

2025 MARKET VALUE$1.2BMarket Size 2025
2036 FORECAST VALUE$2.9BBase Case , 2026 to 2036
CAGR 2026 TO 20368.2 %Bull 9.4% / Bear 6.9%
INCREMENTAL OPPORTUNITY$1.6BNet 10- year value creation
EXPANSION MULTIPLE2.20x2036 value over 2026 base
Strategic Levers
M&A Pipeline
Regional Outlook
Country Rankings
Competitive Intelligence
Segmental Deep-dive
Call-Us : 91 93563 13602

Executive Snapshot and Market Trajectory

Everybody in synthetic quartz can hit the purity specification these days, which is precisely why nobody wins any business on it any more. What decides a semiconductor or photonics qualification is flatness, refractive index homogeneity and birefringence held to tolerances that eliminate most producers long before pricing enters the conversation.
Growth concentrates in photomask substrate grade fused silica, expanding at 12.3%, where extreme ultraviolet lithography demands surface flatness under 200 nanometres across a full blank and homogeneity that only a handful of producers achieve consistently. East Asia holds 42% of value, well above what any single region normally takes, because Japanese producers hold the principal technology positions while Taiwanese, Korean and Chinese semiconductor manufacture consumes most of that output directly rather than importing it.
The supplier base is tightly concentrated, with the top five holding 68% of production capacity, and it divides between Japanese integrated producers, Western optical specialists and Chinese volume manufacturers moving upward. Competition runs on qualified optical specification rather than on assay purity. Fusion energy cost is the input position now separating the producers who can price aggressively from those who simply cannot.
Market Definition
Synthetic quartz comprises manufactured fused silica and cultured quartz crystal produced for technical applications, spanning fused silica ingots and blanks, photomask substrate grade fused silica, optical fibre preform grade silica, cultured quartz crystal, fused quartz tubing, rod and crucibles, and high-purity synthetic quartz powder. Sizing covers material sold to semiconductor, photonics, optical and electronic component manufacturers at realised delivered price. Natural mined quartz, engineered quartz surfacing and countertops, finished photomasks, drawn optical fibre, and finished oscillators or semiconductor devices all fall outside scope.
Base Year Value
$1.2B in 2025 (MMA Primary Research Dataset, August 2026)
Forecast Period
2026 to 2036, eleven discrete annual values
CAGR
8.2% base case. Bull 9.4%. Bear 6.9%.
Fastest Growth Segment
Photomask Substrate Grade Fused Silica: 12.3% CAGR
Fastest Growth Country
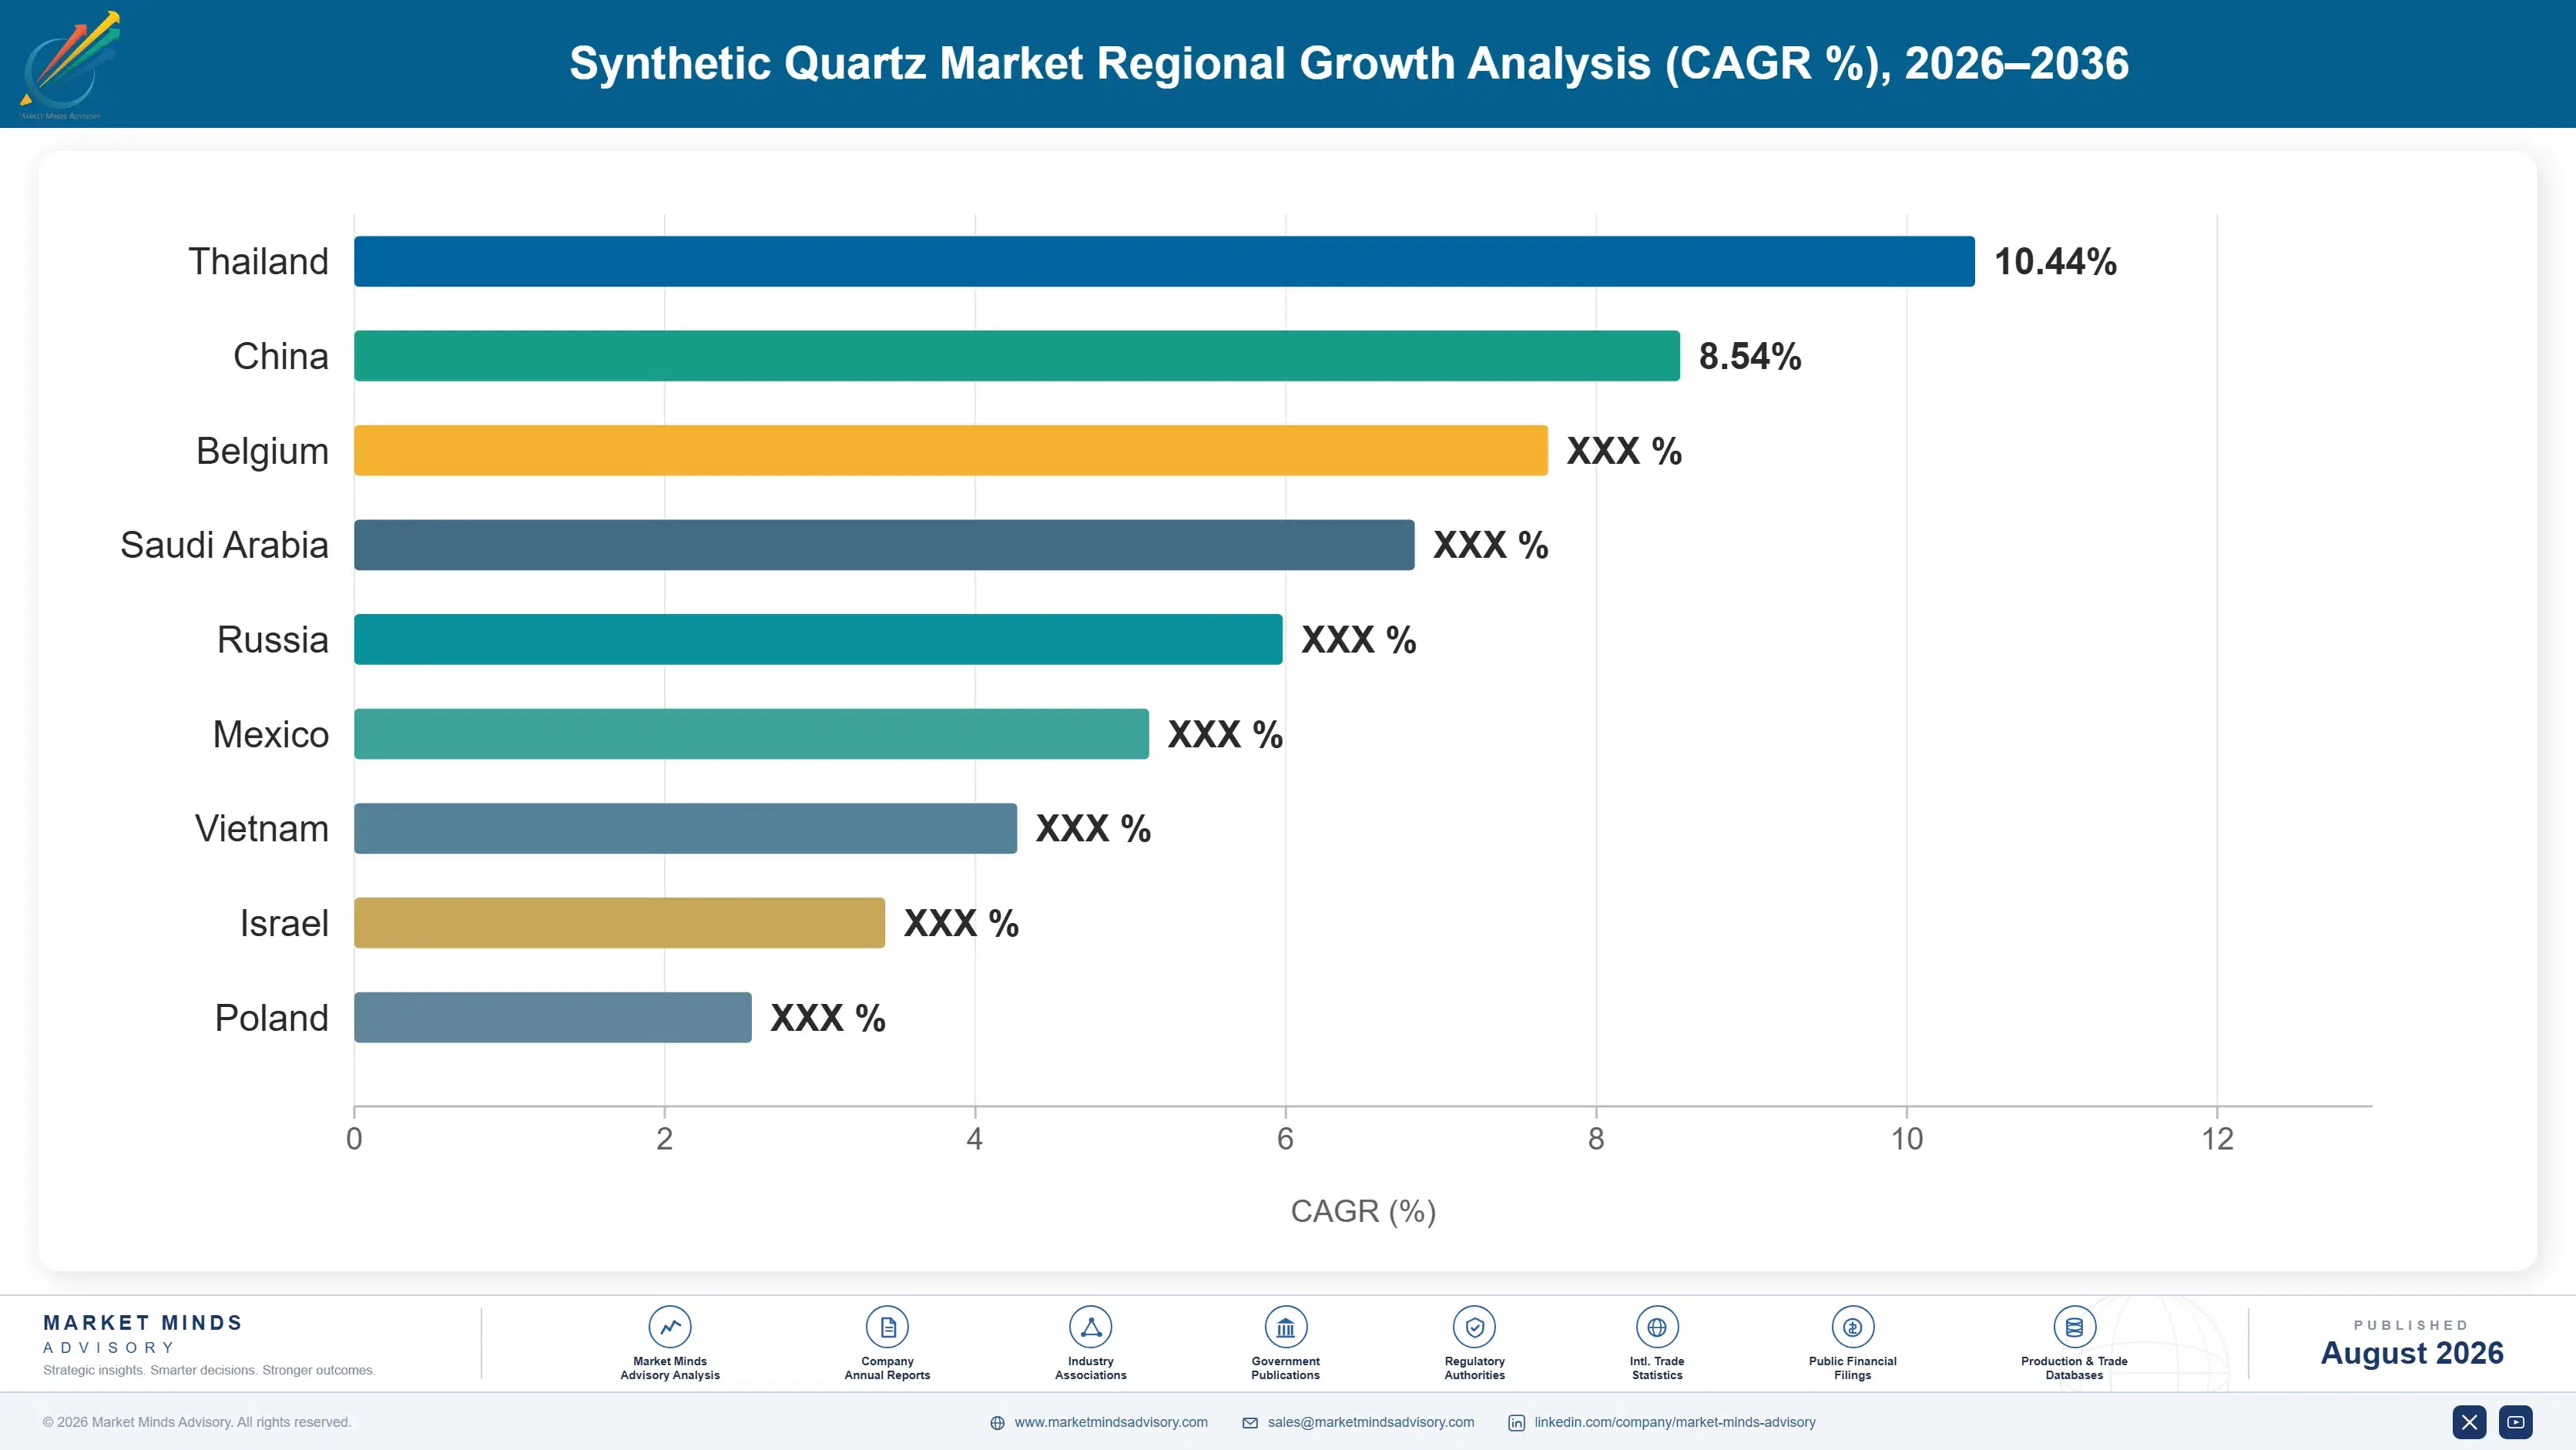
India: 11.0% CAGR
Fastest Growth Region
South Asia and Pacific: 10.5% CAGR
Largest Region
East Asia: 42% of 2025 global value
Market Leaders
Shin-Etsu Chemical, Tosoh, Heraeus, Corning and AGC lead on synthetic quartz production capacity across fused silica and cultured crystal classes. Source: MMA Primary Research Dataset, July 2026.
Primary Survey
n=3,800 procurement and R&D decision-makers, Q4 2025, six countries
Methodology
Demand-side build-up, cross-validated against public data, 47 expert interviews

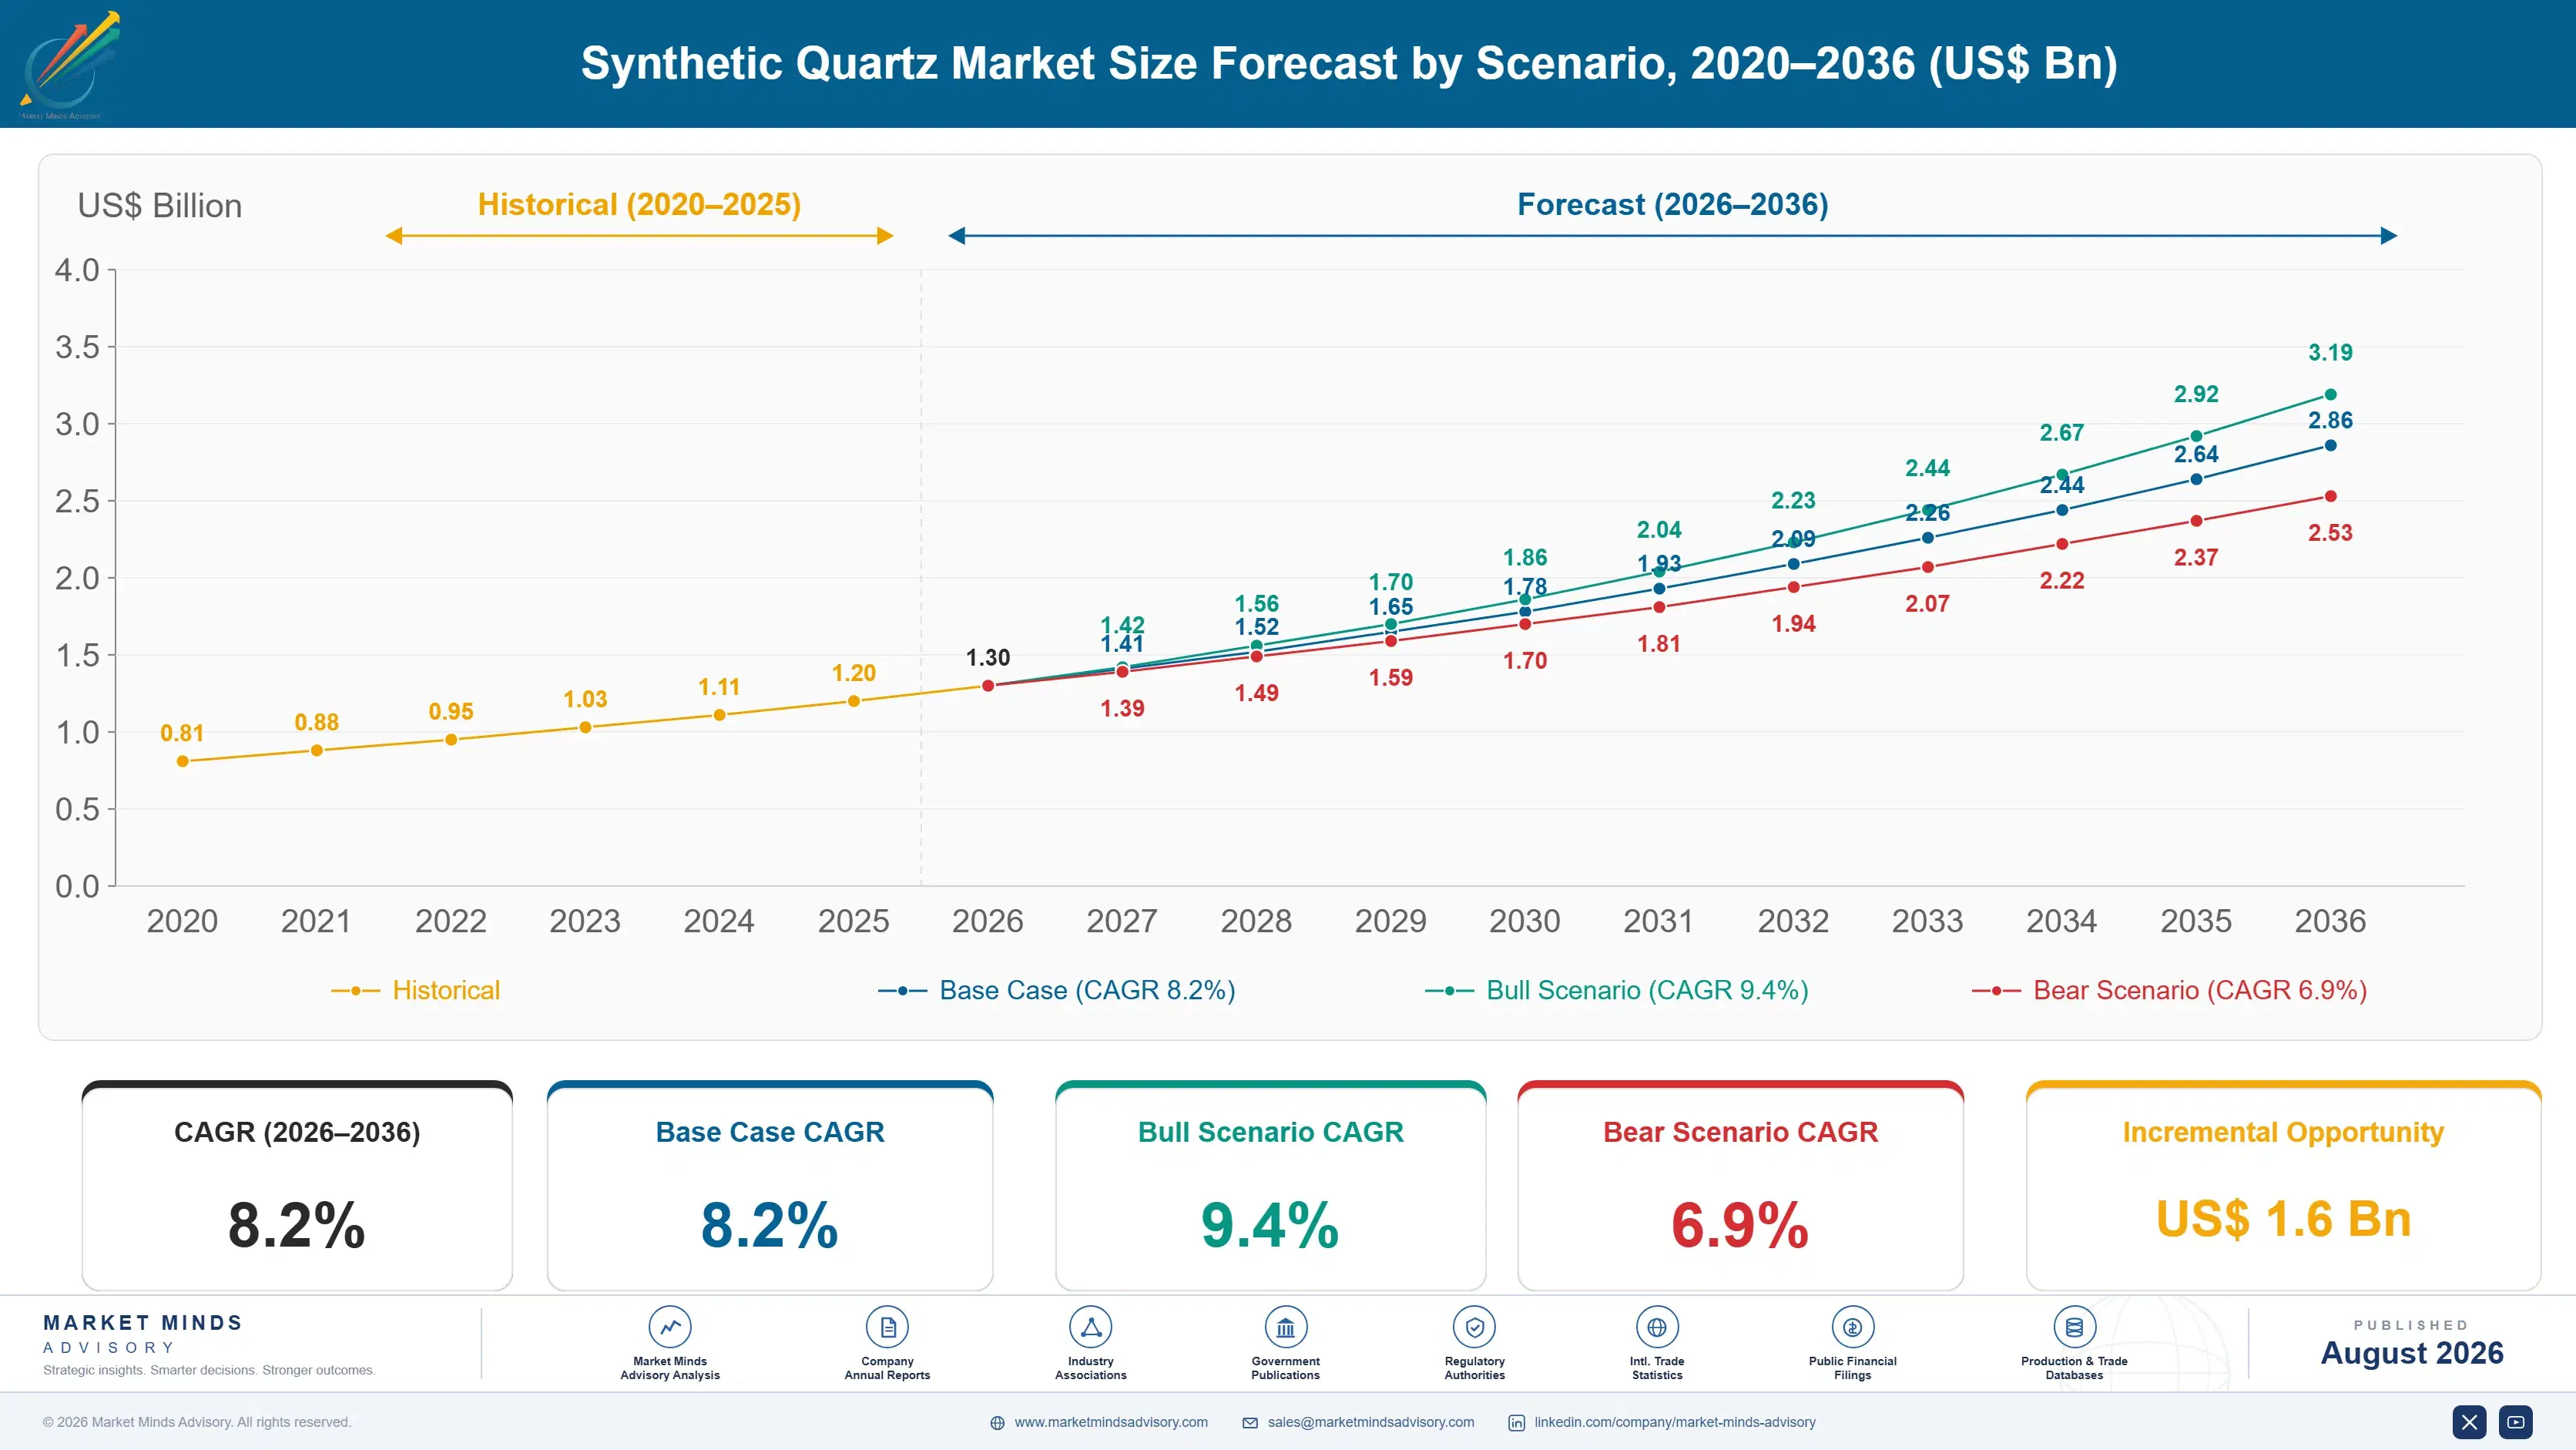
Synthetic Quartz Market Forecast Scenarios

synthetic-quartz-market-trends-size-forecast-scenario-1787310875196
Growth of 7.0% across 2020 to 2025 followed the semiconductor cycle more closely than any other driver. Equipment and materials demand ran to records through 2021 and 2022 as fabrication capacity was committed, then corrected sharply through 2023 as memory pricing collapsed and inventories unwound. Optical fibre preform demand moved on a separate cycle driven by network build programmes, which partly offset the semiconductor correction.
The base case at 8.2% rests on three mechanisms. Extreme ultraviolet lithography adoption keeps raising photomask substrate requirements, and each node transition tightens flatness and homogeneity tolerances that only a few producers can meet at all. Optical fibre preform demand grows with data centre interconnect and long haul network capacity rather than with consumer broadband. And semiconductor fabrication capacity commissioning continues across four regions, each new plant consuming crucibles, tubing and optical components continuously.
The bull case at 9.4% turns on artificial intelligence infrastructure driving both advanced node capacity and optical interconnect demand together, since those two pull on quite different quartz grades simultaneously. The bear case at 6.9% turns on the semiconductor cycle. A prolonged correction in fabrication equipment spending would remove crucible and optical component demand faster than photomask growth can replace it.

Synthetic quartz: optical specification against energy intensity

The commercial reality here is that purity is table stakes and optical specification is the actual product. Every credible producer reaches the parts-per-billion metal specification, and none of them differentiate on it. What separates them is flatness under 200 nanometres across a photomask blank, refractive index homogeneity through a thick optical section and birefringence low enough not to distort a lithographic image at all. None of that appears on a purity certificate.
TOP FIVE CONCENTRATION68%Share of global production capacity held collectively worldwide
SILICON PRECURSOR SHARE34% of COGSPortion of delivered cost tied to purified silicon precursor
SEMICONDUCTOR APPLICATION SHARE44% of volumeLargest single application by consumed synthetic quartz tonnage
PHOTOMASK FLATNESS TOLERANCEunder 200 nmSurface requirement eliminating most producers from any qualification
FUSION ENERGY INTENSITY17 MWh/tonneEnergy consumed producing each tonne of synthetic material
QUALIFICATION LEAD TIME24 monthsApproval cycle before any semiconductor grade supply begins
Cost structure sits between precursor and power. Purified silicon precursor accounts for roughly 34% of delivered cost, and fusion consumes around 17 megawatt hours per tonne produced, which makes electricity pricing a first-order competitive variable rather than an operating detail. Neither figure has improved much despite decades of process work, because both are set by physics rather than by engineering discipline.
Applications divide by how tight the optical requirement is. Semiconductor duty takes 44% of volume, split between undemanding crucible and tubing work and extremely demanding photomask and optics grades. Optical fibre preform, precision optics and cultured crystal for frequency control each occupy quite separate qualification worlds, with almost no supplier crossing between them casually.
"Producers keep sending customers certificates showing parts-per-billion metals, which every serious competitor also achieves and which nobody has lost a qualification over in years. The suppliers winning the work publish homogeneity and birefringence maps, and the number who can do that credibly is smaller than most buyers realise."
Director, Electronic and Optical Materials Practice · MMA Chemicals and Material

Market Trends

Extreme ultraviolet lithography tightening photomask substrate requirements sharply

Each advanced node transition tightens the flatness, homogeneity and defect requirements on the fused silica blank that carries the mask pattern, because the lithographic image cannot be better than the substrate beneath it. Flatness tolerances now sit under 200 nanometres across a full blank, which is a surface specification rather than a material one and which very few producers reach consistently across a production batch. Qualification runs around 24 months per customer. Producers who hold those positions supply for the life of the node and beyond, since requalification costs the customer far more than any price difference.
Market Impact: Drives 44% of global volume
Optical interconnect demand pulling preform grade silica upward

Data centre interconnect and long haul network capacity have become the principal driver of optical fibre demand rather than consumer broadband connections, and the volume growth is concentrated in the highest performance fibre types. Preform grade synthetic silica requires attenuation-critical purity together with geometric consistency through a very large section, which is a different capability from photomask work despite superficial similarity. Artificial intelligence infrastructure has accelerated this demand considerably faster than network operators had planned for. Producers holding preform qualification realise pricing well above general fused silica levels, and the qualified field has not widened.
Market Impact: Lifts two grades above 9% growth

Market Opportunities and Growth Drivers

Semiconductor fabrication capacity commissioning across four separate regions

Fabrication plants under construction across Taiwan, Korea, Japan, the United States and Europe each consume synthetic quartz continuously once operating, in crucibles for crystal pulling, in furnace tubing and boats, and in optical components throughout the lithography and metrology toolsets. That demand is consumable rather than capital in character, so it continues for the whole operating life of the plant rather than arriving once at commissioning. Semiconductor applications already account for 44% of synthetic quartz volume worldwide, and the new fabrication capacity now being built extends that consumable base considerably further.
Market Impact: Consumes 17 megawatt hours per tonn

Artificial intelligence infrastructure raising both node and interconnect demand

Artificial intelligence workloads require both advanced logic capacity and enormous optical interconnect bandwidth, which pulls on photomask substrate grade and optical fibre preform grade synthetic quartz at the same time despite those being entirely separate qualification worlds. That simultaneity is unusual, since the two demand streams have historically moved on independent cycles and partly offset one another. Producers qualified in both capture the whole movement rather than half of it. Data centre construction commitments announced through 2025 extend that demand well beyond current qualified production capacity in several separate grades.
Market Impact: Runs 24 months per customer qualifi

Market Restraints and Challenges

Fusion energy intensity exposing producers to regional power pricing

Producing synthetic fused silica consumes roughly 17 megawatt hours per tonne, and no process improvement has meaningfully reduced that because the energy goes into breaking and reforming silicon oxygen bonds at very high temperature. The root cause is thermodynamic rather than industrial, which is why decades of furnace development have trimmed rather than transformed the figure. Commercially this makes regional electricity pricing a first-order competitive variable that no operating discipline overcomes. Producers are responding by siting new capacity on advantaged power, contracting supply on multi-year terms and pursuing renewable arrangements where pricing supports them.
Market Impact: Requires flatness under 200 nanomet

Qualification cycles locking customers and suppliers into slow-moving positions

Semiconductor and photonics qualification runs around 24 months across material characterisation, tool trials and production validation, which is a long time for both parties to invest before any revenue appears. The root cause is that a substrate defect surfaces as a yield loss much later in the process, so customers validate exhaustively rather than sampling. Commercially this slows every new entrant and every new grade, however good the material is. Participants are responding with earlier engagement during customer development programmes and with qualification data packages assembled well before a formal request arrives.
Market Impact: Grows 9.1% annually through 2036
3 additional market trends, 2 additional growth drivers, and 4 additional restraints and challenges are covered in the full report. Contact sales@marketmindsadvisory.com to access the complete intelligence.

Segment CAGR and Growth Architecture

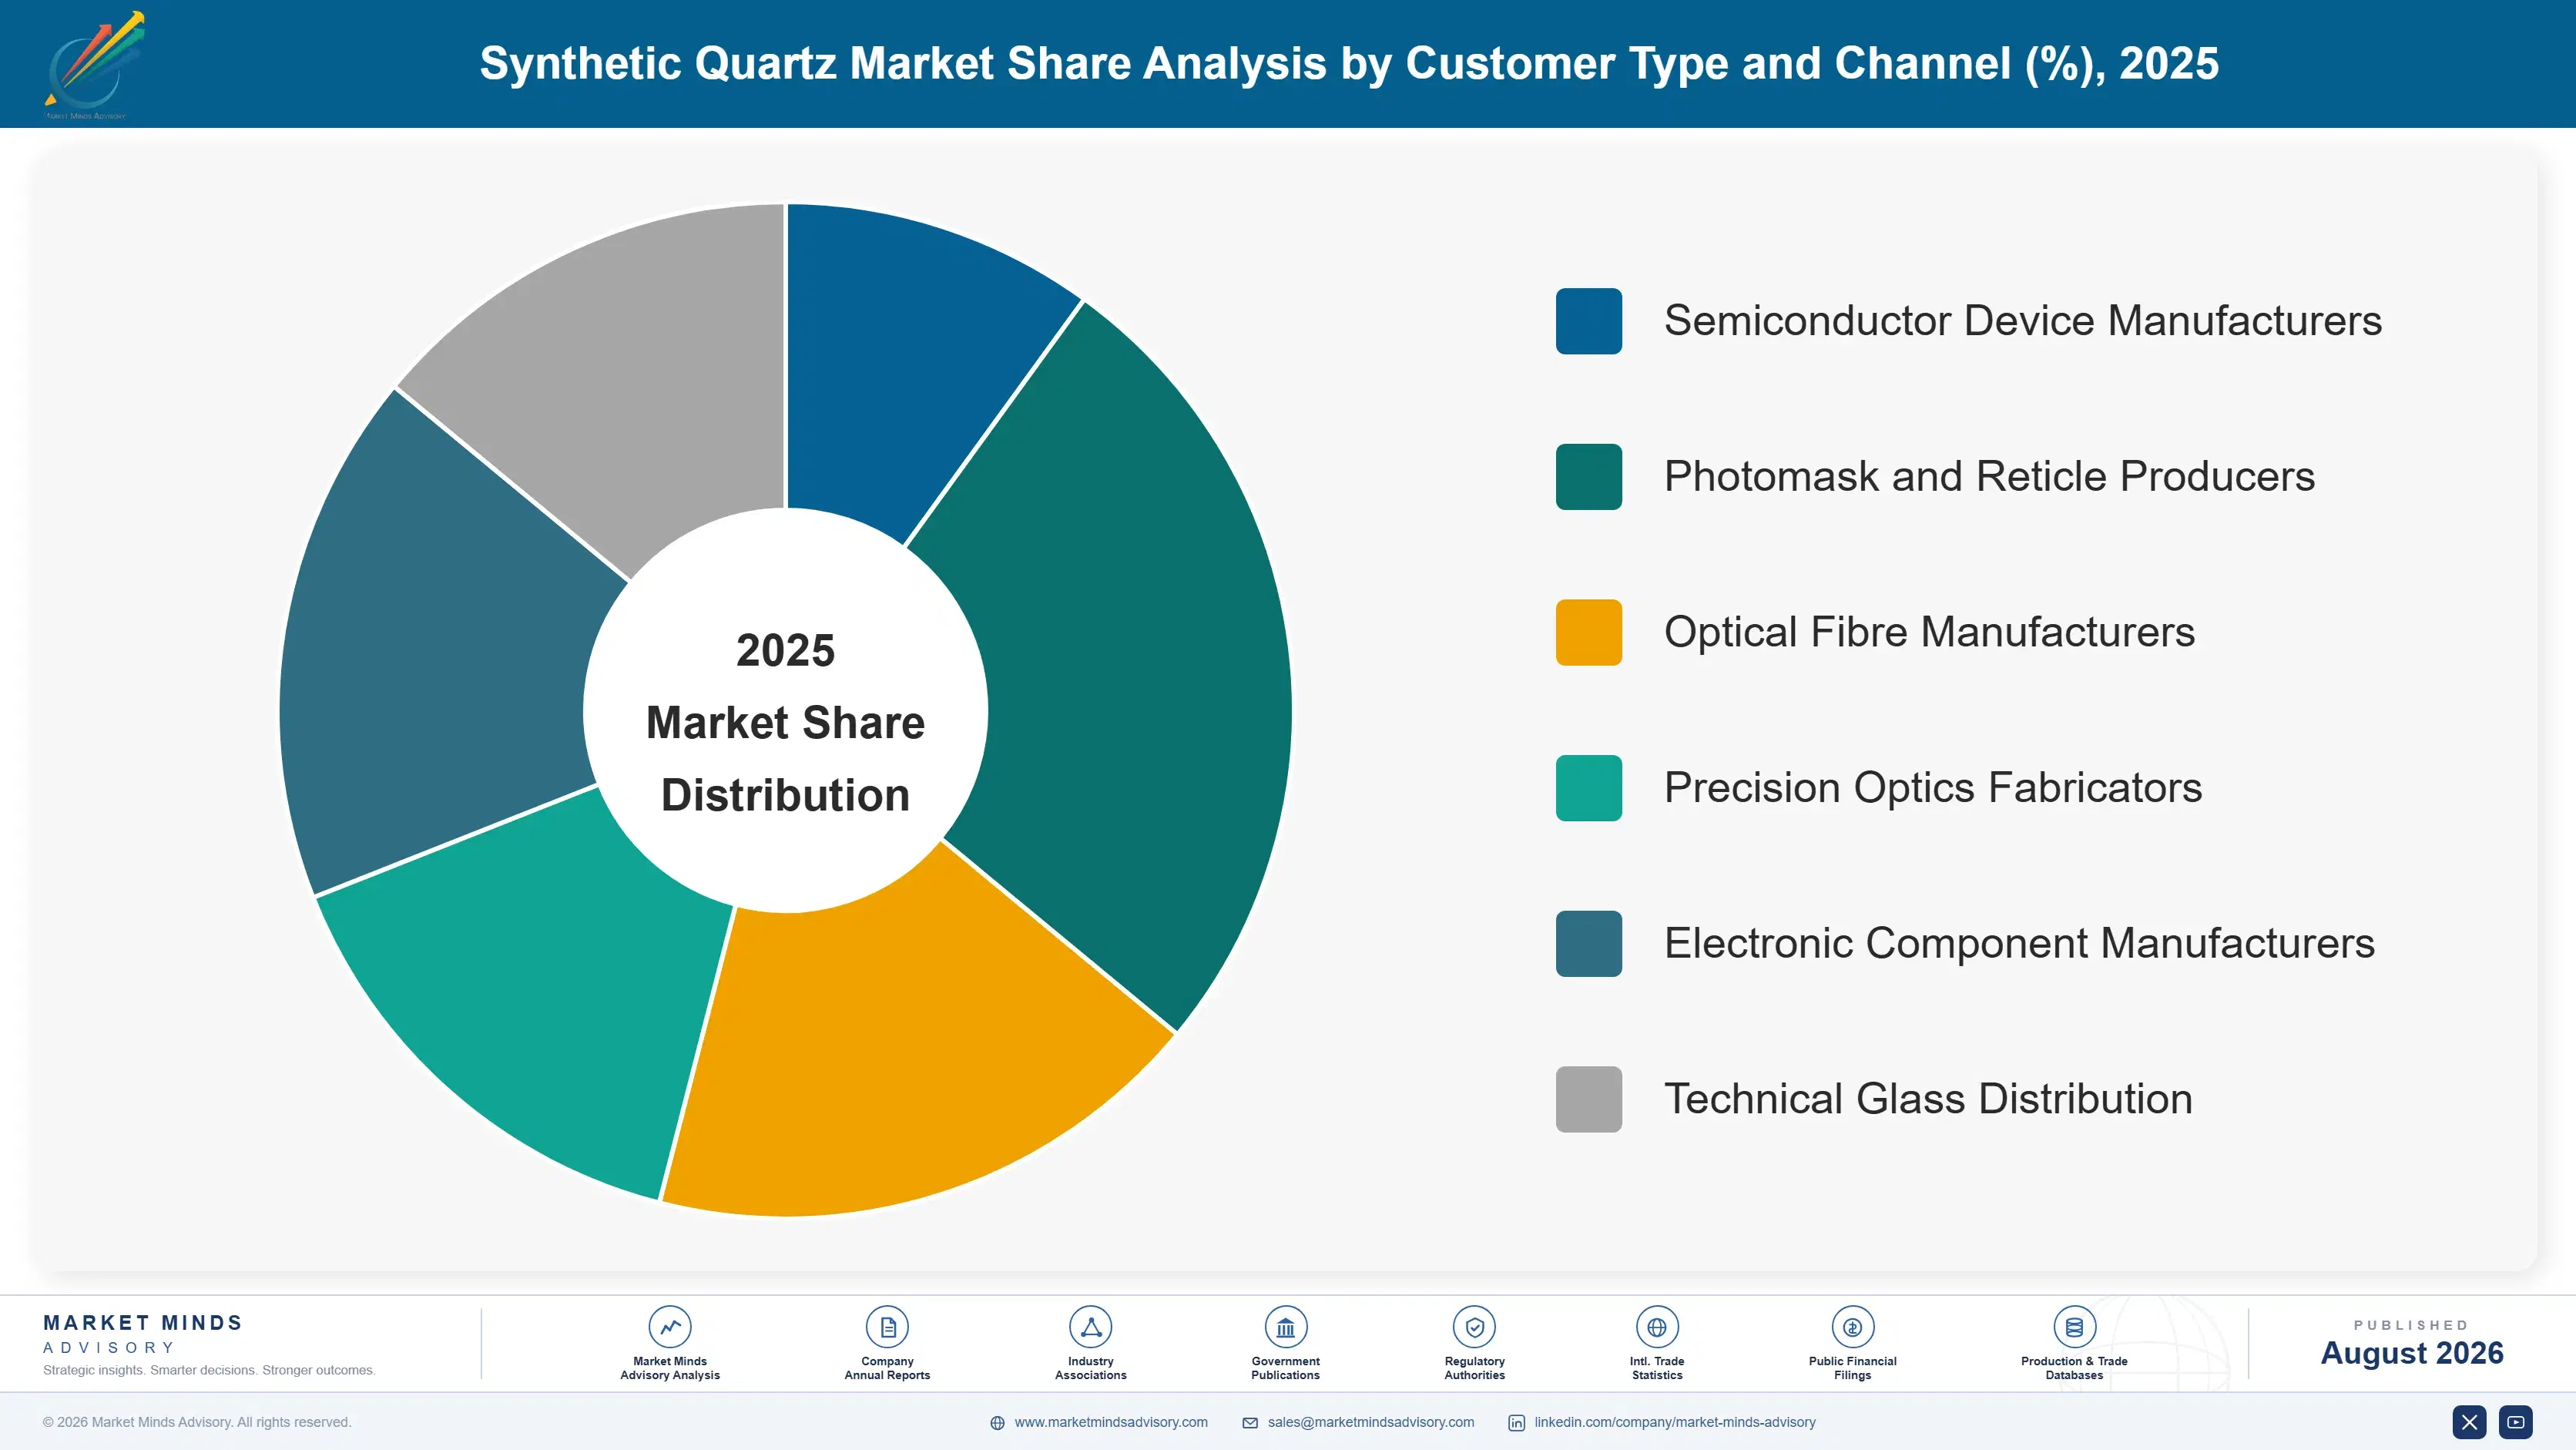
Segmentation follows the product form and its governing optical or geometric specification, because each combination demands a distinct production route, qualification path and analytical capability that rarely transfers between them. Six classes cover the whole market, running from bulk powder and cultured crystal through tubing and ingots to the photomask and preform grades at the demanding end.
synthetic-quartz-market-trends-market-share-analysis-1787310875728

Photomask Substrate Grade Fused Silica

Expanding at 12.3%, a full 1.50 times the market rate, on blanks meeting flatness under 200 nanometres across the full substrate together with refractive index homogeneity and birefringence tight enough not to distort a lithographic image at advanced nodes. This is a surface and optical specification rather than a chemical one, which is exactly why purity certificates decide nothing here and why the qualified producer field stays remarkably small. Each successive node transition tightens the requirement further rather than holding it steady where it was. Qualification runs around 24 months from first sample, and positions established then supply for the whole life of the node and frequently well beyond it.
CAGR 12.3%

Optical Fibre Preform Grade Silica

Growing at 9.1% annually on synthetic silica meeting attenuation-critical purity together with geometric and index consistency maintained through a very large drawn section, which is a genuinely different capability from photomask work despite the superficial similarity of the underlying material itself. Data centre interconnect and long haul network capacity now drive this demand rather than consumer broadband connections, and artificial intelligence infrastructure has accelerated that demand well beyond anything network operators had planned for. Qualification here takes years rather than months to complete. Realised pricing runs above general fused silica levels, reflecting a qualified field narrow enough that fibre producers have very limited alternatives whenever demand moves quickly against them.
CAGR 9.1%
Full segment breakdown across 6 segments available in the complete report.

Regional Architecture and Country Demand Map

Synthetic quartz production sits wherever the technology positions and the advantaged power happen to coincide, and the demand sits where semiconductor and photonics manufacture happens to be concentrated, which happens to put both of them firmly in the same part of the world as one another.

East Asia

Forty-two percent of global value here, by a wide margin the largest regional share of all, because Japanese producers between them hold the principal technology positions in photomask and optical grades, while Taiwanese, Korean and Chinese semiconductor manufacture consumes the output directly rather than importing it. Note: this exceeds the standard regional band because synthetic quartz technology and semiconductor consumption are colocated here to a degree that no other material market matches. Chinese producers have themselves moved steadily upward from tubing and crucibles toward considerably more demanding optical grades. Growth of 9.1% here runs above the global rate, supported by fabrication capacity commissioning and by rising optical component demand together.
Share: 42% | CAGR: 9.1% (2026 to 2036)

North America

Twenty-two percent of global value here, weighted heavily toward semiconductor materials for domestic fabrication capacity, precision optics serving defence and scientific instrumentation, and a substantial optical fibre preform position alongside all of those applications. Fabrication plant construction now proceeding under federal incentive programmes has already committed consumable demand extending some way past the current qualified capacity in several separate grades. Both Corning and Momentive hold genuine technology positions in the optical and photomask grades respectively, and both of them supply customers well beyond the region itself. Growth of 7.6% here reflects that fabrication capacity commissioning alongside optical interconnect demand rising steadily with data centre construction right across the whole region.
Share: 22% | CAGR: 7.6% (2026 to 2036)
Regional intelligence for 5 additional markets available in the complete report: Western Europe, South Asia and Pacific, Latin America, Middle East and Africa, Eastern Europe. Contact sales@marketmindsadvisory.com.
synthetic-quartz-market-trends-country-cagr-analysis-1787310876250

Where synthetic quartz margin genuinely sits

Four commercial positions separate producers earning electronic materials economics from those selling fused silica against a purity certificate that everybody can match. Each one of them rests on something a competitor cannot assemble quickly: measured optical specification, a qualified toolset position, an advantaged power contract, or else preform capability that nobody else in the region actually holds.

Publish measured optical specification instead of purity certificates

Every credible producer reaches the parts-per-billion metals specification and nobody has lost a qualification over it in years, yet purity certificates remain what most suppliers put in front of customers. Producers publishing measured flatness, homogeneity and birefringence maps across production batches realise roughly 45% above competitors leading with assay data, because those are the numbers a customer's process engineer actually uses. The measurement capability required costs metrology equipment rather than any production capital at all. Most producers avoid it because batch-to-batch optical variation is considerably worse than their marketing suggests.
Market Impact: Realises roughly 45% above purity-q

Qualify into semiconductor toolsets before node transition

Semiconductor qualification runs around 24 months across material characterisation, tool trials and production validation, and the material qualified into a node supplies for the life of that node and frequently well beyond it. Producers achieving qualification capture roughly 7 times the lifetime revenue of those supplying replacement consumables afterwards, because requalification costs the customer far more than any price difference could save. Engagement has to begin during the customer's development programme rather than after production ramps. Most producers simply wait for a purchase enquiry on a decision already settled elsewhere months beforehand.
Market Impact: Captures roughly 7 times the lifeti

Contract advantaged power before committing fusion capacity

Fusion consumes roughly 17 megawatt hours per tonne produced, so the gap between advantaged industrial power and European spot pricing exceeds the entire conversion margin on synthetic silica. Producers on contracted advantaged power run roughly 26% below exposed competitors on delivered cost, and that gap decides who is able to price aggressively into a competitive qualification at all. Energy geography should therefore govern siting decisions well ahead of labour cost or even customer proximity. Several European producers now face a cost position their existing plant locations were never designed around.
Market Impact: Runs roughly 26% below power-expose

Build optical fibre preform grade capability deliberately

Preform grade demands attenuation-critical purity together with geometric and index consistency through a very large section, which is genuinely different from photomask capability despite the material looking identical. Producers holding preform qualification realise roughly 2.5 times general fused silica pricing, on demand now driven by data centre interconnect rather than consumer broadband. Artificial intelligence infrastructure has moved that demand considerably faster than fibre producers had planned, leaving them with very limited qualified alternatives. The capability required is process control through a large section rather than any additional purification step at all.
Market Impact: Realises roughly 2.5 times general

Who Controls the Margin Pool

Concentration is high, with the top five holding 68% of synthetic quartz production capacity, the basis on which every participant here is assessed. Shin-Etsu and Tosoh lead through technology positions in photomask and optical grades combined with proximity to the semiconductor customers consuming them, while the challenger group divides between Western optical specialists such as Heraeus and Corning, and Chinese producers moving upward from tubing and crucible work.
Competition currently runs on measured optical specification, qualified toolset positions and power cost rather than on purity, which every credible producer achieves. Qualification positions established at a node transition are effectively immovable for that node's life, which makes timing more important than pricing. Power cost has become a genuine competitive dimension in its own right since European electricity repriced permanently.

Emerging pressure comes from two directions at once. Chinese producers have moved from crucibles and tubing toward optical grades and now compete directly in applications that were Japanese and Western preserves. And artificial intelligence infrastructure is pulling photomask and preform demand simultaneously, which favours producers qualified across both rather than those holding a strong position in only one.
synthetic-quartz-market-trends-company-positioning-matrix-1787310876770

Competitive Moat and Risk Dimensions

SHIN-ETSU CHEMICAL

Moat: Optical technology and customer proximity

Technology positions in photomask substrate and optical grade fused silica, combined with physical and organisational proximity to the semiconductor manufacturers consuming them, give Shin-Etsu qualification relationships that competitors cannot approach on price. Qualification takes two years and the resulting position holds for a node lifetime, which compounds the advantage with every successive transition.
SHIN-ETSU CHEMICAL

Risk: Japanese power cost exposure

Fusion energy intensity near 17 megawatt hours per tonne makes Japanese industrial electricity pricing a permanent cost consideration against producers siting on advantaged power in other regions. The technology position protects premium grades where qualification governs, but it offers considerably less protection in tubing, crucible and general fused silica work where delivered cost decides.
TOSOH

Moat: Process control across grades

Process control across a wide range of synthetic quartz grades lets Tosoh serve photomask, optical and semiconductor consumable demand from related capability, which spreads qualification investment across more revenue than a single-grade producer manages. That breadth also positions the company across both demand streams when photomask and preform requirements move together as they now have.
TOSOH

Risk: Semiconductor cycle concentration

Revenue weighted toward semiconductor applications leaves Tosoh exposed to a fabrication equipment cycle it does not influence, as the 2023 correction demonstrated when consumable and optical demand fell considerably faster than any qualification decision. Diversification toward optical fibre preform requires capability in large section process control that semiconductor work does not directly develop.

Players Tracked

Prominent Players

Shin-Etsu Chemical
Tosoh
Heraeus
Corning
AGC

Other Key Players

Momentive Technologies
Ohara
Feilihua Quartz Glass
Jiangsu Pacific Quartz
Raesch Quarz
QSIL
Technical Glass Products
Lianyungang Guanhong Quartz
Nihon Dempa Kogyo
Kyocera
TXC Corporation
Seiko Epson
Donghai County Hongfa Quartz
Sico Technology
Quartz Scientific

Recent Developments

MARCH 2025

Producer qualifies photomask blank for advanced node lithography

A synthetic quartz producer completed full photomask substrate qualification with an advanced node lithography customer, demonstrating flatness held under 200 nanometres across the full blank together with birefringence and homogeneity both held consistently across successive full production batches rather than only on carefully selected specimens.
Signal: Batch-to-batch optical consistency rather
JULY 2025

Fusion capacity sited on advantaged power rather than customers

A synthetic silica producer committed its new fusion capacity to a region selected primarily for contracted industrial power pricing rather than for any proximity to its semiconductor customers, accepting materially longer logistics in exchange for an energy position that changes the delivered cost structure fundamentally.
Signal: Energy geography is now overriding custome
NOVEMBER 2025

Optical interconnect demand outruns preform grade supply capacity

Data centre interconnect construction commitments pushed optical fibre preform grade silica demand well beyond the available qualified capacity across several of the separate qualified suppliers, leaving fibre producers with very limited alternatives given that qualification cycles here are measured in years rather than in months.
Signal: Preform grade qualification has now become

Precursor and fusion energy exposure

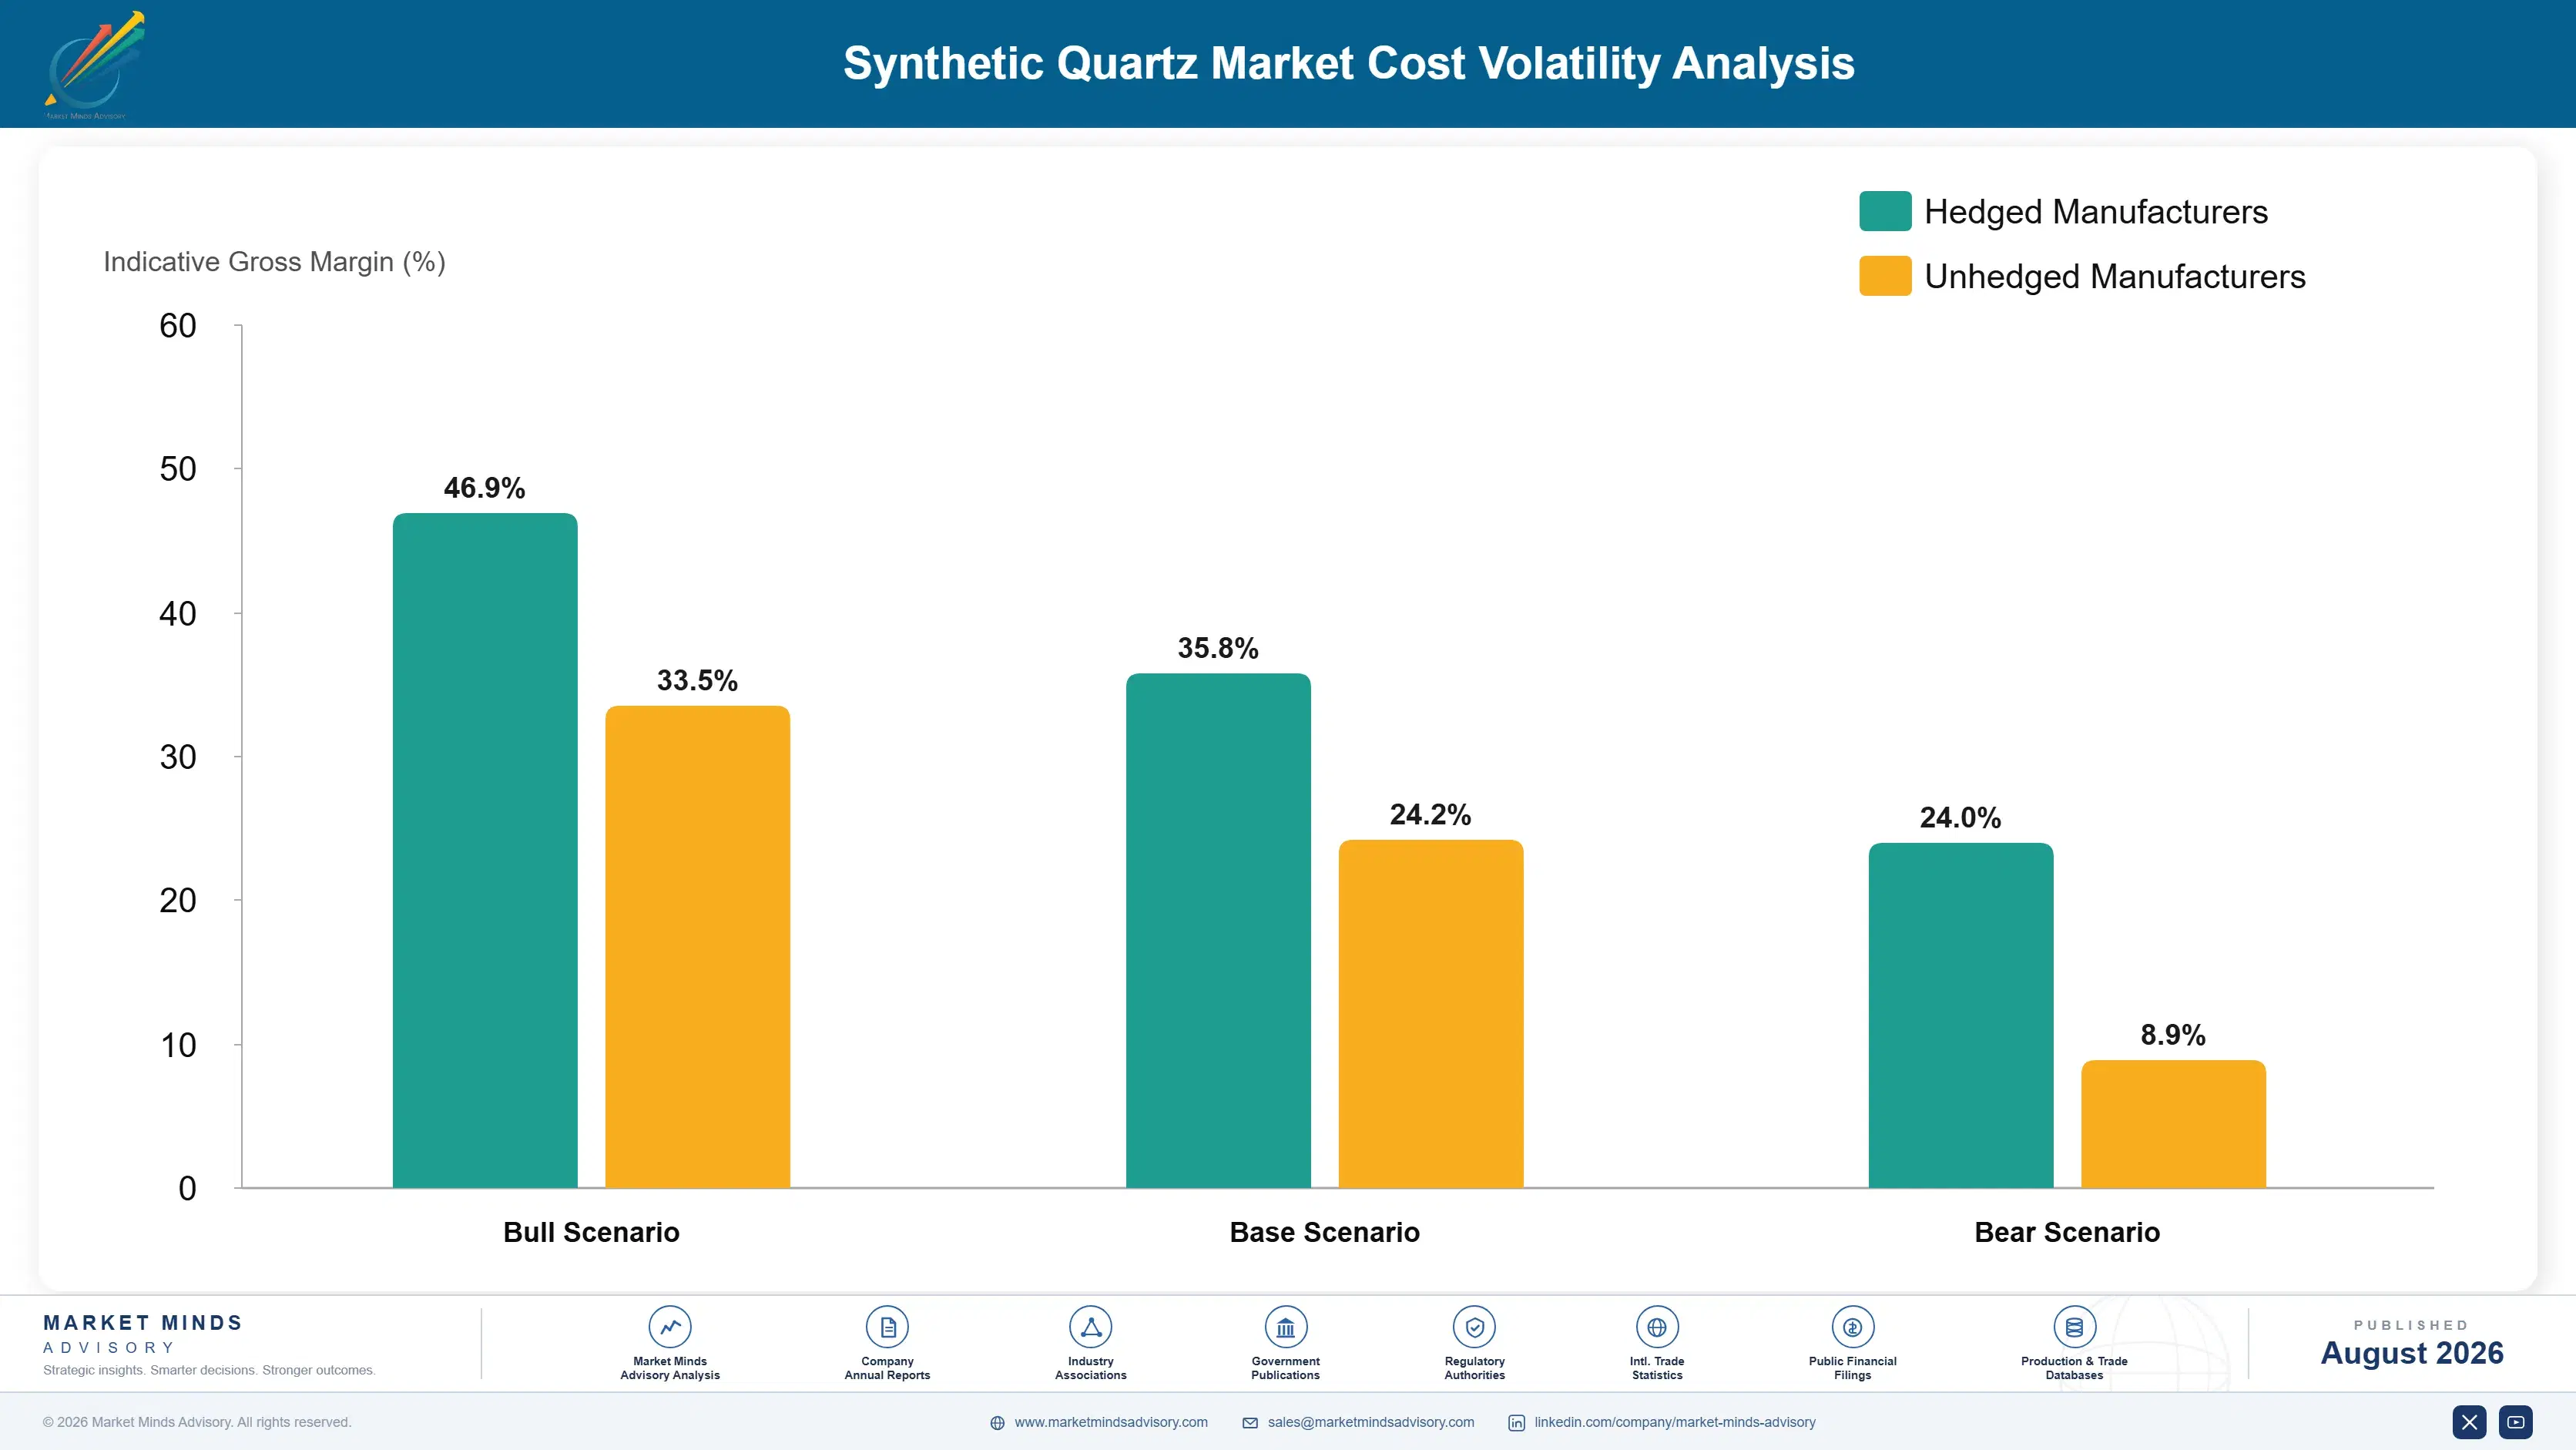
Purified silicon precursor accounts for roughly 34% of delivered synthetic quartz cost, sourced as silicon tetrachloride or related feedstock from a small number of suppliers. Fusion and annealing electricity contributes about 27% at an intensity near 17 megawatt hours per tonne, precision machining and polishing around 14%, metrology and qualification testing 8%, with packaging, handling and working capital carrying the remaining 17%.
Electricity was the defining exposure through the history and remains so. European industrial power prices through 2022 reached levels the IEA documented as unprecedented for the sector, which pushed fusion operations there to a cost position no furnace improvement recovers. Tosoh Annual Report 2023 recorded energy and raw material cost pressure across its advanced materials operations, and Corning Annual Report 2022 noted energy and input cost recovery lagging across optical communications lines.

The competitive disadvantage mechanism runs through power geography and metrology capability rather than furnace efficiency. Producers on exposed European or Japanese electricity carry a cost handicap that no operating improvement closes at this intensity. Those without production metrology cannot demonstrate the optical consistency qualification requires, which excludes them from premium grades entirely. Smaller producers frequently carry both limitations, which confines them to general fused quartz duty.
synthetic-quartz-market-trends-cost-volatility-analysis-1787310876964

Site fusion capacity on contracted advantaged industrial power

At roughly 17 megawatt hours per tonne, the difference between advantaged power and European spot pricing exceeds the entire conversion margin on synthetic silica, which makes energy geography a siting criterion rather than an operating cost. Contracting that supply before committing any capacity is the single decision that determines whether the new capacity ever earns anything at all.

Invest in production metrology before pursuing premium qualifications

Premium grades are decided on measured flatness, homogeneity and birefringence rather than assay, and a producer without production metrology cannot demonstrate consistency across batches whatever the material actually achieves. Metrology equipment costs a small fraction of furnace capacity, and it converts an unprovable marketing claim into qualification evidence that customers can genuinely act upon.

Qualify a second precursor source before supply tightens

Purified silicon precursor comes from a small qualified supplier base, and a single disruption there halts production entirely rather than merely raising the input cost. Qualifying an alternative source takes months of characterisation that nobody has available once supply has already tightened, and running that characterisation work in advance costs laboratory time rather than any capital.

Portfolio Architecture for Margin Defence

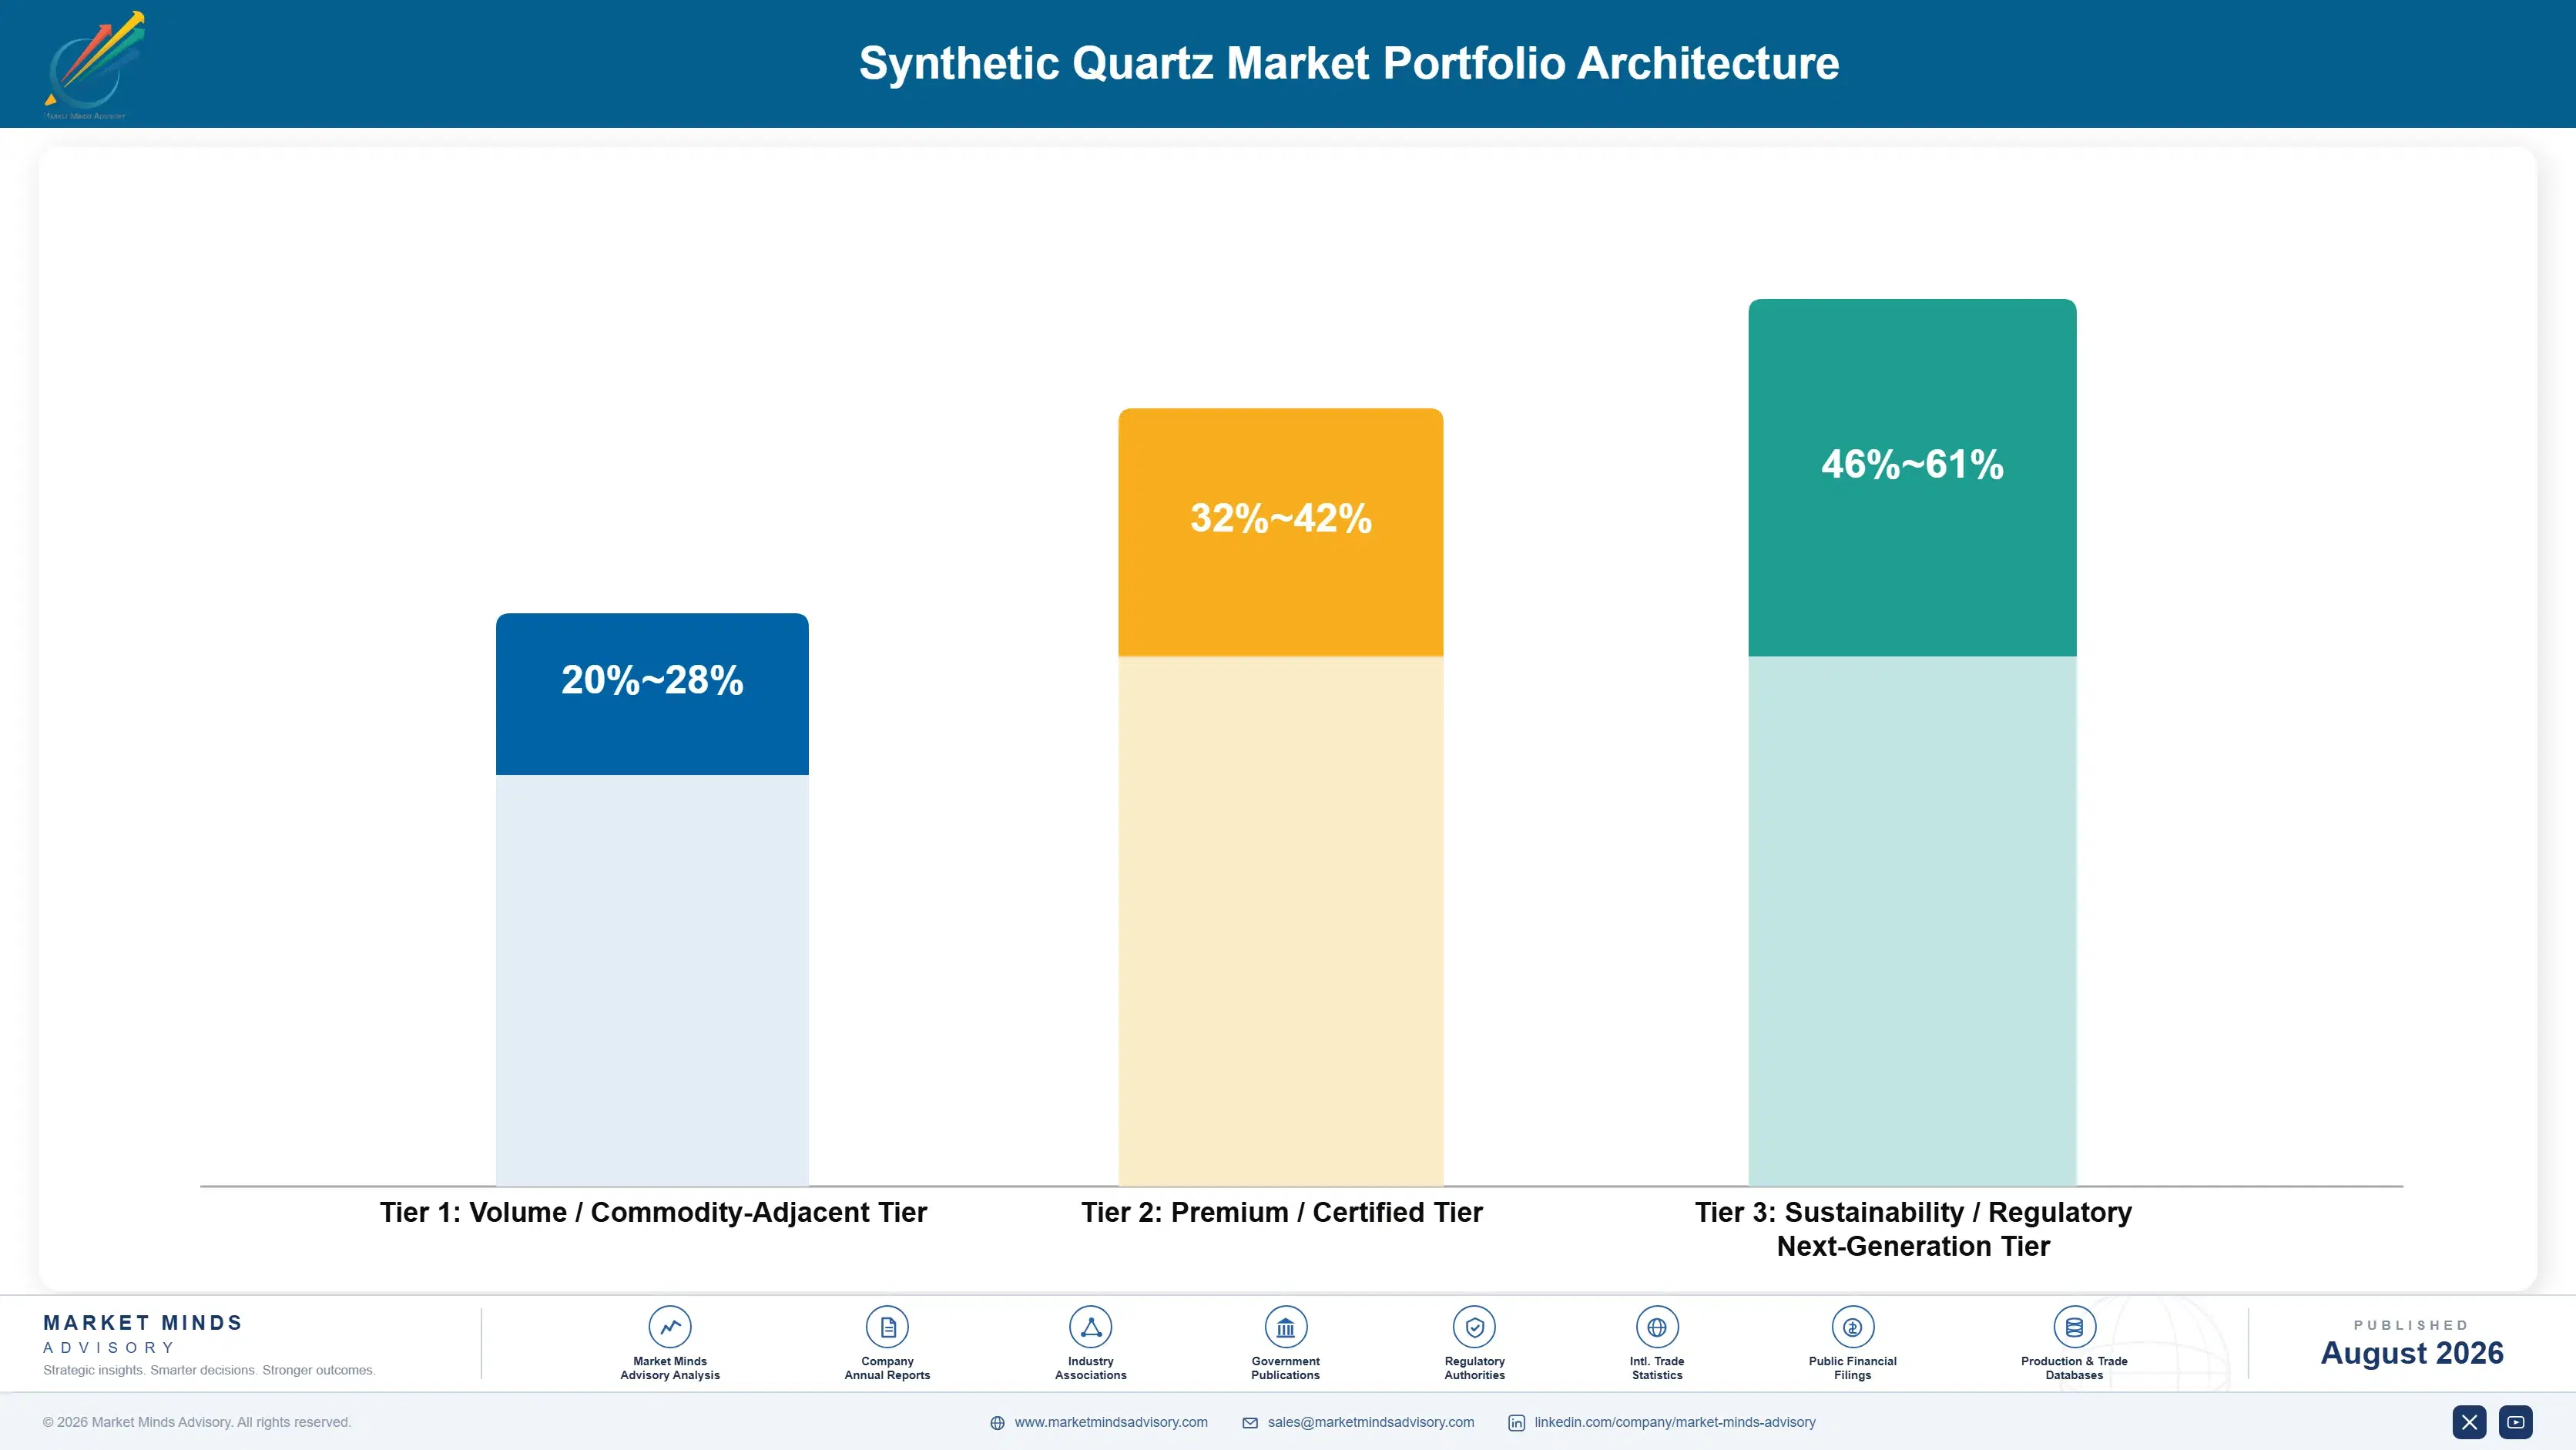
Margin architecture separates by optical specification and qualification barrier rather than by product form, which is not at all how most producers organise their internal reporting today. Tubing, rod and general fused quartz supplied against purity and dimensional specifications earns whatever regional competition allows, because a great many producers meet that requirement identically and nothing else is being purchased.
Value climbs where a measured optical property rather than a chemical one governs selection. Crucible and furnace component grades defend modest premiums through consistency and service life in demanding thermal duty. Photomask substrate and optical fibre preform grades sit far higher, since flatness, homogeneity and section consistency limit the qualified field to a handful of producers worldwide.

The highest value pools now concentrate where advanced node photomask requirements meet artificial intelligence driven interconnect demand, because both are tightening faster than qualified capacity is being added. Those pools are small in tonnage and quite disproportionate in realised margin. The commercial tension is that general fused quartz volume keeps furnaces loaded, which the energy economics genuinely require, while funding almost none of the metrology and qualification work above it.

Volume / Commodity-Adjacent Tier

Fused quartz tubing, rod and general purpose material supplied against purity and dimensional specifications into industrial, lighting and laboratory duty, where many producers satisfy the requirement and delivered price decides most awards.
Gross Margin: 20-28%

Premium / Certified Tier

Crucibles, furnace components, cultured quartz crystal and standard optical grades qualified into semiconductor and electronic component manufacture. Consistency and service life defend pricing here. The ten-point range reflects catalogue supply against qualified positions.
Gross Margin: 32-42%

Sustainability / Regulatory / Next-Generation Tier

Photomask substrate blanks and optical fibre preform grade silica meeting flatness, homogeneity and section consistency requirements. Qualification barriers and narrow fields defend pricing very strongly. The fifteen-point range reflects established photomask positions against emerging preform economics.
Gross Margin: 46-61%
synthetic-quartz-market-trends-portfolio-architecture-1787310877453

High-value Sub-segments and Strategic Watch-out

Photomask substrate blanks for advanced nodes

High value and genuinely high growth together here, because each node transition tightens flatness and homogeneity requirements further and the qualified producer field has not widened correspondingly at any point across the whole of the last decade. Realised margin here reflects that scarcity very directly indeed.
Gross Margin: 46-61%

Optical fibre preform grade synthetic silica

Strong realised value on the fastest secondary growth found anywhere here, because artificial intelligence interconnect demand has moved considerably faster than fibre producers had planned for and because qualification cycles measured in years leave those producers with remarkably few qualified alternatives available anywhere at all.
Gross Margin: 42-54%

Fused quartz tubing and general purpose material

The volume core of this entire market, keeping expensive fusion furnaces properly loaded on specifications that many producers meet identically while earning whatever regional competition happens to allow that quarter. Necessary for basic energy economics, but this tier funds nothing whatsoever above itself and never will.
Gross Margin: 20-28%

Fusion power cost exposure across the plant base

The strategic watch-out running right across this whole portfolio here, given that fusion alone consumes roughly 17 megawatt hours for every single tonne produced and that the regional electricity divergence now exceeds the entire conversion margin available on synthetic silica production anywhere in the world.
Gross Margin: 16-46%

How synthetic quartz demand behaves

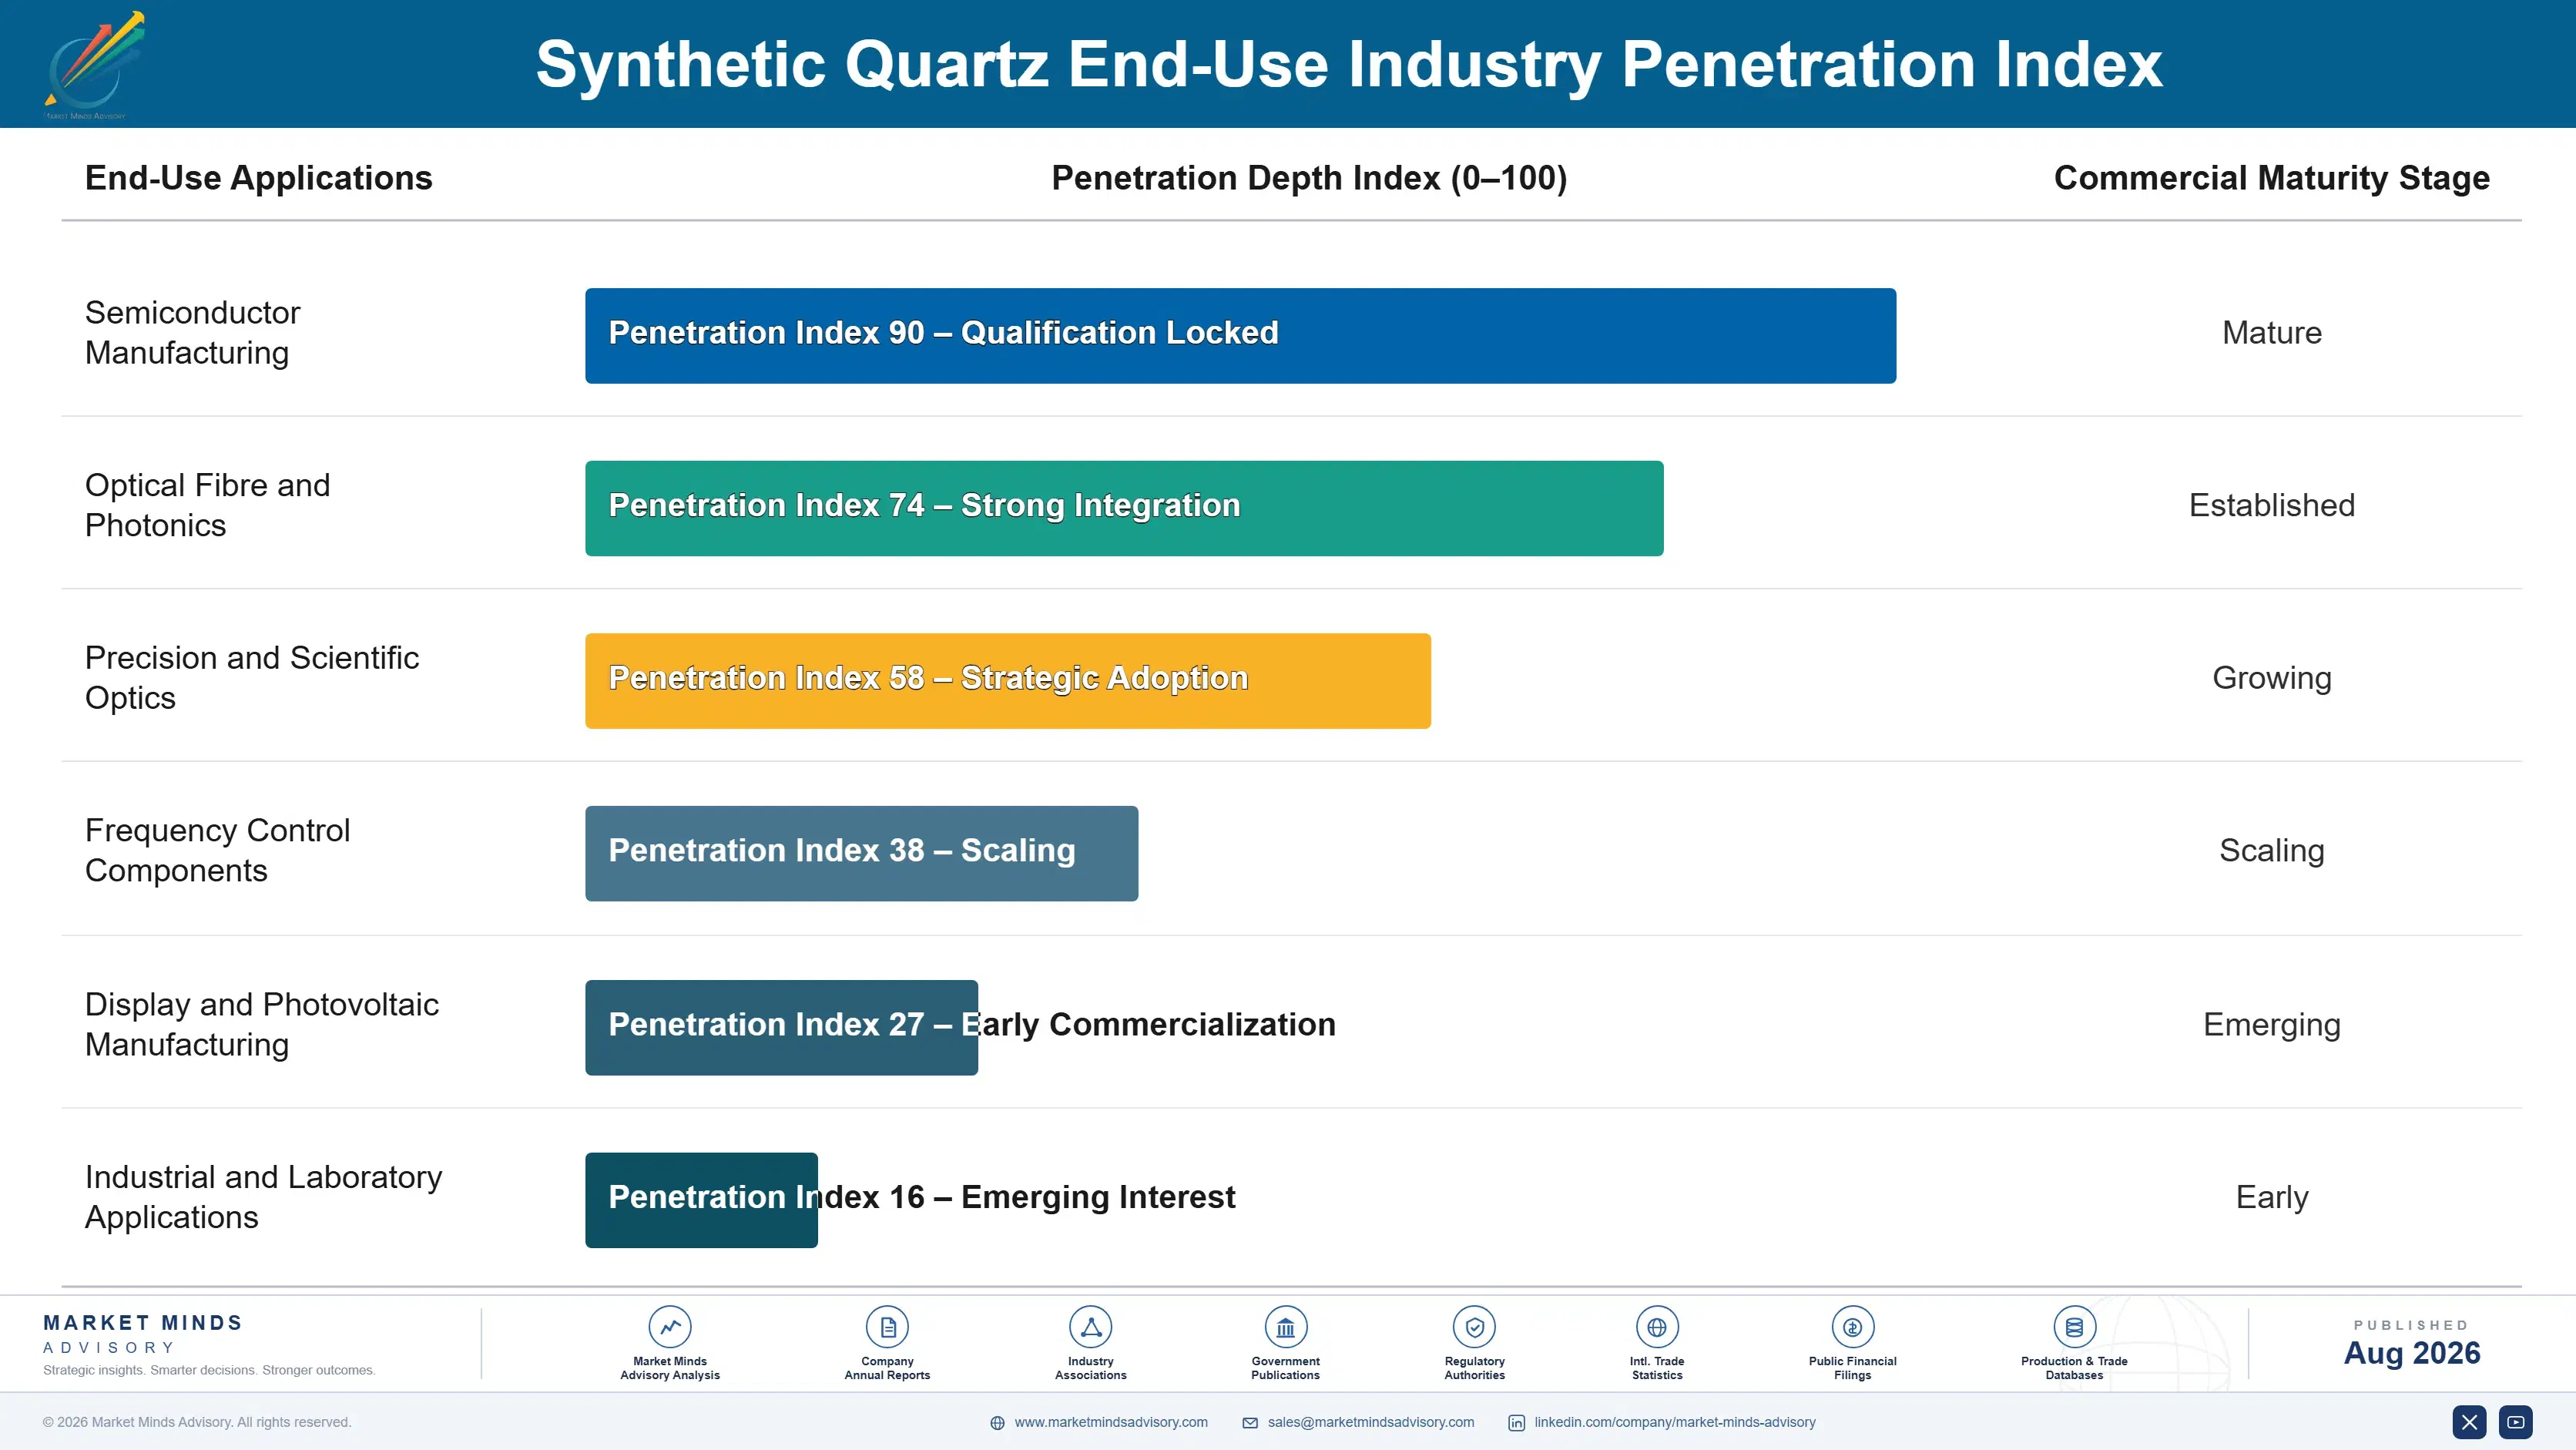
Demand is qualification-locked and consumable at the same time, which is an unusually favourable combination for whoever holds the position. A material qualified into a semiconductor node or a fibre platform is then consumed continuously for the operating life of that node or platform, and requalification costs the customer far more than any price difference a competitor might offer. Winning takes two years of patient technical work; holding it requires only consistent supply.
Stickiness tracks the qualification burden almost exactly. Tubing and general fused quartz is loosest, substituted on delivered price with no consequence beyond a purchase order. Crucible and furnace component grades sit tighter, because service life differences appear as yield variation nobody wants to investigate. Photomask substrate and preform grades are effectively immovable, since a substrate change touches process validation across a whole node or platform.

The buyer profile splits between engineering functions rather than by company scale. Semiconductor and photonics customers put process and materials engineering in charge, evaluating optical metrology data long before commercial discussion opens, and procurement then executes what engineering decided. Industrial and laboratory buyers purchase tubing and general material through distribution on price and dimensional specification, which is a completely separate commercial world.
synthetic-quartz-market-trends-end-use-penetration-index-1787310877946

What we would actually do here

These are among the four positions where our research anticipates prominent divergence between winners and laggards over the coming forecast period. Each is grounded in the demand model, the regulatory perimeter, and the announced capacity pipeline.
01 / OPTICAL SPECIFICATION EVIDENCE

Publish the homogeneity maps, not the purity certificate

Every credible producer reaches the parts-per-billion metals specification, and nobody has lost a qualification over purity in years, yet purity certificates remain what most suppliers still put in front of customers. Producers publishing measured flatness, homogeneity and birefringence across production batches realise roughly 45% above competitors leading with assay data. The measurement capability required costs metrology equipment rather than any production capital, and most producers avoid publishing it precisely because their batch variation is considerably worse than any marketing material implies.
02 / SEMICONDUCTOR NODE QUALIFICATION

Qualify during development, not after the ramp

Semiconductor qualification runs around 24 months across material characterisation, tool trials and production validation, and the material qualified into a node then supplies for the whole of that node's life and frequently well beyond it. Producers achieving that qualification capture roughly 7 times the lifetime revenue of those supplying replacement consumables afterwards instead. Engagement must begin during the customer's development programme, because most producers simply wait for a purchase enquiry on a decision that was settled elsewhere many months earlier.
03 / FUSION POWER POSITION

Choose the site by electricity, not by geography

Fusion consumes roughly 17 megawatt hours per tonne, so the gap between advantaged industrial power and European spot pricing comfortably exceeds the entire conversion margin available on synthetic silica. Producers sitting on contracted advantaged power run roughly 26% below exposed competitors, and that difference alone decides who is able to price into a competitive qualification at all. Several European producers now face a cost position that their existing plant locations were never designed around and that they cannot easily change at all.
04 / PREFORM GRADE CAPABILITY

Build the large section capability while demand outruns supply

Preform grade demands attenuation-critical purity together with geometric and index consistency through a very large section, which is genuinely different from photomask capability despite the material looking identical. Producers already holding preform qualification realise roughly 2.5 times general fused silica pricing, on demand that is now driven by data centre interconnect rather than by consumer broadband at all. Artificial intelligence infrastructure has moved that demand considerably faster than fibre producers had planned, leaving them with remarkably few qualified alternatives available to them anywhere.

Engagement Snapshot From the Field

A live engagement with an industry participant carrying material or product regulatory and market exposure ahead of a defining policy shift, showing how our research translates into a defensible multi-year portfolio strategy.
MARKET MINDS ADVISORY · CLIENT ENGAGEMENT SUMMARY
Synthetic Quartz Producer Strategic Portfolio Review and Transition Roadmap 2026·Investment Scenario on Synthetic Quartz Exposure Evaluation 2025-26
CLIENT PROFILE
A synthetic quartz producer operating fusion and finishing capacity in Western Europe, supplying semiconductor consumables, industrial fused quartz and a small optical grade business to customers across Europe and North America. Synthetic quartz revenue approached EUR 96 million annually (client-reported, unverified by MMA), roughly seventy percent of it tubing, rod and general fused quartz sold against purity and dimensional specifications.
STRATEGIC CHALLENGE
Margins had fallen sharply through the energy repricing and had not recovered, and management attributed the shortfall to Chinese competition rather than to its own power position. Optical grade qualifications were being lost without anybody establishing why. A proposed furnace expansion at the existing European site was under active consideration.
MMA APPROACH
We rebuilt delivered cost by product grade and by power contract rather than at company level, quantified what the energy position was worth against advantaged regions, and reconstructed eight lost optical grade qualifications through interviews with customer process engineering rather than the purchasing contacts the client normally dealt with. Batch optical consistency was measured independently against three competitor materials.
KEY FINDINGS
  1. Margin decline traced almost entirely to the European power position at the fusion furnaces rather than to Chinese pricing, which had barely moved on comparable grades.
  2. Seven of eight lost qualifications failed on demonstrated batch-to-batch optical consistency rather than on peak specimen performance, delivered price or lead time.
  3. No production metrology existed for homogeneity or birefringence, so every optical grade proposal relied on selected specimen data that customers routinely discounted.
  4. The proposed furnace expansion sat at the highest power cost site and would have added general fused quartz capacity into the most competitive tier available.
CLIENT PROFILE
A synthetic quartz producer operating fusion and finishing capacity in Western Europe, supplying semiconductor consumables, industrial fused quartz and a small optical grade business to customers across Europe and North America. Synthetic quartz revenue approached EUR 96 million annually (client-reported, unverified by MMA), roughly seventy percent of it tubing, rod and general fused quartz sold against purity and dimensional specifications.
STRATEGIC CHALLENGE
Margins had fallen sharply through the energy repricing and had not recovered, and management attributed the shortfall to Chinese competition rather than to its own power position. Optical grade qualifications were being lost without anybody establishing why. A proposed furnace expansion at the existing European site was under active consideration.
MMA APPROACH
We rebuilt delivered cost by product grade and by power contract rather than at company level, quantified what the energy position was worth against advantaged regions, and reconstructed eight lost optical grade qualifications through interviews with customer process engineering rather than the purchasing contacts the client normally dealt with. Batch optical consistency was measured independently against three competitor materials.
KEY FINDINGS
  1. Margin decline traced almost entirely to the European power position at the fusion furnaces rather than to Chinese pricing, which had barely moved on comparable grades.
  2. Seven of eight lost qualifications failed on demonstrated batch-to-batch optical consistency rather than on peak specimen performance, delivered price or lead time.
  3. No production metrology existed for homogeneity or birefringence, so every optical grade proposal relied on selected specimen data that customers routinely discounted.
  4. The proposed furnace expansion sat at the highest power cost site and would have added general fused quartz capacity into the most competitive tier available.
RECOMMENDED STRATEGY
Phase 1: Phase one: install production metrology for homogeneity and birefringence and publish measured batch consistency data to the four largest optical prospects. Phase 2: Phase two: cancel the European furnace expansion and evaluate fusion capacity siting against contracted industrial power pricing in advantaged regions instead. Phase 3: Phase three: pursue optical fibre preform grade development, where large section process control could be built from existing capability within two years.
OUTCOME
The client cancelled the European expansion and installed production metrology at the finishing operation. Two optical grade qualifications were secured within eleven months on published consistency data, and realised margin on optical volume improved by 22% (client-reported, unverified by MMA) against the prior year on comparable shipped volume.

Frequently Asked Questions

Foundational context covering the market sizes, CAGR, scope, country, region and competition that inform every finding below. This section is provided to cover basics and most often pre-purchase conversations, answered from the MMA Primary Research Dataset.

What is the current size of the Synthetic Quartz Market?

The market is valued at USD 1.2 billion in 2025, rising to USD 1.30 billion in 2026. Sizing covers material sold to semiconductor, photonics, optical and electronic component manufacturers at realised delivered price.

How large will the Synthetic Quartz Market be by 2036?

The market reaches USD 2.86 billion by 2036, an increase of USD 1.56 billion across the forecast period. That represents an expansion multiple of 2.20 times the 2026 base.

What is the CAGR for the Synthetic Quartz Market 2026 to 2036?

The base case CAGR is 8.2% across 2026 to 2036. The bull case reaches 9.4% on artificial intelligence infrastructure, while the bear case sits at 6.9% under a prolonged semiconductor correction.

Which segment is growing fastest?

Photomask substrate grade fused silica grows fastest at 12.3%, a full 1.50 times the market rate. Advanced nodes demand flatness under 200 nanometres that very few producers reach consistently.

Who are the major companies in the Synthetic Quartz Market?

Shin-Etsu Chemical, Tosoh, Heraeus, Corning and AGC lead on production capacity, holding 68% collectively. The remaining field spans Western optical specialists and Chinese producers moving upward.

Which country is growing fastest?

India grows fastest at 11.0%, driven by semiconductor and display investment moving from announcement into construction alongside optical fibre manufacture that already has genuine scale.

Report Segmentation Architecture

The full report scope spans multiple orthogonal segmentation dimensions, with cross-tabulated demand data provided for each dimension pair. Coverage extends further to regional breakdowns, trend trajectories, and the competitive detail needed to support segment-level decision-making.

By Product Form and Grade

  • Synthetic Fused Silica Ingots and Blanks
  • Photomask Substrate Grade Fused Silica
  • Optical Fibre Preform Grade Silica
  • Cultured Quartz Crystal
  • Fused Quartz Tubing, Rod and Crucibles
  • High-Purity Synthetic Quartz Powder

By End-Use Industry

  • Semiconductor Manufacturing
  • Optical Fibre and Photonics
  • Precision and Scientific Optics
  • Frequency Control Components
  • Display and Photovoltaic Manufacturing
  • Industrial and Laboratory Applications

By Customer Type and Channel

  • Semiconductor Device Manufacturers
  • Photomask and Reticle Producers
  • Optical Fibre Manufacturers
  • Precision Optics Fabricators
  • Electronic Component Manufacturers
  • Technical Glass Distribution

By Region

  • North America
  • Western Europe
  • East Asia
  • South Asia and Pacific
  • Latin America
  • Middle East and Africa
  • Eastern Europe

Scope, Methodology, and Coverage

Every figure in this report is reproducible from documented input assumptions. The scope below maps the historical period, the forecast horizon, the segmentation dimensions, and the countries covered, alongside the underlying primary and qualitative methodology.
Historical Period
2020 to 2025
Forecast Period
2026 to 2036
Base Year
2025 (USD billions; MMA Primary Research Dataset, August 2026)
Market Definition
The market comprises manufactured fused silica and cultured quartz crystal produced for technical applications, spanning synthetic fused silica ingots and blanks, photomask substrate grade fused silica, optical fibre preform grade silica, cultured quartz crystal, fused quartz tubing, rod and crucibles, and high-purity synthetic quartz powder. Sizing captures material revenue at realised delivered price across semiconductor manufacturing, optical fibre and photonics, precision and scientific optics, frequency control components, display and photovoltaic manufacturing, and industrial and laboratory applications. Natural mined quartz and quartz sand, engineered quartz surfacing and countertops, finished photomasks and reticles, drawn optical fibre, and finished oscillators or semiconductor devices all fall outside scope.
Quantitative Units
USD billions (current prices); synthetic quartz shipped annually in thousands of tonnes; USD per kilogram at realised delivered price
Segmentation Dimensions
By Product Form and Grade; By End-Use Industry; By Customer Type and Channel; By Region
Regions Covered
North America, Western Europe, East Asia, South Asia and Pacific, Latin America, Middle East and Africa, Eastern Europe
Countries Covered
USA, Canada, Mexico, UK, Germany, France, Netherlands, Switzerland, Italy, Poland, Czech Republic, Hungary, Turkey, China, Japan, South Korea, Taiwan, India, Singapore, Malaysia, Thailand, Vietnam, Australia, Brazil, Argentina, Saudi Arabia, UAE, Egypt, South Africa, and additional markets relevant to this sector
Key Companies Profiled
Shin-Etsu Chemical, Tosoh, Heraeus, Corning, AGC, Momentive Technologies, Ohara, Feilihua Quartz Glass, Jiangsu Pacific Quartz, Raesch Quarz, QSIL, Technical Glass Products, Lianyungang Guanhong Quartz, Nihon Dempa Kogyo, Kyocera, TXC Corporation, Seiko Epson, Donghai County Hongfa Quartz, Sico Technology, Quartz Scientific.
Quantitative Methodology
Primary survey, n=3,800 respondents, Q4 2025, six countries; demand-side model with trade association cross-validation
Qualitative Methodology
47 expert interviews, Q4 2025; applied to validate demand model assumptions, identify emerging dynamics, and assess competitive positioning
Report Format
PDF and XLSX data workbook (Word format preview document)
Publisher
Market Minds Advisory
Report Code
MMA-2026-CHM-606
Published
August 2026
Contact
sales@marketmindsadvisory.com | www.marketmindsadvisory.com

Purchase the full Synthetic Quartz Market Report (2026 to 2036).

The full report sizes the synthetic quartz market across six product forms and grades, six end-use industries, six customer channels and seven regions, with annual forecasts to 2036 in revenue and tonnage shipped. It benchmarks batch-to-batch optical consistency across competing materials rather than peak specimen performance, which is the analysis that establishes why qualifications are actually won and lost. Twenty participants are assessed on a consistent production capacity basis, with power contract positions mapped separately from installed fusion capacity. Qualification positions are identified node by node and platform by platform.
Six product forms and grades sized and forecast annually
Batch optical consistency benchmarked across competing materials directly
Twenty participants assessed on consistent production capacity basis
Power contract positions mapped separately from installed fusion capacity
Qualification positions identified node by node and platform
Preform grade capacity constraints quantified against interconnect demand

Built For The People Who Decide

From boardroom strategy to bench-side execution, this report is read cover-to-cover by leaders shaping the next decade of their industry, turning demand scenarios, market dynamics and valuation benchmarks into decisions.
CXOs/ Presidents/ VPs/ Managers
M&A and Corporate Development
Strategy Teams and R&D Heads
Procurement and Product Directors
Regulatory and Compliance Leaders
Investor Relations and Equity Analysts