Market Minds Advisory
Synthetic Dye Market

Synthetic Dye Market: A Third of It Goes Down the Drain and Gets Paid For Twice

Reactive dyes fix to cotton at around two thirds efficiency, so a mill pays once for the dye it wastes and again to treat the coloured water carrying it away.

Lead Analyst

Bilal Shaikh

Published

September 2026

Make Smarter Decisions with Customized Research Insights

Request a free sample report and evaluate market opportunities, growth trends, and competitive dynamics relevant to your business needs.

2025 MARKET VALUE$8.6BMarket Size 2025
2036 FORECAST VALUE$14.1BBase Case , 2026 to 2036
CAGR 2026 TO 20364.6 %Bull 5.8% / Bear 3.4%
INCREMENTAL OPPORTUNITY$5.1BNet 10- year value creation
EXPANSION MULTIPLE1.57x2036 value over 2026 base
Strategic Levers
M&A Pipeline
Regional Outlook
Country Rankings
Competitive Intelligence
Segmental Deep-dive
Call-Us : 91 93563 13602

Executive Snapshot and Market Trajectory

Roughly 68% of a reactive dye bonds to the cotton and the rest leaves in the wash water, which a mill then has to decolourise before discharge. The mill therefore pays for that unfixed third twice, and almost nobody in this industry quotes a price that reflects it.
That gap between price per kilogram and cost per fixed kilogram is where the commercial argument sits. Higher fixation and low-salt chemistry cost more in the drum and less in the effluent plant, and as discharge colour limits tighten toward 150 units the second number starts dominating. Mills buying on list price are optimising the smaller half of their own cost. Purchasing and compliance rarely compare notes.
Supply risk runs through one country. Around 78% of key dye intermediates are produced in China, where provincial environmental enforcement has repeatedly closed capacity and sent prices through violent spikes. A dyehouse in Dhaka is exposed to Chinese environmental policy considerably more than to any decision it makes about dye chemistry. No financial instrument hedges that exposure, and the only real answer is qualifying alternative supply before the next enforcement round arrives.
Market Definition
Synthetic organic dyes supplied for colouring textiles and other industrial substrates, covering reactive dyes, disperse dyes, acid dyes, vat and sulphur dyes, solvent and specialty industrial dyes, and direct, basic and other classes. Measured at producer selling value. Excludes food, drug and cosmetic colourants, inorganic and organic pigments, natural dyes, optical brighteners, and textile auxiliaries or finishing chemicals sold separately.
Base Year Value
$8.6B in 2025 (MMA Primary Research Dataset, August 2026)
Forecast Period
2026 to 2036, eleven discrete annual values
CAGR
4.6% base case. Bull 5.8%. Bear 3.4%.
Fastest Growth Segment
Solvent and Specialty Industrial Dyes: 6.9% CAGR
Fastest Growth Country
Bangladesh: 8.2% CAGR
Fastest Growth Region
South Asia and Pacific: 6.4% CAGR
Largest Region
East Asia: 38% of 2025 global value
Market Leaders
Archroma, DyStar, Zhejiang Longsheng Group, Kiri Industries, Atul Ltd. Source: MMA Primary Research Dataset, July 2026.
Primary Survey
n=3,800 procurement and R&D decision-makers, Q4 2025, six countries
Methodology
Demand-side build-up, cross-validated against public data, 47 expert interviews

Synthetic Dye Market Forecast Scenarios

synthetic-dye-market-trends-size-forecast-scenario-1787639619496
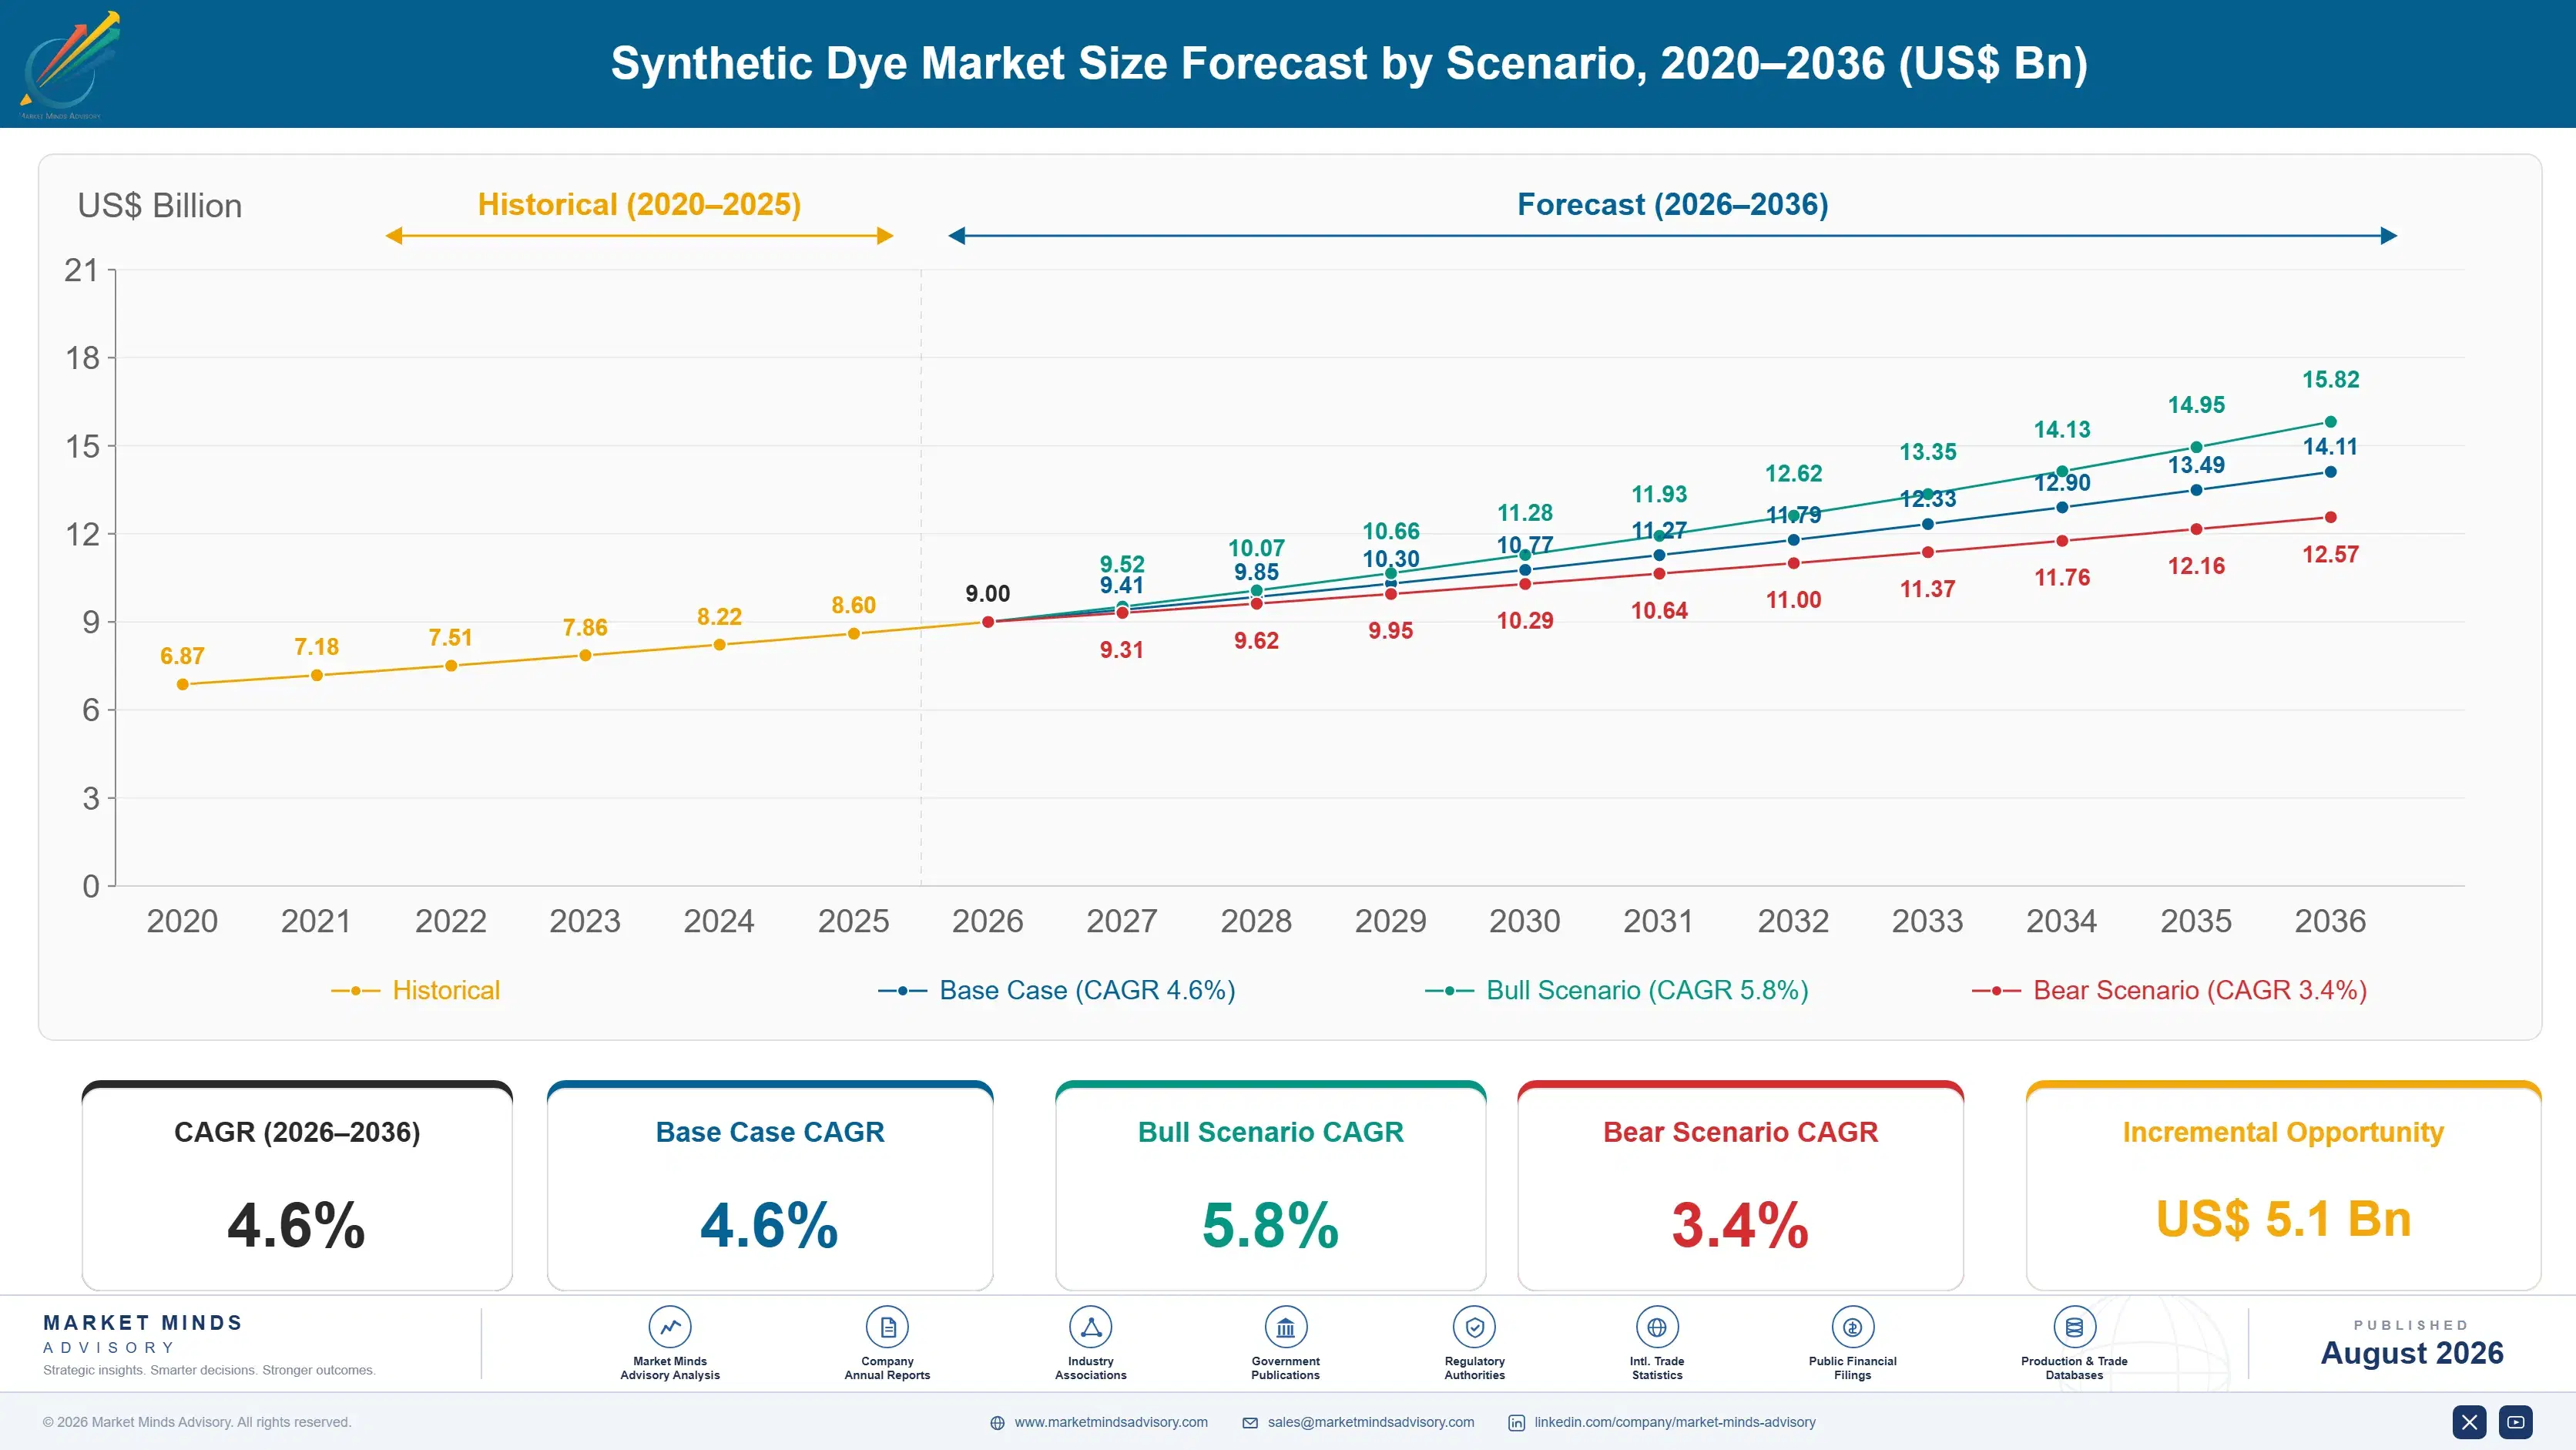
Growth ran near 3.8% between 2020 and 2025, with volume following textile production while pricing swung violently on Chinese intermediate supply. Environmental enforcement closed intermediate capacity repeatedly across the period and produced spikes that no dye buyer could hedge against. Effluent regulation tightened across Indian and Chinese textile clusters, which began shifting demand toward higher fixation chemistry for compliance reasons rather than performance ones.
Base case 4.6% rests on three mechanisms. Solvent and specialty industrial dyes grow at 6.9% on digital inkjet printing across textiles, packaging and decorative applications. Reactive dyes grow at 5.6% as cotton and blend production expands and higher fixation grades displace conventional ones. And Bangladesh grows fastest of any country at 8.2% as knitted and woven export capacity continues expanding faster than anywhere else. Two of the three depend on regulation rather than on textile output.
The bull case at 5.8% assumes effluent regulation tightening enough that cost per fixed kilogram becomes the standard purchasing metric, which would reprice the whole product category upward. The bear case at 3.4% is textile production growth slowing while Chinese intermediate overcapacity returns, compressing dye pricing without any corresponding relief on the effluent side. Enforcement timing decides which case arrives.

Cost Per Fixed Kilogram, Not Per Kilogram

A reactive dye fixes to cotton at around 68% under normal mill conditions, which means roughly a third of what was bought leaves in the wash water carrying full colour. That unfixed portion is not simply wasted material. It is a compliance problem the mill must then spend money removing, since discharge colour limits near 150 units apply long before any dye would be visible in the outflow.
TOP FIVE CONCENTRATION29%A long tail of Asian producers keeps concentration low
REACTIVE FIXATION RATE68%Portion of applied dye bonding permanently to the fibre
EFFLUENT COLOUR LIMIT150 unitsDischarge threshold applied under increasingly tight water regulation
SALT LOADING PER DYEING60 g/lElectrolyte required to drive conventional reactive dye exhaustion
INTERMEDIATE SUPPLY CONCENTRATION78%Key dye intermediates produced within a single country
RESTRICTED SUBSTANCE ENTRIES240Chemicals excluded under brand manufacturing restricted substance lists
So the number that matters is cost per fixed kilogram, and essentially nobody quotes it. Higher fixation chemistry and low-salt reactive systems cost more per kilogram in the drum and considerably less across the whole dyehouse once effluent treatment, salt handling and water consumption are counted. Mills purchasing on list price are optimising the smaller half of their own cost structure and treating the larger half as an unavoidable overhead.
Underneath all of it sits a single country risk. Around 78% of key dye intermediates including H-acid and vinyl sulphone are produced in China, where provincial enforcement has repeatedly closed capacity with little warning and sent prices up several fold. A dyehouse anywhere in the world is exposed to Chinese provincial policy far more than to anything happening in its own chemistry.
"Every purchasing conversation I hear is about price per kilo, and every effluent manager in the same building is fighting a colour limit caused by the dye that never fixed. Those two people work for the same company and almost never talk to each other."
Director, Textile Chemicals and Colourants Practice · MMA Chemicals and Materials Practice · August 2026

Market Trends

Discharge colour limits repricing unfixed dye as compliance cost

Effluent colour thresholds near 150 units apply across a growing number of textile clusters, and zero liquid discharge requirements in parts of India and China remove the option of dilution entirely. Unfixed dye stops being wasted material and becomes a treatment cost with a regulatory deadline attached to it. That converts fixation rate from a technical specification into a commercial variable, and it is the single change most likely to reprice this whole product category upward. Mills that already pay for decolourisation are the first to do the arithmetic properly, and they reach a different conclusion.
Market Impact: Bangladesh growing fastest at 8.2%
Digital printing pulling demand toward specialty dye chemistry

Digital inkjet printing across textiles, packaging and decorative surfaces requires dyes formulated for jetting rather than for exhaustion in a drum, with tight particle size, filtration and stability requirements that conventional grades cannot meet. Solvent and specialty industrial dyes grow at 6.9% on that shift. Volume per metre printed is lower than conventional dyeing while value per kilogram is considerably higher, and the qualification barriers are meaningfully steeper than in conventional textile supply. Ink and printer manufacturers qualify dye suppliers over long periods and rarely reopen those positions, which makes them considerably more durable than any textile mill relationship.
Market Impact: Excludes around 240 chemicals

Market Opportunities and Growth Drivers

Export apparel capacity expanding fastest in South Asia

Bangladesh grows fastest of any country at 8.2% as knitted and woven export capacity expands faster than anywhere, with dye consumption following mill installation directly rather than with any lag. Vietnamese and Indian expansion follows similar patterns at different speeds. Brand restricted substance requirements arrive with the orders, which means new capacity is qualified against compliance documentation from the outset rather than being retrofitted to it later on. Capacity announcements are therefore a demand signal available a year or more before anybody issues an order, and very few producers track them deliberately.
Market Impact: 78% of intermediates from one country

Brand restricted substance lists functioning as market access gates

Manufacturing restricted substance lists now exclude around 240 individual chemicals across azo, heavy metal and other categories, and compliance documentation has become a condition of supplying any mill working for a western brand. That excludes producers who cannot document their intermediates and supply chain properly, regardless of the dye itself. Documentation capability rather than dye chemistry decides which producers reach the most valuable export mills anywhere in Asia. Compliance documentation is administrative work rather than capital investment, which makes exclusion on that basis particularly frustrating for producers who could have avoided it.
Market Impact: Ignores 32% never fixing

Market Restraints and Challenges

Intermediate supply concentrated in one regulatory jurisdiction

Around 78% of key dye intermediates are produced in China, where provincial environmental enforcement has repeatedly closed capacity at short notice and driven prices up several fold within months. The root cause is decades of consolidation into a small number of chemical parks. Commercially it means a dye buyer anywhere carries Chinese policy risk it cannot hedge. Indian intermediate capacity expansion and multi-source qualification are the mitigations participants are pursuing with limited progress so far. Qualification testing takes months and buys genuine continuity. Domestic Indian capacity is expanding, though slowly against Chinese dominance.
Market Impact: Colour limits near 150 units

Purchasing on list price ignoring the larger cost element

Mills buy dye on price per kilogram while roughly a third of it never fixes and becomes an effluent treatment cost measured in the same currency. The root cause is that purchasing and environmental compliance sit in different departments with different budgets. Commercially it holds back higher fixation chemistry that would reduce total cost. Whole dyehouse cost modelling and shared budget accountability are the mitigations, and they are organisational rather than technical. A supplier reaching only the purchasing department is arguing about the smaller half of the mill's actual cost, which is why the argument so rarely lands.
Market Impact: Specialty dyes growing at 6.9%
4 additional market trends, 3 additional growth drivers, and 2 additional restraints and challenges are covered in the full report. Contact sales@marketmindsadvisory.com to access the complete intelligence.

Segment CAGR and Growth Architecture

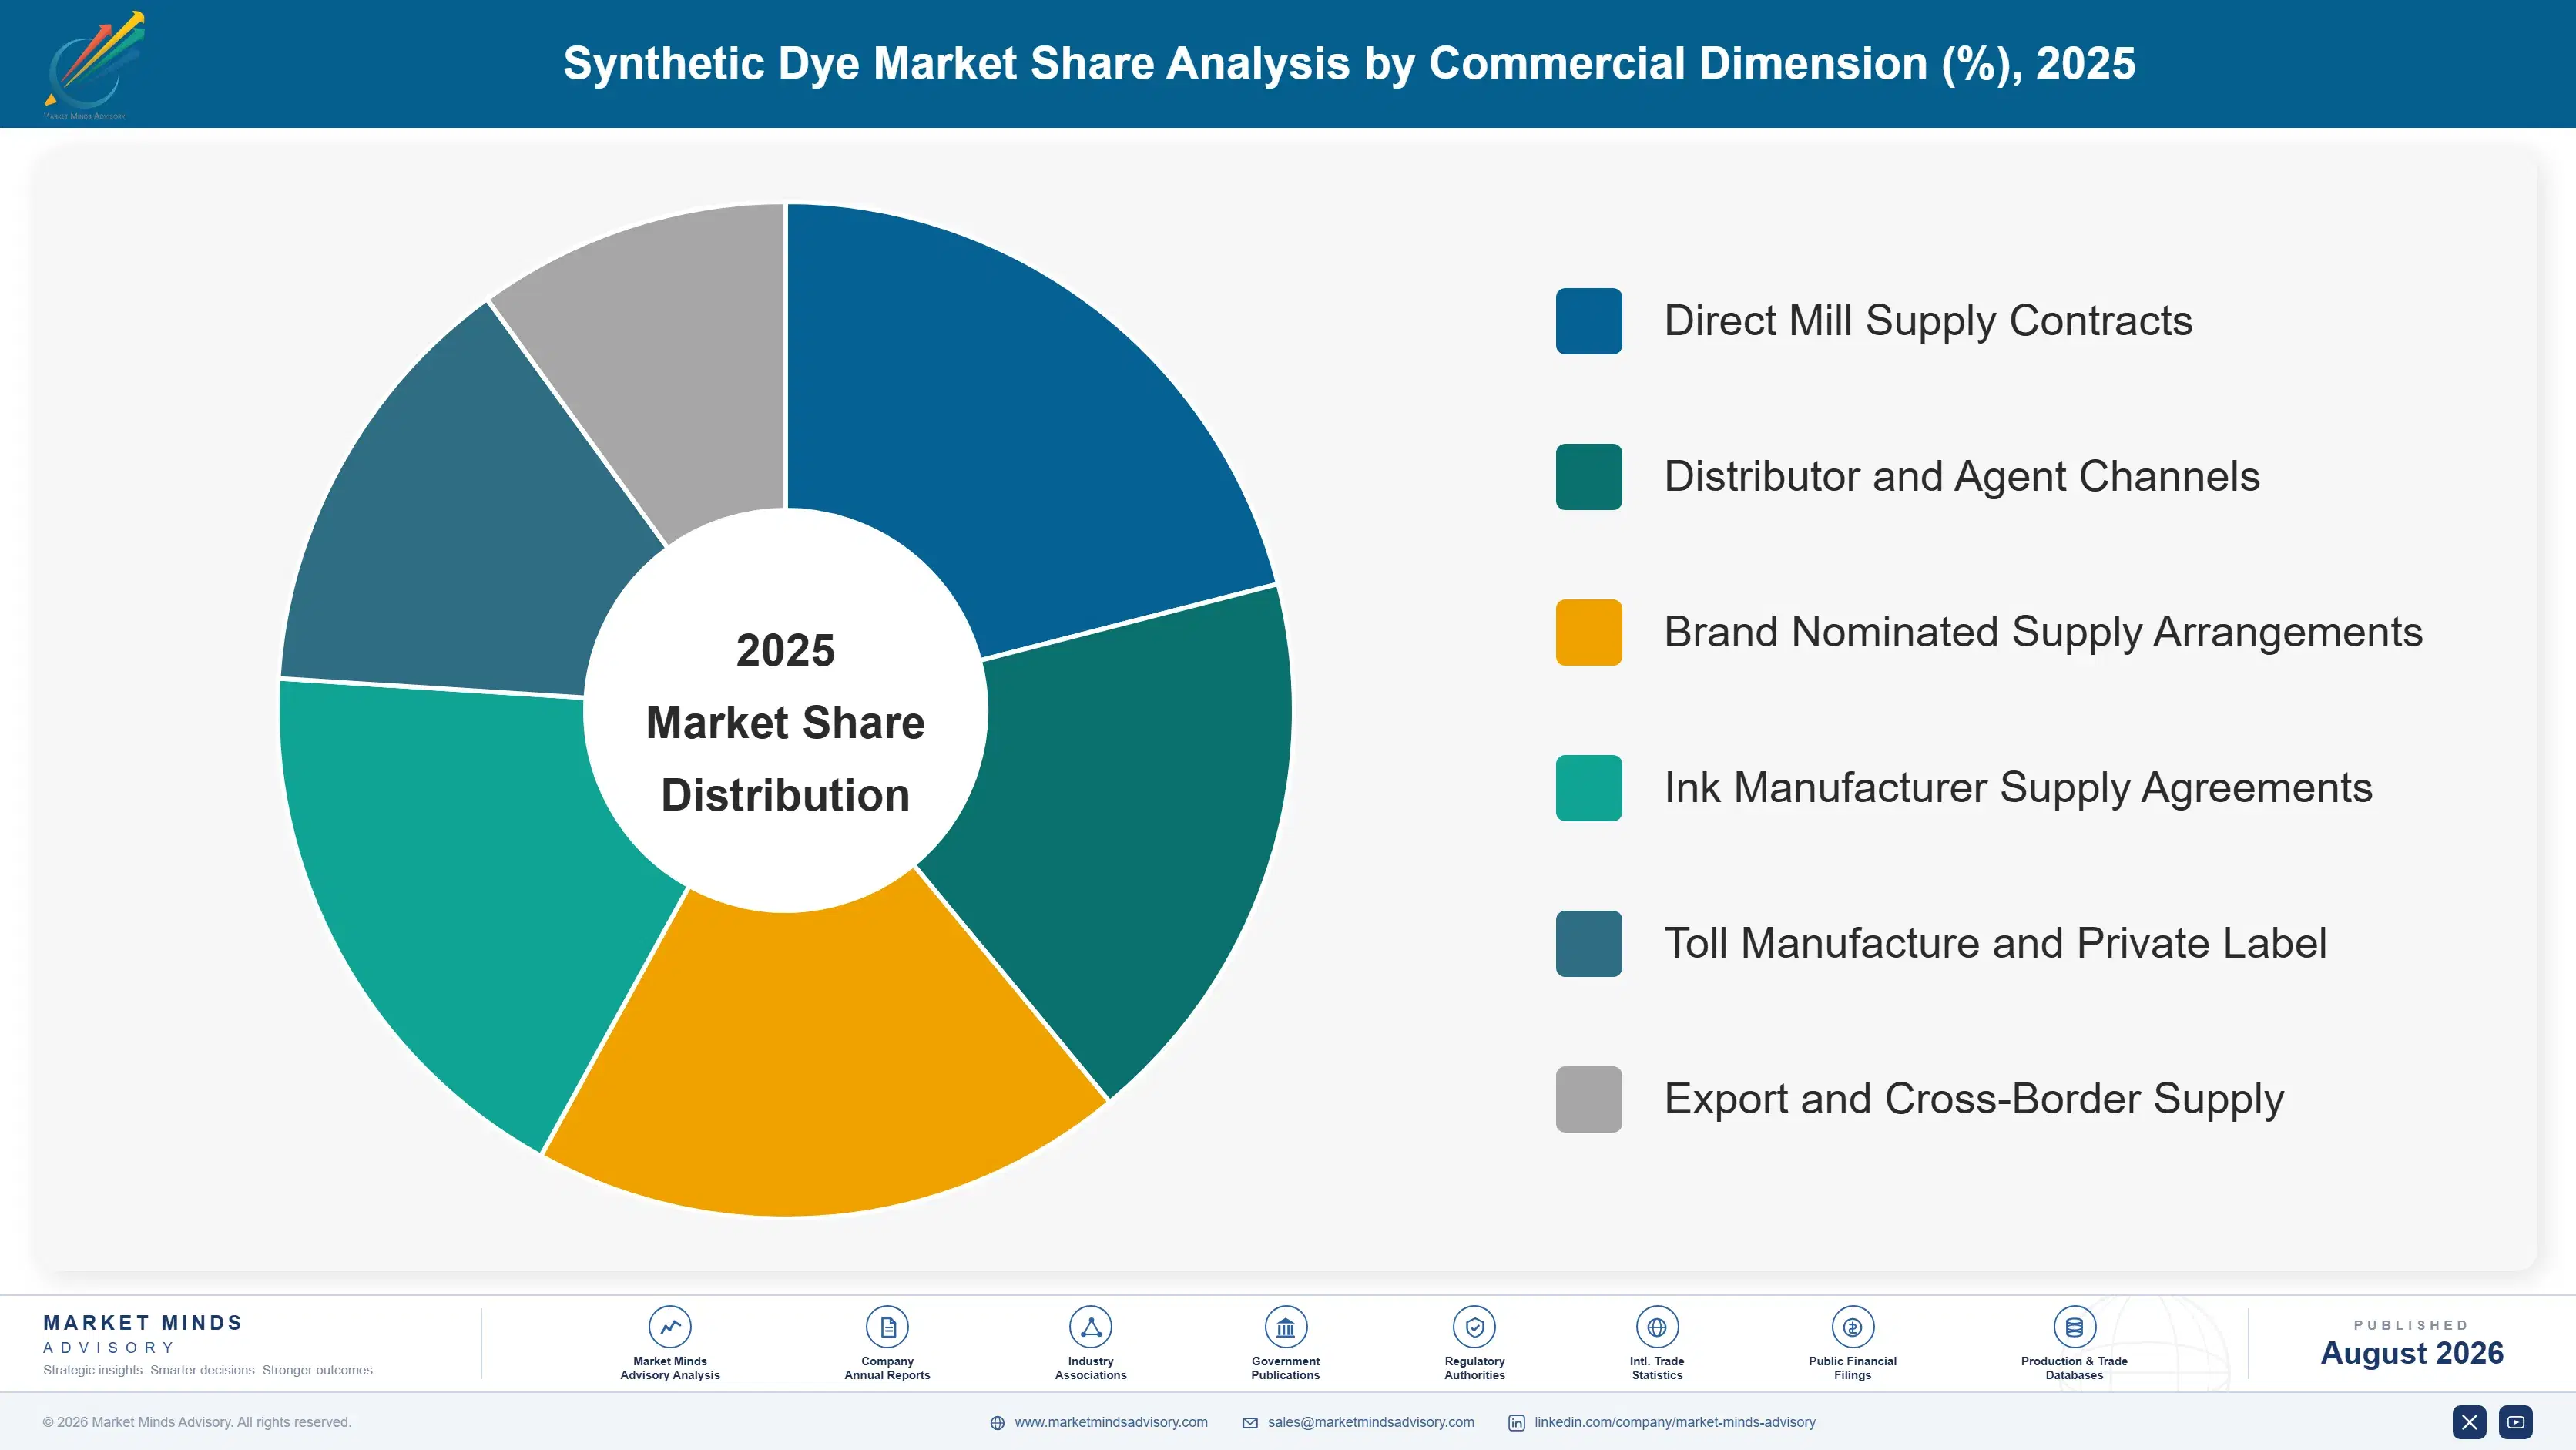
Six segments are split by dye class, because class determines the fibres that can be coloured, the application process and its water and salt requirements, the fixation efficiency achievable and the regulatory scrutiny the chemistry attracts. Shade and strength variants sit inside each class. Application method and channel are handled separately in the framework. Effluent burden differs by class too.
synthetic-dye-market-trends-market-share-analysis-1787639620052

Solvent and Specialty Industrial Dyes

Growing at 6.9%, half again the market rate of 4.6%, these dyes colour inks, plastics, coatings and increasingly digital textile printing systems where jetting stability rather than exhaustion behaviour decides performance. Particle size distribution, filtration and long-term stability in an ink formulation are demanding requirements that conventional textile grades do not meet. Volume per unit of output is lower than in drum dyeing and value per kilogram considerably higher. Qualification with ink and printer manufacturers takes far longer than any textile mill approval and holds correspondingly better afterwards. Volume growth follows printer installation rather than textile output, which makes this segment behave quite unlike the rest of the market. Ink formulation depth decides participation.
CAGR 6.9%

Reactive Dyes

At 5.6% reactive dyes colour cotton and cellulosic blends through covalent bonding, and they carry the industry's central commercial problem in that fixation runs near 68% while the remainder becomes coloured effluent requiring treatment. Conventional application also demands around 60 grams per litre of salt to drive exhaustion, which adds handling cost and a further discharge burden. Higher fixation and low-salt chemistries address both at higher list price, and their adoption tracks effluent regulation considerably more closely than it tracks any technical preference. Mills operating under zero liquid discharge requirements adopt these systems first, because dilution is no longer available to them and every kilogram of unfixed dye has to be removed from water they are recycling.
CAGR 5.6%
Full segment breakdown across 6 segments available in the complete report.

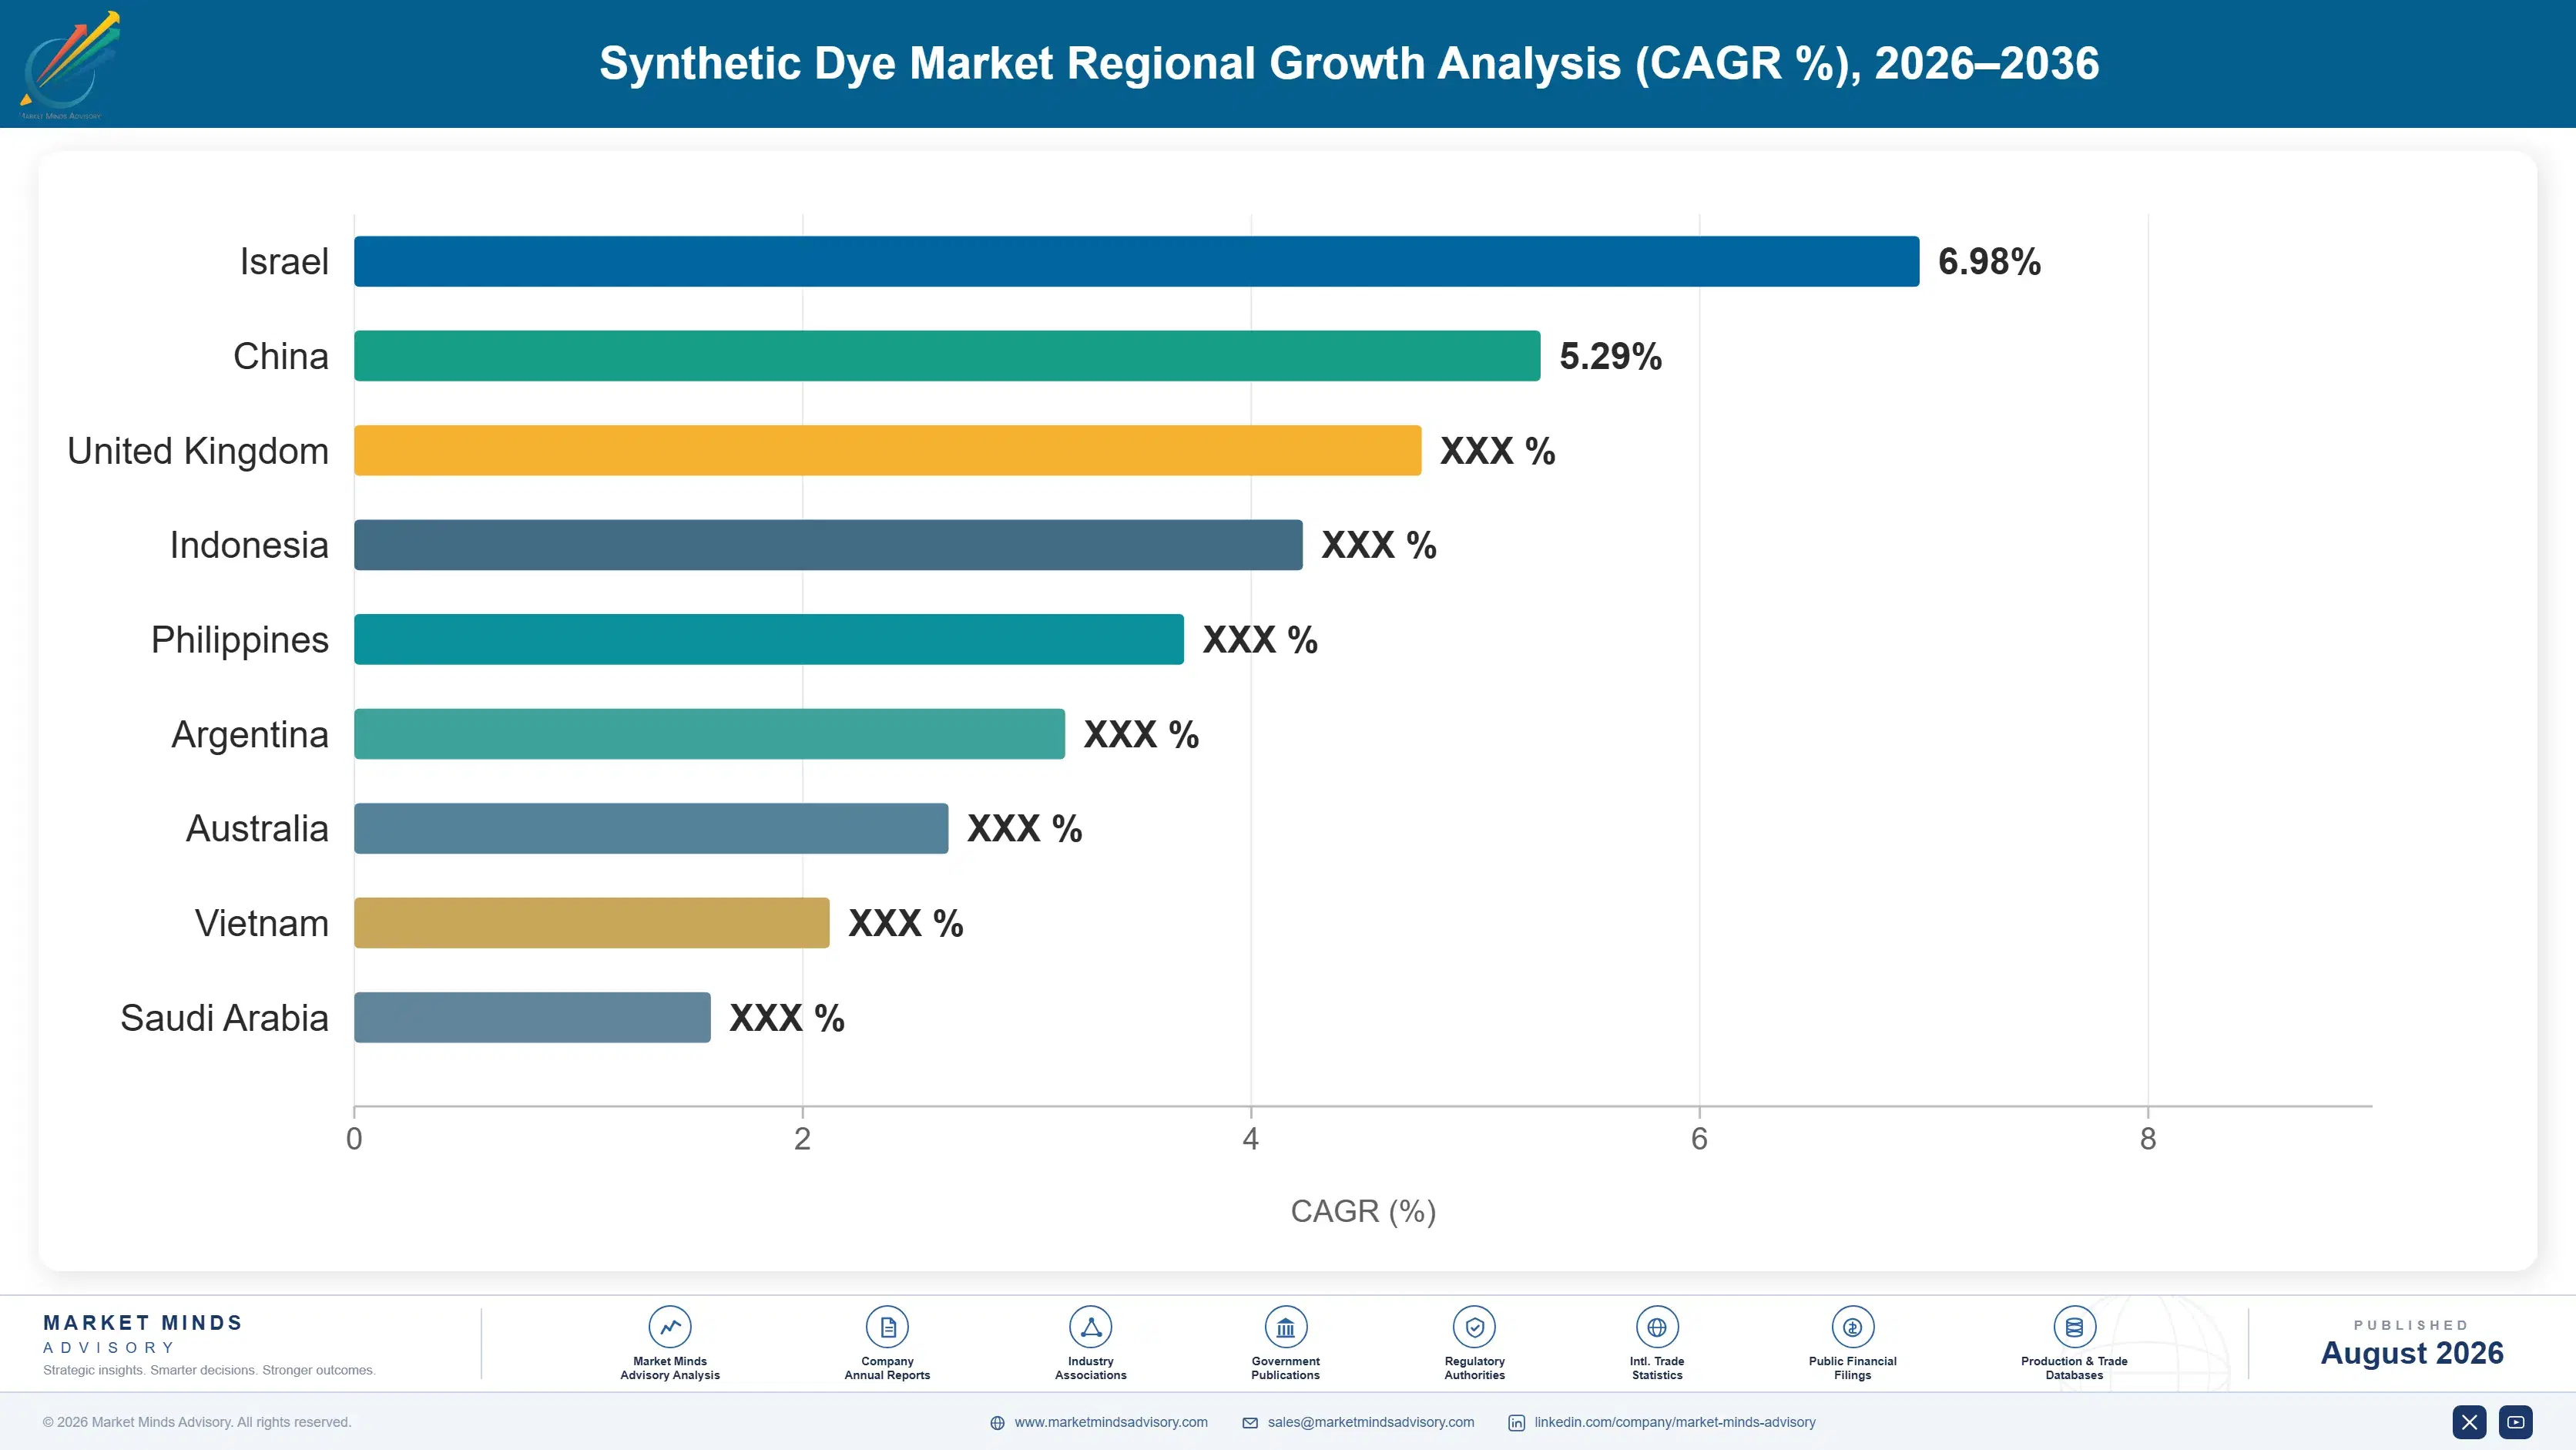
Regional Architecture and Country Demand Map

East Asia holds 38% of value, above the standard band, because Chinese production and consumption dominate this industry and textile manufacturing has relocated almost entirely into Asia over three decades. South Asia and Pacific also exceeds its band, while North America and Western Europe fall below theirs.

North America

Share sits at 12%, below the standard band, because textile dyeing has largely left the region and dye consumption follows mills rather than consumers. What remains concentrates in technical textiles, carpet, digital printing inks and industrial applications where specialty chemistry commands genuine premiums. Regulatory scrutiny of dye chemistry is demanding and restricted substance compliance is assumed rather than negotiated. Growth at 3.6% reflects specialty and digital applications expanding against a conventional textile base that continues shrinking slowly. Digital printing ink formulation is a genuine regional strength, and it commands qualification barriers that conventional textile supply has never had. Conventional textile dyeing volume continues declining slowly and will not return to the region at any point in the forecast.
Share: 12% | CAGR: 3.6% (2026 to 2036)

Western Europe

At 13% the share falls below the standard band for the same reason, since textile dyeing relocated to Asia over three decades and dye demand went with it. European producers retain strong positions in specialty chemistry, digital printing inks and technical applications rather than in conventional textile volume. Environmental regulation on dye manufacture and effluent is the strictest anywhere. Growth of 3.2% is the slowest anywhere across a specialised remaining base. Low-salt and high fixation systems were largely developed here, driven by regulation that arrived decades before it reached the manufacturing regions now adopting them. Application know-how rather than manufacturing scale is what European producers now sell, and it travels to Asian mills better than product does.
Share: 13% | CAGR: 3.2% (2026 to 2036)
Regional intelligence for 5 additional markets available in the complete report: East Asia, South Asia and Pacific, Latin America, Middle East and Africa, Eastern Europe. Contact sales@marketmindsadvisory.com.
synthetic-dye-market-trends-country-cagr-analysis-1787639620576

Four Moves the Effluent Plant Would Recognise

Purchasing buys on price per kilogram, environmental compliance pays for what never fixed, and the two departments rarely compare numbers. Every worthwhile move here connects those two budgets, escapes the Chinese intermediate exposure, or follows textile capacity to where it is actually being installed. All four are available to a producer of any size, and none requires new manufacturing capacity.

Sell against total dyehouse cost, not list price

Fixation near 68% means roughly a third of every kilogram becomes an effluent treatment cost, and salt loading around 60 grams per litre adds handling and discharge burden on top. A supplier modelling whole dyehouse cost including water, salt, energy and effluent reaches the argument that list price comparison cannot. It requires selling to two departments at once, which is uncomfortable and is exactly why competitors are not doing it. Mills operating under zero liquid discharge requirements do that arithmetic first, since dilution is not available to them at all.
Market Impact: Addresses the 32% of dye that never fixes

Qualify intermediates outside the concentrated jurisdiction

Around 78% of key intermediates come from one country whose provincial enforcement has repeatedly closed capacity without warning, and no buyer can hedge that exposure through any financial instrument. Qualifying Indian or other supply costs time and testing and buys genuine continuity. Producers who did that work before the last enforcement round shipped when competitors could not, which is worth considerably more than the qualification cost. Testing takes months and the continuity it buys shows up exactly when competitors cannot deliver, which is the only moment that genuinely matters commercially.
Market Impact: Reduces the 78% intermediate supply concentration risk directly

Build documentation capability as a market access asset

Manufacturing restricted substance lists exclude around 240 chemicals and compliance documentation has become a condition of supplying any mill working for a western brand. Producers who cannot document intermediates and process chemistry are excluded regardless of product quality. That documentation is administrative work rather than capital investment, and it opens the export mills that pay best while shutting out competitors who have not bothered. It is unglamorous administrative work that opens the highest paying mills in the industry, and competitors who have not done it are simply not on the list.
Market Impact: Clears all 240 of the excluded chemical entries

Follow mill installation rather than existing accounts

Bangladesh grows at 8.2% and dye consumption follows mill commissioning directly rather than with any lag, which means capacity announcements are a demand signal available a year or more ahead. New mills also qualify suppliers from scratch rather than displacing an incumbent, which is a far cheaper commercial entry than winning an established account anywhere. Very few producers track installation pipelines deliberately. Displacing an incumbent at an established mill costs considerably more than qualifying at a new one, and the pipeline of new mills is entirely public. Nobody else is watching it.
Market Impact: Follows 8.2% Bangladeshi demand growth in every year

Who Controls the Margin Pool

Participation is measured on annual dye production tonnage, and the top five hold 29%. Concentration is low because a long tail of Chinese and Indian producers competes on standard chemistry where formulation barriers are modest. Archroma and DyStar lead through application know-how and brand approval positions rather than through manufacturing scale, which sits mostly with Asian producers instead. The gap to challengers is compliance standing rather than production capability.
Competition runs on three fronts. Intermediate access and cost decide standard chemistry economics, where Chinese producers hold the advantage. Application support decides whether a mill achieves the fixation a dye is capable of. And compliance documentation decides access to mills serving western brands, which is where the pricing sits. Intermediate integration has become a fourth front, and it decides who survives an enforcement closure intact.

Pressure ahead comes from effluent regulation rewarding higher fixation chemistry, and from Indian intermediate capacity slowly reducing Chinese concentration. Expect application capable suppliers to gain where compliance costs bite hardest. Rankings shift on who converts effluent regulation into a commercial argument first. Concentration should stay low given how many producers compete.
synthetic-dye-market-trends-company-positioning-matrix-1787639621101

Competitive Moat and Risk Dimensions

ARCHROMA

Moat: Application expertise and brand approvals

Application know-how across mill processes combined with approval positions on brand restricted substance lists reaches the export mills that pay best and excludes producers who cannot document their chemistry. That combination takes years to assemble and is largely unrelated to manufacturing cost, which is where Asian competitors hold their own advantage instead.
ARCHROMA

Risk: Intermediate cost disadvantage

Purchasing intermediates from a market where around 78% of supply sits in one country leaves the business exposed to enforcement driven price spikes it cannot hedge, and to competitors who produce those intermediates themselves. That exposure is upstream rather than operational, and no application capability compensates for it during a supply shock.
ZHEJIANG LONGSHENG GROUP

Moat: Intermediate integration and scale

Integration back into dye intermediates removes the exposure that defines every non-integrated producer's cost structure and turns enforcement driven supply shocks into a competitive advantage rather than a crisis. Combined with manufacturing scale, that position cannot be answered by application capability or by any amount of formulation improvement from a competitor.
ZHEJIANG LONGSHENG GROUP

Risk: Environmental enforcement exposure

Producing intermediates within a jurisdiction where provincial environmental enforcement closes capacity at short notice means the same integration that provides cost advantage also concentrates operational risk. A closure affects the company's own production before it affects competitors buying on the open market from elsewhere. Enforcement timing is unpredictable.

Players Tracked

Prominent Players

Archroma
DyStar
Zhejiang Longsheng Group
Kiri Industries
Atul Ltd

Other Key Players

Runtu Co
Jihua Group
Everlight Chemical
Sumitomo Chemical
Nippon Kayaku
LANXESS
Clariant
BASF
Bodal Chemicals
Sudarshan Chemical
Colourtex Industries
Jay Chemical Industries
Aksharchem
Setas Kimya
Ohyoung Industrial

Recent Developments

MARCH 2026

Textile cluster tightens discharge colour limits under water regulation

A textile manufacturing cluster tightened effluent discharge colour limits and enforcement, making unfixed dye a direct compliance cost for mills rather than a diluted nuisance. Higher fixation chemistry moved from an optional upgrade to a practical requirement across affected dyehouses. Dilution was no longer available as a compliance route.
Signal: Regulation converts fixation rate from a technical specification into a purchasing criterion for every mill affected
SEPTEMBER 2025

Environmental enforcement closes dye intermediate capacity at short notice

Provincial environmental enforcement closed dye intermediate production capacity with limited warning, sending prices for affected chemistries up several fold within months. Producers holding qualified alternative supply continued shipping while competitors could not fulfil orders at all. Contracted volumes went unfilled across several suppliers. Alternative supply took months to qualify.
Signal: Intermediate concentration turns a policy decision anywhere into a supply crisis everywhere without any warning at all
DECEMBER 2025

Brand adds further chemistries to manufacturing restricted substance list

An apparel brand extended its manufacturing restricted substance list, requiring mills to document dye and intermediate chemistry across their supply chains. Producers unable to provide that documentation were removed from approved lists regardless of product performance. No explanation was given to the excluded suppliers. Product performance was never questioned.
Signal: Documentation rather than dye quality decides which producers reach brand approved mills and which do not

Intermediates, Energy and Effluent

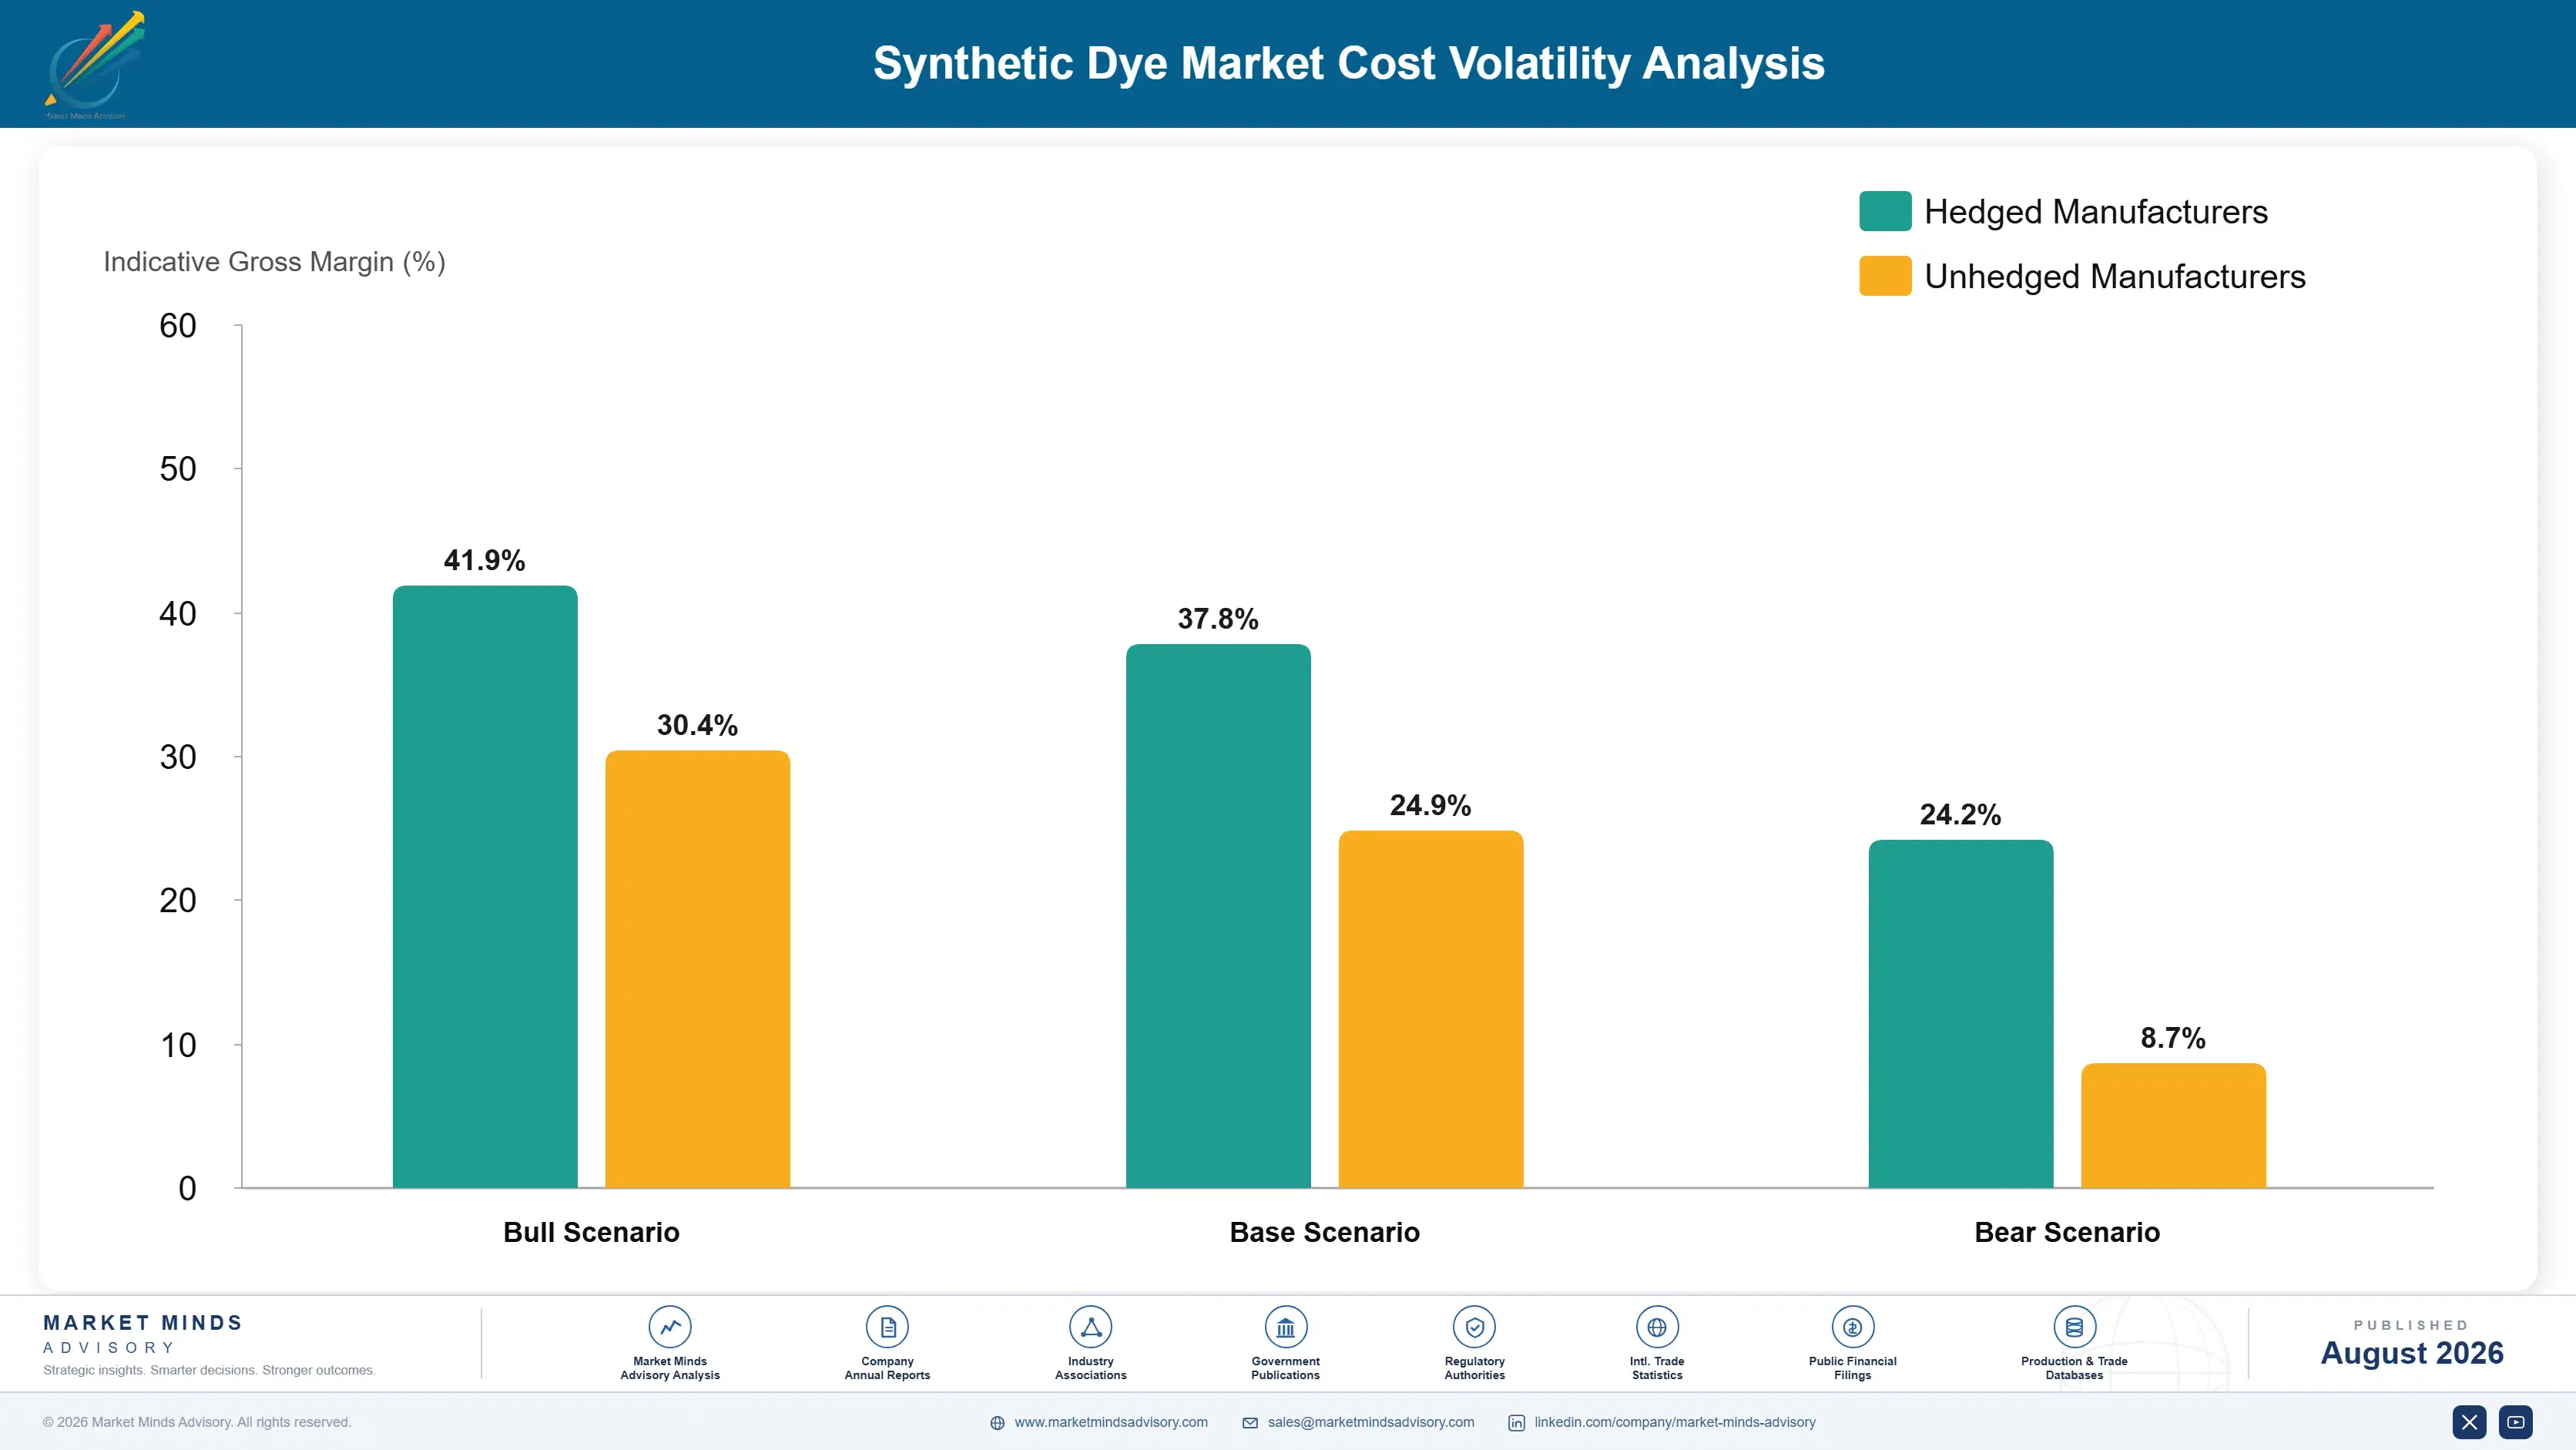
Dye intermediates including H-acid, vinyl sulphone and various naphthalene and benzene derivatives carry around 58% of production cost, with roughly 78% of that supply originating in one country. Energy for synthesis, filtration and drying takes about 16%. Salts, acids and process chemicals account for around 10%. Effluent treatment at the dye plant itself, packaging, testing and freight absorb the balance.
Chinese intermediate pricing moved several fold within months following environmental enforcement closures across recent years, per published chemical sector reporting and Zhejiang Longsheng and Kiri Industries annual reporting for 2025 on intermediate cost exposure. Non-integrated dye producers absorbed those movements in full, and several suspended supply on affected shades rather than sell at a loss into contracted volumes. Indexation clauses have become considerably more common in contracts since.

Exposure divides on integration and geography rather than on scale. An integrated Chinese producer holding its own intermediate capacity carries enforcement risk but not price risk. A non-integrated producer anywhere carries the full price movement on nearly 60% of cost. Indian producers sit between the two, with expanding domestic intermediate capacity that reduces but does not remove the exposure they carry.
synthetic-dye-market-trends-cost-volatility-analysis-1787639621301

Qualify intermediate supply outside the concentrated jurisdiction

Around 78% of key intermediates originate in one country whose enforcement decisions are unpredictable and unhedgeable through any financial instrument. Qualifying Indian or other supply costs testing time and buys genuine continuity, and producers who completed that work before the last enforcement round shipped when their competitors simply could not. Continuity is the whole return.

Integrate backward into critical intermediate chemistries

Intermediates carry nearly 60% of production cost and their pricing moves on regulatory decisions rather than on demand. Backward integration into the two or three intermediates that dominate a producer's portfolio converts the largest exposure into an operating position, though it also concentrates environmental compliance risk in the same place. The trade is genuinely difficult.

Index contracted dye pricing to intermediate cost movements

Fixed price supply agreements written before an enforcement closure leave a non-integrated producer selling below cost or defaulting, neither of which is acceptable commercially. Indexation clauses tied to published intermediate pricing move that risk to where it originates, and mills increasingly accept them once the concentration is set out plainly. Mills increasingly accept the logic.

Portfolio Architecture for Margin Defence

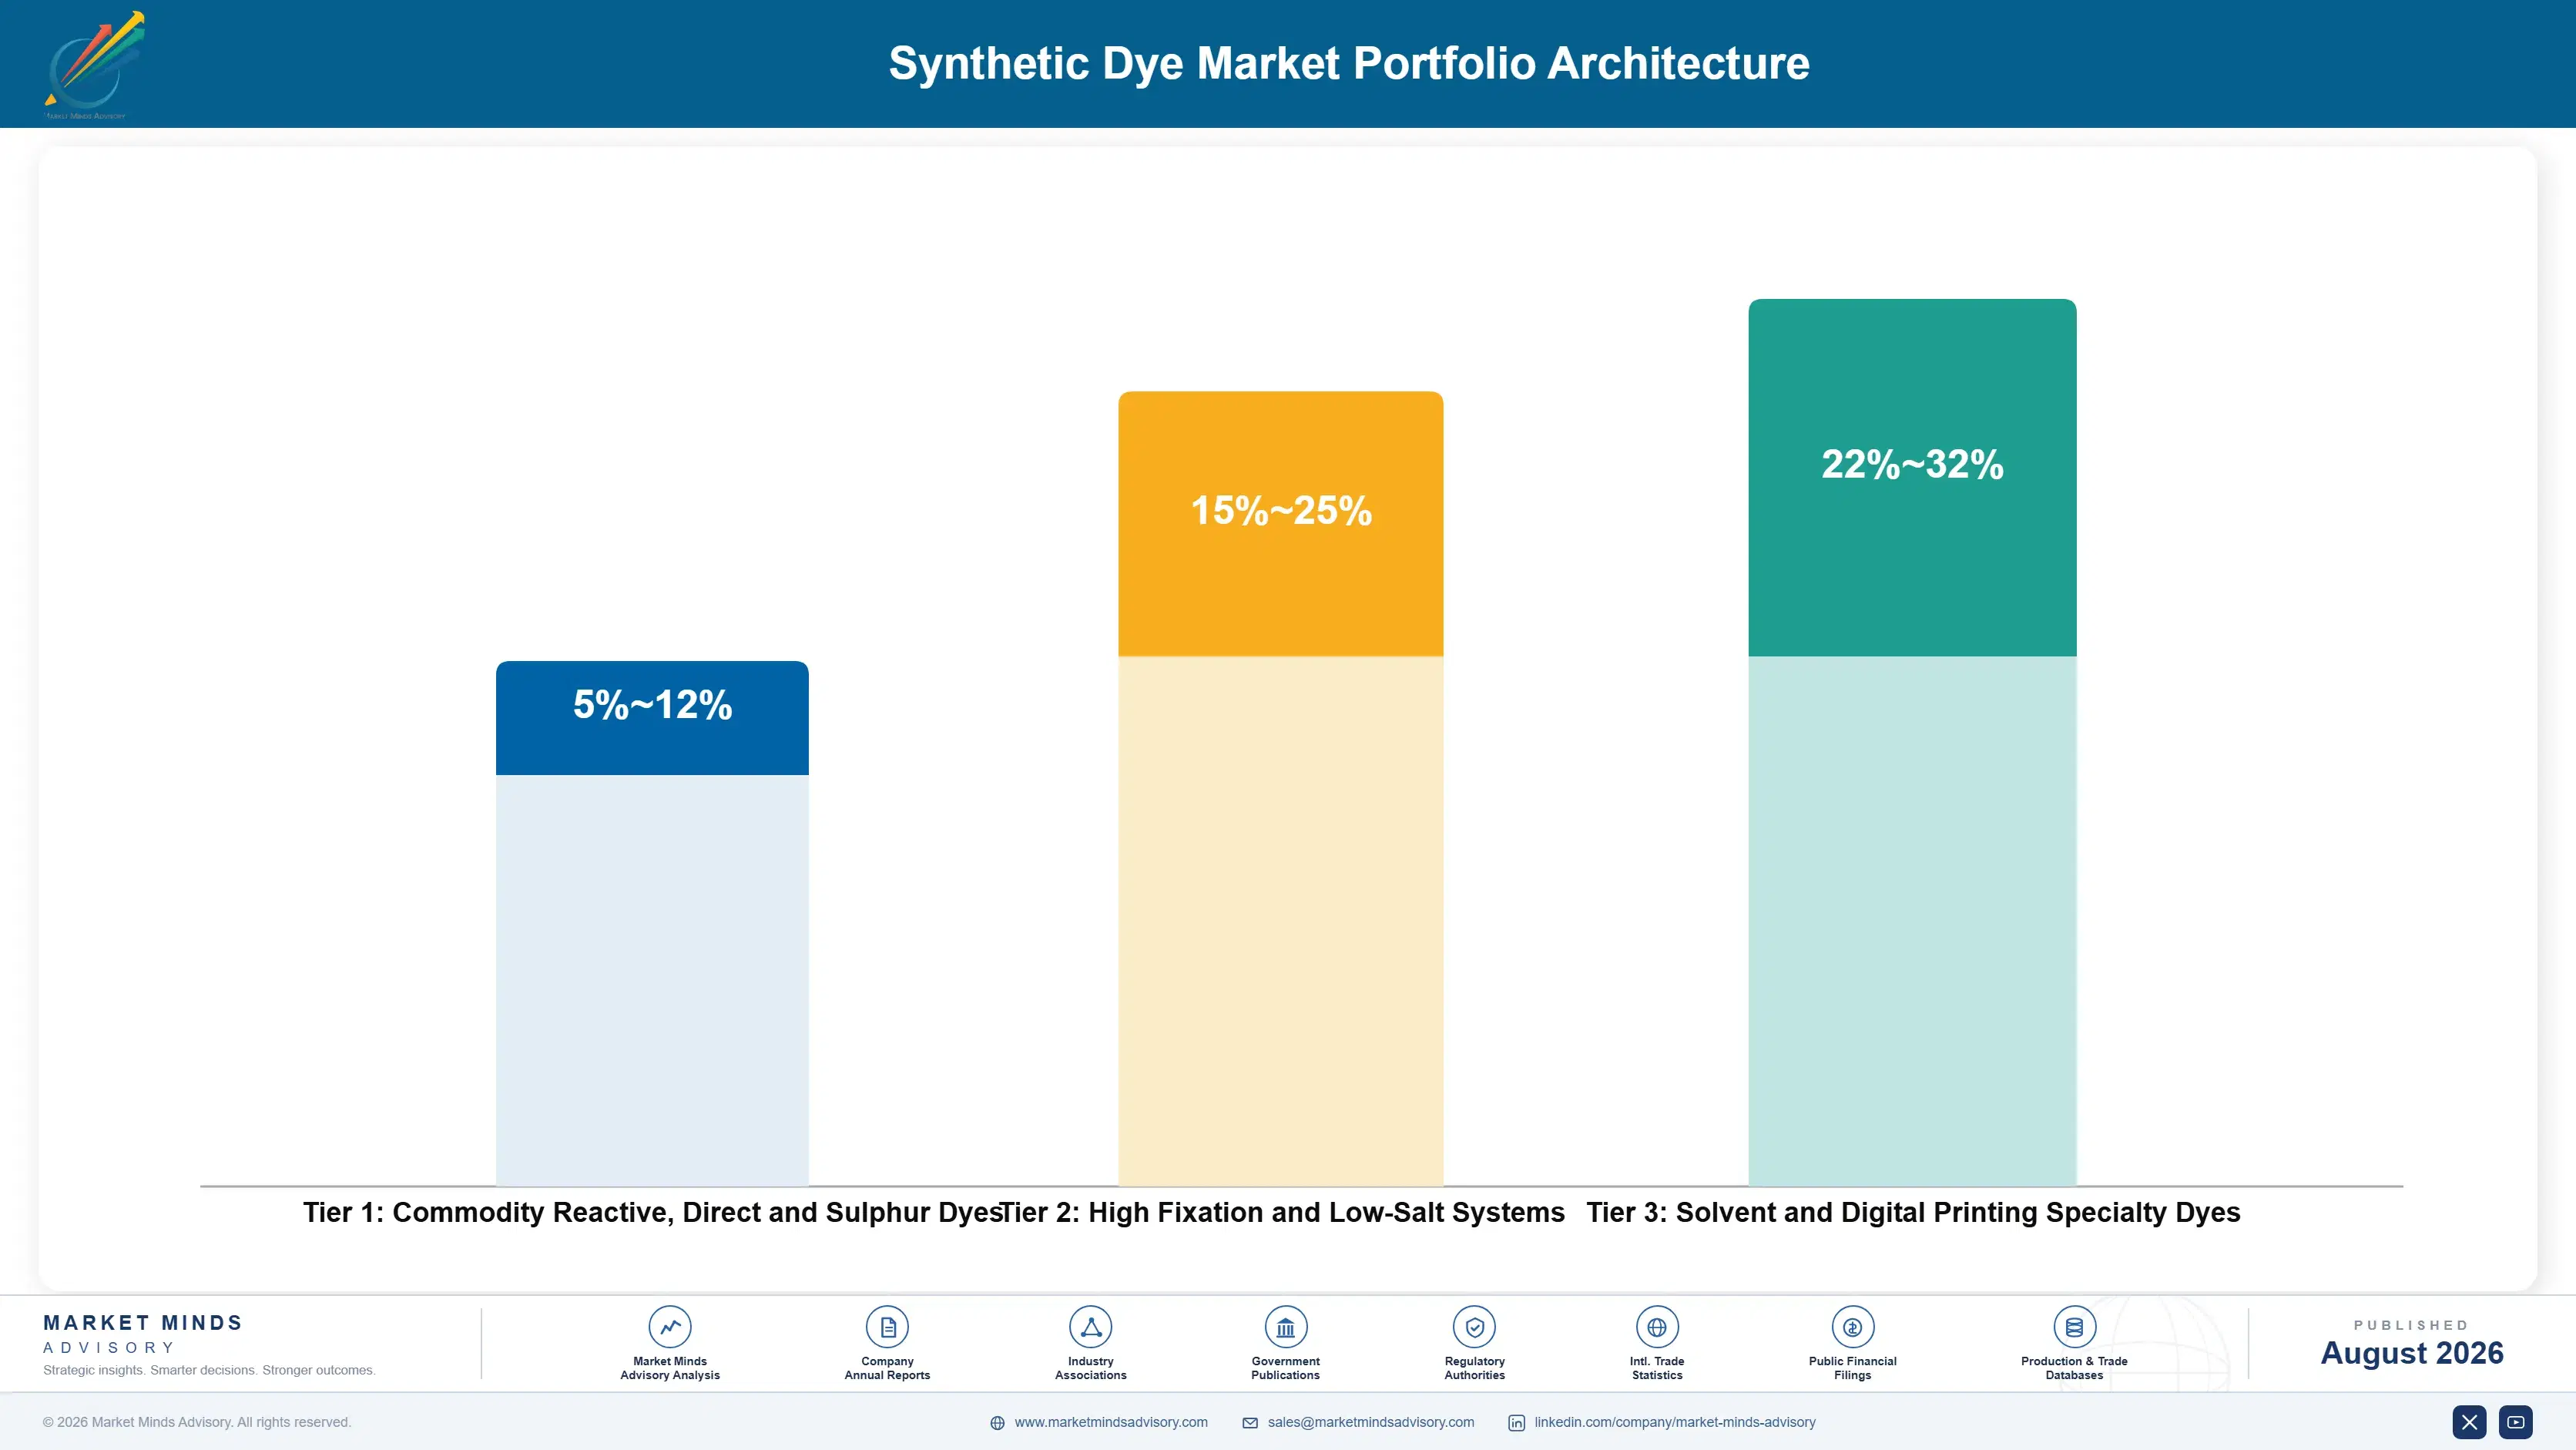
Margin here follows application support and compliance standing rather than dye chemistry, because standard shades are made by dozens of producers to identical specifications. Commodity reactive, direct and sulphur dyes earn margins in the mid single digits to low teens, where Chinese and Indian producers compete on delivered price and mills purchase on list comparison alone. Nothing else separates one producer from another there.
High fixation and low-salt reactive systems do better in the mid teens to mid twenties, because they solve an effluent problem that has a regulatory deadline attached, and the mills adopting them have generally done the whole dyehouse costing that justifies the higher list price they carry. Zero liquid discharge mills adopt first, since dilution is not available to them at any price.

Solvent and specialty dyes for digital printing hold the strongest position, reaching into the low thirties, where qualification with ink and printer manufacturers takes years and holds for years afterwards. Those margins reflect formulation capability and qualification depth rather than any advantage in intermediate access or manufacturing scale. Requalifying an ink formulation is expensive and slow, which protects the position considerably.

Commodity Reactive, Direct and Sulphur Dyes

Standard shades made to identical specifications by many producers and bought on delivered price. The seven point range reflects intermediate access and manufacturing scale rather than any difference a mill could observe.
Gross Margin: 5-12%

High Fixation and Low-Salt Systems

Chemistry that reduces effluent load and salt handling against a regulatory deadline. The ten point range reflects how binding local discharge rules are and whether the mill has modelled whole dyehouse cost properly.
Gross Margin: 15-25%

Solvent and Digital Printing Specialty Dyes

Dyes formulated for jetting stability and qualified with ink and printer manufacturers. The ten point range reflects qualification depth and how demanding the printing system requirements actually are in each application.
Gross Margin: 22-32%
synthetic-dye-market-trends-portfolio-architecture-1787639621797

High-value Sub-segments and Strategic Watch-out

Digital Printing Specialty Dyes

High value and the fastest growth at 6.9% on inkjet printing across textiles, packaging and decorative surfaces. Qualification with ink and printer makers takes years and holds correspondingly well afterwards. Volume follows printer installation rather than textile output. Qualification with printer manufacturers takes years to complete.
Gross Margin: 24-32%

High Fixation Reactive Systems

High value and growing as discharge colour limits near 150 units make unfixed dye a compliance cost. Adoption tracks effluent regulation considerably more closely than it tracks any technical preference. Zero liquid discharge mills adopt these systems first of all. Regulation rather than performance preference drives every adoption.
Gross Margin: 17-25%

Commodity Reactive and Direct Dyes

The volume core, made to identical specifications by dozens of producers and purchased on list price comparison where a third of the material never fixes to the fibre at all. Delivered price decides every order and always has. Roughly a third of the material never bonds to fibre.
Gross Margin: 5-12%

Intermediate Concentration Exposure

The strategic watch-out. Around 78% of key intermediates come from one jurisdiction whose enforcement closes capacity without warning, and the range reflects whether a producer has qualified alternative supply. Enforcement timing cannot be forecast by anybody. Alternative qualification is the only workable hedge available. Testing takes months.
Gross Margin: 3-30%

Two Budgets, One Dyehouse

Demand here is shaped by a split inside the customer rather than between customers. Purchasing buys dye against a price per kilogram and is measured on that number. Environmental compliance treats the third that never fixed as a treatment cost and is measured separately. Both work for the same mill, and the supplier who reaches only the first is arguing about the smaller half of the total. Connecting those two budgets is the entire commercial opportunity.
Stickiness follows qualification rather than satisfaction. Commodity shades reopen at every order because identical specifications are met by many producers. Brand approved positions hold as long as documentation stands, since removal from an approved list is far more disruptive than a price difference. Digital printing qualifications hold longest, because requalifying an ink formulation is expensive and slow.

The deciding voices have widened as compliance tightened. Mill purchasing once decided alone and now shares the decision with environmental managers facing discharge limits and with brand compliance teams auditing chemistry. A producer presenting a price list to purchasing is answering one of three parties, and generally the one least able to justify paying more for anything. Very few producers reach all three.
synthetic-dye-market-trends-end-use-penetration-index-1787639622289

Where We Would Put Effort

These are among the four positions where our research anticipates prominent divergence between winners and laggards over the coming forecast period. Each is grounded in the demand model, the regulatory perimeter, and the announced capacity pipeline.
01 / TOTAL COST SELLING

Talk to the effluent plant as well

Reactive fixation near 68% means roughly a third of every kilogram purchased becomes an effluent treatment cost, and salt loading around 60 grams per litre adds handling and discharge burden on top of it. A supplier that models whole dyehouse cost including water, salt, energy and effluent treatment reaches an argument that list price comparison simply cannot reach. It means selling to two departments at once, which is precisely why almost no competitor in this industry currently bothers to do it.
02 / INTERMEDIATE SUPPLY DIVERSIFICATION

One province can stop your shipments

Around 78% of key dye intermediates originate in a single country where provincial environmental enforcement has repeatedly closed capacity at very short notice and sent prices up several fold within a matter of months. No financial instrument hedges that exposure at all for anybody buying on the open market. Producers that had qualified alternative supply before the last enforcement round kept shipping while competitors defaulted, which is worth a great deal more than whatever the qualification testing originally cost them to complete.
03 / COMPLIANCE DOCUMENTATION INVESTMENT

Paperwork is the market access

Brand manufacturing restricted substance lists now exclude around 240 individual chemicals, and documentation of dye and intermediate chemistry has become a condition of supplying any mill working for a western brand at all. Producers who cannot provide it are excluded regardless of how good the dye itself happens to be on any measure. That documentation is purely administrative rather than capital work, and it opens the mills that pay best while shutting out competitors who have simply never bothered to complete it properly.
04 / INSTALLATION PIPELINE TRACKING

New mills qualify from scratch

Bangladesh grows fastest of any country at 8.2% and dye consumption follows mill commissioning directly rather than with any meaningful lag behind it. Capacity announcements are therefore a demand signal that arrives a year or more before any order is ever placed, and very few producers track those pipelines deliberately. New mills also qualify their suppliers from scratch rather than requiring any incumbent to be displaced first, which makes entry there considerably cheaper than winning an established account somewhere else.

Engagement Snapshot From the Field

A live engagement with an industry participant carrying material or product regulatory and market exposure ahead of a defining policy shift, showing how our research translates into a defensible multi-year portfolio strategy.
MARKET MINDS ADVISORY · CLIENT ENGAGEMENT SUMMARY
Synthetic Dye Producer Strategic Portfolio Review and Transition Roadmap 2026·Investment Scenario on Synthetic Dye Exposure Evaluation 2025-26
CLIENT PROFILE
An Indian dye producer manufacturing reactive and direct dyes for domestic and export textile mills, at annual revenue near 140 million dollars (client-reported, unverified by MMA). Intermediates were purchased almost entirely from Chinese suppliers and commercial effort was organised around delivered price per kilogram. Digital printing chemistry had never been attempted. Margins had compressed steadily.
STRATEGIC CHALLENGE
An enforcement driven intermediate price spike had forced the business to default on contracted volumes, damaging several customer relationships, and margins on standard shades had been compressing for years against larger producers. Both problems needed answering before the next investment cycle. An investment decision was due within months. Customers were already lost.
MMA APPROACH
MMA traced intermediate supply origin across the client's portfolio, modelled whole dyehouse cost at customer mills to test whether higher fixation chemistry could be sold on total cost, assessed brand restricted substance documentation requirements against the client's records, and sized digital printing dye opportunities. Interviews with 47 experts covered dye manufacture, textile processing and brand compliance auditing.
KEY FINDINGS
  1. Every intermediate the client purchased originated in the same Chinese province, which meant a single enforcement decision could and did halt production across the whole portfolio.
  2. Whole dyehouse cost modelling at three customer mills showed higher fixation chemistry reducing total operating cost, though purchasing at all three compared list prices alone.
  3. Restricted substance documentation was incomplete for several intermediates, which had already excluded the client from two brand approved mills without any explanation being given.
  4. Digital printing dye qualification was achievable within existing synthesis capability and reached margins roughly double those available on the client's standard reactive portfolio.
CLIENT PROFILE
An Indian dye producer manufacturing reactive and direct dyes for domestic and export textile mills, at annual revenue near 140 million dollars (client-reported, unverified by MMA). Intermediates were purchased almost entirely from Chinese suppliers and commercial effort was organised around delivered price per kilogram. Digital printing chemistry had never been attempted. Margins had compressed steadily.
STRATEGIC CHALLENGE
An enforcement driven intermediate price spike had forced the business to default on contracted volumes, damaging several customer relationships, and margins on standard shades had been compressing for years against larger producers. Both problems needed answering before the next investment cycle. An investment decision was due within months. Customers were already lost.
MMA APPROACH
MMA traced intermediate supply origin across the client's portfolio, modelled whole dyehouse cost at customer mills to test whether higher fixation chemistry could be sold on total cost, assessed brand restricted substance documentation requirements against the client's records, and sized digital printing dye opportunities. Interviews with 47 experts covered dye manufacture, textile processing and brand compliance auditing.
KEY FINDINGS
  1. Every intermediate the client purchased originated in the same Chinese province, which meant a single enforcement decision could and did halt production across the whole portfolio.
  2. Whole dyehouse cost modelling at three customer mills showed higher fixation chemistry reducing total operating cost, though purchasing at all three compared list prices alone.
  3. Restricted substance documentation was incomplete for several intermediates, which had already excluded the client from two brand approved mills without any explanation being given.
  4. Digital printing dye qualification was achievable within existing synthesis capability and reached margins roughly double those available on the client's standard reactive portfolio.
RECOMMENDED STRATEGY
Phase 1: Phase one: qualify domestic intermediate supply for the highest volume chemistries, accepting cost and testing time to buy genuine supply continuity. Phase 2: Phase two: build whole dyehouse cost modelling into the commercial approach, selling to environmental managers alongside purchasing at customer mills. Phase 3: Phase three: complete restricted substance documentation, which is administrative work that currently excludes the business from brand approved mills. It costs almost nothing.
OUTCOME
The producer qualified two domestic intermediate sources during 2026 and completed restricted substance documentation across its portfolio (client-reported, unverified by MMA). Whole dyehouse selling was piloted at four mills, and digital printing dye development was approved for the following year. Standard shade promotion was reduced across the same period.

Frequently Asked Questions

Foundational context covering the market sizes, CAGR, scope, country, region and competition that inform every finding below. This section is provided to cover basics and most often pre-purchase conversations, answered from the MMA Primary Research Dataset.

What is the current size of the Synthetic Dye Market?

MMA sizes it at USD 8.6 billion in 2025, rising to USD 9.00 billion in 2026. The figure covers synthetic organic dyes for textiles and industrial substrates at producer selling value.

How large will the Synthetic Dye Market be by 2036?

USD 14.11 billion by 2036, an incremental USD 5.11 billion over the 2026 base and an expansion multiple of 1.57 times. Specialty dyes account for a disproportionate share of that.

What is the CAGR for the Synthetic Dye Market 2026 to 2036?

4.6% in the base case, with a bull case at 5.8% and a bear case at 3.4%. The spread turns on effluent regulation repricing fixation against Chinese intermediate overcapacity returning.

Which segment is growing fastest?

Solvent and specialty industrial dyes at 6.9%, half again the market rate of 4.6%. Digital inkjet printing across textiles, packaging and decorative surfaces drives that demand.

Who are the major companies in the Synthetic Dye Market?

Archroma, DyStar, Zhejiang Longsheng Group, Kiri Industries and Atul Ltd lead on production tonnage. Fifteen further participants are profiled in the full report on that basis.

Which country is growing fastest?

Bangladesh at 8.2%, as knitted and woven export capacity expands faster than anywhere and dye consumption follows mill commissioning directly rather than with any lag.

Report Segmentation Architecture

The full report scope spans multiple orthogonal segmentation dimensions, with cross-tabulated demand data provided for each dimension pair. Coverage extends further to regional breakdowns, trend trajectories, and the competitive detail needed to support segment-level decision-making.

By Dye Class

  • Reactive Dyes
  • Disperse Dyes
  • Acid Dyes
  • Vat and Sulphur Dyes
  • Solvent and Specialty Industrial Dyes
  • Direct, Basic and Other Classes

By End-Use Industry

  • Apparel and Fashion Textiles
  • Home and Technical Textiles
  • Digital Printing and Inks
  • Leather and Footwear
  • Paper and Packaging
  • Plastics and Coatings

By Commercial Dimension

  • Direct Mill Supply Contracts
  • Distributor and Agent Channels
  • Brand Nominated Supply Arrangements
  • Ink Manufacturer Supply Agreements
  • Toll Manufacture and Private Label
  • Export and Cross-Border Supply

By Region

  • North America
  • Western Europe
  • East Asia
  • South Asia and Pacific
  • Latin America
  • Middle East and Africa
  • Eastern Europe

Scope, Methodology, and Coverage

Every figure in this report is reproducible from documented input assumptions. The scope below maps the historical period, the forecast horizon, the segmentation dimensions, and the countries covered, alongside the underlying primary and qualitative methodology.
Historical Period
2020 to 2025
Forecast Period
2026 to 2036
Base Year
2025 (USD billions; MMA Primary Research Dataset, August 2026)
Market Definition
Synthetic organic dyes supplied for colouring textiles and other industrial substrates, covering reactive dyes, disperse dyes, acid dyes, vat and sulphur dyes, solvent and specialty industrial dyes, and direct, basic and other classes. Measured at producer selling value. Food, drug and cosmetic colourants, inorganic and organic pigments, natural dyes, optical brighteners, and textile auxiliaries or finishing chemicals sold separately are excluded from scope.
Quantitative Units
USD billions (current prices); thousand tonnes produced; USD per kilogram by dye class
Segmentation Dimensions
Dye class; end-use industry; commercial dimension; region
Regions Covered
North America, Western Europe, East Asia, South Asia and Pacific, Latin America, Middle East and Africa, Eastern Europe
Countries Covered
China, India, Bangladesh, Vietnam, Indonesia, Pakistan, Turkey, Egypt, Ethiopia, Germany, Italy, Spain, United Kingdom, United States, Mexico, Brazil, Colombia, Japan, South Korea, Poland
Key Companies Profiled
Archroma, DyStar, Zhejiang Longsheng Group, Kiri Industries, Atul Ltd, Runtu Co, Jihua Group, Everlight Chemical, Sumitomo Chemical, Nippon Kayaku, LANXESS, Clariant, BASF, Bodal Chemicals, Sudarshan Chemical, Colourtex Industries, Jay Chemical Industries, Aksharchem, Setas Kimya, Ohyoung Industrial
Quantitative Methodology
Primary survey, n=3,800 respondents, Q4 2025, six countries; demand-side model with trade association cross-validation
Qualitative Methodology
47 expert interviews, Q4 2025; applied to validate demand model assumptions, identify emerging dynamics, and assess competitive positioning
Report Format
PDF and XLSX data workbook (Word format preview document)
Publisher
Market Minds Advisory
Report Code
MMA-2026-CHM-142
Published
August 2026
Contact
sales@marketmindsadvisory.com | www.marketmindsadvisory.com

Purchase the full Synthetic Dye Market Report (2026 to 2036).

The full report reframes dye purchasing around cost per fixed kilogram rather than price per kilogram, because roughly a third of reactive dye never bonds and becomes an effluent cost the same mill pays separately. It sizes all six dye classes independently through 2036, traces intermediate supply concentration and enforcement risk by chemistry, and models whole dyehouse cost against list price comparison. Regional chapters cover all seven regions with production separated from consumption throughout. Competitive profiling covers 20 participants on one consistent tonnage basis. Enforcement history is documented by chemistry throughout.
Six dye classes sized independently through 2036
Cost per fixed kilogram modelled against conventional list pricing
Intermediate supply concentration traced by chemistry and jurisdiction
Effluent regulation mapped against textile cluster by region
Restricted substance list requirements assessed by producer capability
Twenty participants profiled on one consistent production tonnage basis

Built For The People Who Decide

From boardroom strategy to bench-side execution, this report is read cover-to-cover by leaders shaping the next decade of their industry, turning demand scenarios, market dynamics and valuation benchmarks into decisions.
CXOs/ Presidents/ VPs/ Managers
M&A and Corporate Development
Strategy Teams and R&D Heads
Procurement and Product Directors
Regulatory and Compliance Leaders
Investor Relations and Equity Analysts