Market Minds Advisory
Synbiotic Blend Market

Synbiotic Blend Market: Synbiotic Blend Market. Strain and Substrate Pairing, Evidence Gaps and Formulation Cost

Synbiotic blends pair live strains with fibres that feed them, promising stronger gut effects, yet survival in storage, thin pair-specific evidence and formulation cost keep premium pricing dependent on proof and stable delivery formats.

Lead Analyst

Published

September 2026

Make Smarter Decisions with Customized Research Insights

Request a free sample report and evaluate market opportunities, growth trends, and competitive dynamics relevant to your business needs.

2025 MARKET VALUE$2.2BMarket Size 2025
2036 FORECAST VALUE$6.6BBase Case , 2026 to 2036
CAGR 2026 TO 203610.5 %Bull 11.8% / Bear 9.2%
INCREMENTAL OPPORTUNITY$4.2BNet 10- year value creation
EXPANSION MULTIPLE2.71x2036 value over 2026 base
Strategic Levers
M&A Pipeline
Regional Outlook
Country Rankings
Competitive Intelligence
Segmental Deep-dive
Call-Us : 91 93563 13602

Executive Snapshot and Market Trajectory.

Synbiotic blends combine live probiotic strains with prebiotic fibres chosen to feed them, and brands sell the pair as a stronger gut solution than either part alone. The idea is sound, but proof that a specific pairing beats its parts is thin, and stability in storage limits real-world delivery.
Metabolic and Weight Management Synbiotics grow fastest as brands add fibres and strains to appetite, glucose and body composition products, while digestive health blends still carry the largest volume. East Asia holds the largest share because infant formula, Japanese fermented drinks and Chinese supplement demand use synbiotic pairings widely, with North America and Western Europe next on supplement and clinical demand. Evidence decides pricing.
Competition is moderately concentrated, with global culture and ingredient houses, dairy groups and specialty supplement brands competing on strain evidence, substrate choice and delivery format. Definitions from the scientific community, health claim rules that treat probiotics and prebiotics separately and stability requirements shape entry, and buyers audit strain viability, fibre dose and packaging protection before they sign annual supply agreements for new blends. Compliance cost favours larger culture houses. Dossiers take years.
Market Definition
The market covers global sales of synbiotic blends, defined as mixtures of live microorganisms and substrates selectively used by host microorganisms, sold as ingredients, supplements, infant and clinical nutrition, and functional foods and drinks. It excludes probiotics without a paired substrate, prebiotic fibres sold alone, postbiotic and heat-killed preparations, and fermented foods where microbes and fibre arise only as by-products of fermentation.
Base Year Value
$2.2B in 2025 (MMA Primary Research Dataset, September 2026)
Forecast Period
2026 to 2036, eleven discrete annual values
CAGR
10.5% base case. Bull 11.8%. Bear 9.2%.
Fastest Growth Segment
Metabolic and Weight Management Synbiotics: 14.7% CAGR
Fastest Growth Country
India: 13.0% CAGR
Fastest Growth Region
South Asia and Pacific: 12.6% CAGR
Largest Region
East Asia: 34% of 2025 global value
Market Leaders
Novonesis, IFF, DSM-Firmenich, Danone, Nestlé Health Science. Source: MMA Analysis, company annual reports.
Primary Survey
n=3,800 procurement and R&D decision-makers, Q4 2025, six countries
Methodology
Demand-side build-up, cross-validated against public data, 47 expert interviews

Synbiotic Blend Market Forecast Scenarios

synbiotic-blend-market-size-forecast-scenario-1789964243697
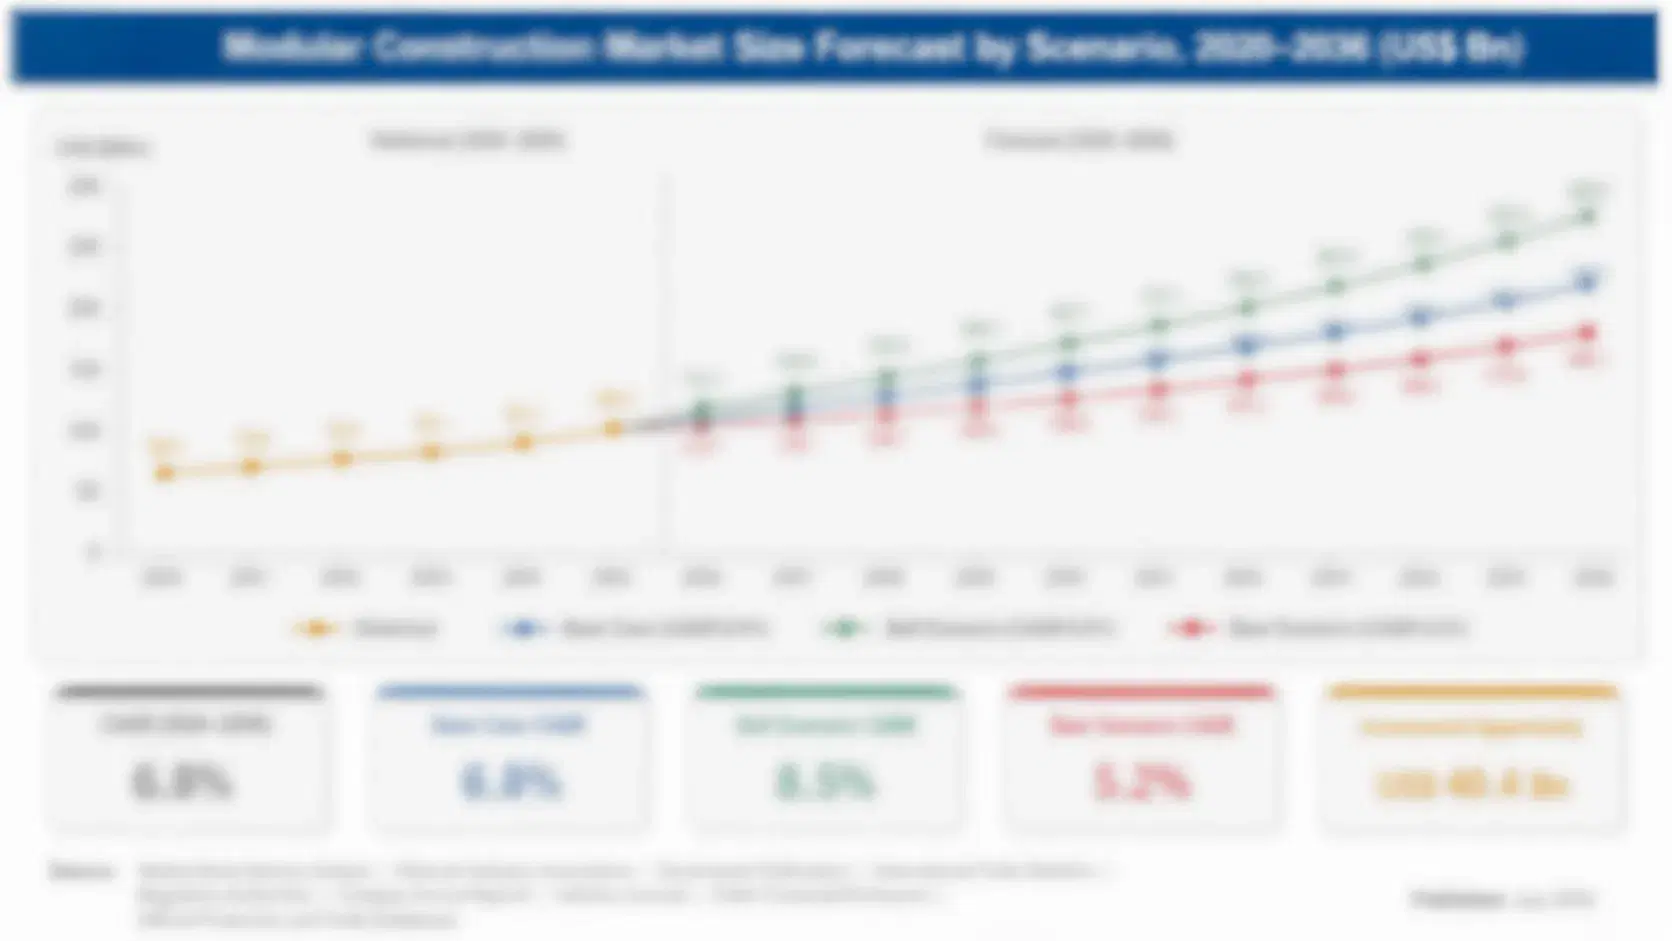
Between 2020 and 2025 the market grew at about 9.5% a year, supported by pandemic interest in immune and gut health, wider use of synbiotic infant formulas and the launch of premium supplement lines that pair strains with fibres. Growth slowed in 2023 when consumer spending tightened and retailers cut slow-selling probiotic lines. Convenience formats such as gummies and sachets gained share.
The base case rests on three commercial mechanisms. First, brands move from single-strain probiotics toward blends that promise targeted effects, using prebiotic fibres to support survival and colonisation. Second, better encapsulation and packaging improve strain survival and let brands make credible shelf-life claims. Third, clinical trials in digestive, metabolic and infant health support premium pricing. Producers plan strains, fibres and stability programmes around these drivers, and buyers reward transparent labels.
The bull case reaches 11.8% if larger trials show that specific strain and substrate pairs outperform probiotics alone and regulators recognise synbiotic claims. The bear case falls to 9.2% if trials show no added benefit, consumers tire of complex blends and price sensitivity favours simple probiotics. Both cases assume stable ingredient supply and no new tariffs, and neither assumes a major regulatory shift.

Pair-Specific Evidence, Survival in Storage and Fibre Tolerance Set Synbiotic Returns

Synbiotics sit at the meeting point of two large ingredient categories. A probiotic supplies live strains, a prebiotic supplies the fibre those strains prefer, and the synbiotic blend combines them in one product. The scientific community distinguishes complementary blends, where each part works on its own, from synergistic ones, where the substrate is chosen for the strain, and the second type carries the strongest premium.
MARKET CONCENTRATION34% CR5Top five suppliers hold about a third of ingredient sales
TYPICAL FIBRE DOSE1-5 gCommon prebiotic fibre quantity paired with strains per serving
PROBIOTIC DOSE1-20 billion CFUCommon live cell count range in synbiotic servings
INFANT FORMULA SHARE22%Portion of synbiotic value sold through infant and toddler nutrition
CULTURE AND FIBRE COST40% of COGSStrains and prebiotic fibres within total production cost
CONTRACT LENGTH1-2 yearsTypical supply agreement term for global supplement customers
Value pools sit in three places. Infant and toddler nutrition uses prebiotic oligosaccharides with selected strains and pays for clinical evidence and safety. Adult digestive and immune supplements give the largest volume, sold as capsules, sachets and gummies. Metabolic, women's health and clinical nutrition add newer pools where trials and practitioner channels support higher prices, though each pool needs its own evidence and claim wording across regions.
Supply is layered. A few culture houses own strain libraries and fermentation, fibre suppliers in Europe and Asia make inulin, oligosaccharides and resistant starch, and contract manufacturers blend and package. Stability is the hard part, because moisture, heat and oxygen kill live cells, so blister packs, sachets and desiccant systems matter. Buyers hold two to three months of stock, and qualification of a new pair takes many months.
"A synbiotic is a marketing idea with a real science underneath it, and the industry keeps confusing the two. Adding fibre to a probiotic is easy. Showing the pair works better than the parts is expensive, which is why proof will be the moat."
Senior Analyst, Microbiome and Digestive Health Ingredients Practice · MMA Synbiotic Blends Practice · September 2026

Market Trends

Metabolic Positioning Draws Strain and Fibre Pairs Into New Categories

Brands now pair strains such as Lactobacillus and Bifidobacterium with inulin, resistant starch and galactooligosaccharides for appetite, glucose and body composition support, and early trials report modest effects on weight and metabolic markers. Metabolic and Weight Management Synbiotics grow about 14.7% a year, and gross margins run 52% to 68%. The trend needs larger placebo-controlled studies, honest wording and fibre doses that do not cause discomfort, and it rewards suppliers that fund academic collaborations, publish pair-specific data and give brand owners compliant claim summaries that avoid promising weight loss. Retail interest is growing.
Market Impact: newborn trial cut sepsis 40%

Encapsulation and Packaging Advances Improve Strain Survival in Blends

Microencapsulation, dry-cell coatings, blister packs and desiccant sachets protect live strains from moisture, heat and stomach acid, letting brands guarantee cell counts until expiry and use fibres that would otherwise absorb water. Women's Health Synbiotics grow about 12.6% a year, and gross margins run 48% to 65%. The trend needs stability data at 25 and 40 degrees Celsius, validated counts through shelf life and cost control, and it favours suppliers with application labs and packaging partners, while brand owners qualify one blend source per product and rarely switch after launch. Ambient formats widen distribution.
Market Impact: infant formula carries 22% of value

Market Opportunities and Growth Drivers

Clinical Trials in Infants and Digestive Disorders Support Synbiotic Credibility

A large trial of newborns in rural India, published in 2017, reported roughly 40% fewer cases of sepsis and death with a Lactobacillus plantarum and fructooligosaccharide synbiotic, and meta-analyses in infants and irritable bowel syndrome report modest benefits. Results vary by strain and fibre pair, but they keep clinicians and regulators engaged. The driver sustains investment and rewards suppliers that run multi-centre studies, publish pair-specific results and provide safety data, since infant formula makers and pharmacists require documented evidence before they list or recommend any new blend for vulnerable groups.
Market Impact: three-arm trials cost $3-8 million each

Infant Formula and Clinical Nutrition Adopt Synbiotics as Premium Standards

Infant formula makers in China, Europe and Japan add prebiotic oligosaccharides and selected probiotics to premium lines, and clinical nutrition companies add blends to products for older adults and patients. Infant formula carries about 22% of synbiotic value. The driver sustains large, stable volumes and rewards suppliers with pharmaceutical-grade quality systems, long safety records and regulatory files in each region, while hospitals and pharmacists influence choices and formula makers qualify suppliers for several years, which creates strong customer loyalty once approval is complete. Infant nutrition tenders renew every two to three years.
Market Impact: viability shortfalls reach 20-50% before expiry

Market Restraints and Challenges

Weak Pair Evidence Limits Premium Pricing and Claims

Many synbiotic trials compare the blend with placebo rather than with the probiotic or prebiotic alone, so they cannot show that the pair adds value, and regulators treat probiotic and prebiotic claims separately with no authorised synbiotic claim. The root cause is the cost of three-arm trials, which can reach $3 million to $8 million each. Brands must use cautious wording and price competes with cheaper single products. Suppliers respond with pair-specific studies and open data, though few can fund them alone and results take two to three years. Costs stay high.
Market Impact: metabolic synbiotics grow 14.7% yearly

Viability Loss and Fibre Intolerance Reduce Performance and Repeat Purchase

Live cells die in humid, warm storage, and fibres such as inulin absorb water and accelerate the loss, while higher fibre doses can cause gas and bloating. The root cause is the chemistry of live cultures and colon fermentation. Brands see recalls, complaints and returns, and viability shortfalls of 20% to 50% before expiry are reported in poorly packaged products. Producers respond with dry formats, blister packs, overages and gradual dose guidance, though these raise cost by 5% to 12% and complicate labels for consumers. Retailers penalise brands with recalls.
Market Impact: women's synbiotics grow 12.6% yearly
3 additional market trends, 2 additional growth drivers, and 4 additional restraints and challenges are covered in the full report. Contact sales@marketmindsadvisory.com to access the complete intelligence.

Segment CAGR and Growth Architecture

The global synbiotic blend market is segmented by health application, which shows where clinical evidence, delivery format and buyer trust create pricing power. Five segments cover metabolic and weight management, women's health, immune health, digestive health and infant and pediatric nutrition. Metabolic and women's health blends grow fastest, while digestive blends carry the largest volume.
synbiotic-blend-market-market-share-analysis-1789964243965

Metabolic and Weight Management Synbiotics

Metabolic and Weight Management Synbiotics is the fastest-growing segment at 14.7% a year, about 1.40 times the overall market rate, from a small base. Brands pair strains with inulin, resistant starch and oligosaccharides and sell them to buyers seeking appetite, glucose and body composition support, and gross margins of 52% to 68% support trial investment. Weight management brands, pharmacies and clinics form the core channels, and buyers accept higher prices when trials show measurable effects. Claims must avoid promising weight loss, and larger studies are needed, so suppliers with published pair-specific data and stable formats hold the strongest positions. Competition from drug-based weight management products shapes consumer expectations and retailer caution.
CAGR 14.7%

Women's Health Synbiotics

Women's Health Synbiotics grows at 12.6% a year, about 1.20 times the overall market rate, because vaginal, urinary and digestive comfort products use strains such as Lactobacillus crispatus, rhamnosus and reuteri with supporting fibres, and buyers accept gross margins of 48% to 65% for products with clinical support. Pharmacies, gynaecology practices and online channels carry the volume, and pregnancy and postnatal buyers add demand. Strain identity, viability and clear labelling matter most, and suppliers with clinical data, cautious claims and steady cold or ambient supply hold price better than sellers of generic mixtures. Women's interest in microbiome health grows steadily. Regulators watch claims closely. Pharmacists recommend proven brands to cautious buyers.
CAGR 12.6%
Full segment breakdown across 5 segments available in the complete report.

Regional Architecture and Country Demand Map

East Asia leads at 34% because infant formula, Japanese fermented drinks and Chinese supplement demand use synbiotic pairings widely, with North America at 26% on supplement and clinical demand. South Asia and Pacific grows fastest. Eastern Europe stays small on limited premium supplement demand. Growth is steady.

North America

North America holds 26% share, inside its band, with growth at the global rate of 10.5%. The United States leads through a large supplement market, pharmacy and practitioner channels and a strong clinical nutrition sector, with brands such as Seed Health, Renew Life and Culturelle selling blends with prebiotic fibres. The FDA dietary supplement framework allows structure and function wording, though disease claims are restricted. Gummies, sachets and powders grow fastest, private labels copy successful blends and subscription channels support repeat orders. Canada adds pharmacy and health store sales. Retailers cut shelf space for slow-selling probiotics, so brands need clear stories and strong reviews to keep listings and consumers. Amazon remains a key channel.
Share: 26% | CAGR: 10.5% (2026 to 2036)

Western Europe

Western Europe holds 22% share, inside its band, with growth of 8.9%, below the global rate. Denmark, France, Italy, Germany and the United Kingdom host culture houses, dairy groups and pharmacy brands, and Europe supplies much of the world's chicory fibre and oligosaccharides. European Union rules block health claims for probiotics and treat prebiotic claims narrowly, so brands use general wording and clinical dossiers. Pharmacies and health stores sell most products, and Belgium and the Netherlands host fibre processors. Sustainability rules and price sensitivity limit premiums, while infant formula makers and clinical nutrition companies adopt synbiotics steadily. Nordic and Italian buyers show strong interest in evidence-based blends. Contract packers in Poland serve regional brands.
Share: 22% | CAGR: 8.9% (2026 to 2036)
Regional intelligence for 5 additional markets available in the complete report: East Asia, South Asia and Pacific, Latin America, Middle East and Africa, Eastern Europe. Contact sales@marketmindsadvisory.com.
synbiotic-blend-market-country-cagr-analysis-1789964244295

Four Margin Routes for Synbiotic Producers

Margin in synbiotic blends comes from pair-specific evidence, stable delivery formats, infant and clinical accounts and application support rather than simple mixtures. The routes below apply to culture houses, fibre suppliers and brand owners, and each can start inside one planning cycle, with clear measures in gross margin points and viability at expiry. Payback runs two to three years.

Funding Three-Arm Trials That Prove Pairs Outperform Their Parts

Regulators and clinicians ask whether the pair beats the probiotic and the prebiotic alone, so suppliers that fund three-arm trials of 150 to 300 participants and publish pair-specific results can defend price premiums of 15% to 25% and win contracts worth 8% to 12% of sales. Trials cost $3 million to $8 million each. Suppliers should share costs with brand partners, register protocols publicly and choose one flagship pair first, since a single credible study does more for pricing than many weak ones. Results also shorten qualification with infant formula and clinical buyers.
Market Impact: three-arm pair-specific trials defend price premiums of 15-25%

Upgrading Encapsulation and Packaging to Guarantee Viable Cells Through Expiry

Viability shortfalls of 20% to 50% cause recalls and returns, so suppliers that invest in microencapsulation, blister packs and desiccant systems and validate counts through shelf life cut complaints and overage cost by 30% to 50% and win ambient distribution in warm markets. Programmes cost $2 million to $7 million. Suppliers should begin with flagship blends, run stability tests at 25 and 40 degrees Celsius and share data with brand owners, since buyers value guaranteed counts and rarely switch after qualification. Better stability also lowers cold chain cost and widens retail access.
Market Impact: packaging upgrades cut complaints and overage cost by 30-50%

Building Infant and Clinical Nutrition Accounts With Pharmaceutical-Grade Quality Systems

Infant formula and clinical nutrition buyers pay for pharmaceutical-grade quality, long safety records and full documentation, so suppliers that invest in audited plants, batch records and regulatory files win multi-year contracts and earn margins 10 to 15 points above supplement grade. Programmes cost $3 million to $10 million. Suppliers should begin with one plant certified for infant use, offer change-control agreements and hold stable stock of validated lots, since these customers value continuity over price and reward reliable suppliers with contracts that last three to five years and renew easily.
Market Impact: infant and clinical accounts earn margins 10-15 points higher

Optimising Fibre Sourcing and Tolerance Through Blended Prebiotic Systems

Inulin, galactooligosaccharides and resistant starch differ in cost, taste and tolerance, so suppliers that test blends, secure two fibre sources per blend and set doses that avoid bloating cut fibre cost by 8% to 15% and lift repeat purchase by five to nine points. Programmes cost $0.5 million to $2 million. Suppliers should run tolerance panels before launch, sign multi-year fibre contracts and share dose guidance with brands, since fibre supply depends on a few European and Asian processors and switching fibres after launch changes stability and claims. Fibre contracts also stabilise planning.
Market Impact: blended fibre systems lift repeat purchase by 5-9 points

Who Controls the Margin Pool

The global synbiotic blend market is moderately concentrated, with a CR5 of 34%, because strain libraries, clinical dossiers and stability know-how are hard to replicate. This assessment measures participants on estimated synbiotic ingredient and finished product sales value, held constant across all players. Novonesis and IFF lead through strain libraries and global reach, while DSM-Firmenich, Danone and Nestlé Health Science follow, and the gap between the leader and the fifth player is moderate.
Competition runs on four dimensions today: pair-specific clinical evidence, viability and stability, substrate choice and regulatory documentation. Culture houses win on strain libraries and evidence, fibre suppliers win on cost and supply, and dairy and nutrition groups win on distribution and infant and clinical accounts. Buyers compare cost per viable dose, and audits of counts through shelf life can remove a supplier within one cycle.

Emerging pressure comes from specialty brands with proprietary pairs, from Asian producers offering lower-cost blends and from postbiotic products claiming similar benefits without live cells. Rankings shift where a supplier publishes three-arm trials, wins an infant formula contract or fixes stability in warm markets, and consolidation among culture houses continues as dossier costs rise.
synbiotic-blend-market-company-positioning-matrix-1789964244582

Competitive Moat and Risk Dimensions

NOVONESIS

Moat: Strain Library and Evidence

Novonesis, the Danish biosolutions group formed from the merger of Novozymes and Chr. Hansen, holds one of the largest libraries of probiotic strains and supplies cultures for supplements, infant nutrition and food. Its strain evidence, fermentation scale and regulatory teams give it an advantage with global brands, and supports synbiotic launches that pair proven strains with fibres.
NOVONESIS

Risk: Portfolio Integration and Focus

Novonesis is integrating two large businesses, so management attention and investment may spread across many product areas. Specialty brands with proprietary pairs can move faster, and fibre suppliers can partner with rivals on blends. Weak trial results for synbiotic claims could also slow premium pricing across its wider portfolio.
IFF

Moat: Ingredient Breadth and Application Reach

IFF, the American ingredient group that owns the Danisco culture business, supplies probiotic strains, prebiotic fibres and texturisers to supplement, dairy and infant nutrition customers. Its breadth across strains and fibres, application labs and global sales network give it an advantage in offering matched blends, and supports long-term contracts with brands that want one qualified partner.
IFF

Risk: Restructuring and Priority Risk

IFF has restructured and sold parts of its portfolio in recent years, so nutrition and health investment may compete with other priorities. Specialised competitors can offer deeper strain evidence, and fibre and culture pricing pressure squeezes margins. Regulatory limits on synbiotic claims also slow premium launches.

Players Tracked

Prominent Players

Novonesis
IFF
DSM-Firmenich
Danone
Nestlé Health Science

Other Key Players

Probi
Lallemand
Kerry Group
Yakult Honsha
Seed Health
Biocodex
BioGaia
Metagenics
Jarrow Formulas
Renew Life
i-Health
Ingredion
Beneo
Cosucra
Sabinsa

Recent Developments

JANUARY 2026

Novonesis Launches Synbiotic Blend of Bifidobacterium Strain and Oligosaccharides for Adult Digestive Health

Novonesis launched a synbiotic blend of a Bifidobacterium strain and oligosaccharides for adult digestive health, according to company communications. It is a product launch, not an acquisition, and it tests demand for matched pairs. The blend includes stability data at ambient storage. Commercial terms were not disclosed.
Signal: Confirms culture houses are selling matched strain and fibre pairs because brands want ready blends with proven stability.
FEBRUARY 2026

IFF Signs Supply Agreement With Infant Formula Maker for Synbiotic Ingredient System

IFF signed a supply agreement with an infant formula maker for a synbiotic ingredient system, according to company communications. It is a supply agreement, not an acquisition, and it tests infant channel demand. The agreement covers annual volumes, quality audits and change control. Financial terms were not disclosed.
Signal: Shows global ingredient houses are winning infant accounts because premium formula makers want documented, audited synbiotic systems.
MARCH 2026

Danone Publishes Trial Results on Synbiotic Formula in Infants With Digestive Discomfort

Danone published trial results on a synbiotic formula in infants with digestive discomfort, according to company communications. It is a research publication, not an acquisition, and it tests the value of pair-specific evidence. The study followed infants over several months. Commercial terms were not disclosed.
Signal: Indicates leading nutrition groups are publishing infant data because clinicians and regulators want proof before recommending synbiotic formulas.

What Drives Synbiotic Costs

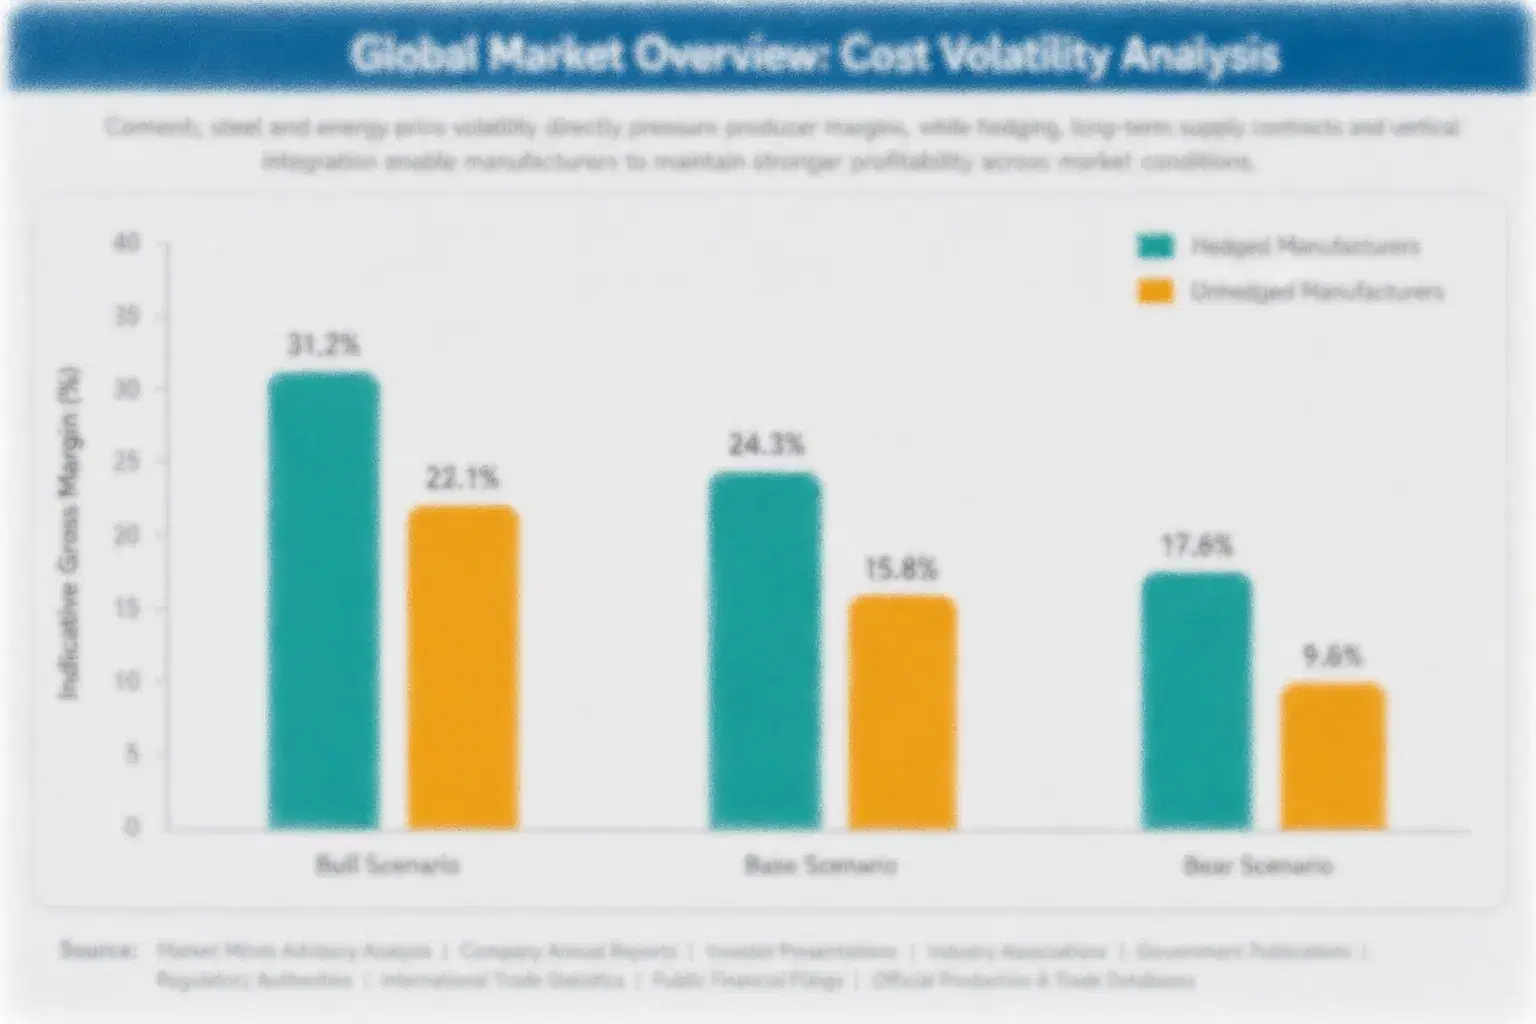
Probiotic strains and cultures account for roughly 24% of production cost, prebiotic fibres such as inulin, galactooligosaccharides and resistant starch about 16%, capsules, sachets and protective packaging about 14%, testing and quality control about 8%, and manufacturing, marketing and distribution about 38%. Fibres come mainly from European and Asian processors, lactose for galactooligosaccharides from dairy producers, and cultures from plants in Denmark, France, Japan and the United States.
The clearest recent shock came in 2022. USDA Dairy Market News reported sharp rises in lactose and whey permeate prices as dairy supply tightened, and MMA Estimate from expert interviews indicates that galactooligosaccharide cost rose 15% to 25% while packaging and energy costs also rose. Producers absorbed part of the increase, shifted some blends toward inulin and resistant starch and negotiated surcharges only after several months.

The disadvantage falls on small brands without fibre contracts, packaging partners or multiple suppliers, because they cannot pass through swings on annual price lists. Large groups own strain libraries, negotiate fibre terms and run several plants. Exposure also varies by format: infant and clinical suppliers face strict quality cost, while gummy and sachet brands face packaging and stability cost.
synbiotic-blend-market-cost-volatility-analysis-1789964244897

Multi-Year Fibre and Lactose Contracts

Suppliers sign multi-year contracts for inulin, lactose and resistant starch and hold two to three months of key inputs. These agreements cut exposure to input spikes of 15% to 25%. The main challenge is volume commitment when demand slows, so larger suppliers lead, while smaller suppliers buy spot and accept more margin volatility. Shared forecasts help suppliers plan.

Fibre Substitution and Blend Redesign

Suppliers redesign blends with alternative fibres and dose optimisation to cut fibre cost by 8% to 15% without harming tolerance or stability. The main challenge is validation, since any change needs new stability and safety checks, so larger suppliers lead, while smaller suppliers rely on ingredient partners that offer tested fibre systems and technical support for launches.

Dry Formats and Efficient Packaging

Suppliers adopt dry-cell formats, blister packs and desiccant systems that protect viability and cut overage by 30% to 50%. The main challenge is capital cost and line changes, so larger suppliers invest first, while smaller brands use contract packers that offer validated packaging and share testing costs to protect cash flow and shorten launch timelines.

Portfolio Architecture for Margin Defence

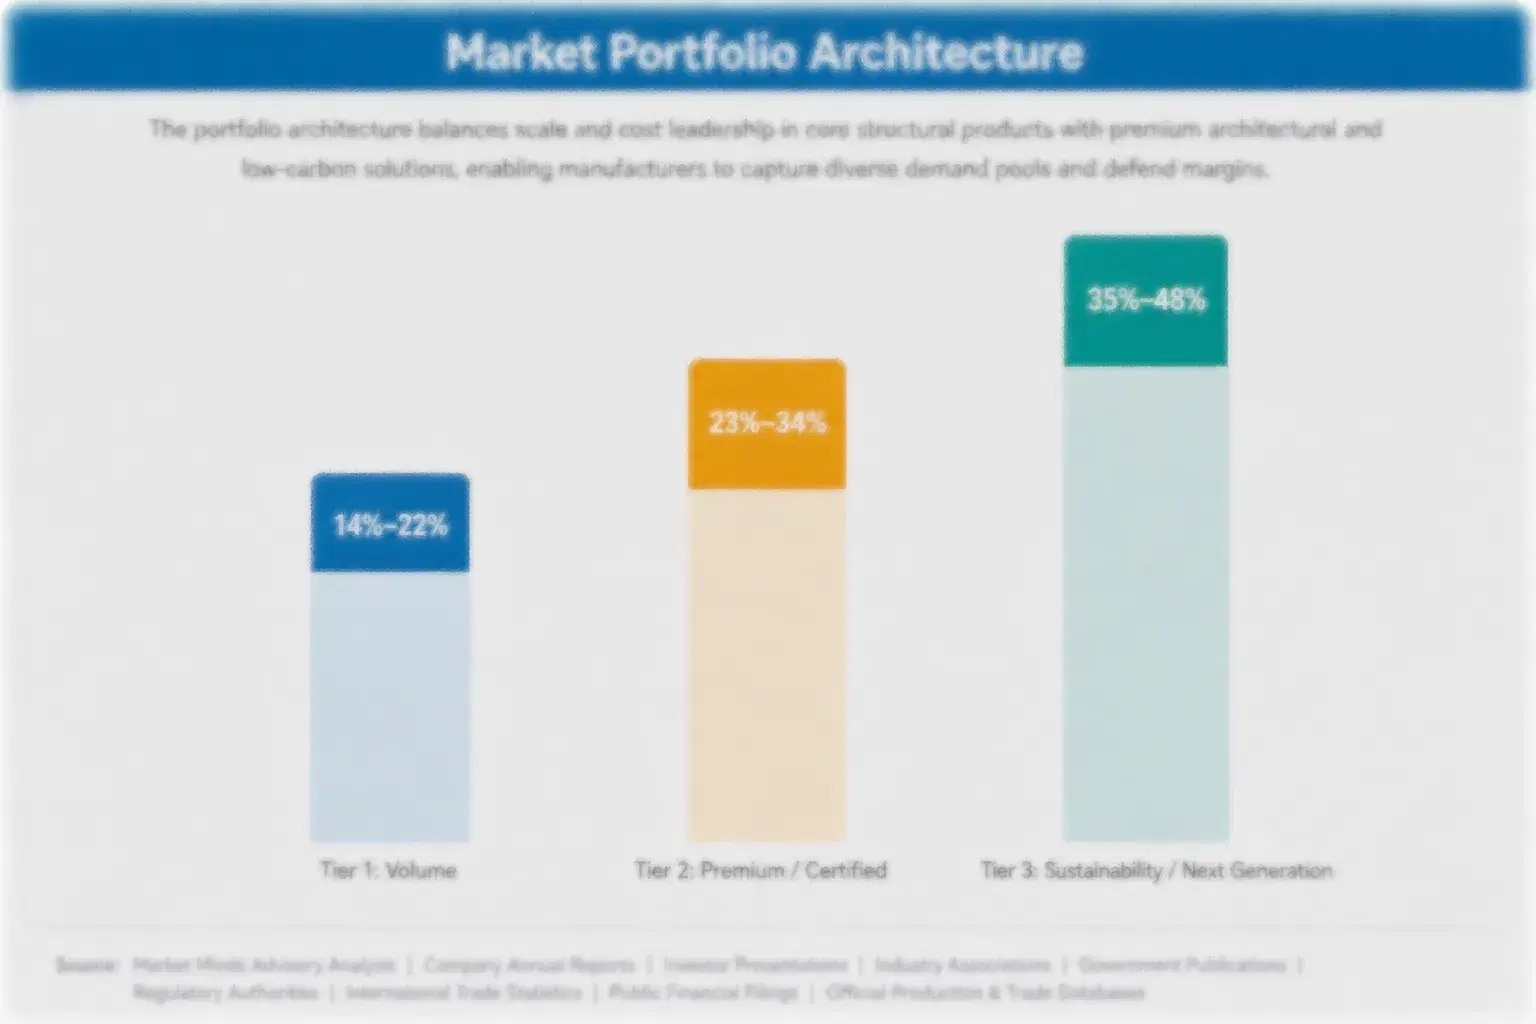
Margins run from moderate returns on simple probiotic and fibre mixtures sold in volume to strong returns on pair-specific, clinically supported blends sold with viability data. Three tiers separate volume products, premium certified lines and next-generation solutions, and each tier draws on different strain libraries, fibre relationships and regulatory dossiers in a moderately concentrated market with limited price transparency for finished blends.
The tension between volume and premium is sharp. Simple mixtures fill private-label and mass retail orders at lower prices but face constant competition from single probiotics, while pair-specific blends earn higher margins on smaller volumes and depend on trials, stability and audits. Suppliers that run only volume struggle when private labels copy formulas, while premium-only suppliers lose reach. Mix management decides which risk dominates each year.

High-value pools concentrate in infant and clinical synbiotics sold under pharmaceutical-grade systems and in metabolic blends with trial data. They gather where buyers pay for pair proof, viability and documented safety, not for the synbiotic label. Women's health blends add a mid-sized pool, and strong suppliers hold all three. Each pool needs different sales skills, clinician relationships and quality systems.

Volume / Commodity-Adjacent

Simple probiotic and fibre mixtures in capsules, powders and gummies sold in volume to private-label brands and contract makers. Buyers focus on price per serving, contracts renew each year, and technical service is limited.
Gross Margin: 28%-40%

Premium / Certified

Strain and fibre blends with certified counts, third-party testing and stability data through expiry, sold to supplement brands, pharmacies and practitioners. Buyers value consistency, documentation and audit records, and contracts run for one to two years.
Gross Margin: 42%-58%

Sustainability / Regulatory / Next-Generation

Pair-specific synbiotics with published trials, patents and pharmaceutical-grade quality, sold to infant formula makers, clinical nutrition companies and premium metabolic brands. Contracts run for several years and depend on evidence, safety files and supply security.
Gross Margin: 52%-70%
synbiotic-blend-market-portfolio-architecture-1789964245236

High-value Sub-segments and Strategic Watch-out

Metabolic and Weight Management Synbiotics

Metabolic and weight management synbiotics combine the fastest growth with strong pricing, since brands seek measurable effects and pay gross margins of 52% to 68% for pair-specific blends. Trial data, patents and claim discipline limit competition, and suppliers with larger studies win the biggest brand contracts and clinic accounts.
Gross Margin: 52%-68%

Women's Health Synbiotics

Women's health synbiotics deliver firm growth and pricing, since vaginal, urinary and digestive comfort buyers accept gross margins of 48% to 65% for tested strains with supporting fibres. Strain identity, viability data and gynaecology channels form the entry barrier, and clear labels decide which brands keep pharmacy listings.
Gross Margin: 48%-65%

Digestive Health Synbiotics

Digestive health synbiotics are the volume core for supplements, sachets and functional drinks. Value grows about 9.0% a year, and strain cost, fibre supply and packaging reliability decide profit. Suppliers anchor sales on long relationships with brand owners and pharmacies, and customers usually renew contracts every year at tender prices.
Gross Margin: 32%-46%

Infant and Pediatric Synbiotics

Infant and pediatric synbiotics are the strategic watch-out, since growth of about 8.0% a year trails the leaders, quality demands are strict and formula makers negotiate hard on price. Suppliers should manage these lines selectively and steer investment toward metabolic and women's health blends. Returns depend on selective investment.
Gross Margin: 38%-52%

Why Brands Rarely Switch Synbiotic Suppliers

Synbiotic demand behaves like an annuity attached to product dossiers, stability files and clinician recommendations. Once a brand qualifies a blend for a digestive or infant product, reorders follow every quarter, and switching means new stability studies, label changes and lost credibility with pharmacists. Buyers set annual volume plans around fermentation output, so suppliers with reliable lots earn steady volume and priority allocation. Trust, once earned, is slow to lose.
Adoption stickiness differs by end-use vertical. Infant formula and clinical nutrition are the deepest, since blends are written into product specifications and approvals take years. Pharmacy and practitioner supplement channels are moderately sticky, driven by clinician advice and brand trust. Mass retail and online buyers are more fluid, changing products when a new claim or price appears, though evidence-backed contracts hold for two to three years.

Buyer profiles are shifting between generations. Older buyers chose probiotics by cell count, while younger buyers ask for strain names, fibre types and stability through expiry. Regulators and clinicians add a third group that sets claim and safety expectations. Suppliers that publish pair-specific data and viability records win newer buyers.
synbiotic-blend-market-end-use-penetration-index-1789964245515

MMA Verdict on Synbiotic Strategy

These are among the four positions where our research anticipates prominent divergence between winners and laggards over the coming forecast period. Each is grounded in the demand model, the regulatory perimeter, and the announced capacity pipeline.
01 / PAIR EVIDENCE STRATEGY

Fund Three-Arm Trials Before Regulators and Buyers Discount Unproven Synbiotic Pairings

Metabolic and Weight Management Synbiotics grows at 14.7% a year, about 1.40 times the overall market rate, and gross margins of 52% to 68% depend on pair-specific proof. Suppliers should invest $3 million to $8 million per three-arm trial of 150 to 300 participants, share costs with brands and publish results openly to defend price premiums of 15% to 25%. Those that delay will lose contracts to better documented rivals over the next two years, while prepared suppliers hold pricing, dossiers and clinician trust.
02 / STABILITY PACKAGING STRATEGY

Upgrade Encapsulation and Packaging Before Viability Failures Damage Brand Credibility

Women's Health Synbiotics grows at 12.6% a year, about 1.20 times the overall market rate, yet viability shortfalls of 20% to 50% cause recalls and returns in poorly protected products. Suppliers should invest $2 million to $7 million in microencapsulation, blister packs and desiccant systems, validate counts at 25 and 40 degrees Celsius and cut complaints and overage cost by 30% to 50%. Those that delay will lose warm-market listings over the next two years, while prepared suppliers hold credibility, margin and retailer confidence.
03 / INFANT ACCOUNTS STRATEGY

Build Pharmaceutical-Grade Infant Accounts Before Formula Makers Consolidate Supplier Lists

Infant formula carries about 22% of synbiotic value, and buyers pay margins 10 to 15 points above supplement grade for audited plants and full documentation. Suppliers should invest $3 million to $10 million in certified plants, batch records and regulatory files, begin with one plant certified for infant use and offer change-control agreements. Those that delay will lose multi-year contracts to better prepared rivals over the next two years, while early movers hold volume, customer trust and long-term pricing power.
04 / FIBRE SUPPLY STRATEGY

Secure Fibre Sources and Tolerance Data Before Lactose Swings Erode Margin

Galactooligosaccharide cost rose 15% to 25% in 2022, and fibre doses that cause bloating cut repeat purchase. Suppliers should invest $0.5 million to $2 million in blended fibre systems, tolerance panels and multi-year contracts, secure two fibre sources per blend and lift repeat purchase by five to nine points. Those that delay will lose margin, shelf space and customers over the next two years, while prepared suppliers hold cost, tolerance credibility and customer confidence through every price cycle and product launch.

Engagement Snapshot From the Field

A live engagement with an industry participant carrying material or product regulatory and market exposure ahead of a defining policy shift, showing how our research translates into a defensible multi-year portfolio strategy.
MARKET MINDS ADVISORY · CLIENT ENGAGEMENT SUMMARY
Synbiotic Blend Producer Strategic Portfolio Review and Transition Roadmap 2026·Investment Scenario on Synbiotic Blend Exposure Evaluation 2025-26
CLIENT PROFILE
The client is a mid-sized European probiotic supplement brand with annual sales near $85 million (client-reported, unverified by MMA), selling single-strain capsules through pharmacies, online stores and health retailers in six countries. About 90% of sales came from probiotics without paired fibre, viability complaints had risen in summer, and pharmacists had asked for synbiotic products with stronger evidence. Management wanted a plan to raise margin and defend pharmacy listings.
STRATEGIC CHALLENGE
Gross margin on single-strain capsules sat near 44% (client-reported, unverified by MMA), returns had reached 4% of sales in warm months, and competitors launched synbiotic lines in the same pharmacies. Management had to decide whether to launch pair-specific blends, upgrade packaging or fund a trial, with limited capital and one main packing site. Key pharmacy partners wanted plans within nine months.
MMA APPROACH
MMA analysed sales, complaint and cost data across 30 products, interviewed 14 pharmacists, clinicians and formulators, and ran a buyer survey on evidence, format and price across three regions. It modelled margin by product and scenario, compared blend, packaging and trial options by payback and execution risk, and tested each against cost and stability scenarios.
KEY FINDINGS
  1. A pair-specific synbiotic range with two blends would cost about $2.5 million and lift gross margin on converted lines from about 44% to about 60% (client-reported, unverified by MMA).
  2. A packaging upgrade with blister packs and desiccants would cost about $1.8 million and cut summer returns by about 60% (client-reported, unverified by MMA).
  3. A three-arm trial of 180 participants would cost about $3.5 million and support price premiums near 15% and pharmacy recommendations (client-reported, unverified by MMA).
  4. Multi-year fibre contracts and dual sourcing would cost about $0.6 million and cut input cost volatility by about one third (client-reported, unverified by MMA).
CLIENT PROFILE
The client is a mid-sized European probiotic supplement brand with annual sales near $85 million (client-reported, unverified by MMA), selling single-strain capsules through pharmacies, online stores and health retailers in six countries. About 90% of sales came from probiotics without paired fibre, viability complaints had risen in summer, and pharmacists had asked for synbiotic products with stronger evidence. Management wanted a plan to raise margin and defend pharmacy listings.
STRATEGIC CHALLENGE
Gross margin on single-strain capsules sat near 44% (client-reported, unverified by MMA), returns had reached 4% of sales in warm months, and competitors launched synbiotic lines in the same pharmacies. Management had to decide whether to launch pair-specific blends, upgrade packaging or fund a trial, with limited capital and one main packing site. Key pharmacy partners wanted plans within nine months.
MMA APPROACH
MMA analysed sales, complaint and cost data across 30 products, interviewed 14 pharmacists, clinicians and formulators, and ran a buyer survey on evidence, format and price across three regions. It modelled margin by product and scenario, compared blend, packaging and trial options by payback and execution risk, and tested each against cost and stability scenarios.
KEY FINDINGS
  1. A pair-specific synbiotic range with two blends would cost about $2.5 million and lift gross margin on converted lines from about 44% to about 60% (client-reported, unverified by MMA).
  2. A packaging upgrade with blister packs and desiccants would cost about $1.8 million and cut summer returns by about 60% (client-reported, unverified by MMA).
  3. A three-arm trial of 180 participants would cost about $3.5 million and support price premiums near 15% and pharmacy recommendations (client-reported, unverified by MMA).
  4. Multi-year fibre contracts and dual sourcing would cost about $0.6 million and cut input cost volatility by about one third (client-reported, unverified by MMA).
RECOMMENDED STRATEGY
Phase 1: Phase 1 (Months 1-9): Launch the first synbiotic blend, upgrade packaging on flagship products and sign multi-year fibre contracts with a second source. Phase 2: Phase 2 (Months 10-24): Start the three-arm trial with independent oversight, launch the second blend and train pharmacists on strain and fibre pairing. Phase 3: Phase 3 (Months 25-42): Publish trial results, expand pharmacy listings and review fibre and packaging terms yearly as cost data develop.
OUTCOME
Within 42 months, synbiotic blends reached 36% of sales, blended gross margin rose from about 44% to about 55%, and summer returns fell by about 60% (client-reported, unverified by MMA). Trial results supported premium pricing, input cost volatility fell by about one third, and pharmacy listings grew in four of six countries.

Frequently Asked Questions

Foundational context covering the market sizes, CAGR, scope, country, region and competition that inform every finding below. This section is provided to cover basics and most often pre-purchase conversations, answered from the MMA Primary Research Dataset.

What is the current size of the Synbiotic Blend Market?

The global synbiotic blend market was valued at $2.20 billion in 2025 on an ingredient and finished-product sales basis. Growth reflects gut health demand and infant nutrition, offset by thin pair-specific evidence and stability limits.

How large will the Synbiotic Blend Market be by 2036?

The market is projected to reach $6.60 billion by 2036, up from $2.43 billion in 2026. The increase of $4.17 billion reflects metabolic blends, women's health products and Asian growth.

What is the CAGR for the Synbiotic Blend Market 2026 to 2036?

The market is forecast to grow at a 10.5% CAGR from 2026 to 2036. The bull case reaches 11.8% and the bear case 9.2%, depending on trial results, regulatory clarity and stability improvements.

Which segment is growing fastest?

Metabolic and Weight Management Synbiotics is the fastest-growing segment at 14.7% CAGR, roughly 1.40 times the overall market rate. Women's Health Synbiotics follows at 12.6% CAGR each year.

Who are the major companies in the Synbiotic Blend Market?

Major companies include Novonesis, IFF, DSM-Firmenich, Danone and Nestlé Health Science. Probi, Lallemand, Kerry Group, Yakult Honsha and Seed Health also hold positions in synbiotic products.

Which country is growing fastest?

India is growing fastest at about 13.0% CAGR, because newborn and digestive research, a large supplement market and pharmacy growth support new volumes. Vietnam and Brazil follow as infant nutrition expands.

Report Segmentation Architecture

The full report scope spans multiple orthogonal segmentation dimensions, with cross-tabulated demand data provided for each dimension pair. Coverage extends further to regional breakdowns, trend trajectories, and the competitive detail needed to support segment-level decision-making.

By Primary Market Dimension

  • Metabolic and Weight Management Synbiotics
  • Women's Health Synbiotics
  • Immune Health Synbiotics
  • Digestive Health Synbiotics
  • Infant and Pediatric Synbiotics

By End-Use Industry

  • Dietary Supplements
  • Infant and Clinical Nutrition
  • Functional Foods and Beverages
  • Animal and Companion Nutrition

By Commercial Dimension

  • Ingredient Sales to Brand Owners
  • Contract Manufacturing and Private Label
  • Pharmacy and Health Retail
  • Online and Direct-to-Consumer
  • Practitioner and Clinic Channels

By Region

  • North America
  • Western Europe
  • East Asia
  • South Asia and Pacific
  • Latin America
  • Middle East and Africa
  • Eastern Europe

Scope, Methodology, and Coverage

Every figure in this report is reproducible from documented input assumptions. The scope below maps the historical period, the forecast horizon, the segmentation dimensions, and the countries covered, alongside the underlying primary and qualitative methodology.
Historical Period
2020 to 2025
Forecast Period
2026 to 2036
Base Year
2025 (USD billions; MMA Primary Research Dataset, September 2026)
Market Definition
The market covers global sales of synbiotic blends, defined as mixtures of live microorganisms and substrates selectively used by host microorganisms, sold as ingredients, supplements, infant and clinical nutrition, and functional foods and drinks. It excludes probiotics without a paired substrate, prebiotic fibres sold alone, postbiotic and heat-killed preparations, and fermented foods where microbes and fibre arise only as by-products of fermentation.
Quantitative Units
USD billions (ingredient and finished-product revenue); billions of CFU for volume references
Segmentation Dimensions
By Health Application; By End-Use Industry; By Commercial Dimension; By Region
Regions Covered
North America, Western Europe, East Asia, South Asia and Pacific, Latin America, Middle East and Africa, Eastern Europe
Countries Covered
United States, Canada, Denmark, France, Germany, Italy, United Kingdom, Belgium, Japan, China, South Korea, India, Australia, Vietnam, Brazil, Mexico, United Arab Emirates, South Africa, Poland, and additional markets relevant to this sector
Key Companies Profiled
Novonesis, IFF, DSM-Firmenich, Danone, Nestlé Health Science, Probi, Lallemand, Kerry Group, Yakult Honsha, Seed Health, Biocodex, BioGaia, Metagenics, Jarrow Formulas, Renew Life, i-Health, Ingredion, Beneo, Cosucra, Sabinsa
Quantitative Methodology
Primary survey, n=3,800 respondents, Q4 2025, six countries; demand-side model with trade association cross-validation
Qualitative Methodology
47 expert interviews, Q4 2025; applied to validate demand model assumptions, identify emerging dynamics, and assess competitive positioning
Report Format
PDF and XLSX data workbook (Word format preview document)
Publisher
Market Minds Advisory
Report Code
MMA-2026-HLT-176
Published
September 2026
Contact
sales@marketmindsadvisory.com | www.marketmindsadvisory.com

Purchase the full Synbiotic Blend Market Report (2026 to 2036).

The full report delivers a detailed assessment of the synbiotic blend market through 2036, covering health application, end-use and regional forecasts, competitive benchmarking of leading culture houses and brands, and input cost analysis. It combines MMA primary research, including a six-country survey of 3,800 respondents and 47 expert interviews, with public statistical and company data. Analysts also model trial outcome scenarios, stability improvements and fibre price paths. Clients receive blend margin ranges, supply maps and a case study on product strategy. Supplier programme and contract frameworks are also included for planning.
Ten-year health application demand forecasts by region
Strain, fibre, and packaging cost tracking
Competitive benchmarking of leading synbiotic suppliers
Synbiotic definition and claims rule tracker
Regional market comparative analysis and forecasts included
Quarterly primary survey data update access

Built For The People Who Decide

From boardroom strategy to bench-side execution, this report is read cover-to-cover by leaders shaping the next decade of their industry, turning demand scenarios, market dynamics and valuation benchmarks into decisions.
CXOs/ Presidents/ VPs/ Managers
M&A and Corporate Development
Strategy Teams and R&D Heads
Procurement and Product Directors
Regulatory and Compliance Leaders
Investor Relations and Equity Analysts