Market Minds Advisory
Synbiotic Animal Feed Market

Synbiotic Animal Feed Market: Sold on a Mechanism Nobody Can See

A farmer cannot observe gut microbiota and can only observe feed conversion, which moves for a dozen reasons at once, so this product is bought on somebody else's trial data and dropped whenever margins tighten.

Lead Analyst

Lisa Gevelber

Published

September 2026

Make Smarter Decisions with Customized Research Insights

Request a free sample report and evaluate market opportunities, growth trends, and competitive dynamics relevant to your business needs.

2025 MARKET VALUE$1.4BMarket Size 2025
2036 FORECAST VALUE$3.7BBase Case , 2026 to 2036
CAGR 2026 TO 20369.2 %Bull 10.4% / Bear 8.0%
INCREMENTAL OPPORTUNITY$2.2BNet 10- year value creation
EXPANSION MULTIPLE2.41x2036 value over 2026 base
Strategic Levers
M&A Pipeline
Regional Outlook
Country Rankings
Competitive Intelligence
Segmental Deep-dive
Call-Us : 91 93563 13602

Executive Snapshot and Market Trajectory

The problem with selling gut health is that nobody on a farm can see a gut. What a producer observes is feed conversion and mortality, both of which move for a dozen reasons at once, so attribution is guesswork and the product gets dropped the moment margins tighten anywhere.
That shows in the replication figures. Only around 41% of on-farm results reproduce the outcomes published in controlled trials, because a trial holds everything else constant and a commercial house never does. Suppliers quoting a 3% feed conversion improvement are quoting a number most customers will not actually observe on their own animals. Presenting trial data as predictive sets up a disappointment with roughly three customers in five.
Aquaculture is the exception and it grows fastest at 13.8%. Disease pressure is severe, antibiotic restrictions bite hardest, and survival through a cycle is a number a farmer counts directly rather than infers. Ecuador leads all countries at 15.2% on shrimp production, where the outcome is visible enough to justify the input on its own. Pet works for the opposite reason, since owners require no verification at all. That difference explains the margin gap.
Market Definition
Combined probiotic and prebiotic feed products supplied for animal nutrition, covering poultry, swine, aquaculture, ruminant, pet and equine applications. Measured at supplier selling value for products containing both live microbial cultures and fermentable substrates supplied together. Excludes standalone probiotics or prebiotics sold separately, enzymes, phytogenic additives, medicated feed additives, complete compound feed, and silage inoculants.
Base Year Value
$1.4B in 2025 (MMA Primary Research Dataset, August 2026)
Forecast Period
2026 to 2036, eleven discrete annual values
CAGR
9.2% base case. Bull 10.4%. Bear 8.0%.
Fastest Growth Segment
Aquaculture: 13.8% CAGR
Fastest Growth Country
Ecuador: 15.2% CAGR
Fastest Growth Region
South Asia and Pacific: 11.4% CAGR
Largest Region
East Asia: 30% of 2025 global value
Market Leaders
DSM-Firmenich, Novonesis, Alltech, Lallemand Animal Nutrition, Cargill. Source: MMA Primary Research Dataset, July 2026.
Primary Survey
n=3,800 procurement and R&D decision-makers, Q4 2025, six countries
Methodology
Demand-side build-up, cross-validated against public data, 47 expert interviews

Synbiotic Animal Feed Market Forecast Scenarios

synbiotic-animal-feed-market-trends-size-forecast-scenario-1787639600578
Growth ran near 7.8% between 2020 and 2025, driven by antibiotic growth promoter restrictions spreading rather than by any demonstrated performance breakthrough. Adoption was frequently trialled and abandoned, since producers could not attribute results reliably and the products were among the first cut when feed margins tightened. Aquaculture adoption grew far more consistently than terrestrial livestock across the whole period.
Base case 9.2% rests on three mechanisms. Aquaculture grows at 13.8% because survival through a production cycle is directly countable and disease pressure makes the input worth trying. Pet applications grow at 11.6% as owners buy digestive health products with no price sensitivity at all. And Ecuador grows fastest of any country at 15.2% on shrimp production expanding while antibiotic use faces buyer restrictions. Only one of the three depends on terrestrial livestock at all.
The bull case at 10.4% assumes on-farm measurement improving enough that producers can attribute results themselves, which would convert trial adoption into standing programmes. The bear case at 8.0% is continued weak replication against published trials, which keeps the category in the discretionary spending bracket that disappears whenever livestock margins come under pressure anywhere. Measurement rather than biology decides which case arrives.

An Invisible Mechanism and a Noisy Result

This category asks a farmer to pay for something they cannot observe. Gut microbial populations are invisible without laboratory work nobody runs commercially, and the outcomes that matter, feed conversion and mortality, respond to ventilation, water quality, stocking density, weather and a dozen other variables simultaneously. A 3% conversion improvement is real in a controlled trial and statistically invisible in a commercial house running normal variation.
TOP FIVE CONCENTRATION36%Strain libraries and registrations concentrate the field somewhat
FEED PELLETING TEMPERATURE85 CHeat applied during processing that kills most vegetative strains
SPORE SURVIVAL RATE92%Portion of spore forming organisms surviving thermal feed processing
CONVERSION EFFICIENCY GAIN3%Typical efficiency improvement reported across controlled trial work
FEED INCLUSION RATE500 g/tProduct added per tonne of finished compound feed
TRIAL REPLICATION RATE41%Share of farm results reproducing published trial outcomes
The replication data makes the point plainly. Around 41% of on-farm results reproduce published trial outcomes, which is not evidence that the products fail so much as evidence that a trial and a farm are different environments. Suppliers presenting trial data as though it predicts a customer's own result are setting up a disappointment, and the resulting scepticism has cost this category more adoption than any competing product ever has.
Processing survival is the other unglamorous problem. Feed pelleting reaches around 85 degrees and destroys most vegetative organisms, so only spore formers such as Bacillus survive reliably at rates near 92%, while others require post-pelleting liquid application equipment that many mills simply do not have. Counts declared at manufacture and counts arriving at the trough are frequently very different numbers indeed.
"Half the disappointment in this category comes from products that were dead before the animal saw them, and the other half from expecting a controlled trial to describe a commercial house. Neither problem is about the biology, which is the part everybody spends their research budget on."
Director, Animal Nutrition and Feed Additives Practice · MMA Agriculture and Food Practice · August 2026

Market Trends

Aquaculture adoption outpacing terrestrial livestock considerably

Aquaculture grows at 13.8% while terrestrial species grow at roughly half that rate, because survival through a production cycle is a number a farmer counts directly rather than infers from feed records. Disease pressure is severe, antibiotic restrictions from export buyers bite hardest, and water quality effects give a further visible outcome. That combination of a countable result and an acute problem is precisely what terrestrial livestock adoption has always lacked, and it explains the divergence better than any species biology. Suppliers organised around terrestrial livestock volume are selling into the applications where attribution is hardest and margins are thinnest.
Market Impact: Ecuador growing fastest at 15.2%

Thermal survival deciding which products reach the animal

Feed pelleting reaches around 85 degrees and destroys most vegetative organisms, leaving spore formers surviving at rates near 92% and everything else dependent on post-pelleting liquid application equipment that many mills do not have installed. Counts declared at manufacture and counts arriving at the trough are therefore frequently different numbers. Suppliers competing on strain selection while ignoring processing survival are optimising a variable that never reaches the animal in many customer situations. A supplier guaranteeing viable counts in finished feed rather than in the bag is making a claim that most competitors cannot match without changing strains or customer equipment.
Market Impact: Pet applications growing at 11.6%

Market Opportunities and Growth Drivers

Export buyers restricting antibiotic use in shrimp production

Ecuador grows fastest of any country at 15.2% as shrimp production expands while export buyers impose antibiotic restrictions considerably stricter than local regulation requires. That removes the reliable tool and leaves producers seeking alternatives in a system where disease losses are immediately visible in harvest counts. Synbiotic adoption follows commercial buyer requirements rather than any regulatory calendar, which makes it faster and less predictable than terrestrial livestock adoption ever is. Chilean salmon production follows similar logic, and both sectors treat disease loss as an immediate commercial event rather than a statistical one.
Market Impact: Only 41% of results replicate

Pet digestive products carrying no price sensitivity whatsoever

Pet applications grow at 11.6% because an owner buying digestive health for a companion animal is not calculating cost per kilogram of gain and will pay for a claim they cannot verify. Inclusion rates are low and margins are several times those available in livestock feed. The category also tolerates the attribution problem entirely, since an owner attributing improved stool quality to a supplement requires no controlled comparison to remain satisfied with the purchase. Extruded pet food processing still imposes thermal survival limits, which favours spore forming organisms in exactly the same way that livestock pelleting does.
Market Impact: Delivers around 3% improvement

Market Restraints and Challenges

Attribution failure keeping products in discretionary spending

Only around 41% of on-farm results reproduce published trial outcomes, because a controlled trial holds constant everything that varies daily in a commercial house. The root cause is measurement environment rather than product efficacy. Commercially it means producers cannot attribute improvements and therefore treat the input as discretionary, cutting it first whenever feed margins tighten. On-farm measurement programmes and outcome linked commercial terms are the mitigations a few suppliers have begun offering. Neither is widely offered across the industry yet. Both would address the actual cause rather than the symptom producers describe.
Market Impact: Aquaculture growing at 13.8%

Antibiotic replacement expectations that no product can meet

Growth promoters delivered reliable and repeatable performance, and synbiotics deliver partial and variable performance that depends heavily on management quality, housing and health status. The root cause is that a growth promoter suppressed a problem while a synbiotic supports an animal's own function. Commercially it produces disappointment framed as product failure. Programme selling with management support attached is the only mitigation that addresses the actual gap rather than the expectation. Suppliers who position these products as antibiotic replacements rather than as management support are creating the expectation that then defeats them commercially.
Market Impact: Spores survive at 92% rates
4 additional market trends, 3 additional growth drivers, and 2 additional restraints and challenges are covered in the full report. Contact sales@marketmindsadvisory.com to access the complete intelligence.

Segment CAGR and Growth Architecture

Six segments are split by target species, because species determines the gut physiology involved, the production cycle length over which any result must appear, the regulatory framework for additives and how visible the outcome is to the buyer. Format variants sit inside each species. Delivery route and channel are handled separately in the framework. Outcome visibility varies by species too.
synbiotic-animal-feed-market-trends-market-share-analysis-1787639601111

Aquaculture

Growing at 13.8%, half again the market rate of 9.2%, aquaculture is the one application where the result is directly countable, since survival through a production cycle is measured at harvest rather than inferred from feed records. Disease pressure is severe, export buyers impose antibiotic restrictions stricter than local regulation, and water quality benefits give an additional visible outcome. Products are frequently applied to feed after pelleting or delivered through water, which sidesteps the thermal survival problem that limits terrestrial applications considerably. Export buyer requirements rather than regulation drive adoption, which makes it faster and considerably less predictable than any terrestrial livestock market. Disease pressure makes the input urgent rather than optional, which changes the negotiation entirely.
CAGR 13.8%

Pet

At 11.6% pet applications behave nothing like livestock feed, because the buyer is an owner purchasing perceived wellbeing rather than a producer calculating cost per kilogram of gain. Price sensitivity is effectively absent, inclusion rates are low and margins run several times livestock levels. The attribution problem that limits farm adoption barely applies, since an owner satisfied that stool quality has improved requires no controlled comparison. Extruded pet food processing still imposes thermal survival constraints that favour spore forming organisms. Channel and brand rather than any performance data decide which products succeed, which makes this a consumer marketing business wearing an animal nutrition label and explains the margins available. Verification never enters it.
CAGR 11.6%
Full segment breakdown across 6 segments available in the complete report.

Regional Architecture and Country Demand Map

East Asia holds 30% of value on the largest compound feed industry anywhere and aquaculture production that dwarfs every other region. North America follows at 22% on pet applications and intensive livestock together. South Asia and Pacific grows fastest of the seven regions covered. Shares hold in band.

North America

Pet applications are unusually important here and carry margins several times livestock levels, with owners buying digestive health claims that require no verification at all. Intensive poultry and swine production adopts synbiotics within antibiotic free programmes that retailers increasingly require, though attribution difficulties keep usage discretionary. Feed mills are generally well equipped with post-pelleting application systems. Growth at 8.4% reflects pet expansion offsetting the cautious and frequently interrupted adoption across terrestrial livestock. Attribution difficulty rather than any product scepticism is what keeps terrestrial adoption interrupted, and it recurs at every point in the livestock margin cycle. Feed mills here are better equipped for post-pelleting application than most regions, which removes one of the two causes of disappointment across the category.
Share: 22% | CAGR: 8.4% (2026 to 2036)

Western Europe

Growth promoter withdrawal happened here first and longest ago, which means the category is mature and producers have already formed views on what these products deliver. Those views are frequently sceptical, since early expectations of antibiotic equivalence were never met. Regulatory approval requirements for feed additives are demanding and slow, favouring established suppliers with registration portfolios. Growth of 7.6% is the slowest anywhere, reflecting a market that has already absorbed the initial adoption wave. Aquaculture is limited regionally outside Norwegian salmon, which removes the one application where adoption everywhere else has proved genuinely durable. Registration portfolios matter more here than anywhere, since approval requirements are demanding and slow enough to exclude newer entrants from meaningful participation.
Share: 20% | CAGR: 7.6% (2026 to 2036)
Regional intelligence for 5 additional markets available in the complete report: East Asia, South Asia and Pacific, Latin America, Middle East and Africa, Eastern Europe. Contact sales@marketmindsadvisory.com.
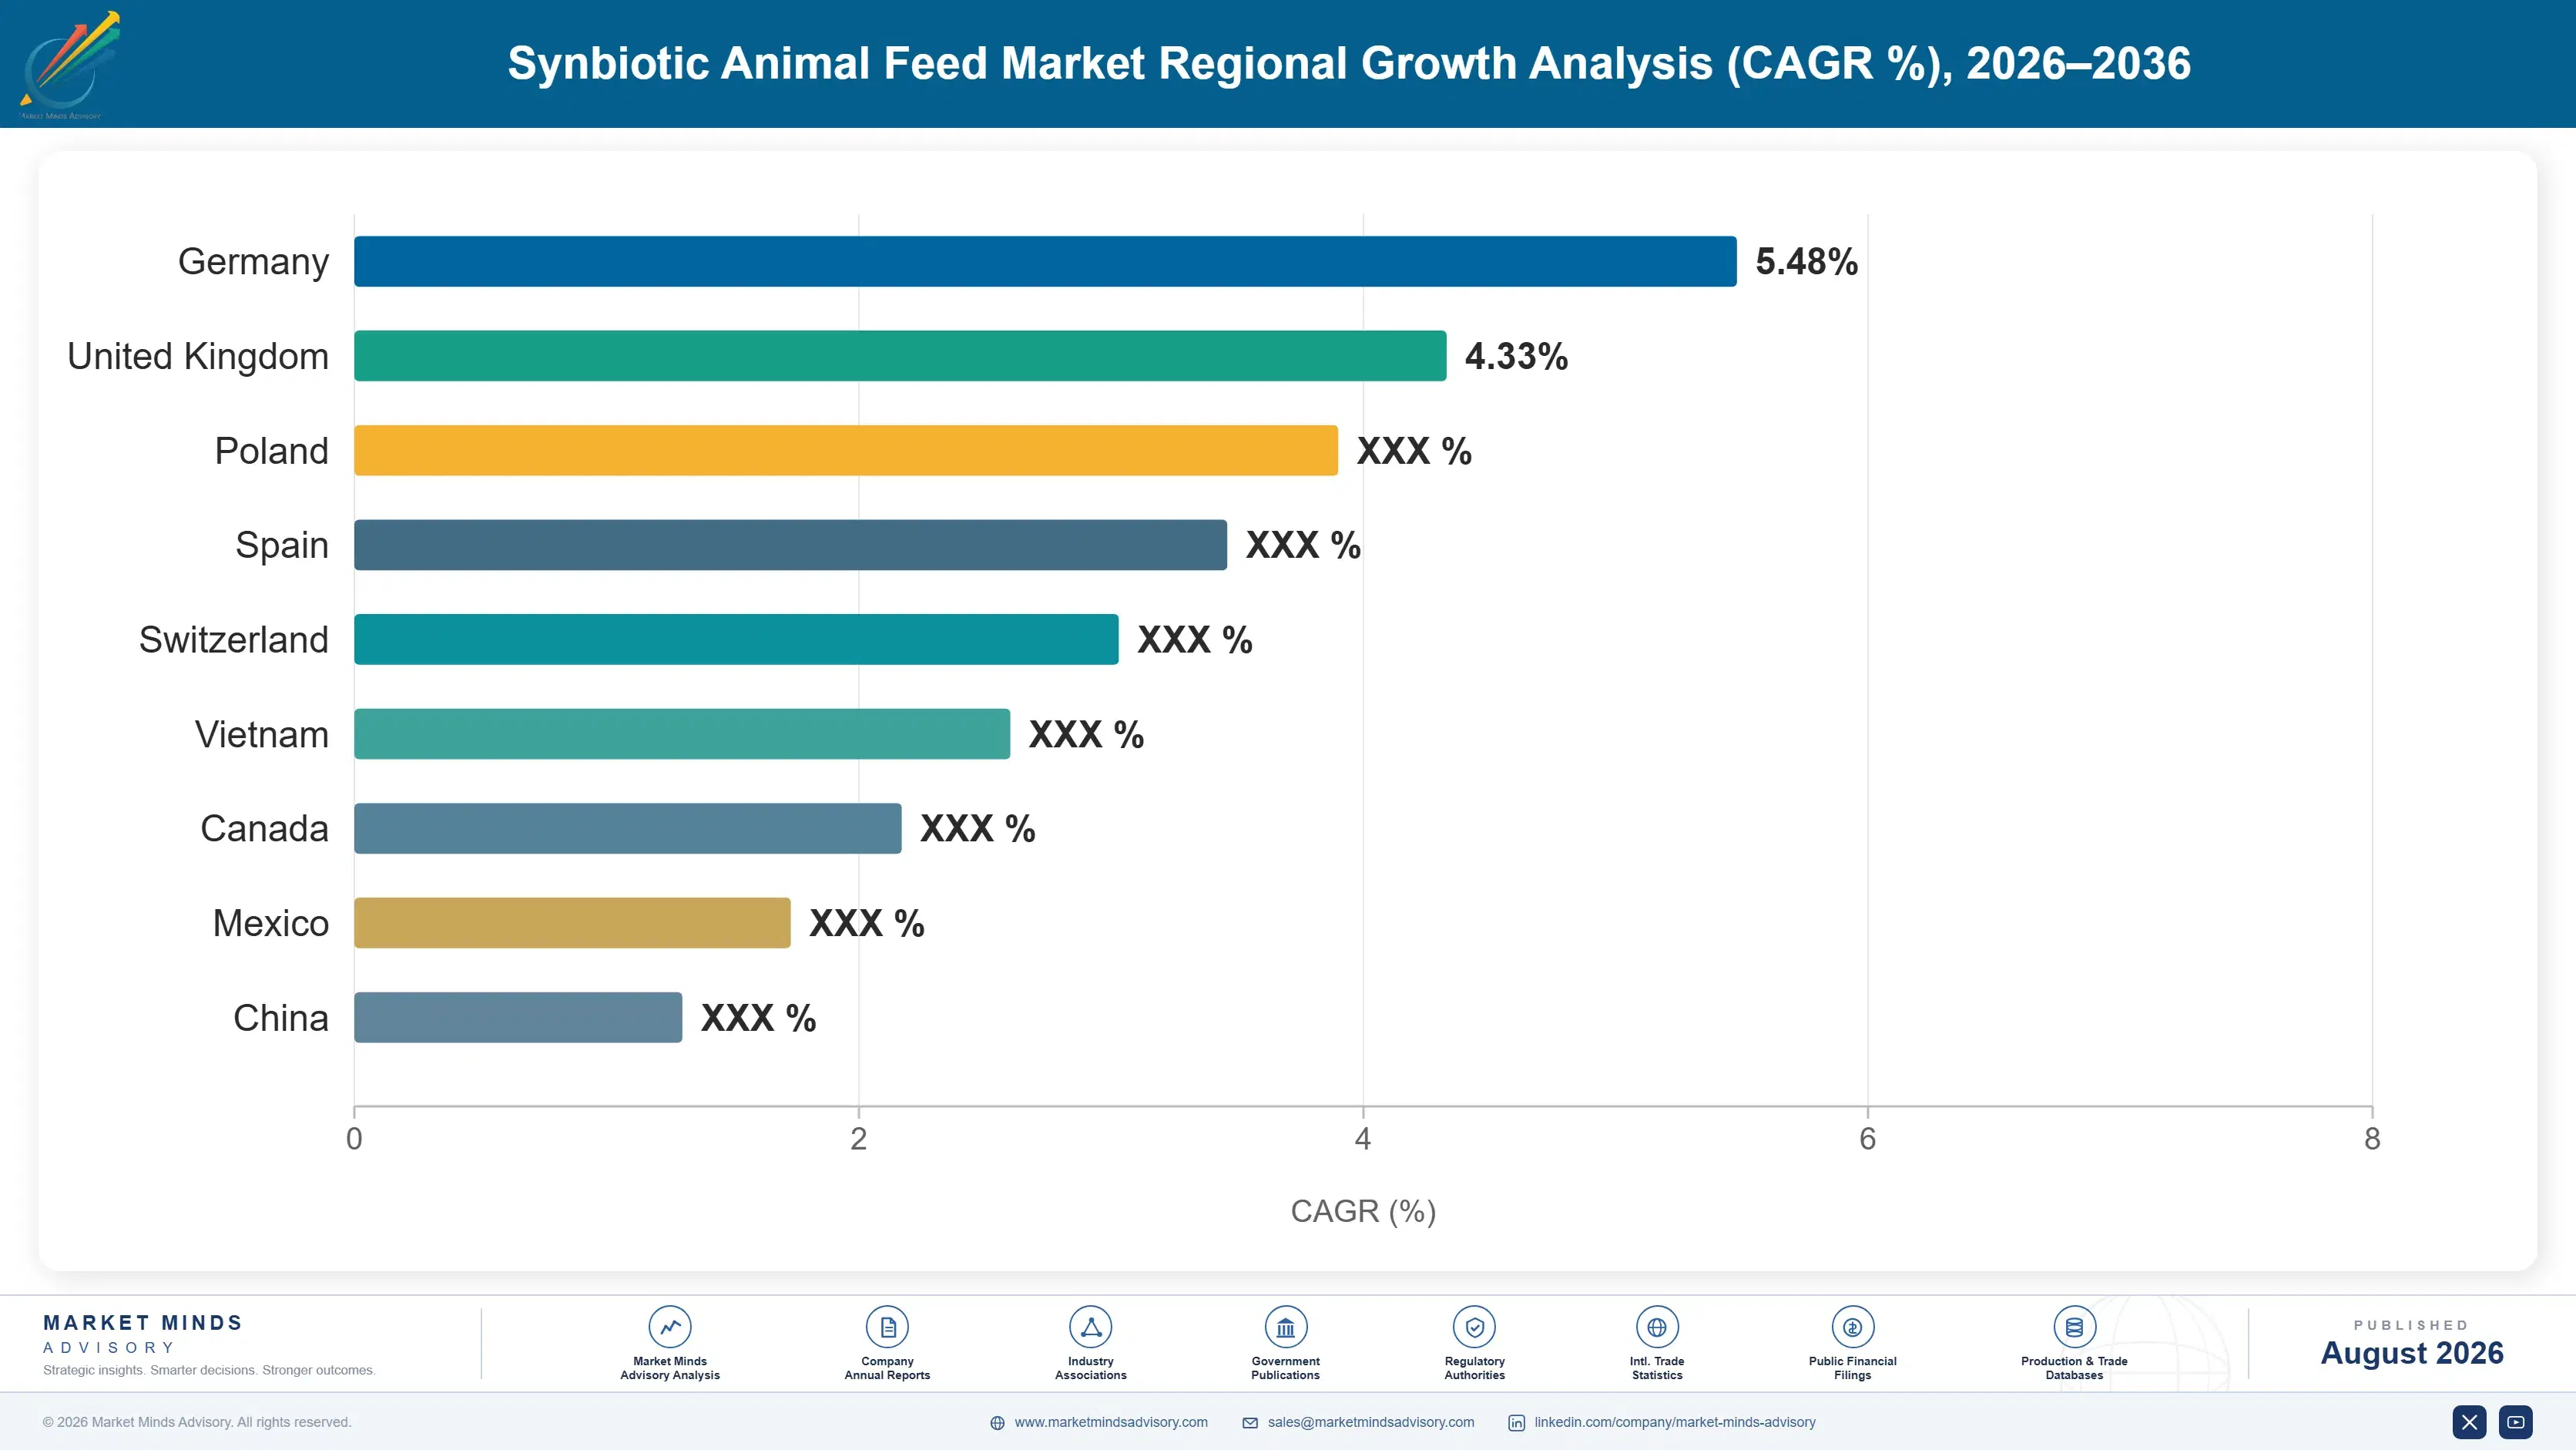
synbiotic-animal-feed-market-trends-country-cagr-analysis-1787639601643

Four Moves Toward a Visible Result

This category loses more sales to unverifiable outcomes than to any competing product, and the biology receives most of the research money while the measurement problem receives almost none. What works is following the species where results are countable, guaranteeing survival to the trough, and putting outcomes into commercial terms. Measurement is the gap.

Follow the species where the result is countable

Aquaculture grows at 13.8% because survival through a cycle is counted at harvest rather than inferred from feed records, which removes the attribution problem that limits every terrestrial application. Pet grows at 11.6% because the buyer requires no verification at all. Both are considerably easier commercial propositions than persuading a broiler producer to attribute a 3% conversion change to one input among many, and both carry better margins. Rebuilding commercial effort around those two applications is a mix decision rather than a product one, and it is available to any supplier prepared to make it.
Market Impact: Serves the 13.8% aquaculture segment growth each year

Guarantee counts at the trough rather than at manufacture

Pelleting at around 85 degrees leaves spore formers surviving near 92% and destroys most other organisms, so declared counts at manufacture frequently bear little relation to what an animal receives. A supplier guaranteeing viable counts in finished feed rather than in the bag is making a claim competitors cannot match without either spore based products or post-pelleting equipment. It also removes a genuine cause of the disappointment that has damaged this whole category. It costs either a strain change or a customer equipment conversation, and both are cheaper than the credibility this category keeps losing.
Market Impact: Guarantees 92% spore survival right through to feeding

Put outcomes into commercial terms rather than trial data

Around 41% of farm results reproduce published trial outcomes, which means quoting trial data reliably sets up disappointment with roughly three customers in five. Outcome linked commercial terms shift the attribution risk to the party who actually believes the product works. That is uncomfortable and it converts a discretionary purchase into a programme, and suppliers confident in their own data lose considerably less than they expect from offering it. Suppliers confident in their own data lose considerably less than they expect. The terms concede less than the conversion gains. Confidence is the test here.
Market Impact: Addresses the 41% trial replication rate head on

Sell management programmes rather than single additives

Growth promoters worked regardless of management and synbiotics do not, which means the same product delivers different results in different houses and the difference is not the product. Bundling technical support on ventilation, water quality, stocking and health status addresses the actual variance. It costs field resource and it converts a 3% claim into something a producer can more often realise, which is what turns a trial into a repeat order. That field resource is the difference between a trial and a repeat order. Nothing about the biology needs improving here.
Market Impact: Helps realise the full 3% conversion efficiency gain

Who Controls the Margin Pool

Participation is measured on annual product volume supplied into feed manufacture and direct farm sales, and the top five hold 36%. Concentration is moderate because strain libraries and regulatory registrations create real barriers while formulation and blending do not. DSM-Firmenich and Novonesis lead through strain portfolios and registration depth rather than through any advantage in commercial reach. The gap to challengers is registration depth rather than manufacturing capability.
Competition runs on three fronts. Strain portfolio and registration status decide what can be sold in which market at all. Thermal stability decides whether a product survives feed processing, which many suppliers still treat as secondary. And field technical support decides whether a trial becomes a standing programme rather than an abandoned experiment. Attribution support has become a fourth front, and almost nobody offers it in any commercially meaningful form.

Pressure ahead comes from aquaculture demand growing faster than terrestrial adoption, and from producers pressing harder on verifiable outcomes. Expect suppliers with field capability to convert trials at considerably better rates. Rankings shift on who commits to guaranteed counts in finished feed first. Concentration should rise as registration costs keep climbing.
synbiotic-animal-feed-market-trends-company-positioning-matrix-1787639602168

Competitive Moat and Risk Dimensions

DSM-FIRMENICH

Moat: Strain portfolio and registration depth

A broad portfolio of characterised strains combined with feed additive registrations across major markets creates a position that a formulator cannot enter without years of regulatory work and its own strain development. Registration is slow, expensive and market specific, which makes the barrier considerably higher than the manufacturing process would suggest to an outside observer.
DSM-FIRMENICH

Risk: Terrestrial adoption attribution problem

Substantial exposure to poultry and swine ties revenue to applications where producers cannot attribute results and cut spending first when margins tighten. That difficulty is a measurement problem rather than a product one, so improving the biology does not address it, and the category has carried the same scepticism for well over a decade.
NOVONESIS

Moat: Fermentation scale and strain development

Industrial fermentation capability at scale combined with strain development depth allows both cost competitive supply and continuing product improvement, which few competitors hold together. That capability also transfers across species applications, letting the business follow aquaculture and pet growth without rebuilding manufacturing for each new market it enters.
NOVONESIS

Risk: Feed processing survival dependency

Products dependent on post-pelleting application face customers whose mills lack the equipment, which caps the addressable market regardless of product quality. Spore based alternatives survive processing more readily but constrain strain choice, and that trade-off shapes what the business can realistically offer to a large part of the feed industry.

Players Tracked

Prominent Players

DSM-Firmenich
Novonesis
Alltech
Lallemand Animal Nutrition
Cargill

Other Key Players

Kemin Industries
Adisseo
ADM Animal Nutrition
Novus International
Lesaffre
Evonik
Beneo
Nutreco
Phibro Animal Health
Asahi Biocycle
Angel Yeast
Guangdong VTR Bio-Tech
Orffa
Biorigin
Provita Eurotech

Recent Developments

MARCH 2026

Shrimp producer adopts synbiotic programme under buyer antibiotic restrictions

A shrimp producer adopted a synbiotic feeding programme after an export buyer imposed antibiotic restrictions stricter than local regulation required, selecting on survival data through complete production cycles rather than on any laboratory performance claim. Local regulation would have permitted continued antibiotic use throughout. The buyer requirement decided it.
Signal: Buyer requirements move adoption faster than regulation, and harvest counts settle the argument every time now
OCTOBER 2025

Feed mill adds post-pelleting application after viability testing

A compound feed mill installed post-pelleting liquid application equipment after testing showed viable counts in finished feed far below the levels declared at manufacture, following thermal processing at normal pelleting temperatures across its production lines. The equipment investment was justified on delivered viability alone. Product specifications had not changed.
Signal: Declared counts and delivered counts diverge sharply once feed passes through a pellet mill almost invariably
JANUARY 2026

Poultry integrator suspends synbiotic use as feed margins tighten

A poultry integrator suspended synbiotic use across its houses when feed margins tightened, citing inability to attribute performance improvements to the input against normal variation in conversion and mortality across its production sites. No performance complaint was recorded against the products at any point. Suspension was purely a margin decision.
Signal: Unattributable inputs are cut first, which is a measurement problem rather than an efficacy one entirely

Fermentation, Substrate and Carriers

Fermentation substrate and media carry around 24% of product cost, with molasses, dextrose and nitrogen sources dominating. Energy for fermentation, separation and drying takes about 21%, since preserving viability through drying requires careful and expensive processing. Prebiotic substrates including mannan oligosaccharides and beta-glucans account for around 19%. Carriers, stabilisers, packaging, quality testing and freight absorb the balance.
Industrial energy pricing rose sharply through 2022 and has stayed elevated across Europe, per IEA industrial energy reporting alongside published animal nutrition sector commentary and Novonesis annual reporting for 2025 on fermentation cost exposure. Viability preserving drying is more energy intensive than conventional spray drying, so this category absorbed that movement more heavily than most feed additive categories did. Spore based products absorbed considerably less of that increase than live culture ones did.

Exposure divides on production route and product form rather than on scale. A spore based producer carries lower drying energy because spores survive processing that would kill vegetative cells. A live culture producer carries higher energy and shorter shelf life together. Prebiotic substrate producers carry agricultural feedstock pricing behaving on entirely different drivers, and a synbiotic supplier generally carries all three exposures at once.
synbiotic-animal-feed-market-trends-cost-volatility-analysis-1787639602365

Favour spore forming strains where application permits

Spore formers survive pelleting near 92% and require far less energy intensive drying to preserve viability, which addresses both a cost exposure and a delivery problem simultaneously. Strain choice is constrained by what each application actually needs, but where a spore based organism performs adequately the commercial case is considerably stronger. Application requirements set the limit.

Contract prebiotic substrate against agricultural cycles

Mannan oligosaccharides, beta-glucans and similar substrates derive from yeast and agricultural feedstocks priced on drivers entirely unrelated to fermentation inputs. Contracting across production cycles smooths an exposure that suppliers frequently overlook because it sits on a different part of the cost structure from the microbial component. The two exposures are worth managing separately. Contracting handles it.

Site fermentation capacity against industrial energy cost

Fermentation and viability preserving drying together carry over 40% of cost, which makes regional industrial energy pricing a genuine competitive variable rather than an operating detail. European producers discovered this during the last cost cycle, and capacity siting decisions since have weighted energy considerably more heavily than before. Siting decisions have shifted noticeably since.

Portfolio Architecture for Margin Defence

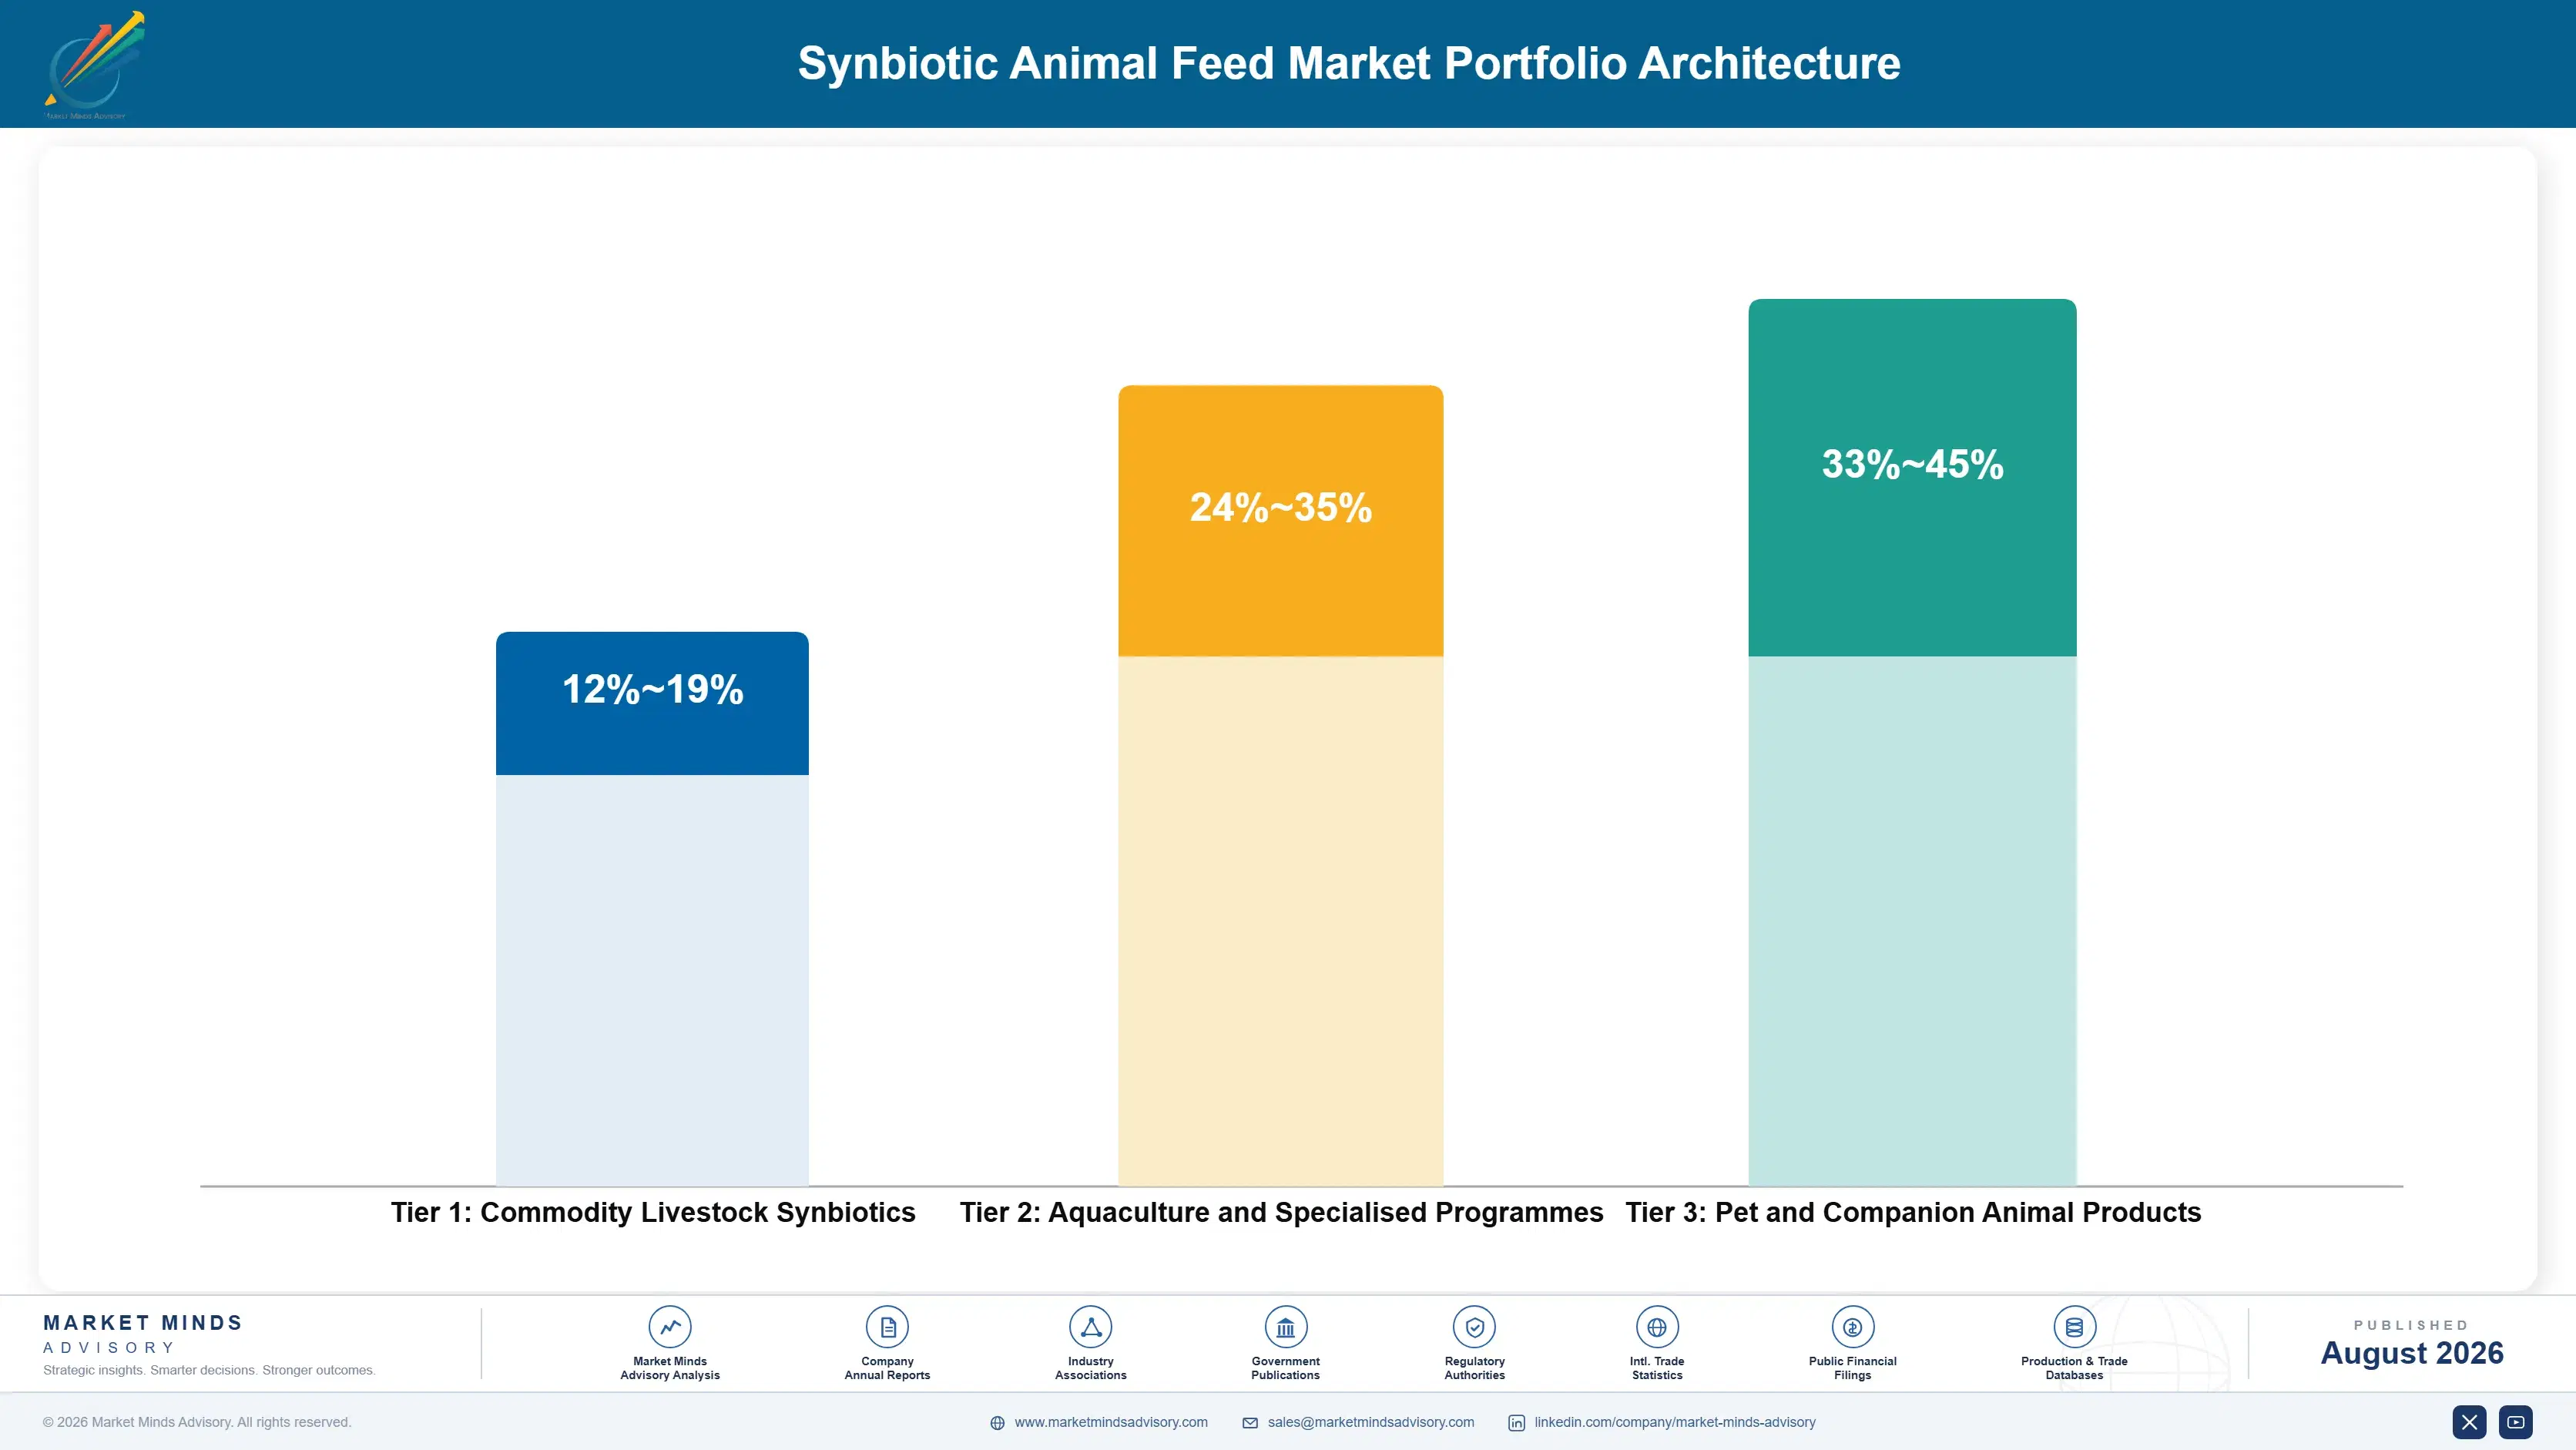
Margin here follows whether the buyer can verify the outcome, which is a commercial fact rather than a technical one. Commodity livestock synbiotics earn margins in the low to high teens, because producers cannot attribute results, treat the spend as discretionary and negotiate hard on cost per tonne of finished feed at every renewal. Discretionary spending behaves exactly as the word suggests.
Aquaculture and specialised livestock programmes do better in the mid twenties to mid thirties, because survival through a cycle is countable and disease pressure makes the input commercially urgent rather than optional, which changes the negotiation entirely from one about cost per tonne. Disease loss is an immediate commercial event in those systems rather than a statistical one buried in annual records.

Pet applications hold the strongest position, reaching into the mid forties, where an owner buys a claim requiring no verification and inclusion rates are low enough that ingredient cost barely registers. Those margins reflect buyer psychology rather than any advantage in strain quality, fermentation efficiency or product performance. Very few suppliers have built the consumer channel capability those margins actually require.

Commodity Livestock Synbiotics

Poultry, swine and ruminant products sold on cost per tonne of finished feed. The seven point range reflects strain cost and registration position rather than any difference producers could reliably observe in their own animals.
Gross Margin: 12-19%

Aquaculture and Specialised Programmes

Programmes for applications where survival and disease outcomes are directly countable by the customer. The eleven point range reflects technical support depth and how acute the disease pressure is in each production system.
Gross Margin: 24-35%

Pet and Companion Animal Products

Companion animal digestive products where the buyer requires no verification and inclusion cost barely registers. The twelve point range reflects brand positioning and channel rather than anything about product performance itself.
Gross Margin: 33-45%
synbiotic-animal-feed-market-trends-portfolio-architecture-1787639602873

High-value Sub-segments and Strategic Watch-out

Aquaculture Programmes

High value and the fastest growth at 13.8%, because survival through a cycle is counted at harvest rather than inferred. Export buyer antibiotic restrictions create urgency that terrestrial livestock adoption has never had. Post-pelleting or water delivery sidesteps the thermal survival problem entirely. Urgency is real.
Gross Margin: 26-35%

Pet and Companion Products

High value and growing at 11.6% with owners who require no verification and show no price sensitivity. The attribution problem that limits farm adoption barely applies to this buyer at all. Brand and channel rather than performance data decide which products succeed. Price sensitivity is absent.
Gross Margin: 35-45%

Commodity Livestock Synbiotics

The volume core, sold on cost per tonne to producers who cannot attribute results and cut the spend first whenever feed margins tighten anywhere across their operation. Trial adoption looks like growth and behaves like churn. Cost per tonne decides every renewal conversation here. Churn is high.
Gross Margin: 12-19%

Attribution and Viability Exposure

The strategic watch-out. Only 41% of farm results replicate published trials and pelleting destroys most non-spore organisms, and the range reflects whether a supplier has addressed measurement and delivery or neither. Neither problem is about the underlying biology at all. Both are commercial problems rather than technical ones.
Gross Margin: 10-43%

Countable Results Buy Repeat Orders

Demand here separates almost entirely on whether the buyer can see a result. A shrimp farmer counts survivors at harvest and knows what happened. A broiler producer looks at conversion figures moving within normal variation and cannot tell. A pet owner requires no evidence beyond their own impression. Those three buyers behave so differently that treating them as one market misleads anybody planning against it. The same product performs three different commercial roles.
Stickiness follows visibility rather than satisfaction. Aquaculture programmes hold because the outcome is countable and the disease risk of stopping is obvious. Livestock use is repeatedly trialled and abandoned as margins move, which produces revenue that looks like adoption and behaves like churn. Pet purchases repeat on habit and brand rather than on any performance assessment at all.

Deciding functions differ by the same logic. Aquaculture decisions sit with production managers watching survival data. Livestock decisions sit with nutritionists advising and finance deciding, and finance cuts what it cannot attribute. Pet decisions sit with brand and marketing teams. A supplier presenting the same trial data to all three is persuading only the one that was already persuaded.
synbiotic-animal-feed-market-trends-end-use-penetration-index-1787639603386

Where We Would Put Effort

These are among the four positions where our research anticipates prominent divergence between winners and laggards over the coming forecast period. Each is grounded in the demand model, the regulatory perimeter, and the announced capacity pipeline.
01 / COUNTABLE OUTCOME TARGETING

Sell where the farmer can count

Aquaculture grows at 13.8% against a market rate of 9.2% because survival through a whole production cycle is counted at harvest rather than inferred from feed conversion records that move for a dozen unrelated reasons at once. Pet applications grow at 11.6% because that buyer requires no verification whatsoever. Both are far easier commercial propositions than persuading a broiler producer to attribute a 3% conversion change to any single input, and both carry substantially better margins than livestock supply does.
02 / DELIVERED VIABILITY GUARANTEE

Guarantee the count at the trough

Pelleting at around 85 degrees leaves spore formers surviving near 92% while destroying most other organisms, which means counts declared at manufacture routinely bear little relation to what an animal actually ends up receiving at feeding. A supplier guaranteeing viable counts in finished feed rather than in the bag is making a claim that most competitors simply cannot match today. It also removes one genuine cause of the disappointment that has damaged this category's credibility for well over a decade now.
03 / ATTRIBUTION RISK TRANSFER

Stop asking farmers to believe trials

Only around 41% of on-farm results reproduce published trial outcomes, which means that presenting trial data as predictive simply sets up disappointment with roughly three customers in every five who try the product. Outcome linked commercial terms move the attribution risk onto the party that claims to actually believe the data. It is an uncomfortable thing to offer and it converts a discretionary trial into a standing programme, which is worth a great deal more than whatever the terms concede.
04 / MANAGEMENT PROGRAMME SELLING

The variance is not the product

Growth promoters worked regardless of housing quality and synbiotics do not, so the same product produces different outcomes in different houses and the difference lies in ventilation, water quality, stocking and health status. Bundling technical support on those variables addresses the actual source of variance rather than refining biology that already works perfectly well. It costs real field resource and it converts a 3% trial claim into a result that a producer can more often actually realise on their own animals.

Engagement Snapshot From the Field

A live engagement with an industry participant carrying material or product regulatory and market exposure ahead of a defining policy shift, showing how our research translates into a defensible multi-year portfolio strategy.
MARKET MINDS ADVISORY · CLIENT ENGAGEMENT SUMMARY
Synbiotic Animal Feed Producer Strategic Portfolio Review and Transition Roadmap 2026·Investment Scenario on Synbiotic Animal Feed Exposure Evaluation 2025-26
CLIENT PROFILE
A feed additive supplier selling synbiotic products into poultry and swine feed manufacture across European and Latin American markets, at annual revenue near 96 million euros (client-reported, unverified by MMA). Aquaculture supply was incidental and no pet channel existed, with commercial effort concentrated on published trial data. Repeat purchase had never been analysed separately from trial adoption.
STRATEGIC CHALLENGE
Trial adoption rates were reasonable while repeat purchase was poor, and revenue fluctuated with livestock feed margins in ways management found impossible to plan against. The board wanted to know whether the products worked, since the commercial pattern suggested otherwise to several directors. A portfolio review was already underway. Time was short.
MMA APPROACH
MMA compared on-farm outcomes against the client's own published trial results across customer sites, measured viable counts in finished feed following pelleting at customer mills, sized aquaculture and pet opportunities independently of livestock volume, and reviewed why accounts had lapsed. Interviews with 47 experts covered animal nutrition, feed manufacturing and aquaculture production.
KEY FINDINGS
  1. Viable counts in finished feed at several customer mills sat far below declared levels, since those mills lacked post-pelleting application equipment the products required to survive processing.
  2. Farm outcomes replicated published trial results in fewer than half of cases examined, which matched the wider category pattern rather than indicating any particular deficiency in these products.
  3. Lapsed accounts had almost universally stopped during periods of tight feed margins rather than after any dissatisfaction with observed performance, which is a measurement problem.
  4. Aquaculture and pet applications together represented a larger addressable opportunity than the livestock business, at margins between two and three times the client's current average.
CLIENT PROFILE
A feed additive supplier selling synbiotic products into poultry and swine feed manufacture across European and Latin American markets, at annual revenue near 96 million euros (client-reported, unverified by MMA). Aquaculture supply was incidental and no pet channel existed, with commercial effort concentrated on published trial data. Repeat purchase had never been analysed separately from trial adoption.
STRATEGIC CHALLENGE
Trial adoption rates were reasonable while repeat purchase was poor, and revenue fluctuated with livestock feed margins in ways management found impossible to plan against. The board wanted to know whether the products worked, since the commercial pattern suggested otherwise to several directors. A portfolio review was already underway. Time was short.
MMA APPROACH
MMA compared on-farm outcomes against the client's own published trial results across customer sites, measured viable counts in finished feed following pelleting at customer mills, sized aquaculture and pet opportunities independently of livestock volume, and reviewed why accounts had lapsed. Interviews with 47 experts covered animal nutrition, feed manufacturing and aquaculture production.
KEY FINDINGS
  1. Viable counts in finished feed at several customer mills sat far below declared levels, since those mills lacked post-pelleting application equipment the products required to survive processing.
  2. Farm outcomes replicated published trial results in fewer than half of cases examined, which matched the wider category pattern rather than indicating any particular deficiency in these products.
  3. Lapsed accounts had almost universally stopped during periods of tight feed margins rather than after any dissatisfaction with observed performance, which is a measurement problem.
  4. Aquaculture and pet applications together represented a larger addressable opportunity than the livestock business, at margins between two and three times the client's current average.
RECOMMENDED STRATEGY
Phase 1: Phase one: reformulate onto spore forming strains where performance permits, so products survive pelleting at customer mills without special equipment. Phase 2: Phase two: build aquaculture and pet channels deliberately, where outcomes are countable or verification is not required by the buyer at all. Phase 3: Phase three: offer outcome linked terms on livestock programmes, moving attribution risk to the party who actually believes the trial data.
OUTCOME
The supplier reformulated its main livestock products onto spore forming strains during 2026 and opened an aquaculture channel in Latin America (client-reported, unverified by MMA). Repeat purchase improved on the reformulated products, and outcome linked terms were piloted with two integrators. Livestock promotional spending was reduced and redirected accordingly.

Frequently Asked Questions

Foundational context covering the market sizes, CAGR, scope, country, region and competition that inform every finding below. This section is provided to cover basics and most often pre-purchase conversations, answered from the MMA Primary Research Dataset.

What is the current size of the Synbiotic Animal Feed Market?

MMA sizes it at USD 1.42 billion in 2025, rising to USD 1.55 billion in 2026. The figure covers combined probiotic and prebiotic feed products at supplier selling value across all species.

How large will the Synbiotic Animal Feed Market be by 2036?

USD 3.74 billion by 2036, an incremental USD 2.19 billion over the 2026 base and an expansion multiple of 2.41 times. Aquaculture accounts for a disproportionate share of that growth.

What is the CAGR for the Synbiotic Animal Feed Market 2026 to 2036?

9.2% in the base case, with a bull case at 10.4% and a bear case at 8.0%. The spread turns largely on whether on-farm measurement improves enough to support attribution.

Which segment is growing fastest?

Aquaculture at 13.8%, half again the market rate of 9.2%. Survival through a production cycle is counted at harvest rather than inferred, which removes the attribution problem entirely.

Who are the major companies in the Synbiotic Animal Feed Market?

DSM-Firmenich, Novonesis, Alltech, Lallemand Animal Nutrition and Cargill lead on product volume supplied. Fifteen further participants are profiled in the full report on that basis.

Which country is growing fastest?

Ecuador at 15.2%, as shrimp production expands while export buyers impose antibiotic restrictions considerably stricter than local regulation requires of producers. Harvest counts settle the argument locally.

Report Segmentation Architecture

The full report scope spans multiple orthogonal segmentation dimensions, with cross-tabulated demand data provided for each dimension pair. Coverage extends further to regional breakdowns, trend trajectories, and the competitive detail needed to support segment-level decision-making.

By Target Species

  • Poultry
  • Swine
  • Aquaculture
  • Ruminants
  • Pet and Companion Animals
  • Equine and Other Species

By End-Use Industry

  • Commercial Poultry Production
  • Commercial Pig Production
  • Aquaculture and Hatcheries
  • Dairy and Beef Production
  • Pet Food Manufacture
  • Equine and Specialist Livestock

By Commercial Dimension

  • Feed Mill Supply Contracts
  • Direct Farm and Integrator Supply
  • Premix and Blender Channels
  • Distributor and Dealer Networks
  • Pet Food Manufacturer Supply
  • Export and Cross-Border Supply

By Region

  • North America
  • Western Europe
  • East Asia
  • South Asia and Pacific
  • Latin America
  • Middle East and Africa
  • Eastern Europe

Scope, Methodology, and Coverage

Every figure in this report is reproducible from documented input assumptions. The scope below maps the historical period, the forecast horizon, the segmentation dimensions, and the countries covered, alongside the underlying primary and qualitative methodology.
Historical Period
2020 to 2025
Forecast Period
2026 to 2036
Base Year
2025 (USD billions; MMA Primary Research Dataset, August 2026)
Market Definition
Combined probiotic and prebiotic feed products supplied for animal nutrition, covering poultry, swine, aquaculture, ruminant, pet and equine applications. Measured at supplier selling value for products containing both live microbial cultures and fermentable substrates supplied together. Standalone probiotics or prebiotics sold separately, enzymes, phytogenic additives, medicated feed additives, complete compound feed, and silage inoculants are excluded from scope.
Quantitative Units
USD billions (current prices); thousand tonnes supplied; USD per kilogram by species application
Segmentation Dimensions
Target species; end-use industry; commercial dimension; region
Regions Covered
North America, Western Europe, East Asia, South Asia and Pacific, Latin America, Middle East and Africa, Eastern Europe
Countries Covered
United States, Canada, Mexico, Netherlands, Germany, France, Spain, Denmark, China, Japan, South Korea, India, Vietnam, Thailand, Indonesia, Brazil, Ecuador, Chile, Egypt, Poland
Key Companies Profiled
DSM-Firmenich, Novonesis, Alltech, Lallemand Animal Nutrition, Cargill, Kemin Industries, Adisseo, ADM Animal Nutrition, Novus International, Lesaffre, Evonik, Beneo, Nutreco, Phibro Animal Health, Asahi Biocycle, Angel Yeast, Guangdong VTR Bio-Tech, Orffa, Biorigin, Provita Eurotech
Quantitative Methodology
Primary survey, n=3,800 respondents, Q4 2025, six countries; demand-side model with trade association cross-validation
Qualitative Methodology
47 expert interviews, Q4 2025; applied to validate demand model assumptions, identify emerging dynamics, and assess competitive positioning
Report Format
PDF and XLSX data workbook (Word format preview document)
Publisher
Market Minds Advisory
Report Code
MMA-2026-AGR-196
Published
August 2026
Contact
sales@marketmindsadvisory.com | www.marketmindsadvisory.com

Purchase the full Synbiotic Animal Feed Market Report (2026 to 2036).

The full report treats attribution as the central commercial problem in this category, because producers who cannot observe a result cut the spend first whenever margins tighten. It sizes all six species segments independently through 2036, compares on-farm outcomes against published trial results, and measures viable counts delivered in finished feed against those declared at manufacture. Regional chapters cover all seven regions with aquaculture and terrestrial adoption separated throughout. Competitive profiling covers 20 participants on one consistent volume basis. Repeat purchase is analysed separately from trial adoption.
Six species segments sized independently through 2036
On-farm outcomes compared against published controlled trial results
Delivered viability measured against counts declared at manufacture
Aquaculture and terrestrial adoption analysed separately by region
Registration status mapped by strain across major feed markets
Twenty participants profiled on one consistent product volume basis

Built For The People Who Decide

From boardroom strategy to bench-side execution, this report is read cover-to-cover by leaders shaping the next decade of their industry, turning demand scenarios, market dynamics and valuation benchmarks into decisions.
CXOs/ Presidents/ VPs/ Managers
M&A and Corporate Development
Strategy Teams and R&D Heads
Procurement and Product Directors
Regulatory and Compliance Leaders
Investor Relations and Equity Analysts