Market Minds Advisory
Sustainable Mining Technologies Market

Sustainable Mining Technologies Market: Two Budgets, Two Buyers, One Sales Pitch

Half of this market is bought to protect a permit and half is bought to lower a cost, and the vendors who cannot tell which conversation they are in lose both of them.

Lead Analyst

David Horsley

Published

September 2026

Make Smarter Decisions with Customized Research Insights

Request a free sample report and evaluate market opportunities, growth trends, and competitive dynamics relevant to your business needs.

2025 MARKET VALUE$12.8BMarket Size 2025
2036 FORECAST VALUE$38.8BBase Case , 2026 to 2036
CAGR 2026 TO 203610.6 %Bull 11.9% / Bear 9.3%
INCREMENTAL OPPORTUNITY$24.6BNet 10- year value creation
EXPANSION MULTIPLE2.74x2036 value over 2026 base
Strategic Levers
M&A Pipeline
Regional Outlook
Country Rankings
Competitive Intelligence
Segmental Deep-dive
Call-Us : 91 93563 13602

Executive Snapshot and Market Trajectory

This market runs on two entirely separate budgets. Tailings and water technology is bought to protect a permit, justified against a delay costing around 1.2 million dollars a day, and approved by people with no return threshold. Ore sorting and electric haulage are bought to lower operating cost.
Growth runs at 10.6% and electrification leads it. Battery-electric and trolley-assist haulage grows at 15.9%, exactly 1.50 times the market rate, because diesel accounts for 42% of site emissions and the technology now pays back on ventilation and fuel alone underground. Latin America holds 26%, far outside band, since Chilean water scarcity and Brazilian tailings regulation are the sharpest constraints anywhere. Reference installations decide who even gets shortlisted.
Concentration is very low at 24% across the top five measured on technology revenue, and the disciplines involved explain it. Filtration, water treatment, electrification, and sensor-based sorting share almost no engineering, and very few suppliers credibly serve more than two of them at once. Mines carry integration risk across suppliers who have never worked together before. Nobody has offered to take it from them. That gap is where the best margin sits.
Market Definition
This market covers technologies supplied to mining operations to reduce environmental impact and secure operating permission, spanning tailings filtration and dry stacking systems, mine water treatment and recycling systems, battery-electric and trolley-assist haulage, renewable microgrids and mine electrification infrastructure, and ore sorting and waste rejection systems. Conventional mining and processing equipment without an environmental function, mine automation systems, environmental consulting and permitting services, carbon offset purchasing, and closure financial provisioning fall outside scope.
Base Year Value
$12.8B in 2025 (MMA Primary Research Dataset, August 2026)
Forecast Period
2026 to 2036, eleven discrete annual values
CAGR
10.6% base case. Bull 11.9%. Bear 9.3%.
Fastest Growth Segment
Battery-Electric and Trolley-Assist Haulage: 15.9% CAGR
Fastest Growth Country
Chile: 13.8% CAGR
Fastest Growth Region
South Asia and Pacific: 12.6% CAGR
Largest Region
Latin America: 26% of 2025 global value
Market Leaders
Metso, FLSmidth, Weir Group, Epiroc, Veolia Water Technologies. Source: MMA Analysis based on company annual reports.
Primary Survey
n=3,800 procurement and R&D decision-makers, Q4 2025, six countries
Methodology
Demand-side build-up, cross-validated against public data, 47 expert interviews

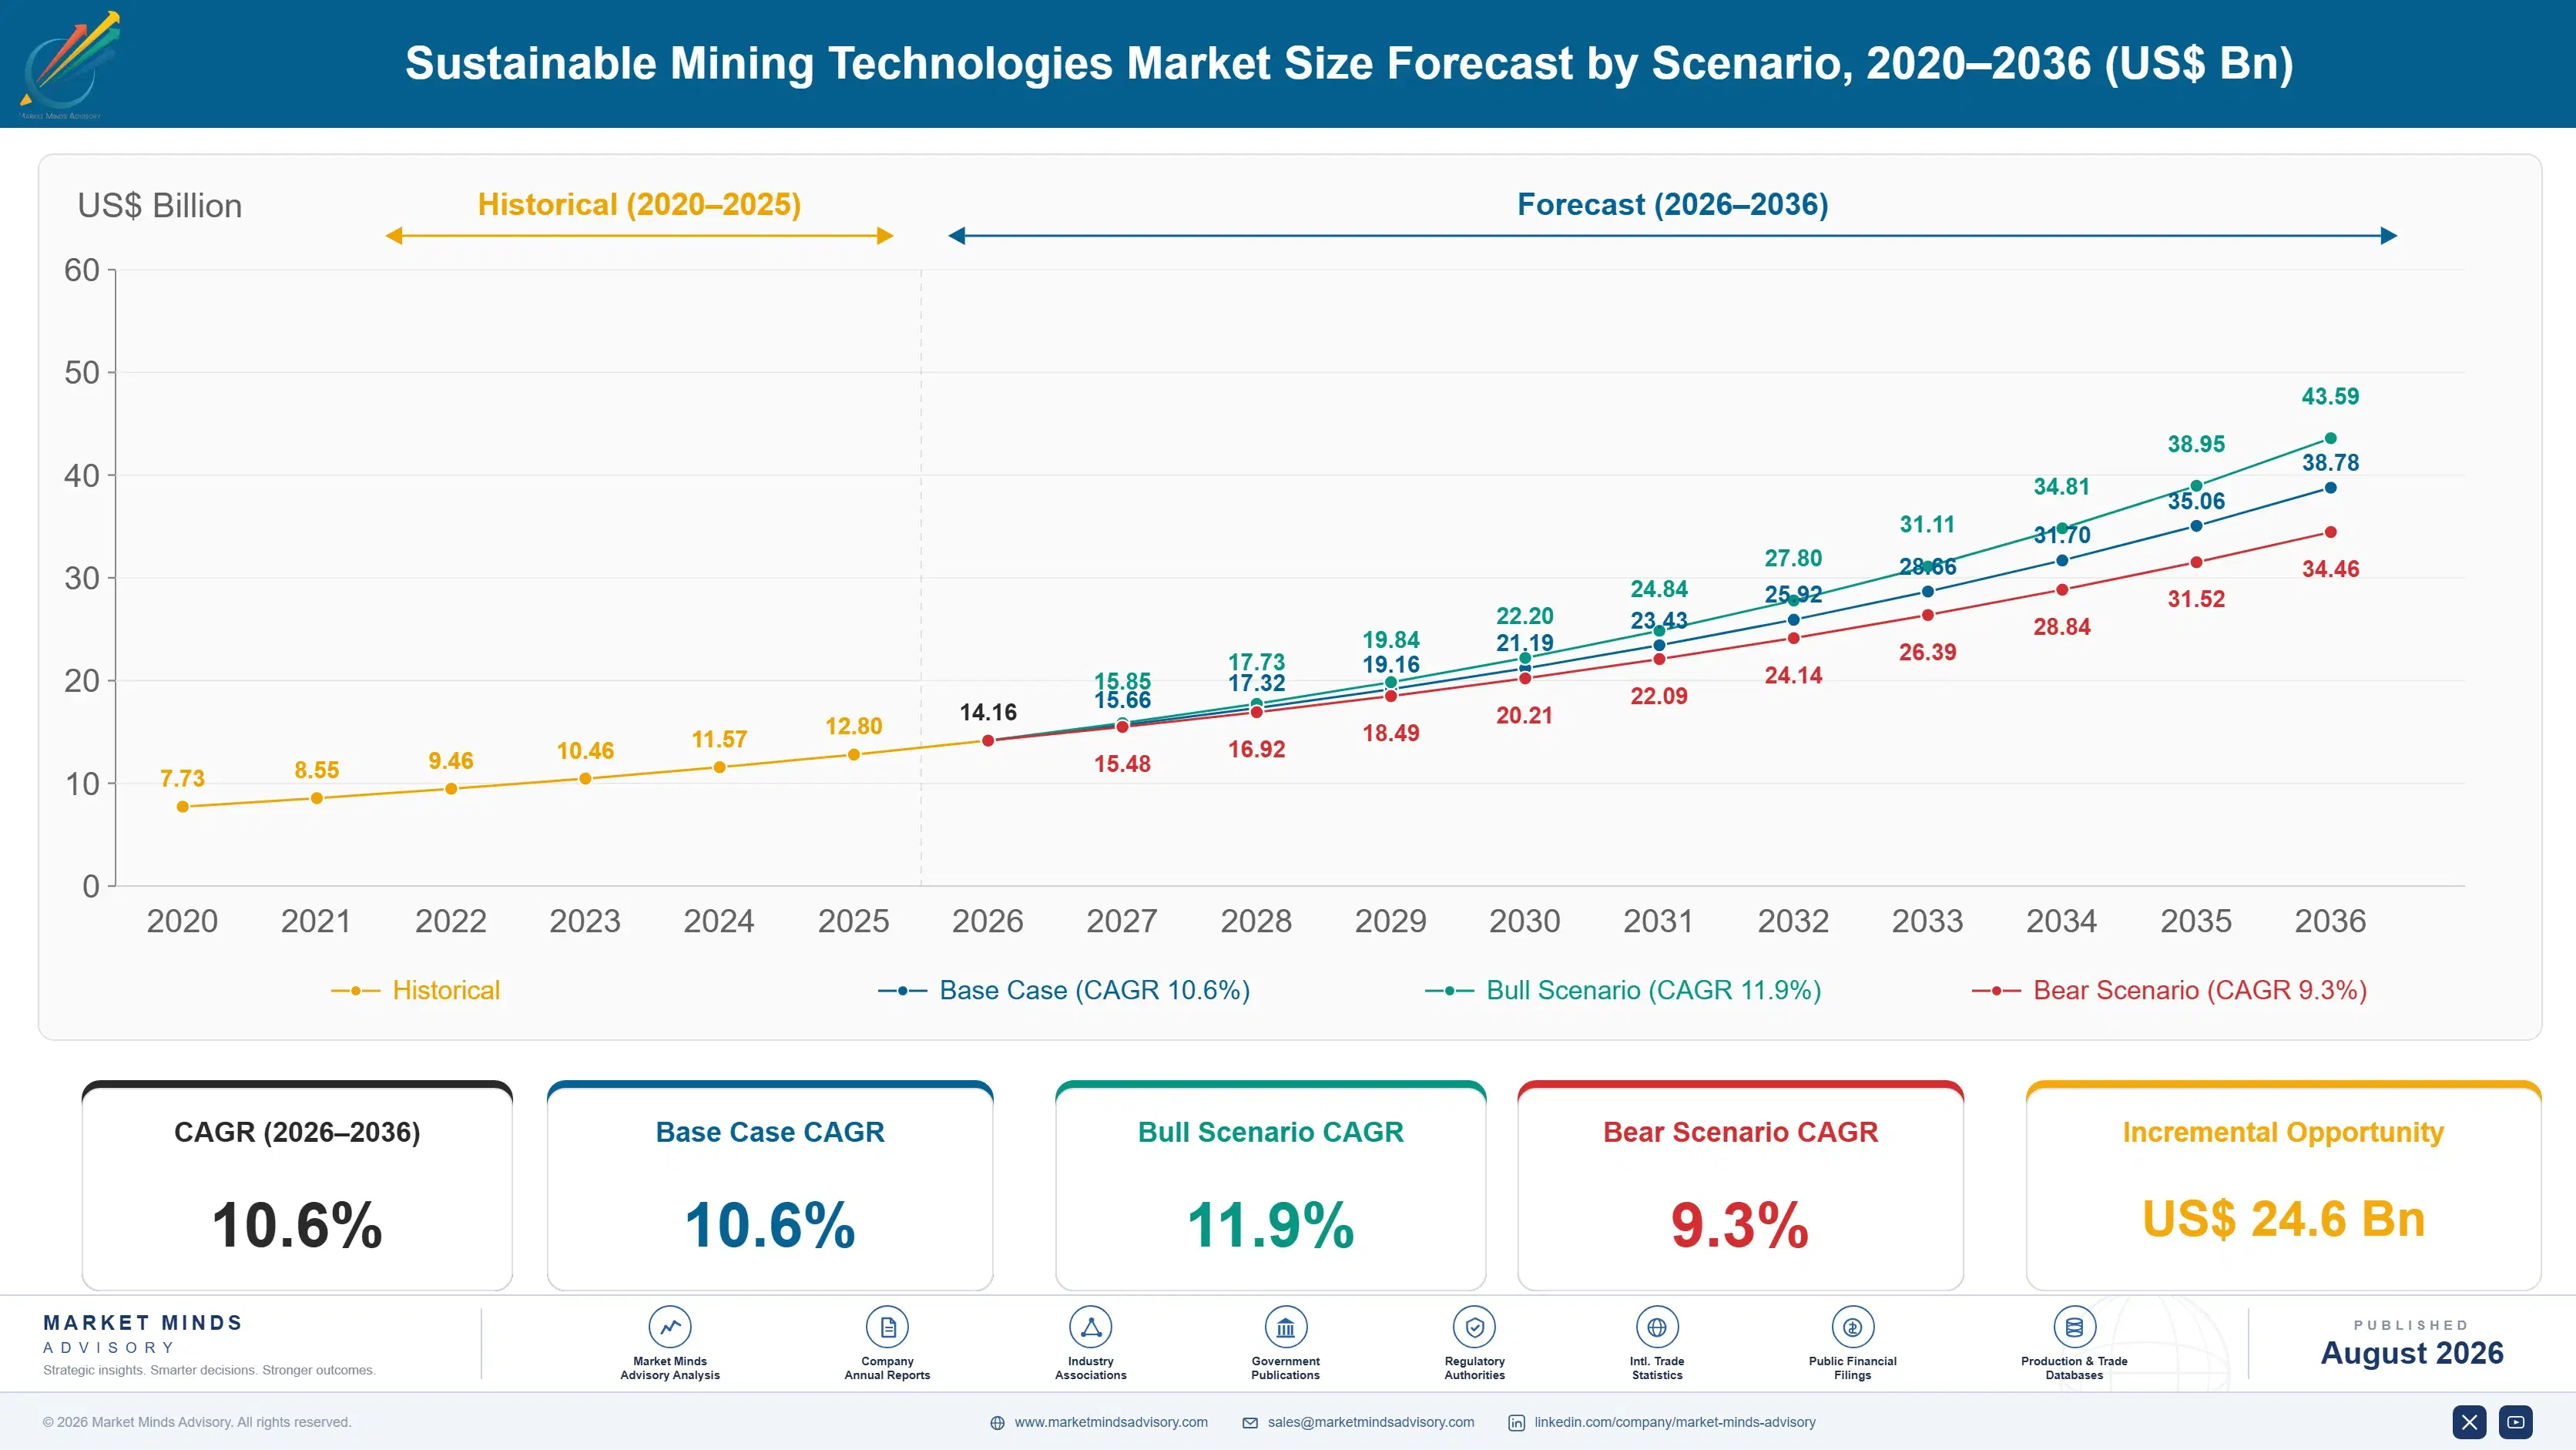
Sustainable Mining Technologies Market Forecast Scenarios

sustainable-mining-technologies-market-size-forecast-scenario-1787302788784
The 2020 to 2025 period ran at 9.2% and tailings dominated the early spending. Dam failures earlier in the decade turned tailings management from an engineering line item into a board-level solvency question, and the industry standard published afterwards made filtered deposition an expectation on new permits rather than an option. Water treatment followed on drought conditions across Chile and southern Africa.
Three mechanisms carry the 10.6% base case. Permit conditions on tailings and water are the largest, since they are conditions of operating rather than investments with a return. Underground electrification is the second, at 15.9%, where ventilation savings make the economics work without any environmental argument. And ore sorting is the third, rejecting waste before it consumes milling energy and water. Renewable microgrid demand follows all three without leading any of them.
The 11.9% bull case rests on surface electric haulage reaching cost parity faster than currently projected, which would convert the largest single diesel consumption on any mine site. The 9.3% bear case is a commodity price downturn deferring capital, since compliance spending survives a downturn and everything justified on operating cost does not. Portfolio balance between the two budgets therefore decides revenue stability entirely.

Permit Money And Payback Money

Two quite different businesses share one label here. Tailings filtration and water treatment are bought because an operation cannot get or keep a permit without them, and the comparison is against a delay that costs around 1.2 million dollars a day at a large mine rather than against any return on capital. Ore sorting and electric haulage are bought because they lower operating cost, and they face a hurdle rate like any other project.
TOP FIVE CONCENTRATION24%Very fragmented, since separate disciplines rarely share a single supplier
DRY STACKING ADOPTION RATE38%Of newly permitted tailings facilities using filtered deposition instead
WATER RECYCLING RATE ACHIEVED84%Of process water recovered at leading operations across the industry
DIESEL EMISSIONS SHARE42%Of site emissions from haulage and other mobile equipment
PERMIT DELAY COST1.2 millionPer day of deferred production at a large mining operation
ORE SORTING WASTE REJECTION31%Of feed removed before milling at suitable orebodies today
Those two purchases are approved by different people. Compliance technology is sponsored by permitting, sustainability, and legal functions with authority derived from risk rather than from returns, while economic technology competes against every other capital request an operations team has. Vendors who pitch payback to a permitting sponsor sound irrelevant, and vendors who pitch licence to operate to an operations manager sound evasive.
The disciplines barely overlap, which is why concentration sits at just 24%. Filtration and dewatering, membrane water treatment, battery and trolley electrification, and sensor-based sorting draw on entirely separate engineering, and very few suppliers serve more than two of them convincingly. Mines integrate across that gap themselves, generally without much help.
"A client asked us to build the business case for a filtered tailings plant. There is no business case. There is a permit, and without the plant there is no mine. Those are different documents and the finance team kept asking for the wrong one."
Director, Mining Technology and Environmental Systems Practice · MMA Industrial

Market Trends

Filtered Tailings Move From Option To Expectation

Dam failures turned tailings from an engineering question into a board-level solvency question, and the industry standard published afterwards made filtered dry stacking the default assumption on newly permitted facilities rather than one option among several. Adoption on new permits now sits near 38%. Filtration is capital and energy intensive and does not pay back in any conventional sense, which is precisely why the sponsoring function inside the mine is never operations. Suppliers who present delay risk rather than payback are writing the paper the sponsor needs. Finance departments keep asking for the other one.
Market Impact: Delay costs 1.2 million daily

Underground Electrification Pays Back On Ventilation Alone

Diesel equipment underground requires ventilation air that costs enormous amounts of electricity to move and cool, and removing the diesel removes most of that requirement. Battery-electric haulage grows at 15.9% against 10.6% for the market because the ventilation saving alone clears a hurdle rate before any emissions argument is made. Surface haulage is a different calculation entirely and has not yet reached the same position anywhere. Battery energy density and charging time still constrain surface duty cycles considerably. Trolley assist has proven the more practical route on long uphill hauls. Several operations run it already.
Market Impact: Recycling reaches 84% of water

Market Opportunities and Growth Drivers

Permit Delay Costs Dwarf The Technology Involved

A deferred permit at a large operation costs around 1.2 million dollars a day in delayed production, which makes almost any tailings or water technology cheap by comparison. That arithmetic is why compliance spending survives commodity downturns while operating cost projects do not. Suppliers who quantify delay risk rather than payback are speaking the language the sponsoring function inside the mine actually uses in its own approvals. Compliance spending consequently survives commodity downturns that defer every operating cost project. That asymmetry shapes revenue stability across this market. Very few suppliers balance the two deliberately.
Market Impact: Delay costs 1.2 million per day

Water Scarcity Forces Recycling Rates Ever Higher

Leading operations now recover around 84% of process water, and in Chile, Peru, and southern Africa the alternative is desalination and pumping from the coast at costs that dwarf any treatment plant. Water is increasingly allocated by regulators and communities rather than purchased, which converts a utility cost into a production constraint. Recycling technology therefore competes against lost tonnes rather than against water tariffs. Chilean operations now assess recycling against lost production rather than against any water tariff. That reframing changes the approval threshold entirely. Regulators and communities allocate the resource.
Market Impact: Top five hold just 24% share

Market Restraints and Challenges

Compliance And Economic Spending Reach Different Buyers

Tailings and water technology is sponsored by permitting and sustainability functions while sorting and electrification compete for operations capital, and the root cause is that one is a condition of operating and the other is an investment. Commercial impact is that vendors pitching the wrong argument lose to competitors who understood the room. Mitigation runs through mapping the sponsoring function before quoting, separate commercial materials for each, and honest positioning about which budget the technology belongs to. Establishing which room a proposal is entering should precede every quotation and rarely does. Most suppliers use one set of materials.
Market Impact: Dry stacking reaches 38% of permits

Discipline Fragmentation Leaves Mines Integrating Alone

Filtration, membrane treatment, electrification, and sensor sorting share almost no engineering, and the root cause is simply that they solve unrelated physical problems. Commercial impact is that concentration sits at 24% and the mine carries integration risk across suppliers who have never worked together. Mitigation runs through engineering partnerships between complementary vendors, integrated packages assembled by study engineers, and suppliers accepting scope beyond their own equipment boundary. A vendor accepting scope beyond its own equipment boundary removes a risk the customer absorbs unpaid. Very few will do it. Those that do get asked to quote packages nobody else sees.
Market Impact: Electric haulage grows at 15.9%
3 additional market trends, 4 additional growth drivers, and 2 additional restraints and challenges are covered in the full report. Contact sales@marketmindsadvisory.com to access the complete intelligence.

Segment CAGR and Growth Architecture

Segmentation follows the technology system and the impact it addresses, because each has a distinct engineering discipline, sponsoring function inside the mine, capital profile, and justification basis. Commodity mined and mine type both cut across every system rather than separating them, which makes either weaker as a primary dimension here. Each system reaches a different budget entirely.
sustainable-mining-technologies-market-market-share-analysis-1787302789361

Battery-Electric And Trolley-Assist Haulage

The fastest system at 15.9%, exactly 1.50 times the market rate, covering battery-electric loaders and trucks underground alongside trolley-assist and dynamic charging infrastructure on surface haul roads. Underground economics work on ventilation savings alone, since removing diesel removes the air volume that has to be moved and cooled. Surface haulage is a different problem where battery energy and charging time still constrain duty cycles, and trolley assist has proven the more practical route on long uphill hauls at several operations already. Charging infrastructure tends to suit one manufacturer, which makes the first fleet decision considerably stickier than it looks. Operators rarely appreciate that at the outset. First fleet decisions are stickier than they look.
CAGR 15.9%

Tailings Filtration And Dry Stacking Systems

Second fastest at 12.4%, covering filter presses, thickeners, conveying, and stacking equipment that produce a deposited tailings mass rather than a stored slurry behind a dam. Adoption on newly permitted facilities sits near 38% and rises with each regulatory review. The technology is capital intensive, energy intensive, and does not pay back in any conventional sense, which is exactly why it is sponsored by permitting and legal functions rather than by anybody with an operating budget to protect. Mines will not pioneer a technology on a permit-critical facility, which makes reference installations decisive here. New entrants find that barrier almost impassable. Operating data is the only currency. Nothing else persuades a permitting sponsor.
CAGR 12.4%
Full segment breakdown across 5 segments available in the complete report.

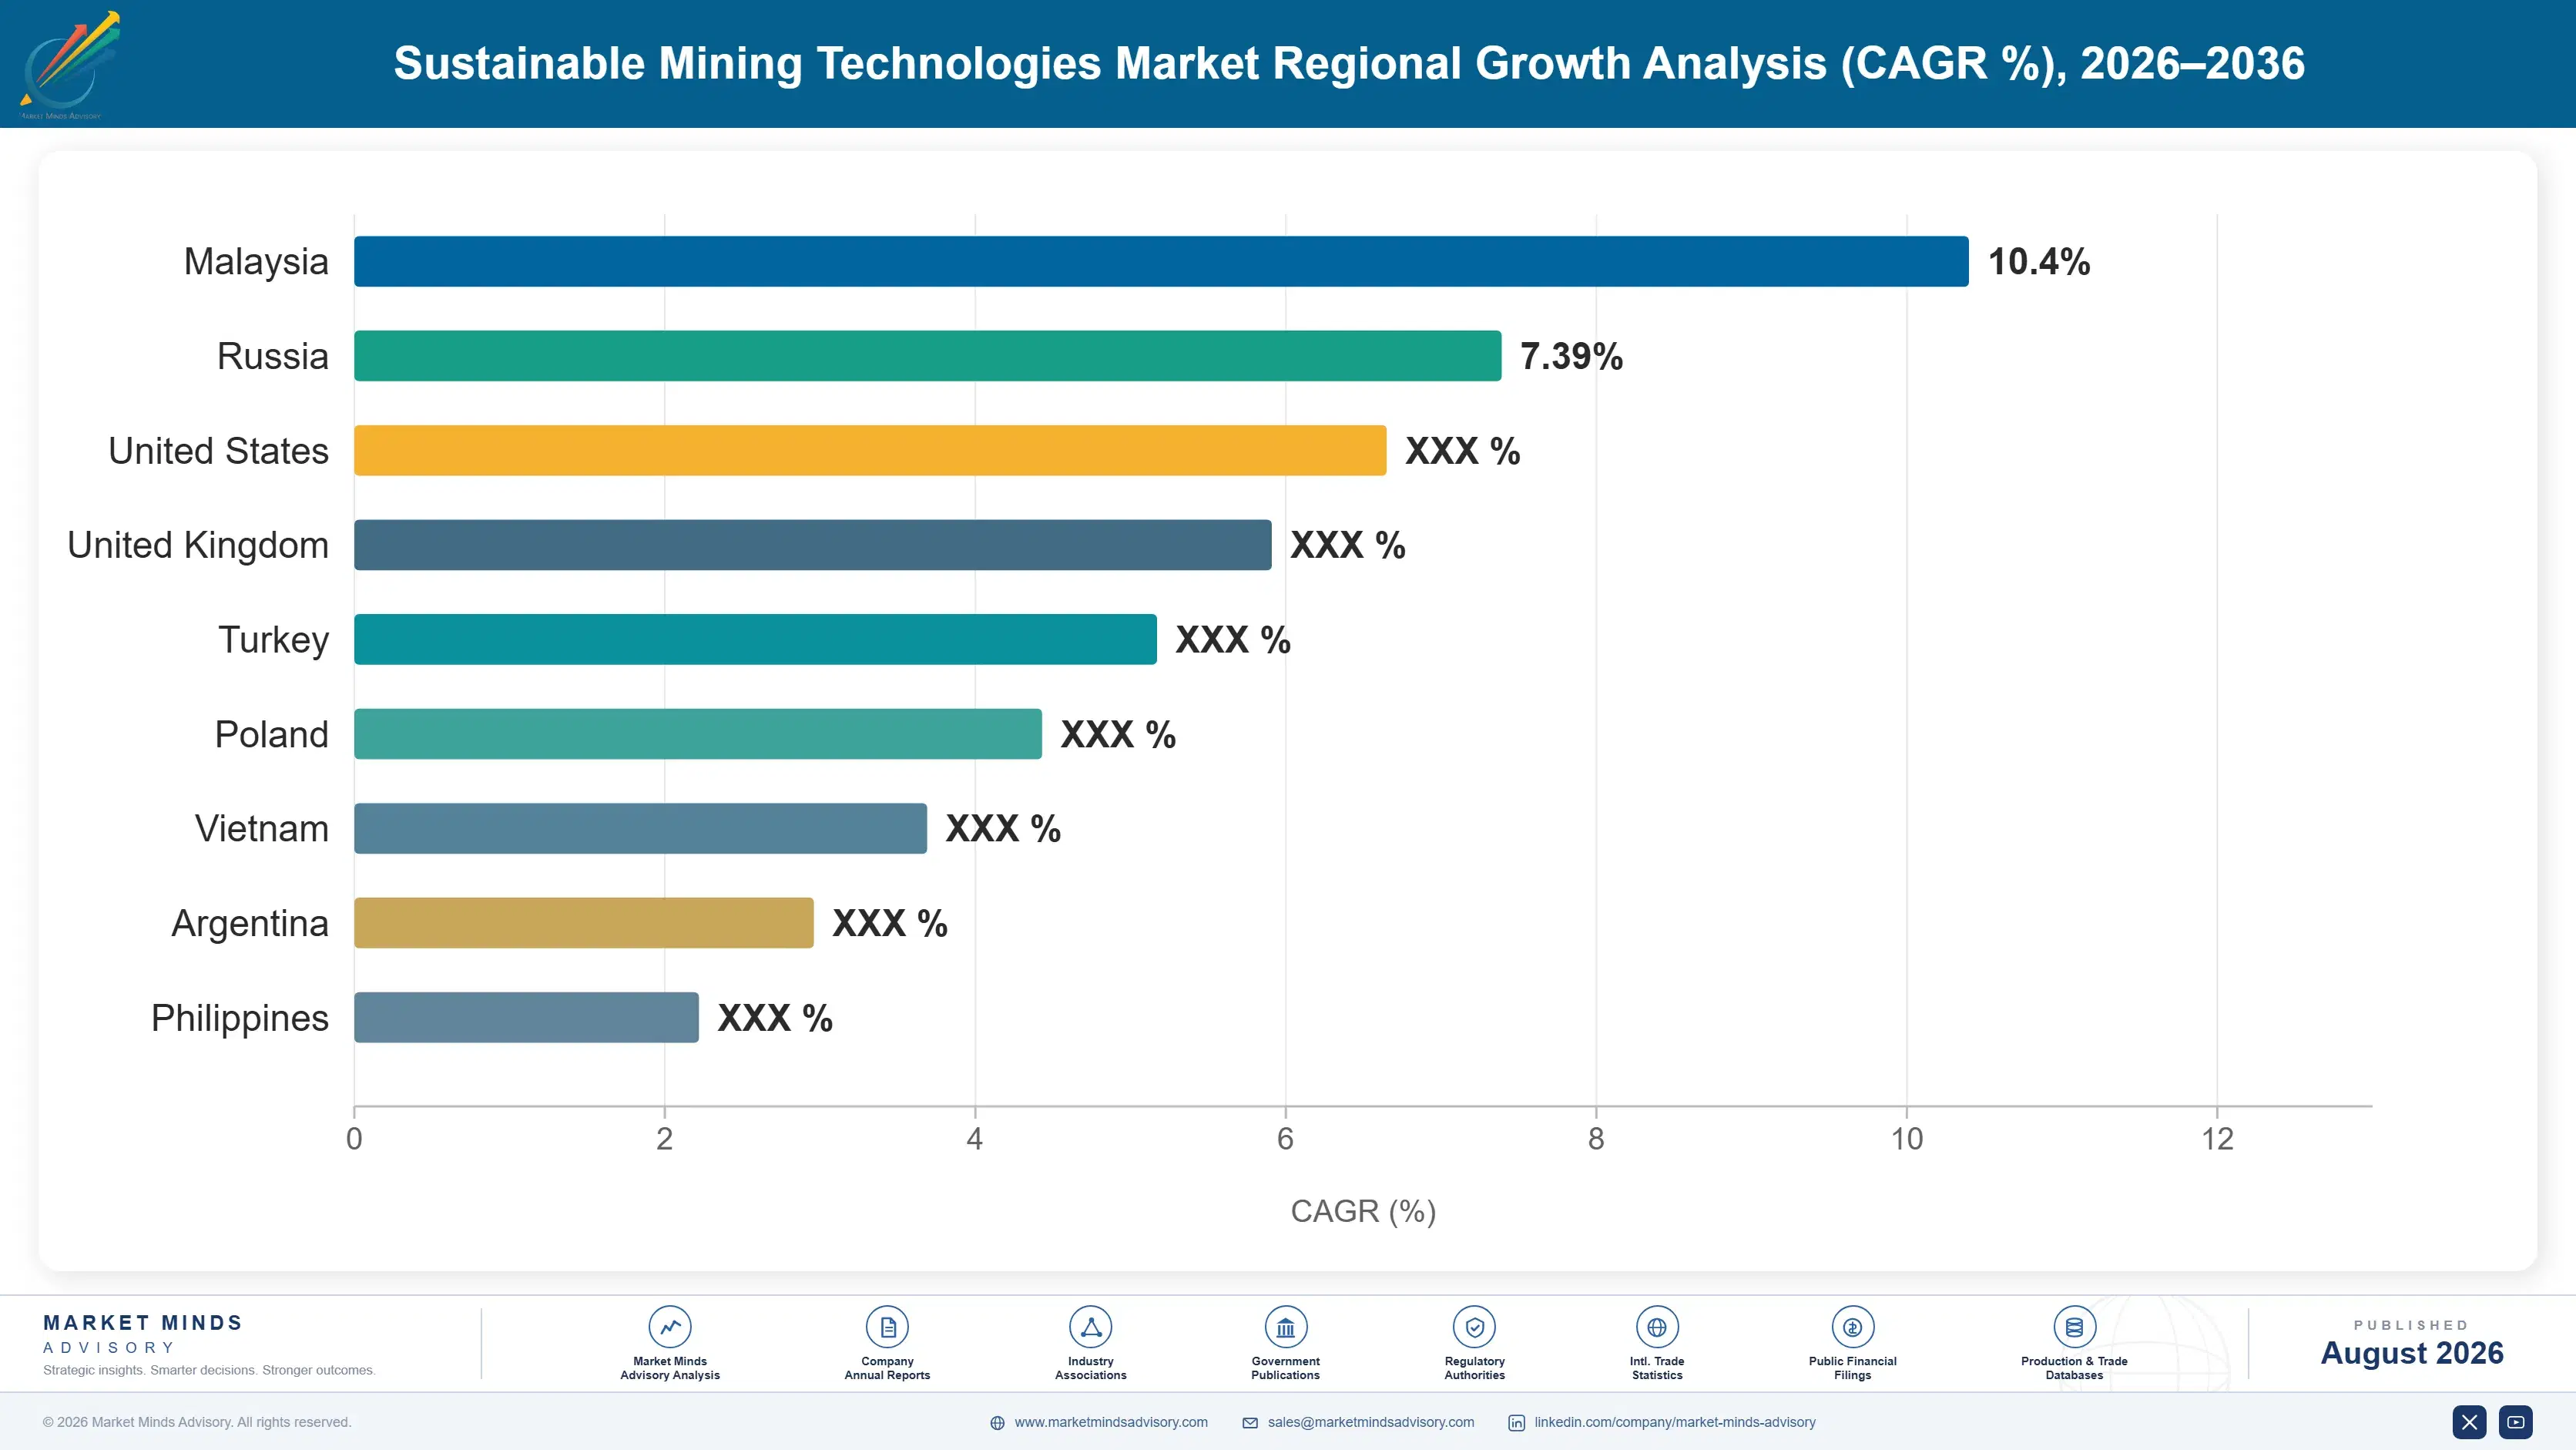
Regional Architecture and Country Demand Map

Latin America leads at 26%, far outside band, because Chilean water scarcity and Brazilian tailings regulation are the sharpest constraints anywhere. South Asia and Pacific follows on electrification. Chile grows fastest. Six regional shares sit outside their framework bands. Orebody geography and regulatory pressure explain them.

Latin America

Twenty-six percent, far outside the framework band, and justified because Chilean copper faces the most acute mining water constraint anywhere while Brazilian tailings regulation became the strictest in the world after successive dam failures. Peruvian operations carry social licence pressure that makes water and tailings performance a condition of continued production rather than a compliance matter. Desalination and coastal pumping set the alternative cost for water. Growth at 11.3% runs above the market rate on both constraints simultaneously. Reference installations built here on water and tailings now travel outward, since operations elsewhere want evidence from the hardest conditions available. That gives regional suppliers an unusual reach. Hard conditions produce valuable evidence.
Share: 26% | CAGR: 11.3% (2026 to 2036)

South Asia and Pacific

Twenty-two percent, far outside the framework band, and Australian operations lead global mine electrification while carrying closure and rehabilitation obligations enforced more rigorously than almost anywhere. Underground gold and base metal mines have deployed battery-electric fleets at production scale rather than in trials. Indian and Indonesian operations are adding water and tailings technology from a lower base under tightening regulation. Growth at 12.6% leads every region, carried by electrification and Australian closure obligations together. Australian closure obligations are financially provisioned and enforced, which makes rehabilitation technology a balance sheet question rather than a discretionary one. Very few jurisdictions enforce closure that rigorously. The difference shows in spending. Provisioning makes it unavoidable.
Share: 22% | CAGR: 12.6% (2026 to 2036)
Regional intelligence for 5 additional markets available in the complete report: North America, Middle East and Africa, East Asia, Western Europe, Eastern Europe. Contact sales@marketmindsadvisory.com.
sustainable-mining-technologies-market-country-cagr-analysis-1787302789884

Know Which Budget You Are In

Permit delay costs around 1.2 million dollars daily, dry stacking reaches 38% of new permits, recycling hits 84%, and electric haulage grows at 15.9%. Value comes from identifying the sponsoring function, from quantifying delay risk, and from integration across disciplines nobody else spans. Technology capability decides remarkably little of it. Knowing the room decides most of it.

Identify The Sponsoring Function Before Quoting Anything

Tailings and water technology is sponsored by permitting and sustainability functions with authority derived from risk, while sorting and electrification compete for operations capital against a hurdle rate. Vendors pitching payback to a permitting sponsor sound irrelevant, and vendors pitching licence to operate to an operations manager sound evasive. A delay costing around 1.2 million dollars a day is the comparison one buyer uses and the other never mentions at all. Establishing which room the proposal is entering should precede every quotation and almost never does. Most suppliers use one set of materials for both.
Market Impact: Delay costs some 1.2 million dollar

Quantify Delay Risk Rather Than Return On Capital

Compliance technology has no return in any conventional sense, and building a payback case for a filtered tailings plant produces a document nobody in the approval chain wanted. The comparison the sponsor actually uses is deferred production against permit risk, at around 1.2 million dollars a day for a large operation. Suppliers who present that arithmetic are writing the paper the sponsor needs rather than the one finance requested. Filtered deposition now appears on 38% of newly permitted facilities and rises with each regulatory review. Nobody in the approval chain wanted a payback model.
Market Impact: Dry stacking now reaches 38% of new

Lead Underground Electrification With Ventilation Economics

Removing diesel underground removes the air volume that must be moved and cooled, and that saving alone clears a hurdle rate before any emissions argument is made. Battery-electric haulage grows at 15.9% against 10.6% for the market on exactly that basis. Suppliers leading with emissions reduction are making the weaker case to an operations audience that has a ventilation power bill in front of it every single month. Diesel accounts for 42% of site emissions, and that is the weaker argument to an operations audience. The power bill arrives every month. The emissions report arrives once a year.
Market Impact: Electric haulage now grows at 15.9%

Accept Integration Scope Across Discipline Boundaries

Filtration, water treatment, electrification, and sorting share almost no engineering, concentration sits at 24%, and the mine ends up carrying integration risk across suppliers that have never worked together before. A vendor accepting scope beyond its own equipment boundary removes a risk the customer is currently absorbing unpaid. Very few do it, and those that do win packages that pure equipment suppliers are never asked to quote. Filtration, water treatment, electrification, and sorting solve entirely unrelated physical problems. No supplier serves more than two of them convincingly. The mine ends up bridging that gap alone.
Market Impact: Top five hold only 24% of all reven

Who Controls the Margin Pool

Concentration is very low at 24% across the top five measured on technology revenue, and discipline fragmentation rather than any competitive dynamic explains it. Filtration and dewatering, membrane water treatment, battery and trolley electrification, and sensor-based sorting solve unrelated physical problems using unrelated engineering, and very few suppliers serve more than two of them convincingly. The leader to challenger gap is meaningful only within a single discipline.
Competitive activity runs on three fronts. Sponsoring function access is the first and the least visible, since compliance and economic technologies reach entirely different budgets and approval chains. Reference installations are the second, because mines will not pioneer a technology on a permit-critical facility. And integration scope is the third, where the customer currently absorbs risk that nobody has offered to take.

Pressure arrives from two directions. Mining equipment manufacturers have added electrification and are competing against specialists on fleet relationships. And Chinese suppliers serve domestic tailings and water demand at costs international vendors cannot match. Rankings shift on reference projects rather than on technology claims. Neither pressure reaches integrated multi-discipline packages, since almost nobody will accept scope across engineering boundaries they do not own. That work is barely contested at all.
sustainable-mining-technologies-market-company-positioning-matrix-1787302790413

Competitive Moat and Risk Dimensions

METSO

Moat: Filtration scale and reference installations

Large filtration and dewatering installations across permitted tailings facilities give reference operating data that mines require before committing a permit-critical facility to any supplier. Process knowledge across thickening, filtration, and stacking spans a boundary most equipment vendors do not. Both accumulate with each installation rather than with capital investment.
METSO

Risk: Compliance demand follows regulation

Tailings technology demand is created by permit conditions rather than by mine economics, which makes it dependent on regulatory momentum that could slow as easily as it accelerated. Adoption at 38% of new permits reflects a standard published after failures rather than any settled consensus. Regulatory attention moves and the sponsoring budget moves with it.
FLSMIDTH

Moat: Process breadth across two disciplines

Positions across thickening, filtration, and water treatment let a supplier take integrated scope that spans two disciplines a mine would otherwise contract separately, removing an integration risk the customer currently carries unpaid. Sustainability-focused product positioning reaches the permitting sponsors who approve this spending. Both advantages address the fragmentation that defines this market.
FLSMIDTH

Risk: Limited electrification and sorting position

Battery-electric haulage grows at 15.9% and sensor-based sorting sits in an unrelated engineering discipline, and a processing-weighted position participates in neither. Those are also the technologies justified on operating cost rather than permits, which reach a different and larger budget. Building either capability means entering a field with established specialists.

Players Tracked

Prominent Players

Metso
FLSmidth
Weir Group
Epiroc
Veolia Water Technologies

Other Key Players

Caterpillar
Komatsu
Sandvik
ABB
Schneider Electric
TOMRA
Steinert
Andritz
Thyssenkrupp Polysius
Xylem
Ausenco
Wood
Aggreko
juwi
Normet

Recent Developments

JANUARY 2025

Regulator conditions new permit on filtered tailings deposition

A national mining regulator made filtered dry stack deposition a condition of a new tailings facility permit, declining a conventional slurry impoundment design that the operator had submitted. The decision was a permitting condition rather than any legislative change, enforcement action, or dispute with the operator.
Signal: Filtered deposition is now becoming a perm
APRIL 2025

Underground operation converts fleet on ventilation economics

An underground base metals operation replaced its diesel loading and hauling fleet with battery-electric equipment, justifying the conversion entirely on reduced ventilation power and cooling rather than on any emissions consideration. The decision was an internal operating cost case rather than any corporate sustainability commitment.
Signal: Ventilation savings clear an operations hu
AUGUST 2025

Copper operation raises water recycling above regional requirement

A Chilean copper operation increased process water recovery beyond its regulatory requirement after modelling showed that water allocation rather than tariff would constrain production within the decade. The investment was a production security decision rather than any compliance obligation or community agreement. Allocation rather than tariff drove it.
Signal: Water is now allocated rather than purchas

Steel, Membranes and Power Electronics

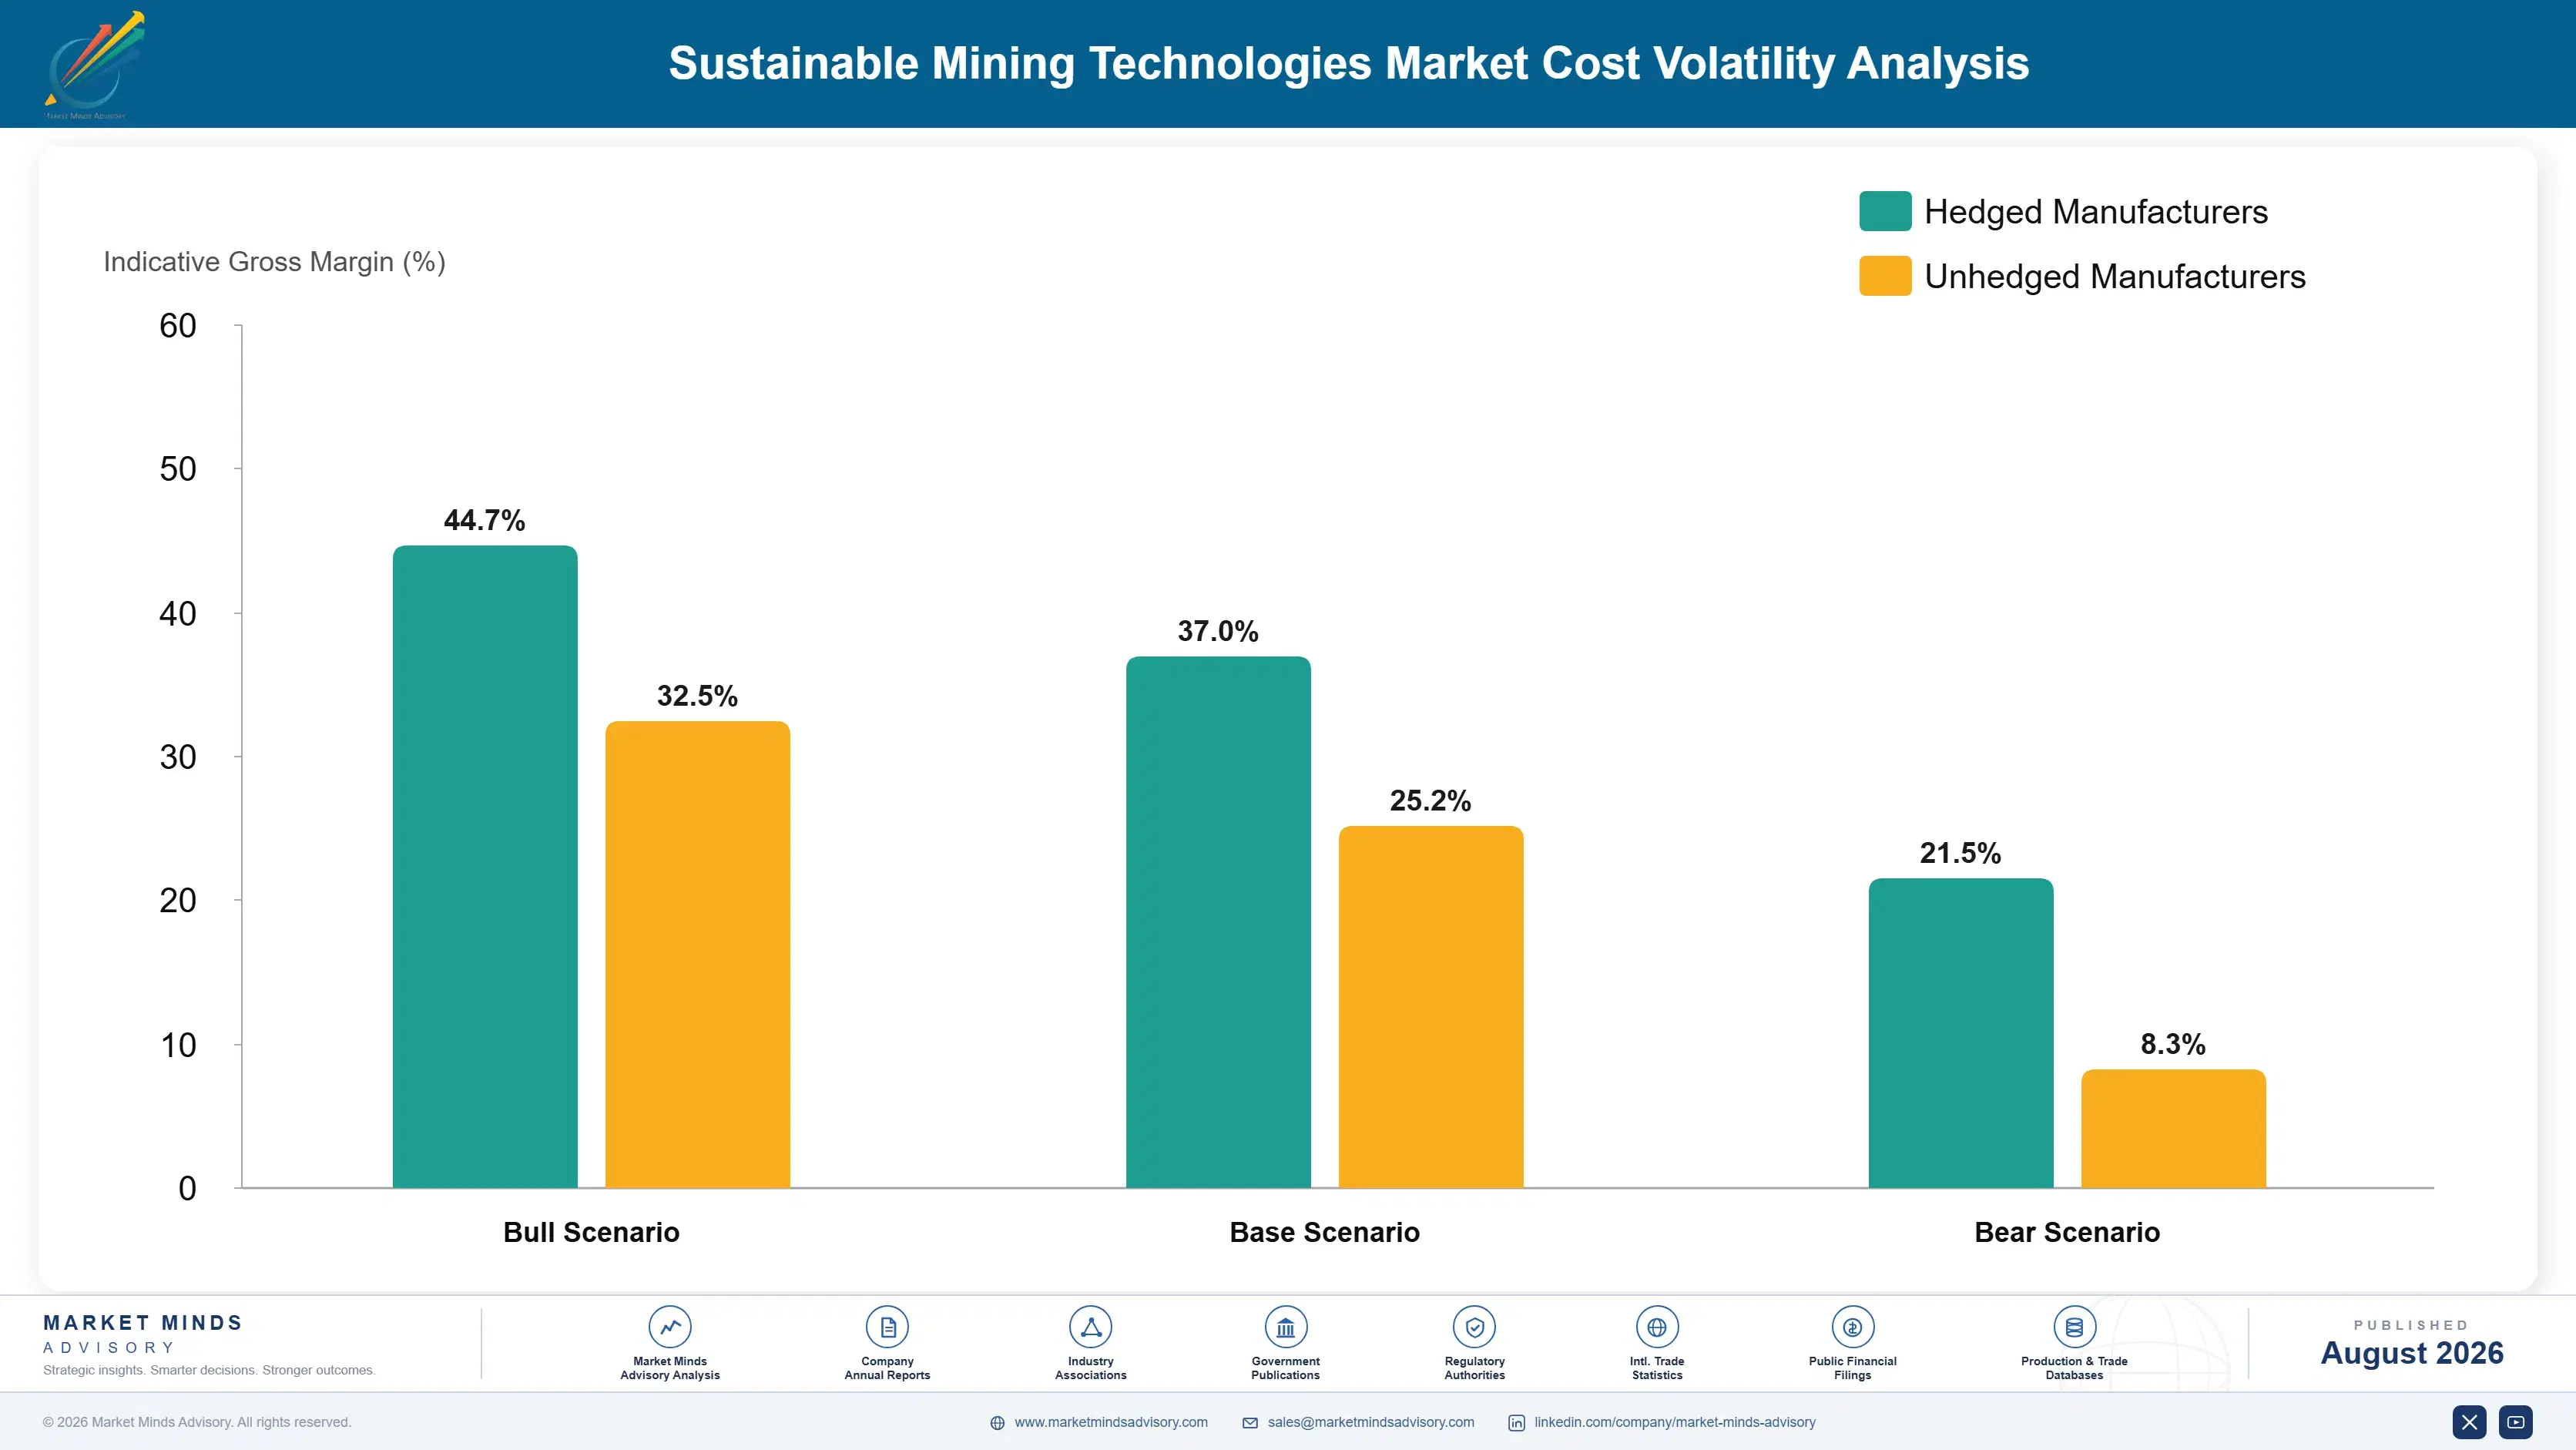
Delivered system cost divides between fabricated steel, pressure vessels, and framework components at roughly 29%, process consumables including filter cloth and membranes near 14%, power electronics, drives, and battery systems around 23%, engineering, commissioning, and site labour about 22%, and freight, spares, and overhead the balance. The mix varies enormously by discipline, since a filtration plant and an electric fleet share almost nothing on this list.
Battery cell, power electronics, and membrane costs all moved sharply through 2022 and 2023 as demand across unrelated industries competed for the same components, and several mining equipment and water technology suppliers disclosed input cost pressure in filings covering those years. Steel moved separately. Recovery on long-lead mining projects was slow, since equipment is frequently priced at study stage well before build. Escalation provisions remain far less common

The competitive disadvantage mechanism runs through project pricing timing rather than through component purchasing. Steel, membranes, and power electronics cost broadly the same for suppliers of reasonable scale, while a vendor that priced at feasibility study stage carries every cost movement between then and fabrication. Mining project timelines make that gap unusually long, and escalation provisions are far less common than the exposure warrants.
sustainable-mining-technologies-market-cost-volatility-analysis-1787302790611

Write escalation provisions into study stage pricing

Mining equipment is frequently priced at feasibility study stage and fabricated years later, which leaves the supplier carrying steel, battery, and membrane cost movement across an unusually long window. Escalation clauses referenced to published indices shift that to operators better placed to absorb it inside a project contingency. Operators resist escalation and accept it more readily where lead

Standardise modules across discipline-specific product lines

Fabricated steel and framework components carry roughly 29% of system cost, and bespoke design for every project multiplies engineering, spares, and commissioning effort without improving performance. Modular designs configured per site capture most of the flexibility at far lower engineering load. Genuinely unusual sites still need bespoke solutions and should be priced accordingly rather than absorbed.

Contract battery and power electronics supply ahead of award

Power electronics, drives, and battery systems carry around 23% of cost in electrification packages and compete directly with automotive and grid storage demand for the same components. Contracted positions taken before project award remove both price and lead time exposure. The commitment carries real volume risk and it is smaller than the schedule risk of missing a commissioning date.

Portfolio Architecture for Margin Defence

Three tiers describe this business and the spread follows which budget approves the purchase rather than which technology is involved. Conventional water treatment and dust suppression sit at the bottom, where requirements are routine and many suppliers compete. Tailings filtration and recycling systems occupy the middle. Electrification packages and integrated multi-discipline scope sit at the top, where either the economics are compelling or nobody else will quote the work.
The tension is that compliance spending is defensible through a downturn and priced against risk rather than value, while economic spending carries better margins and disappears the moment commodity prices fall. A supplier weighted toward compliance has resilient revenue with a regulatory dependency it cannot influence. One weighted toward electrification and sorting carries a cyclical book with genuinely better economics behind it.

High-value pools concentrate where nobody else will take the scope. Integrated packages spanning tailings and water are the clearest case, since the mine currently absorbs that integration risk unpaid and will pay a supplier willing to carry it instead. Underground electrification is the second such pool, where ventilation economics carry the case without any environmental argument. Neither pool is decided on equipment price.

Volume / Commodity-Adjacent Tier

Conventional water treatment, dust suppression, and routine environmental equipment where requirements are settled and many suppliers compete openly. Specification is standard and price decides most awards outright. Chinese cost positions decide many of them.
Gross Margin: 18-26%

Premium / Certified Tier

Tailings filtration, dry stacking, and advanced water recycling systems sponsored by permitting rather than operations. Priced against permit delay risk rather than against any return on capital. Reference installations decide who gets shortlisted.
Gross Margin: 26-36%

Sustainability / Regulatory / Next-Generation Tier

Electrification packages, sensor-based sorting, and integrated multi-discipline scope spanning boundaries competitors will not cross. Best margin available and the least contested work in this market. Almost nobody else will quote that scope at all.
Gross Margin: 38-50%
sustainable-mining-technologies-market-portfolio-architecture-1787302791119

Permits, Studies and Fleet Cycles

Demand arrives through two channels that behave nothing alike. Compliance technology enters at permitting or at a regulatory review, on timelines set by regulators rather than by operators, and it proceeds regardless of commodity prices because the alternative is not operating. Economic technology enters at feasibility study or at fleet replacement, competing against every other capital request the operation has, and it defers whenever prices fall.
Stickiness runs through reference installations and study specification rather than through relationships. A technology written into a feasibility study is difficult to displace afterwards, since changing it means revisiting mass balances and permit submissions that took months. Fleet electrification sticks through charging infrastructure that suits one manufacturer. Routine water treatment sticks least and is retendered on price like any other equipment.

Buyer profiles diverged as the two budgets separated. The earlier buyer was a mine engineering manager evaluating equipment against a process requirement. The current conversation is either with a permitting and sustainability function comparing technology against delay risk, or with an operations team holding a ventilation power bill and a hurdle rate, and those two never meet in the same room.
sustainable-mining-technologies-market-end-use-penetration-index-1787302791627

What We Would Tell a Board

These are among the four positions where our research anticipates prominent divergence between winners and laggards over the coming forecast period. Each is grounded in the demand model, the regulatory perimeter, and the announced capacity pipeline.
01 / SPONSORING FUNCTION IDENTIFICATION

Find out whose budget it is first

Tailings and water technology is sponsored by permitting and sustainability functions whose authority derives from risk rather than from any return on capital at all, while sorting and electrification compete for operations capital against a hurdle rate. Vendors pitching payback to a permitting sponsor sound entirely irrelevant, and vendors pitching licence to operate to an operations manager sound distinctly evasive. Establishing which of those rooms you are actually standing in should precede every single quotation, and it almost never does.
02 / DELAY RISK QUANTIFICATION

Build the permit paper, not the payback paper

Compliance technology has no return in any conventional sense at all, and constructing a payback case for a filtered tailings plant produces a document that nobody anywhere in the approval chain actually wanted to read. The comparison a sponsor genuinely uses is deferred production against permit risk, running near 1.2 million dollars a day at any large operation. Suppliers who present exactly that arithmetic are writing the paper the sponsor genuinely needs rather than the one the finance department happened to request.
03 / VENTILATION ECONOMICS FRAMING

Underground electrification sells on power, not emissions

Removing diesel equipment underground also removes the enormous air volume that has to be moved and cooled, and that saving alone clears an operations hurdle rate well before any emissions argument gets made. Battery-electric haulage grows at 15.9% against 10.6% for the wider market on exactly that basis rather than on any corporate sustainability commitment at all. Suppliers leading with emissions reduction are making the considerably weaker case to an audience that holds a ventilation power bill in front of it every single month.
04 / INTEGRATION SCOPE CAPTURE

Take the risk the customer carries for free

Filtration, water treatment, electrification, and sorting share almost no engineering at all, concentration accordingly sits at just 24%, and the mine ends up absorbing integration risk across suppliers who have never worked together on anything. A vendor willing to accept scope beyond its own equipment boundary removes a risk that the customer currently carries entirely unpaid. Very few suppliers anywhere will do it, and the ones that do get asked to quote packages that pure equipment vendors are never even shown.

Engagement Snapshot From the Field

A live engagement with an industry participant carrying material or product regulatory and market exposure ahead of a defining policy shift, showing how our research translates into a defensible multi-year portfolio strategy.
MARKET MINDS ADVISORY · CLIENT ENGAGEMENT SUMMARY
Sustainable Mining Technologies Producer Strategic Portfolio Review and Transition Roadmap 2026·Investment Scenario on Sustainable Mining Technologies Exposure Evaluation 2025-26
CLIENT PROFILE
A mining technology supplier with approximately 430 million dollars in annual revenue (client-reported, unverified by MMA), providing water treatment and tailings dewatering equipment across four regions. Win rates had fallen for two consecutive years despite growing market demand, and management attributed the decline to Chinese price competition on comparable equipment. Margins were already thin across the board.
STRATEGIC CHALLENGE
The board wanted an independent view before responding with price reductions, since margins were already thin and the diagnosis of price competition had never been tested against the actual reasons recorded for lost tenders. Nobody had reviewed who inside each customer had actually sponsored the purchases being lost. It had been assumed.
MMA APPROACH
We reviewed lost tender records to identify who inside each customer had sponsored the purchase and what justification had been presented. Competitor proposals were compared where available. Reference installation depth was benchmarked by discipline, and integration scope offered by each bidder was assessed across the same tenders. Sponsor identification was then tested against win rates.
KEY FINDINGS
  1. Losses split almost evenly between price-driven tenders and ones where the client had presented a payback case to a permitting sponsor who required a delay risk argument instead.
  2. In every tender lost to an integrated package, the winning bidder had accepted scope across both tailings and water while the client quoted only its own equipment boundary.
  3. Chinese competition was decisive in routine water treatment tenders and had never won a permit-critical tailings facility against the client anywhere. Permit-critical work had never been lost on price.
  4. Reference installation depth was strong in dewatering and thin in advanced water recycling, which excluded the client from tenders it could technically have served.
CLIENT PROFILE
A mining technology supplier with approximately 430 million dollars in annual revenue (client-reported, unverified by MMA), providing water treatment and tailings dewatering equipment across four regions. Win rates had fallen for two consecutive years despite growing market demand, and management attributed the decline to Chinese price competition on comparable equipment. Margins were already thin across the board.
STRATEGIC CHALLENGE
The board wanted an independent view before responding with price reductions, since margins were already thin and the diagnosis of price competition had never been tested against the actual reasons recorded for lost tenders. Nobody had reviewed who inside each customer had actually sponsored the purchases being lost. It had been assumed.
MMA APPROACH
We reviewed lost tender records to identify who inside each customer had sponsored the purchase and what justification had been presented. Competitor proposals were compared where available. Reference installation depth was benchmarked by discipline, and integration scope offered by each bidder was assessed across the same tenders. Sponsor identification was then tested against win rates.
KEY FINDINGS
  1. Losses split almost evenly between price-driven tenders and ones where the client had presented a payback case to a permitting sponsor who required a delay risk argument instead.
  2. In every tender lost to an integrated package, the winning bidder had accepted scope across both tailings and water while the client quoted only its own equipment boundary.
  3. Chinese competition was decisive in routine water treatment tenders and had never won a permit-critical tailings facility against the client anywhere. Permit-critical work had never been lost on price.
  4. Reference installation depth was strong in dewatering and thin in advanced water recycling, which excluded the client from tenders it could technically have served.
RECOMMENDED STRATEGY
Phase 1: Phase 1 (months one to eight): rebuild proposal materials into two separate formats addressing permitting sponsors and operations sponsors distinctly. Phase 2: Phase 2 (months eight to twenty-four): offer integrated tailings and water scope, pricing the integration risk transfer explicitly rather than absorbing it. Phase 3: Phase 3 (months twenty-four to forty-two): exit routine water treatment tendering where Chinese cost positions decide outcomes on price alone.
OUTCOME
Separate sponsor-specific proposal formats were adopted within two quarters and win rates on permit-critical tenders recovered measurably. Two integrated packages were won at prices the client would not previously have quoted, and routine tendering volume was deliberately reduced (client-reported, unverified by MMA). Sponsor identification became a mandatory step before any bid decision.

Frequently Asked Questions

Foundational context covering the market sizes, CAGR, scope, country, region and competition that inform every finding below. This section is provided to cover basics and most often pre-purchase conversations, answered from the MMA Primary Research Dataset.

What is the current size of the Sustainable Mining Technologies Market?

The market is valued at USD 12.8 billion in 2025, rising to USD 14.16 billion in 2026. Scope covers technologies reducing environmental impact at mining operations, not conventional equipment, automation systems, or consulting services.

How large will the Sustainable Mining Technologies Market be by 2036?

MMA forecasts USD 38.78 billion by 2036, an increase of USD 24.62 billion over the 2026 base. That represents an expansion multiple of 2.74 times across the forecast period.

What is the CAGR for the Sustainable Mining Technologies Market 2026 to 2036?

The base case CAGR is 10.6%, with a bull case of 11.9% and a bear case of 9.3%. The historical rate from 2020 to 2025 was 9.2%, driven initially by tailings management.

Which segment is growing fastest?

Battery-electric and trolley-assist haulage at 15.9%, exactly 1.50 times the market rate. Underground ventilation savings clear a hurdle rate before any emissions argument is made.

Who are the major companies in the Sustainable Mining Technologies Market?

Metso, FLSmidth, Weir Group, Epiroc, and Veolia Water Technologies lead on technology revenue. The top five hold only 24%, since the disciplines involved share almost no engineering.

Which country is growing fastest?

Chile at 13.8%, where copper operations face the most acute mining water constraint anywhere and desalination sets the alternative cost. Water is allocated rather than purchased there.

Report Segmentation Architecture

The full report scope spans multiple orthogonal segmentation dimensions, with cross-tabulated demand data provided for each dimension pair. Coverage extends further to regional breakdowns, trend trajectories, and the competitive detail needed to support segment-level decision-making.

By Technology System And Impact

  • Tailings Filtration And Dry Stacking Systems
  • Mine Water Treatment And Recycling Systems
  • Battery-Electric And Trolley-Assist Haulage
  • Renewable Microgrids And Mine Electrification Infrastructure
  • Ore Sorting And Waste Rejection Systems

By End-Use Industry

  • Copper And Base Metals Mining
  • Gold And Precious Metals Mining
  • Iron Ore And Bulk Commodities
  • Coal Mining
  • Lithium, Rare Earths And Battery Minerals

By Commercial Model

  • Capital Equipment Supply To Operators
  • Integrated Multi-Discipline Package Delivery
  • Study Stage Specification And Engineering
  • Build, Own And Operate Service Contracts
  • Retrofit And Fleet Conversion Programmes

By Region

  • Latin America
  • South Asia and Pacific
  • North America
  • Middle East and Africa
  • East Asia
  • Western Europe
  • Eastern Europe

Scope, Methodology, and Coverage

Every figure in this report is reproducible from documented input assumptions. The scope below maps the historical period, the forecast horizon, the segmentation dimensions, and the countries covered, alongside the underlying primary and qualitative methodology.
Historical Period
2020 to 2025
Forecast Period
2026 to 2036
Base Year
2025 (USD billions; MMA Primary Research Dataset, August 2026)
Market Definition
This market comprises technologies supplied to mining operations specifically to reduce environmental impact, secure operating permission, or lower resource consumption, measured at supplier revenue across capital equipment, integrated package, study engineering, service contract, and retrofit channels. Coverage spans tailings filtration, thickening and dry stacking systems, mine water treatment and recycling systems including membrane and desalination plant serving mines, battery-electric and trolley-assist haulage equipment and charging infrastructure, renewable microgrids and mine electrification infrastructure, and sensor-based ore sorting and waste rejection systems. Conventional mining, crushing and processing equipment carrying no environmental function, mine automation and autonomous haulage systems, environmental monitoring and compliance testing services, permitting and environmental impact assessment consultancy, carbon credit purchasing, mine closure financial provisioning, and rehabilitation earthworks contracting fall outside scope.
Quantitative Units
USD billions (current prices); systems supplied by technology type; capital cost per installed system; tailings tonnes under filtered deposition
Segmentation Dimensions
By Technology System And Impact; By End-Use Industry; By Commercial Model; By Region
Regions Covered
Latin America, South Asia and Pacific, North America, Middle East and Africa, East Asia, Western Europe, Eastern Europe
Countries Covered
Chile, Peru, Brazil, Mexico, Argentina, Australia, Indonesia, India, Papua New Guinea, United States, Canada, China, Mongolia, Japan, South Africa, Zambia, Democratic Republic of Congo, Botswana, Ghana, Saudi Arabia, Sweden, Finland, Poland, Kazakhstan, Serbia, and additional markets relevant to this sector
Key Companies Profiled
Metso, FLSmidth, Weir Group, Epiroc, Veolia Water Technologies, Caterpillar, Komatsu, Sandvik, ABB, Schneider Electric, TOMRA, Steinert, Andritz, Thyssenkrupp Polysius, Xylem, Ausenco, Wood, Aggreko, juwi, Normet
Quantitative Methodology
Primary survey, n=3,800 respondents, Q4 2025, six countries; demand-side model with trade association cross-validation
Qualitative Methodology
47 expert interviews, Q4 2025; applied to validate demand model assumptions, identify emerging dynamics, and assess competitive positioning
Report Format
PDF and XLSX data workbook (Word format preview document)
Publisher
Market Minds Advisory
Report Code
MMA-2026-TEC-917
Published
August 2026
Contact
sales@marketmindsadvisory.com | www.marketmindsadvisory.com

Purchase the full Sustainable Mining Technologies Market Report (2026 to 2036).

The full report sizes sustainable mining technologies across five technology systems, five commodity groups, five commercial models, and seven regions, with compliance-driven and economically-driven spending separated throughout. Sponsoring functions inside operators are mapped by technology, since they determine which justification any proposal must carry. Permit delay cost is quantified by operation scale and jurisdiction. Competitive profiling covers twenty suppliers on technology revenue, and integration scope capability is assessed separately from equipment supply. Regional demand is built from orebody geography and regulatory pressure rather than industrial output.
Compliance-driven and economically-driven spending separated throughout the analysis
Sponsoring functions inside operators mapped by individual technology
Permit delay cost quantified by operation scale and jurisdiction
Integration scope capability assessed separately from equipment supply alone
Ventilation economics modelled against underground electrification conversion cases
Water allocation constraints tracked separately from water tariff costs

Built For The People Who Decide

From boardroom strategy to bench-side execution, this report is read cover-to-cover by leaders shaping the next decade of their industry, turning demand scenarios, market dynamics and valuation benchmarks into decisions.
CXOs/ Presidents/ VPs/ Managers
M&A and Corporate Development
Strategy Teams and R&D Heads
Procurement and Product Directors
Regulatory and Compliance Leaders
Investor Relations and Equity Analysts