Market Minds Advisory
Sustainable Footwear Market

Sustainable Footwear Market: Global Sustainable Footwear Market. Material Innovation and Circularity Transformation, 2026 to 2036

Footwear brands are racing to replace virgin petroleum-based materials with recycled, bio-based, and circular-design alternatives as retailers and regulators push extended producer responsibility rules that make end-of-life recyclability a genuine competitive differentiator.

Lead Analyst

Published

September 2026

Make Smarter Decisions with Customized Research Insights

Request a free sample report and evaluate market opportunities, growth trends, and competitive dynamics relevant to your business needs.

2025 MARKET VALUE$4.2BMarket Size 2025
2036 FORECAST VALUE$10.3BBase Case , 2026 to 2036
CAGR 2026 TO 20368.5 %Bull 9.8% / Bear 7.2%
INCREMENTAL OPPORTUNITY$5.8BNet 10- year value creation
EXPANSION MULTIPLE2.26x2036 value over 2026 base
Strategic Levers
M&A Pipeline
Regional Outlook
Country Rankings
Competitive Intelligence
Segmental Deep-dive
Call-Us : 91 93563 13602

Executive Snapshot and Market Trajectory.

Sustainable footwear demand is accelerating quite quickly as major athletic and outdoor brands commit to recycled material content targets, pushing suppliers to scale bio-based alternatives faster than manufacturing capacity has historically supported across the wider industry and its broader supply base overall this coming decade.
Athletic footwear leads category adoption given brand sustainability commitments and consumer willingness to pay premiums for verified recycled content, while Western Europe's extended producer responsibility regulations are concentrating regulatory-driven demand there more heavily than in other regions worldwide this cycle and well beyond. East Asia remains the dominant manufacturing base even as brands relocate some sustainable material sourcing closer to recycled feedstock origins in Europe and North America.
Competitive differentiation increasingly rests on verified material traceability and circularity credentials rather than price alone, favoring brands with established recycling infrastructure and third-party certification relationships over smaller entrants lacking supply chain transparency systems and the capital needed to build them. Regulatory pressure from European Union textile and footwear circularity rules is accelerating this shift industry-wide, forcing even value-tier brands to disclose material composition data they previously kept proprietary and closely guarded from regulators.
Market Definition
This report covers footwear manufactured with recycled, bio-based, or certified sustainable materials and designed for circularity, including take-back and recycling programs, across athletic, casual, and outdoor footwear categories. It excludes conventional footwear without verified sustainable material content or end-of-life recyclability claims.
Base Year Value
$4.2B in 2025 (MMA Primary Research Dataset, September 2026)
Forecast Period
2026 to 2036, eleven discrete annual values
CAGR
8.5% base case. Bull 9.8%. Bear 7.2%.
Fastest Growth Segment
Recycled Synthetic Materials: 11.5% CAGR
Fastest Growth Country
India: 10.2% CAGR
Fastest Growth Region
South Asia and Pacific: 10.5% CAGR
Largest Region
North America: 28% of 2025 global value
Market Leaders
Nike, Adidas, Allbirds, VF Corporation, Puma. Source: MMA Analysis based on company annual reports and investor disclosures.
Primary Survey
n=3,800 procurement and R&D decision-makers, Q4 2025, six countries
Methodology
Demand-side build-up, cross-validated against public data, 47 expert interviews

Sustainable Footwear Market Forecast Scenarios

sustainable-footwear-market-size-forecast-scenario-1790014756040
Sustainable footwear grew from a niche premium category in 2020 into a mainstream brand commitment by 2025, as major athletic and outdoor brands publicly announced recycled material sourcing targets and began scaling production beyond limited-edition capsule collections into core product lines across their portfolios worldwide, though cost premiums kept adoption concentrated among wealthier consumer segments.
The base case assumes continued brand-level recycled content commitments, expanding European Union circularity regulation, and growing consumer willingness to pay premiums for verified sustainable materials together drive steady expansion through 2036. These three commercial mechanisms reinforce one another as regulatory pressure forces disclosure that in turn validates premium pricing for brands with genuinely verified sustainable material content and supply chain transparency, while laggard brands face rising compliance costs that narrow their cost advantage over time.
A bull scenario centers on faster than expected scaling of bio-based material feedstocks reducing the cost premium versus virgin petroleum materials. The primary bear risk is that recycled and bio-based material costs remain persistently higher than virgin alternatives, limiting adoption to premium price tiers rather than achieving broad mainstream market penetration across value-tier footwear categories.

Material Transition Reshapes Footwear Margin Structure

Three forces are reshaping sustainable footwear economics across the wider industry and its supply base: brand sustainability commitments creating guaranteed demand for recycled material inputs, European regulation forcing material disclosure across the entire value chain from feedstock to finished product, and consumer willingness to pay premiums for verified environmental credentials that command higher margins than conventional footwear lines sold at comparable retail price points nationwide.
MARKET CONCENTRATION (CR5)31Reflects fragmented competition among many footwear brands overall
AVERAGE SELLING PRICE PREMIUM22Represents typical premium charged over conventional footwear equivalents
TOP PRODUCING COUNTRY SHARE38Concentrated manufacturing capacity remains within a single dominant country
RECYCLED CONTENT PENETRATION18Growing share of units now contain verified recycled materials
TAKE-BACK PROGRAM PARTICIPATION12Reflects still modest consumer participation in brand recycling programs
SUSTAINABLE MATERIAL COST SHARE35Represents a meaningfully larger cost share than conventional materials
Commercial activity concentrates among brands with established recycling infrastructure and material traceability systems, since retailers increasingly require verified sustainability documentation before listing products on their shelves and digital storefronts nationwide and internationally across their retail networks and distribution channels. Smaller brands without dedicated sustainability teams struggle to meet documentation requirements that larger competitors absorb more easily across their existing compliance infrastructure and legal resources.
The next decade will be shaped substantially by bio-based material feedstock scaling, extended producer responsibility regulation spreading beyond Europe into North America and Asia, and whether recycled material costs converge with virgin material pricing closely enough to support mainstream value-tier adoption rather than remaining a premium-only category reserved for wealthier consumers across developed markets worldwide overall.
"Brands that treat recycled materials as a marketing footnote rather than a supply chain commitment will get caught out when European disclosure rules make unverified claims commercially indefensible. The brands winning here already treat material traceability as core infrastructure, not a sustainability add-on."
Practice Lead, Sustainable Consumer Products and Materials · MMA Consumer Products / Sustainable Apparel and Footwear Practice · September 2026

Market Trends

Recycled Ocean Plastic Adoption Expands Across Athletic Lines

Major athletic brands are scaling recycled ocean plastic and post-consumer PET content in shoe uppers and midsoles, moving the material from limited-edition marketing collections into mainstream product lines sold at standard retail volumes. Supply agreements with ocean plastic recovery organizations have expanded meaningfully since 2023, though feedstock volume constraints still limit how quickly brands can scale beyond current commitments. Brands report recycled ocean plastic content now reaching 30 percent by weight in some flagship product lines, up from single-digit percentages just five years earlier across the broader athletic footwear category.
Market Impact: Locks in 50 percent recycled target

Extended Producer Responsibility Rules Mandate Take-Back Programs

The European Union's extended producer responsibility framework for textiles and footwear now requires brands selling into the bloc to fund collection and recycling infrastructure for end-of-life products, shifting disposal costs from municipalities onto manufacturers directly across all affected member states. Brands are responding quickly by launching in-store take-back programs and mail-in recycling schemes, partly to meet compliance obligations and partly to capture data on product lifecycle performance. Compliance costs vary significantly by brand scale, with smaller companies facing proportionally higher per-unit compliance costs than large multinational competitors with existing infrastructure.
Market Impact: Supports 15 percent price premium

Market Opportunities and Growth Drivers

Corporate Sustainability Commitments Lock In Recycled Material Demand

Major footwear brands have made public, time-bound commitments to source specific percentages of recycled or bio-based materials by target dates, creating contractual demand that suppliers can plan capacity investment around rather than relying on spot market orders. These commitments function similarly to corporate renewable energy power purchase agreements, giving material suppliers the demand visibility needed to justify capital investment in recycling and processing infrastructure. Several brands have committed to reaching 50 percent recycled content across their product lines by 2030, locking in years of guaranteed procurement volume for qualified suppliers.
Market Impact: Adds 20 percent material cost premium

Consumer Willingness To Pay Premium For Verified Sustainability

Consumer surveys consistently show a meaningful segment of footwear buyers willing to pay premiums above 15 percent for verified sustainable material content, provided brands can substantiate claims with credible third-party certification rather than vague marketing language and unverifiable slogans repeated across advertising campaigns. This willingness to pay is strongest among younger consumers and in markets with higher environmental awareness, giving brands with genuine certification programs meaningful pricing power over competitors making unsubstantiated claims. Retailers report certified sustainable footwear lines carrying noticeably lower markdown rates than conventional equivalents, reflecting more resilient full-price demand.
Market Impact: Risks fines up 4 percent revenue

Market Restraints and Challenges

Recycled Material Cost Premiums Compress Manufacturer Margins

Recycled and bio-based materials still cost meaningfully more per unit than virgin petroleum-based alternatives, since collection, sorting, and processing infrastructure for post-consumer feedstock remains less mature and less scaled than virgin material supply chains built up over many decades of investment. The root cause is fragmented recycling collection infrastructure that has not achieved the economies of scale virgin material producers built over decades. Some manufacturers are responding by co-investing directly in recycling infrastructure alongside material suppliers, a mitigation pathway that trades upfront capital for longer-term cost certainty and supply security.
Market Impact: Increases recycled content share 30 percent

Greenwashing Scrutiny Raises Marketing Compliance Risk

Regulators and consumer advocacy groups are increasingly challenging unsubstantiated sustainability marketing claims, forcing brands to provide verifiable evidence behind terms like recycled or eco-friendly that previously carried very little scrutiny from oversight bodies or regulators worldwide. The root cause is that sustainability marketing outpaced actual supply chain verification capability for years, leaving many brands with claims they cannot fully substantiate under new disclosure standards. Brands are responding by adopting standardized third-party certification frameworks and reducing the scope of sustainability claims to only what can be independently verified and documented properly.
Market Impact: Adds compliance costs 27 markets
3 additional market trends, 4 additional growth drivers, and 3 additional restraints and challenges are covered in the full report. Contact sales@marketmindsadvisory.com to access the complete intelligence.

Segment CAGR and Growth Architecture

Segmentation follows material type, the primary axis distinguishing sustainable footwear products, since material sourcing determines both cost structure and the sustainability credentials brands can credibly market to increasingly skeptical consumers and regulators demanding verified evidence rather than vague marketing assertions across the wider category and its broader supply chain and distribution network overall today.
sustainable-footwear-market-market-share-analysis-1790014756615

Recycled Synthetic Materials

Recycled synthetic materials, primarily post-consumer PET and ocean plastic converted into polyester yarns and foams, represent the fastest-growing material category as brands scale beyond limited capsule collections into core product lines sold at standard retail volumes across their full portfolios and distribution networks worldwide today. Supply agreements with plastic recovery organizations have expanded meaningfully in recent years, though feedstock volume constraints still limit how quickly brands can scale procurement beyond current commitments given competing demand from other industries using the same feedstock streams. Manufacturers report recycled synthetic content increasingly matching the performance characteristics of virgin synthetic materials, removing a longstanding barrier to broader adoption across performance-oriented athletic footwear categories specifically.
CAGR 11.5%

Bio-Based Materials

Bio-based materials, including mushroom leather, algae-derived foams, and plant-based rubber alternatives, are scaling from experimental pilot programs into commercial product lines as processing technology matures and production costs decline steadily each year across the wider supply base and manufacturing network nationwide and abroad. Growth here trails recycled synthetics slightly since bio-based supply chains remain less established and production volumes smaller relative to established recycling infrastructure for synthetic materials built over many years of sustained investment. Brands positioning around bio-based materials often command the highest price premiums in the category, since these materials carry stronger novelty and environmental narrative appeal than recycled synthetics, which consumers increasingly view as already mainstream and unremarkable.
CAGR 10.2%
Full segment breakdown across 6 segments available in the complete report.

Regional Architecture and Country Demand Map

Western Europe leads regulatory-driven demand given extended producer responsibility rules, while North America drives the largest absolute consumption given brand headquarters concentration there and premium consumer spending power. East Asia dominates manufacturing capacity even as material innovation increasingly originates in Europe and North America across the broader value chain.

North America

North America drives the largest absolute sustainable footwear consumption given the concentration of major athletic and outdoor brand headquarters here, where corporate sustainability commitments originate before rolling out globally across the rest of the portfolio and international markets nationwide and abroad each year. United States consumers show strong willingness to pay premiums for verified recycled content, particularly among younger demographic segments increasingly influenced by brand sustainability marketing and social media advocacy campaigns. Canadian demand mirrors United States patterns closely, though at meaningfully smaller absolute volume given the smaller population base overall. Retail take-back program participation is growing steadily across major metropolitan markets as brands expand collection point coverage beyond flagship stores.
Share: 28% | CAGR: 8.9% (2026 to 2036)

Western Europe

Western Europe's extended producer responsibility regulations create the most regulatory-driven demand of any region worldwide today, forcing brands selling into the bloc to fund collection and recycling infrastructure regardless of voluntary sustainability ambitions or corporate marketing priorities elsewhere. Germany, France, and the Netherlands lead disclosure enforcement, pushing brands toward verified material traceability systems faster than markets without comparable regulatory pressure elsewhere in the wider world overall. Consumer environmental awareness here is also unusually high, supporting premium pricing for genuinely certified sustainable products beyond what regulation alone requires of manufacturers. Regional take-back infrastructure is the most developed globally, given years of textile recycling policy experience predating current footwear-specific rules and standards.
Share: 24% | CAGR: 6.8% (2026 to 2036)
Regional intelligence for 5 additional markets available in the complete report: East Asia, South Asia and Pacific, Latin America, Middle East and Africa, Eastern Europe. Contact sales@marketmindsadvisory.com.
sustainable-footwear-market-country-cagr-analysis-1790014757166

Capturing Value From Verified Material Traceability

Brands capturing durable pricing power are building traceability infrastructure and certification partnerships that convert sustainability claims into premium-justifying commercial assets rather than defensive marketing expenses required to meet baseline regulatory obligations alone, extending value capture well past the point of original sale across the full product lifecycle and its downstream recovery process overall and beyond.

Certified Material Traceability Premium Pricing Strategy

Brands investing in blockchain or similar digital traceability systems that verify material origin from feedstock to finished product can credibly charge premiums that unverified competitors cannot justify to increasingly skeptical consumers and retail buyers across major markets worldwide today. This traceability infrastructure requires upfront technology investment, but it converts sustainability claims from marketing assertions into auditable facts that survive regulatory scrutiny and consumer fact-checking. Brands with mature traceability systems report price premiums averaging 22 percent above comparable unverified sustainable claims, reflecting genuine consumer trust in the underlying verification process itself, built over years of consistent disclosure.
Market Impact: Supports premiums averaging 22 percent above unverified claims

Take-Back Program Resale and Recycling Revenue

Brands operating structured take-back programs capture value twice: once through the original sale and again through resale of refurbished products or recovered material feedstock sold back into their own supply chains across multiple product cycles and seasons each year. This closed-loop model reduces dependence on external recycled material suppliers while generating incremental revenue from products that would otherwise end up in landfills across the broader waste stream. Brands with mature take-back infrastructure report recovering roughly 8 percent of original product value through resale and material recovery combined across program participants nationwide.
Market Impact: Recovers roughly 8 percent of original product value

Co-Branded Bio-Based Material Licensing Partnership Model

Brands and specialized bio-based material developers are structuring co-branded licensing partnerships where the material innovator receives a per-unit royalty while the footwear brand gains exclusive or early-access rights to novel materials before competitors enter the same category and product lines. This model lets footwear brands access cutting material science without funding the full research and development cost internally, while material developers gain guaranteed distribution volume they could not achieve independently. Early licensing partnerships have generated royalty revenue equivalent to roughly 5 percent of wholesale price for material developers, funding further research investment.
Market Impact: Generates roughly 5 percent of wholesale price royalty

Circularity Certification Retail Shelf Placement Advantage

Major retailers are increasingly reserving premium shelf placement and digital storefront featuring for footwear carrying recognized circularity certifications, giving certified brands a placement advantage that translates directly into higher sales volume regardless of price premium charged at retail across most channels. Brands pursuing certification report gaining access to retail placement opportunities unavailable to uncertified competitors, particularly at sustainability-focused retailers expanding their footprint nationwide and internationally. Certified product lines report unit velocity roughly 12 percent higher than comparable uncertified lines at the same price point, reflecting both placement advantage and consumer trust.
Market Impact: Increases unit sales velocity by 12 percent overall

Who Controls the Margin Pool

Market concentration sits at a CR5 of 31 percent, evaluated consistently on global unit shipment volume across all participants in the wider industry and its supply base, reflecting a fragmented category where hundreds of brands compete for shelf space rather than a handful of dominant manufacturers controlling supply and pricing power across the value chain overall and its retail channels.
Current competitive activity centers on material innovation partnerships, take-back program launches, and third-party certification adoption, as brands race to substantiate sustainability claims that regulators and consumers increasingly scrutinize closely across every major market. Several established athletic brands have announced expanded recycled content targets within the past year specifically to defend market position against sustainability-focused challenger brands gaining traction with younger consumers.

Direct-to-consumer sustainability-focused challenger brands without legacy manufacturing infrastructure are emerging as genuine competitive pressure, building smaller but highly differentiated product lines around verified circularity credentials that larger brands struggle to match quickly given existing supply chain commitments and material sourcing contracts. Rankings could shift meaningfully if these challengers achieve retail distribution scale comparable to established brands, particularly as certification requirements level the playing field on credibility.
sustainable-footwear-market-company-positioning-matrix-1790014757691

Competitive Moat and Risk Dimensions

NIKE

Moat: Established recycling and traceability infrastructure

Nike's years of investment in recycled material sourcing and supply chain traceability systems give it verified sustainability claims that smaller competitors cannot yet replicate at comparable scale or speed. This infrastructure advantage lets Nike credibly command premium pricing while maintaining consistent supply of certified recycled materials across its full global product portfolio.
NIKE

Risk: Legacy scale slows rapid pivots

Nike's massive existing manufacturing footprint and supplier relationships built around conventional materials make rapid pivots to bio-based alternatives slower than smaller, purpose-built challenger brands designed around sustainability from inception. If sustainability-focused challengers achieve retail scale faster than Nike can convert its existing supply base, Nike risks losing credibility among its most environmentally engaged consumers.
ALLBIRDS

Moat: Vertical integration in material innovation

Allbirds' vertical integration into proprietary bio-based material development, including its own wool and eucalyptus fiber sourcing relationships, gives it differentiated material credentials that competitors sourcing from shared third-party suppliers cannot easily replicate. This ownership of the material innovation pipeline supports premium positioning and genuine differentiation.
ALLBIRDS

Risk: Limited manufacturing scale economics

Allbirds' smaller manufacturing scale relative to major athletic brands limits its ability to negotiate the favorable per-unit material costs that larger competitors achieve through massive purchase volumes, compressing margins even as its sustainability credentials support premium pricing. If larger brands successfully replicate Allbirds' material innovations at greater scale, Allbirds could lose its narrow differentiation advantage entirely.

Players Tracked

Prominent Players

Nike
Adidas
Allbirds
VF Corporation
Puma

Other Key Players

Timberland
Veja
Rothy's
Reformation Shoes
Deckers Brands
New Balance
ASICS
Cariuma
Vivobarefoot
Native Shoes
Thousand Fell
Everlane
Saola
Toms Shoes
Sole Rebels

Recent Developments

FEBRUARY 2025

Nike Expands Recycled Ocean Plastic Sourcing Agreement

Nike announced an expanded recycled polyester sourcing agreement with a major ocean plastic recovery organization, scaling recycled content across several flagship product lines beyond limited-edition capsule collections. The agreement targets increasing recycled material share to 50 percent across specified product categories by 2030, reinforcing existing corporate sustainability commitments.
Signal: Signals major established athletic brands locking in long-term recycled feedstock supply commitments ahead of competitors now
JUNE 2025

Allbirds Launches Expanded Take-Back and Resale Program

Allbirds launched an expanded take-back and resale program allowing customers to return worn footwear for refurbishment credit or material recycling, extending its circularity commitments beyond initial product sale. The program responds to growing consumer expectation that sustainability-focused brands provide genuine end-of-life solutions rather than only sustainable manufacturing claims.
Signal: Signals challenger brands building circularity infrastructure specifically to defend sustainability credentials against skeptical regulators and consumers
OCTOBER 2025

Adidas Acquires Stake In Bio-Based Material Startup

Adidas acquired a minority equity stake in a bio-based material startup developing mycelium leather alternatives, securing early access to novel material technology ahead of broader competitor adoption across the industry. The investment accelerates Adidas' bio-based material pipeline without requiring full internal research and development capability build-out.
Signal: Signals established athletic brands buying early access to next-generation material innovation pipelines quickly and directly overall

Recycled Feedstock Cost Exposure

Recycled and bio-based material inputs represent roughly 35 percent of total cost of goods sold for sustainable footwear, meaningfully higher than the 20 percent typical of conventional footwear given less mature processing infrastructure. Most recycled polyester feedstock originates from Southeast Asian and Chinese plastic recovery facilities, while bio-based materials increasingly source from European and North American biotechnology producers.
Ocean plastic collection volumes fell sharply during 2022 shipping disruptions, based on IEA-adjacent supply chain reporting and company annual report disclosures, pushing recycled polyester feedstock prices up roughly 25 percent within a single year as brands competed for constrained collection volumes. Several brands temporarily substituted virgin polyester blends to maintain production volumes, delaying recycled content targets by one to two product cycles before supply stabilized through 2023 and 2024.

Smaller independent brands without long-term feedstock supply agreements face materially higher material cost volatility than the five largest producers, who negotiate multi-year recycled material pricing directly with recovery organizations and processors. This gap widens further for brands sourcing bio-based materials from single regional suppliers, since limited alternative sourcing options leave them exposed to production disruptions that larger, diversified competitors can absorb more easily.
sustainable-footwear-market-cost-volatility-analysis-1790014757887

Diversifying Recycled Feedstock Sourcing Across Multiple Regions

Brands are qualifying recycled polyester and bio-based material suppliers across Southeast Asia, Europe, and North America rather than relying on a single sourcing region, reducing exposure to any single country's collection volume disruptions or export restrictions. This multi-region approach adds modest qualification costs upfront but meaningfully shortens recovery time when disruption affects any single supplier base nationwide.

Locking Multi-Year Pricing Agreements With Feedstock Processors

Larger brands are negotiating three-year fixed pricing contracts directly with recycled material processors, trading some flexibility for protection against spot market price swings during supply disruptions and shortages. This approach favors scale brands with reliable order volumes, leaving smaller brands more exposed to spot pricing during future feedstock shortages across the wider industry supply base.

Co-Investing Directly In Recycling Collection Infrastructure

Some brands are co-investing directly in plastic collection and processing infrastructure alongside recovery organizations, trading upfront capital for longer-term feedstock cost certainty and supply security across their broader material sourcing network. This approach requires significant capital commitment but reduces dependence on third-party processors whose pricing and availability brands cannot otherwise control directly or predict reliably.

Portfolio Architecture for Margin Defence

Value-tier conventional footwear with minimal recycled content still anchors unit volume across price-sensitive consumer segments nationwide and internationally, but gross margins there sit well below premium sustainable tiers where verified material credentials and certification support materially higher prices from environmentally engaged consumers willing to pay for genuine sustainability rather than marketing claims alone across the category and its broader retail channels.
Premium certified sustainable lines paired with take-back programs generate the highest margin pools, since brand loyalty and repeat purchase behavior among sustainability-focused consumers reduce customer acquisition costs relative to conventional footwear marketing spend overall and over time. Brands increasingly bundle certification credentials into premium product launches specifically to capture this durable margin advantage over time, rather than competing purely on style and price alone across a crowded competitive field.

The tension between volume shipment targets and premium margin capture is pushing several brands toward tiered product lines rather than a single sustainability positioning, letting them serve price-sensitive mainstream consumers while still capturing high-value premium segments that prioritize verified circularity credentials and material traceability over price alone across their portfolios and distribution networks worldwide and beyond.

Volume / Commodity-Adjacent Tier

Conventional footwear with minimal recycled content sold primarily on price and style, with gross margins in the 25 to 32 percent range typical of mainstream mass-market footwear manufacturing overall and worldwide.
Gross Margin: 25%-32%

Premium / Certified Tier

Certified sustainable lines with verified recycled or bio-based content sold at premium price points, carrying gross margins in the 38 to 46 percent range supported by certification credibility and brand loyalty.
Gross Margin: 38%-46%

Sustainability / Regulatory / Next-Generation Tier

Fully circular product lines bundled with take-back and resale programs, carrying gross margins above 48 percent driven by closed-loop material recovery and recurring customer engagement across product generations and repeat purchases.
Gross Margin: 48%-56%
sustainable-footwear-market-portfolio-architecture-1790014758383

High-value Sub-segments and Strategic Watch-out

Certified Traceability Premium Lines

Certified traceability premium product lines combine high per-unit revenue with the fastest growth in the market, as environmentally engaged consumers increasingly demand verified evidence behind sustainability claims rather than accepting vague marketing language at face value across every purchase decision they make each season and year.
Gross Margin: 48%-56%

Bio-Based Premium Footwear

Bio-based material footwear sold to premium consumer segments generates high per-unit revenue with steady, moderate volume growth as material science matures and production costs gradually decline toward mainstream affordability across the broader product category over time and across many seasons and product generations still ahead.
Gross Margin: 38%-46%

Recycled Synthetic Value Lines

Recycled synthetic footwear sold at accessible price points remains the volume core of the sustainable category, serving cost-conscious consumers who still want verified recycled content without paying premium prices for bio-based alternatives across their everyday footwear purchases and wardrobes nationwide and abroad each passing season.
Gross Margin: 25%-32%

Greenwashing Exposed Brands

Greenwashing exposure among brands with unsubstantiated sustainability claims represents a strategic watch-out, since regulatory enforcement and consumer skepticism could damage brand trust broadly across the category if verification standards tighten faster than compliance capability across the wider industry and its broader supply base overall and long term.
Gross Margin: 25%-32%

Circular Loyalty and Repeat Purchase Economics

Take-back programs and certified recycled content convert what was once a single transactional footwear purchase into an ongoing relationship, with brands increasingly valued on repeat purchase rates and program participation rather than unit shipment counts alone across their portfolios and distribution networks worldwide. This shift mirrors patterns seen earlier in subscription-based consumer categories, where recurring engagement eventually outweighed original transaction value.
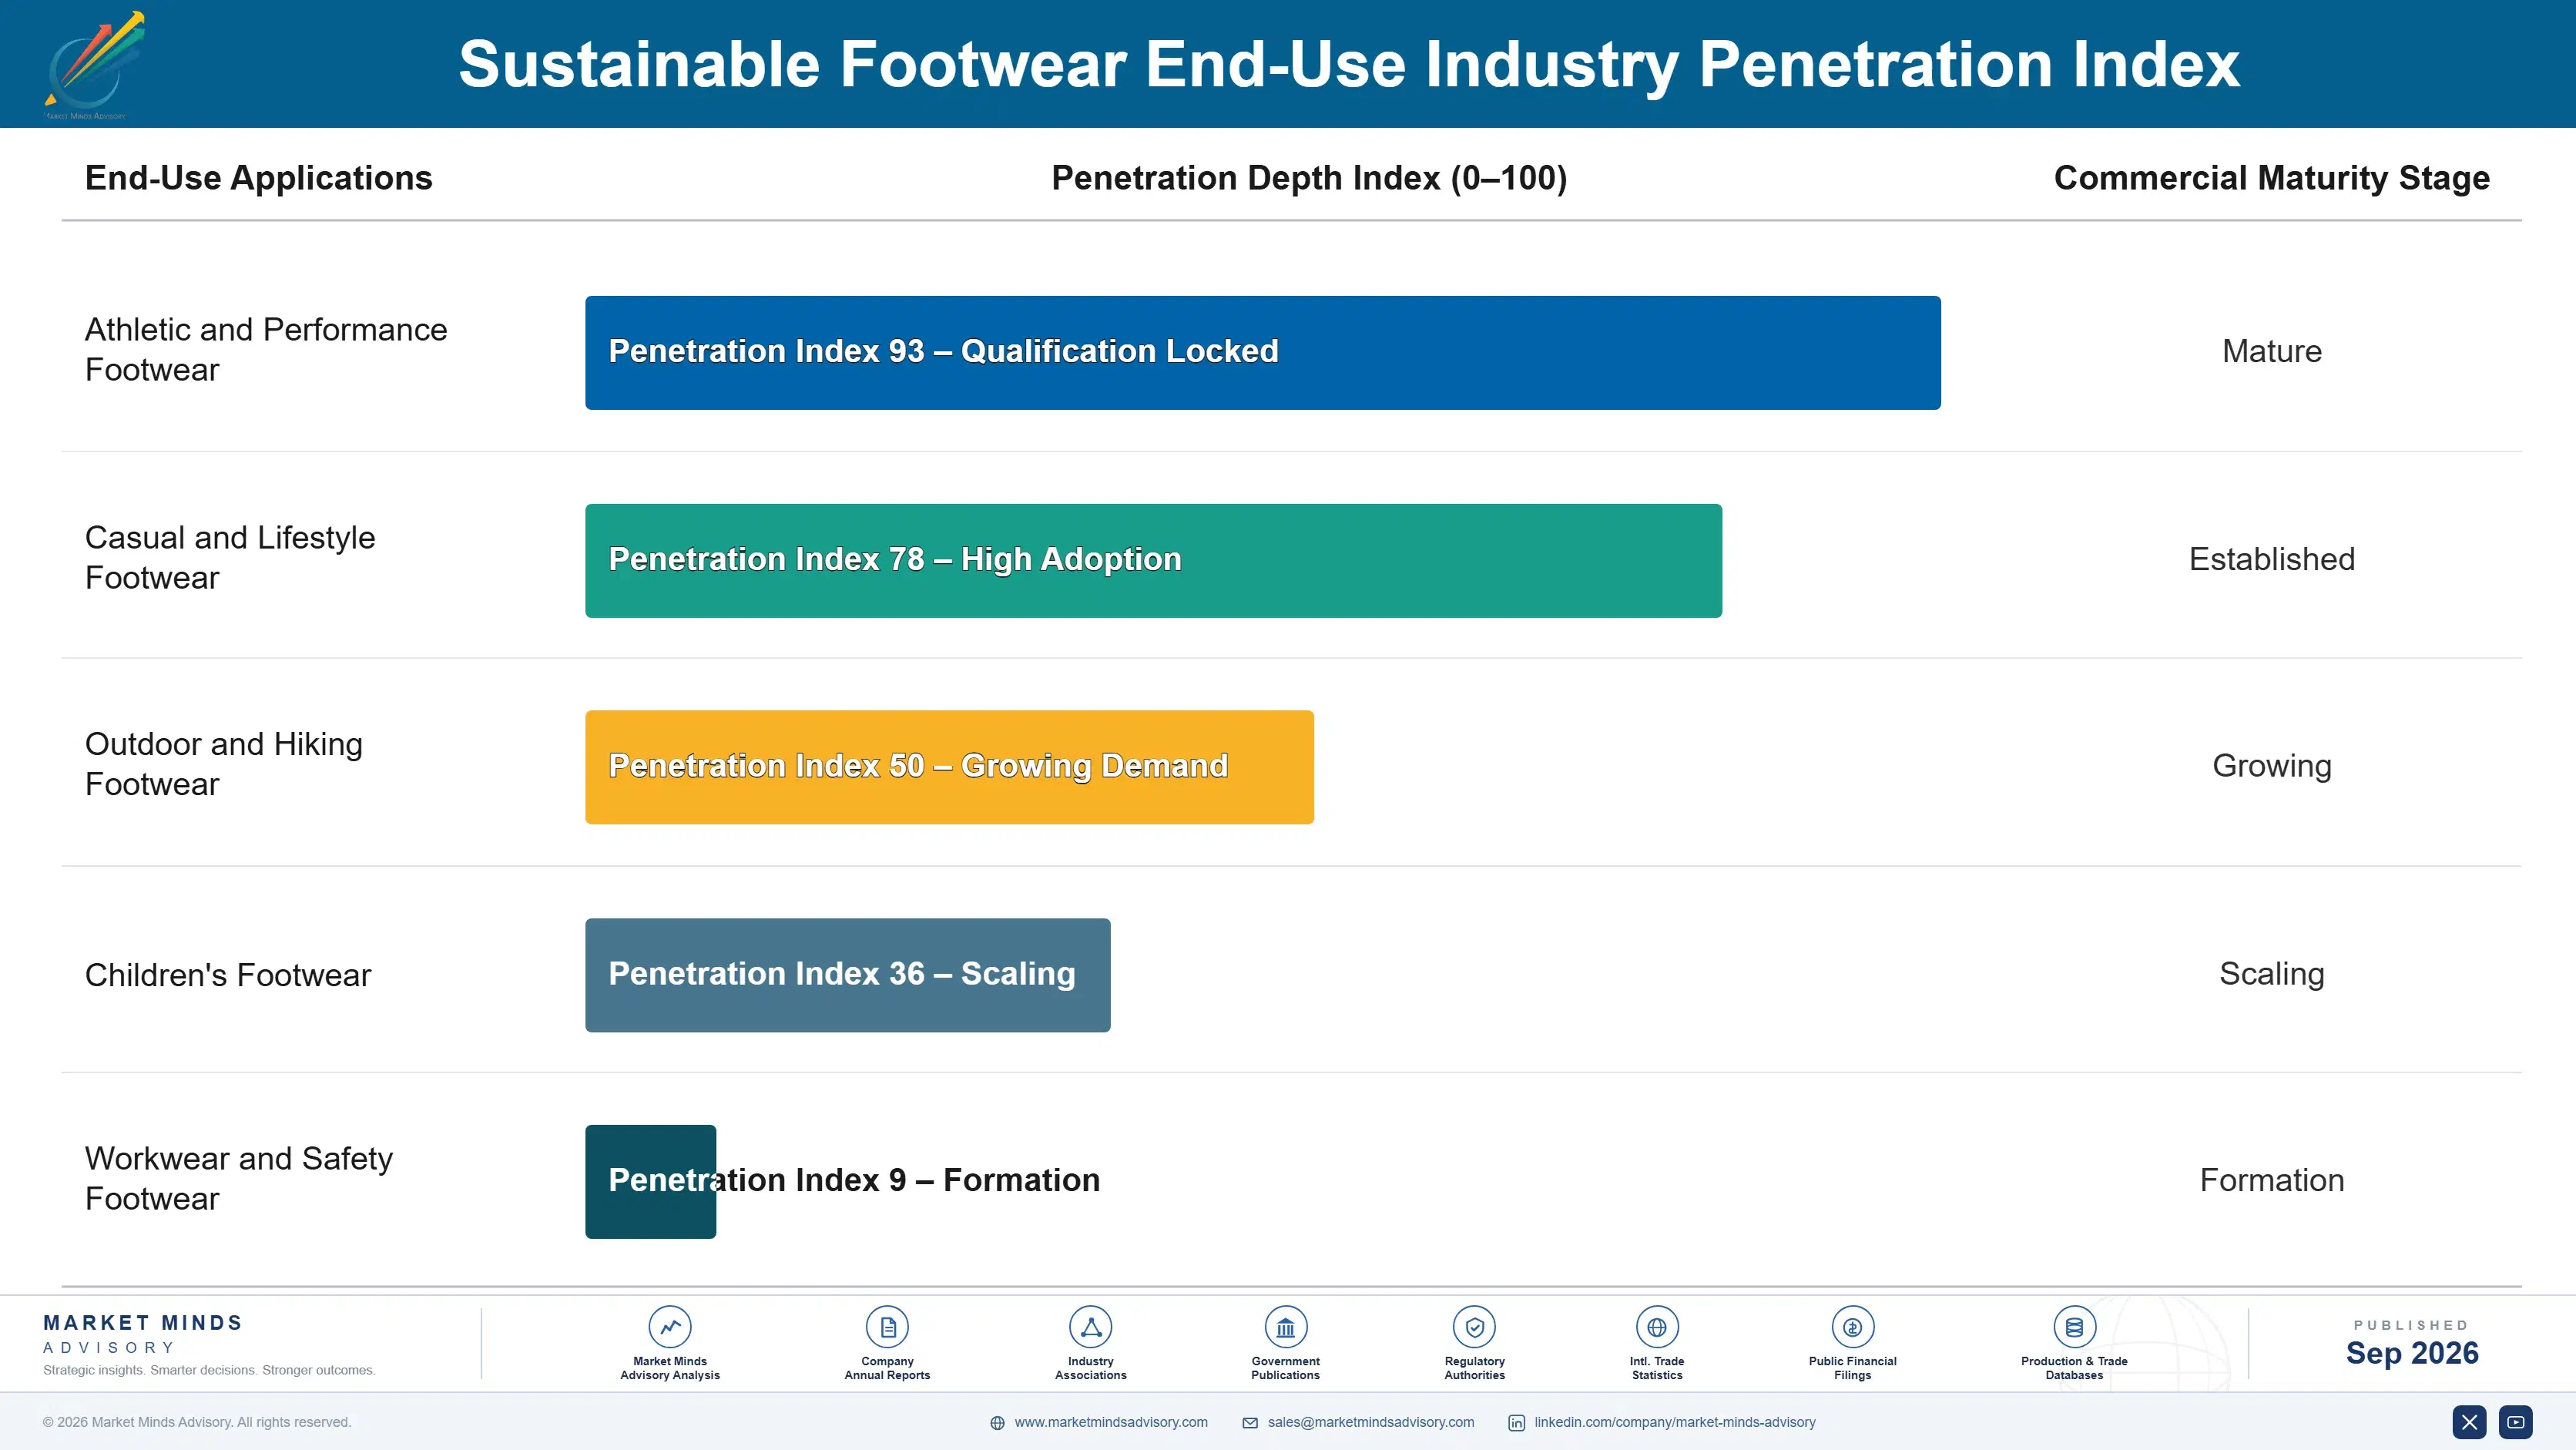
Adoption depth varies meaningfully by end-use vertical: athletic footwear consumers adopt sustainable materials fastest given strong brand sustainability marketing and performance parity with conventional materials achieved through years of material research. Casual and outdoor footwear buyers adopt more gradually, weighing durability claims against unproven long-term material performance in demanding outdoor conditions. Children's and school footwear remain the slowest adopting category given price sensitivity among parents.

A generational shift in buyer profiles is underway as younger consumers who prioritize verified environmental credentials replace an older generation less willing to pay premiums for sustainability claims without concrete evidence, accelerating demand for certification and traceability infrastructure across the wider industry. This handoff is reshaping how brands allocate marketing budgets between performance messaging and sustainability credentials going forward.
sustainable-footwear-market-end-use-penetration-index-1790014758873

Where Sustainable Footwear Value Concentrates

These are among the four positions where our research anticipates prominent divergence between winners and laggards over the coming forecast period. Each is grounded in the demand model, the regulatory perimeter, and the announced capacity pipeline.
01 / MATERIAL TRACEABILITY INVESTMENT

Build verified traceability infrastructure before regulation forces disclosure

Brands that build verified material traceability infrastructure ahead of mandatory disclosure requirements capture premium pricing power that reactive competitors scrambling to meet compliance deadlines cannot match, since genuine verification takes years to build credibly. Waiting for regulation to force disclosure means competing on compliance timelines set by regulators rather than differentiation timelines set by the brand itself. Early movers convert what eventually becomes a baseline requirement into a multi-year competitive advantage precisely while competitors are still building the underlying infrastructure regulation will soon mandate.
02 / TAKE-BACK PROGRAM EXPANSION

Build closed-loop recycling to capture repeat purchase and material value

Take-back programs generate value twice, once through the original sale and again through resale or recovered material feedstock, while also deepening customer relationships that translate into repeat purchase behavior competitors without similar programs cannot easily replicate. Brands should treat take-back infrastructure as a commercial investment rather than a pure sustainability cost center, since the resulting customer loyalty and feedstock recovery both generate measurable financial return over time. This dual value capture becomes increasingly important as recycled feedstock costs rise with growing industry-wide demand.
03 / BIO-BASED MATERIAL PARTNERSHIPS

Secure early licensing access to differentiated bio-based material innovation

Bio-based materials command the strongest price premiums in the category precisely because they carry genuine novelty that recycled synthetics increasingly lack as adoption becomes mainstream and unremarkable to consumers across the wider category. Brands securing early licensing partnerships with bio-based material developers gain exclusive or early access rights that competitors entering later cannot obtain regardless of budget, since material developers typically grant exclusivity only to first-mover partners. This positioning captures premium pricing while the material remains differentiated rather than commoditized industry-wide.
04 / GREENWASHING RISK MANAGEMENT

Audit sustainability claims internally before regulators or media do it

Unsubstantiated sustainability claims that once carried little scrutiny now attract regulatory penalties and reputational damage as disclosure standards tighten across major markets simultaneously and without much warning. Brands should audit their own marketing claims against actual verification capability before regulators or consumer advocacy groups do it publicly, since proactive correction costs far less than reactive damage control after public exposure. This internal audit discipline protects brand trust precisely when competitors face public scrutiny for similar unsubstantiated claims made years earlier.

Engagement Snapshot From the Field

A live engagement with an industry participant carrying material or product regulatory and market exposure ahead of a defining policy shift, showing how our research translates into a defensible multi-year portfolio strategy.
MARKET MINDS ADVISORY · CLIENT ENGAGEMENT SUMMARY
Sustainable Footwear Producer Strategic Portfolio Review and Transition Roadmap 2026·Investment Scenario on Sustainable Footwear Exposure Evaluation 2025-26
CLIENT PROFILE
The client is a mid-size outdoor apparel and footwear brand generating annual revenue in the hundreds of millions, competing against larger athletic brands with more established sustainability infrastructure and marketing budgets. Facing pressure from retail partners to provide verified recycled content documentation, leadership sought guidance on which material transitions would deliver the strongest commercial return relative to investment cost.
STRATEGIC CHALLENGE
The client's existing sustainability claims lacked genuine third-party verification, risking retail delisting as major retailers began requiring certified documentation across their entire supplier base nationwide (client-reported, unverified by MMA). Management needed to prioritize limited sustainability budget across competing material transition options without clear commercial return data to guide the decision.
MMA APPROACH
MMA benchmarked the client's material sourcing against comparable outdoor and athletic brands, analyzing price premium realization and retail placement outcomes across different certification approaches used industry-wide today and previously. The engagement combined primary retailer interviews with consumer willingness-to-pay research to identify which material transitions would generate the strongest near-term commercial return.
KEY FINDINGS
  1. Retailers required third-party certification before granting premium shelf placement, regardless of actual recycled material content used in production (client-reported, unverified by MMA).
  2. Consumer willingness to pay premiums correlated most strongly with certified traceability rather than raw recycled material percentage claims alone across all surveyed segments.
  3. Bio-based material lines commanded 18 percent higher price premiums than recycled synthetic equivalents among the client's target consumer segment (client-reported, unverified by MMA).
  4. Take-back program pilots generated measurable repeat purchase lift among participating customers within the first six months of the pilot program's initial launch phase across test markets.
CLIENT PROFILE
The client is a mid-size outdoor apparel and footwear brand generating annual revenue in the hundreds of millions, competing against larger athletic brands with more established sustainability infrastructure and marketing budgets. Facing pressure from retail partners to provide verified recycled content documentation, leadership sought guidance on which material transitions would deliver the strongest commercial return relative to investment cost.
STRATEGIC CHALLENGE
The client's existing sustainability claims lacked genuine third-party verification, risking retail delisting as major retailers began requiring certified documentation across their entire supplier base nationwide (client-reported, unverified by MMA). Management needed to prioritize limited sustainability budget across competing material transition options without clear commercial return data to guide the decision.
MMA APPROACH
MMA benchmarked the client's material sourcing against comparable outdoor and athletic brands, analyzing price premium realization and retail placement outcomes across different certification approaches used industry-wide today and previously. The engagement combined primary retailer interviews with consumer willingness-to-pay research to identify which material transitions would generate the strongest near-term commercial return.
KEY FINDINGS
  1. Retailers required third-party certification before granting premium shelf placement, regardless of actual recycled material content used in production (client-reported, unverified by MMA).
  2. Consumer willingness to pay premiums correlated most strongly with certified traceability rather than raw recycled material percentage claims alone across all surveyed segments.
  3. Bio-based material lines commanded 18 percent higher price premiums than recycled synthetic equivalents among the client's target consumer segment (client-reported, unverified by MMA).
  4. Take-back program pilots generated measurable repeat purchase lift among participating customers within the first six months of the pilot program's initial launch phase across test markets.
RECOMMENDED STRATEGY
Phase 1: Phase 1 (Certification): Pursues third-party traceability certification for the client's top three product lines within the first two fiscal quarters. Phase 2: Phase 2 (Bio-Based Expansion): Introduces bio-based material options across premium product lines targeting differentiated market positioning going forward each season. Phase 3: Phase 3 (Take-Back Launch): Establishes a structured take-back and resale program to build repeat purchase relationships over the long term.
OUTCOME
The client achieved certified traceability status for its top three product lines within the planned timeline, reporting a 14 percent increase in retail placement approval rates at partner stores (client-reported, unverified by MMA). Leadership adopted the certification-first framework as the standing approach for future material transitions.

Frequently Asked Questions

Foundational context covering the market sizes, CAGR, scope, country, region and competition that inform every finding below. This section is provided to cover basics and most often pre-purchase conversations, answered from the MMA Primary Research Dataset.

What is the current size of the Sustainable Footwear Market?

The global sustainable footwear market reached an estimated 4.2 billion dollars in 2025, covering footwear manufactured with recycled, bio-based, or certified sustainable materials across athletic, casual, and outdoor categories.

How large will the Sustainable Footwear Market be by 2036?

MMA projects the market will reach approximately 10.31 billion dollars by 2036, driven by expanding brand sustainability commitments and growing regulatory pressure for verified material disclosure across major markets.

What is the CAGR for the Sustainable Footwear Market 2026 to 2036?

The market is forecast to grow at a compound annual growth rate of 8.5 percent between 2026 and 2036, reflecting accelerating brand and regulatory pressure toward verified sustainable material adoption industry-wide.

Which segment is growing fastest?

Recycled synthetic materials represent the fastest-growing segment, expanding roughly 1.35 times faster than the overall market as brands scale post-consumer plastic content beyond limited capsule collections into core product lines.

Who are the major companies in the Sustainable Footwear Market?

Leading companies include Nike, Adidas, Allbirds, VF Corporation, and Puma, together holding a combined market share of roughly 31 percent based on global unit shipment volume.

Which country is growing fastest?

India is expanding fastest in percentage terms as rising disposable income and manufacturing capacity investment accelerate sustainable footwear adoption, though the United States retains the largest absolute consumption given brand headquarters concentration.

Report Segmentation Architecture

The full report scope spans multiple orthogonal segmentation dimensions, with cross-tabulated demand data provided for each dimension pair. Coverage extends further to regional breakdowns, trend trajectories, and the competitive detail needed to support segment-level decision-making.

By Material Type

  • Recycled Synthetic Materials
  • Bio-Based Materials
  • Organic Natural Fibers
  • Recycled Rubber and Foam
  • Vegetable-Tanned Leather Alternatives
  • Certified Conventional Materials

By End-Use Industry

  • Athletic and Performance Footwear
  • Casual and Lifestyle Footwear
  • Outdoor and Hiking Footwear
  • Children's Footwear
  • Workwear and Safety Footwear

By Commercial Dimension

  • Direct-to-Consumer Sales
  • Wholesale Retail Distribution
  • Resale and Take-Back Programs
  • E-commerce Marketplace Channels

By Region

  • North America
  • Western Europe
  • East Asia
  • South Asia and Pacific
  • Latin America
  • Middle East and Africa
  • Eastern Europe

Scope, Methodology, and Coverage

Every figure in this report is reproducible from documented input assumptions. The scope below maps the historical period, the forecast horizon, the segmentation dimensions, and the countries covered, alongside the underlying primary and qualitative methodology.
Historical Period
2020 to 2025
Forecast Period
2026 to 2036
Base Year
2025 (USD billions; MMA Primary Research Dataset, September 2026)
Market Definition
This report covers footwear manufactured with recycled, bio-based, or certified sustainable materials and designed for circularity, including take-back and recycling programs, across athletic, casual, and outdoor footwear categories. It excludes conventional footwear without verified sustainable material content or end-of-life recyclability claims.
Quantitative Units
USD billions (current prices); unit shipment volume where applicable
Segmentation Dimensions
By Material Type; By End-Use Industry; By Commercial Dimension; By Region
Regions Covered
North America, Western Europe, East Asia, South Asia and Pacific, Latin America, Middle East and Africa, Eastern Europe
Countries Covered
USA, China, Germany, France, UK, Japan, South Korea, India, Australia, Canada, Brazil, Mexico, Indonesia, Vietnam, Thailand, Malaysia, UAE, Saudi Arabia, South Africa, Nigeria, Turkey, Poland, Netherlands, Italy, Spain, Sweden, Switzerland, Argentina, Colombia, Singapore, and additional markets relevant to this sector
Key Companies Profiled
Nike, Adidas, Allbirds, VF Corporation, Puma, Timberland, Veja, Rothy's, Reformation Shoes, Deckers Brands, New Balance, ASICS, Cariuma, Vivobarefoot, Native Shoes, Thousand Fell, Everlane, Saola, Toms Shoes, Sole Rebels
Quantitative Methodology
Primary survey, n=3,800 respondents, Q4 2025, six countries; demand-side model with trade association cross-validation
Qualitative Methodology
47 expert interviews, Q4 2025; applied to validate demand model assumptions, identify emerging dynamics, and assess competitive positioning
Report Format
PDF and XLSX data workbook (Word format preview document)
Publisher
Market Minds Advisory
Report Code
MMA-2026-CON-703
Published
September 2026
Contact
sales@marketmindsadvisory.com | www.marketmindsadvisory.com

Purchase the full Sustainable Footwear Market Report (2026 to 2036).

The full report provides comprehensive coverage of the global sustainable footwear market across all seven regions, ten years of forecast data, and detailed competitive profiling of twenty leading brands and manufacturers. It includes granular material segmentation analysis, regional demand architecture, and revenue lever modeling calibrated to real industry margin structures. Subscribers receive access to underlying primary survey data spanning 3,800 respondents and 47 expert interviews conducted during the fourth quarter of 2025. The report is designed for strategic planning, investment due diligence, and competitive benchmarking purposes across brand and investor audiences alike.
Full competitive profiles of twenty key market participants
Detailed regional demand architecture across seven global regions
Revenue lever modeling with quantified financial impact estimates
Primary survey data from 3,800 respondents across six countries
Material-level growth forecasts through the 2036 forecast horizon
Input cost risk analysis with supplier mitigation strategies

Built For The People Who Decide

From boardroom strategy to bench-side execution, this report is read cover-to-cover by leaders shaping the next decade of their industry, turning demand scenarios, market dynamics and valuation benchmarks into decisions.
CXOs/ Presidents/ VPs/ Managers
M&A and Corporate Development
Strategy Teams and R&D Heads
Procurement and Product Directors
Regulatory and Compliance Leaders
Investor Relations and Equity Analysts