Market Minds Advisory
Surgical Monitors Market

Surgical Monitors Market: Latency the Surgeon Feels, Colour Nobody Calibrates and Ten Year Replacement Cycles

A surgeon operating from a screen notices thirty milliseconds of lag long before anybody notices the colour has drifted, and hospitals buy on resolution because it is the only number on the datasheet they understand.

Lead Analyst

Alice Ballenger

Published

September 2026

Make Smarter Decisions with Customized Research Insights

Request a free sample report and evaluate market opportunities, growth trends, and competitive dynamics relevant to your business needs.

2025 MARKET VALUE$1.9BMarket Size 2025
2036 FORECAST VALUE$4.0BBase Case , 2026 to 2036
CAGR 2026 TO 20366.9 %Bull 8.1% / Bear 5.7%
INCREMENTAL OPPORTUNITY$1.9BNet 10- year value creation
EXPANSION MULTIPLE1.95x2036 value over 2026 base
Strategic Levers
M&A Pipeline
Regional Outlook
Country Rankings
Competitive Intelligence
Segmental Deep-dive
Call-Us : 91 93563 13602

Executive Snapshot and Market Trajectory

A surgeon working laparoscopically or robotically operates entirely from a screen, so the display is not an accessory to the procedure. It is the surgeon's only view of the anatomy, and the properties that matter are latency and colour fidelity rather than the pixel count on the box.
Four-kilometre resolution displays compound at 10.35%, exactly 1.50 times the market, largely because resolution is the specification hospitals actually compare. East Asia holds 31% of demand on procedure volume, display manufacturing capacity and endoscopic adoption together. Replacement cycles run about ten years, which makes each purchase consequential. Only around 23% of theatres perform any scheduled colour verification, so drift goes entirely unnoticed. Resolution is what gets compared instead.
Five manufacturers hold 62%. Positions rest on medical device certification and integration with imaging platforms rather than panel technology, since the panels themselves come from a handful of the same suppliers everybody uses. The premium over a housed consumer panel runs about 3.8 times and rests on certification, ingress protection and cleanability. It holds where enforcement is real and collapses wherever a procurement department can substitute. Nobody measures either of those two properties.
Market Definition
The market covers displays and visualisation monitors used within the sterile field and operating room environment, spanning high-definition surgical displays, four-kilometre resolution surgical displays, three-dimensional and stereoscopic surgical displays, integrated operating room video management displays, hybrid theatre and interventional imaging displays, and portable and boom-mounted auxiliary monitors. Diagnostic radiology reading displays, endoscopes and camera systems, surgical robotic consoles, and general clinical and administrative displays are excluded.
Base Year Value
$1.9B in 2025 (MMA Primary Research Dataset, August 2026)
Forecast Period
2026 to 2036, eleven discrete annual values
CAGR
6.9% base case. Bull 8.1%. Bear 5.7%.
Fastest Growth Segment
Four-Kilometre Resolution Surgical Displays: 10.3% CAGR
Fastest Growth Country
China: 9.5% CAGR
Fastest Growth Region
South Asia and Pacific: 9.0% CAGR
Largest Region
East Asia: 31% of 2025 global value
Market Leaders
Sony, Barco, Olympus, Karl Storz, EIZO. Source: MMA Analysis based on company annual reports.
Primary Survey
n=3,800 procurement and R&D decision-makers, Q4 2025, six countries
Methodology
Demand-side build-up, cross-validated against public data, 47 expert interviews

Surgical Monitors Market Forecast Scenarios

surgical-monitors-market-size-forecast-scenario-1787309369243
Growth of 6.4% across 2020 to 2025 was interrupted twice and then recovered strongly. Elective surgery suspension during 2020 removed a year of replacement demand outright, and the panel and semiconductor shortage across 2021 and 2022 left suppliers unable to fill orders they already held. Recovery came through the 4K camera transition rather than deferred replacement, and hospitals that skipped a cycle moved straight to higher resolution.
The base case of 7.6% rests on three mechanisms. Robotic and endoscopic camera resolution keeps advancing ahead of installed display capability, which forces replacement on the imaging chain's schedule rather than the hospital's seven-year cycle. Integrated theatre construction is spreading, and each integrated theatre specifies more displays than a conventional one. And Asian surgical volume keeps growing while domestic manufacture makes certified units affordable in facilities where uncertified alternatives once sufficed.
The bull case of 8.9% assumes 8K adoption follows the 4K pattern once robotic platform makers specify it, which would compress replacement cycles again across an installed base only recently upgraded. The bear case of 6.3% reflects two pressures: hospitals extending display life beyond seven years as capital budgets tighten, and Chinese manufacturers taking certified volume at prices established suppliers cannot match.

The Surgeon's Only View of the Patient

In open surgery the monitor is peripheral. In laparoscopic, endoscopic and robotic surgery it is the only view the surgeon has of the anatomy, which changes the requirement entirely. Two properties matter above all: latency, because a surgeon reports feeling disconnected from their instruments at around 30 milliseconds of delay, and colour fidelity, because tissue discrimination depends on it.
TOP FIVE CONCENTRATION62%Combined share held by the five largest surgical display manufacturers
PERCEPTIBLE LATENCY THRESHOLD30 millisecondsDelay at which surgeons report noticeable disconnection from instruments
REPLACEMENT CYCLE10 yearsTypical service life before a theatre display is replaced
DISPLAYS PER INTEGRATED THEATRE4 screensMonitors installed in a modern integrated operating room environment
COLOUR CALIBRATION COMPLIANCE23% of theatresShare performing scheduled colour verification on surgical displays
CERTIFICATION PREMIUM3.8 timesPrice against a comparable consumer panel of equivalent specification
Hospitals buy on neither. Resolution is the number on the datasheet, so four-kilometre displays compound at 10.35% while latency figures go unexamined and only around 23% of theatres perform any scheduled colour verification at all. A display whose colour has drifted over three years is still showing a very sharp image of tissue in slightly the wrong hue, and nobody is checking.
The premium over consumer panels runs about 3.8 times and rests on certification, ingress protection, sterile field cleanability and integration rather than on the panel itself, which typically comes from the same handful of suppliers everybody uses. That is a defensible position while medical certification remains demanding, and a vulnerable one wherever a procurement department decides a consumer panel in a sealed housing will do.
"Surgeons complain about lag and hospitals buy resolution, and the two conversations never meet. I have seen a theatre specify a four-kilometre display and then run it through a processing chain that added sixty milliseconds."
Director, Operating Room Visualisation and Displays Practice · MMA Operating Roo

Market Trends

Resolution Becomes the Default Because It Is Comparable

Four-kilometre resolution moved from premium option to default specification on new theatre installations, and it compounds at 10.35% against a market at 6.9%. The clinical benefit over high definition is real in fine dissection and modest elsewhere, and the commercial reason it wins is simpler: resolution is the one specification a procurement department can compare across quotations. Latency figures are rarely published in comparable form and colour performance requires measurement nobody performs, so neither influences the decision. Hospitals specify a fast display and then feed it through a slow chain.
Market Impact: Latency detected at 30 milliseconds
Integrated Theatres Multiply Screens Per Operating Room

Integrated operating room projects install around four displays per theatre rather than one, covering the primary surgical view, secondary imaging, patient data and a wall-mounted view for the wider team. That multiplies the value per theatre substantially and it ties the display purchase into a video management and routing system, which makes the decision an integration project rather than a monitor purchase. Retrofitting integration into an existing theatre is considerably harder than specifying it at build. An integrated installation locks the supplier in across every screen for the full cycle.
Market Impact: China compounding at 9.5% annually

Market Opportunities and Growth Drivers

Minimally Invasive Volumes Make the Display the Only View

Every laparoscopic, endoscopic, arthroscopic and robotic procedure is performed from a screen rather than by direct vision, and those volumes keep rising across general surgery, gynaecology, urology and orthopaedics. That converts the display from theatre furniture into the primary instrument through which the operation is conducted. Latency becomes clinically relevant at around 30 milliseconds, which is a threshold surgeons detect reliably and which most hospitals never measure across their processing chain. Surgeons name the problem as image quality because latency is not a word that appears in any purchase document.
Market Impact: Premium standing at 3.8 times consu

Asian Theatre Construction Adds Complete Display Installations

New operating theatre construction across China, India and Southeast Asia adds full display installations rather than replacing existing units, and integrated theatre specifications are increasingly standard on new build rather than an upgrade considered later. China compounds at 9.5%, the fastest national market. Those installations also specify four displays per theatre from the outset, which makes each new theatre worth several times a single replacement in an established hospital. Integrated specification on new build is increasingly standard rather than an upgrade considered later, which makes each theatre worth several replacements.
Market Impact: Cycles extending beyond 10 years

Market Restraints and Challenges

Consumer Panel Pricing Undermines the Certification Premium

Medical surgical displays command roughly 3.8 times the price of a comparable consumer panel, and the premium rests on certification, ingress protection, cleanability and integration rather than on image quality the panel itself provides. The root cause is that panel technology is supplied to everybody by the same handful of manufacturers. Suppliers mitigate by emphasising sterile field compliance, warranty in a wash-down environment and integration capability, and by competing where certification requirements are genuinely enforced. Where enforcement is weak the substitute simply wins on cost. Certification enforcement is the only variable that matters.
Market Impact: Displays lasting about 10 years

Ten Year Cycles Freeze Purchasing Decisions for a Decade

A theatre display is replaced roughly every ten years, and capital deferral under hospital budget pressure extends that further. The root cause is that a working display presents no clinical urgency, however far its colour has drifted. Suppliers mitigate by targeting new theatre construction where no incumbent exists, by pursuing integration projects that force a whole-theatre refresh, and by making colour drift visible through calibration services that create a reason to act. Calibration services are the only mechanism that creates a purchasing trigger inside a cycle that otherwise generates none at all.
Market Impact: Installing 4 screens per theatre
3 additional market trends, 4 additional growth drivers, and 2 additional restraints and challenges are covered in the full report. Contact sales@marketmindsadvisory.com to access the complete intelligence.

Segment CAGR and Growth Architecture

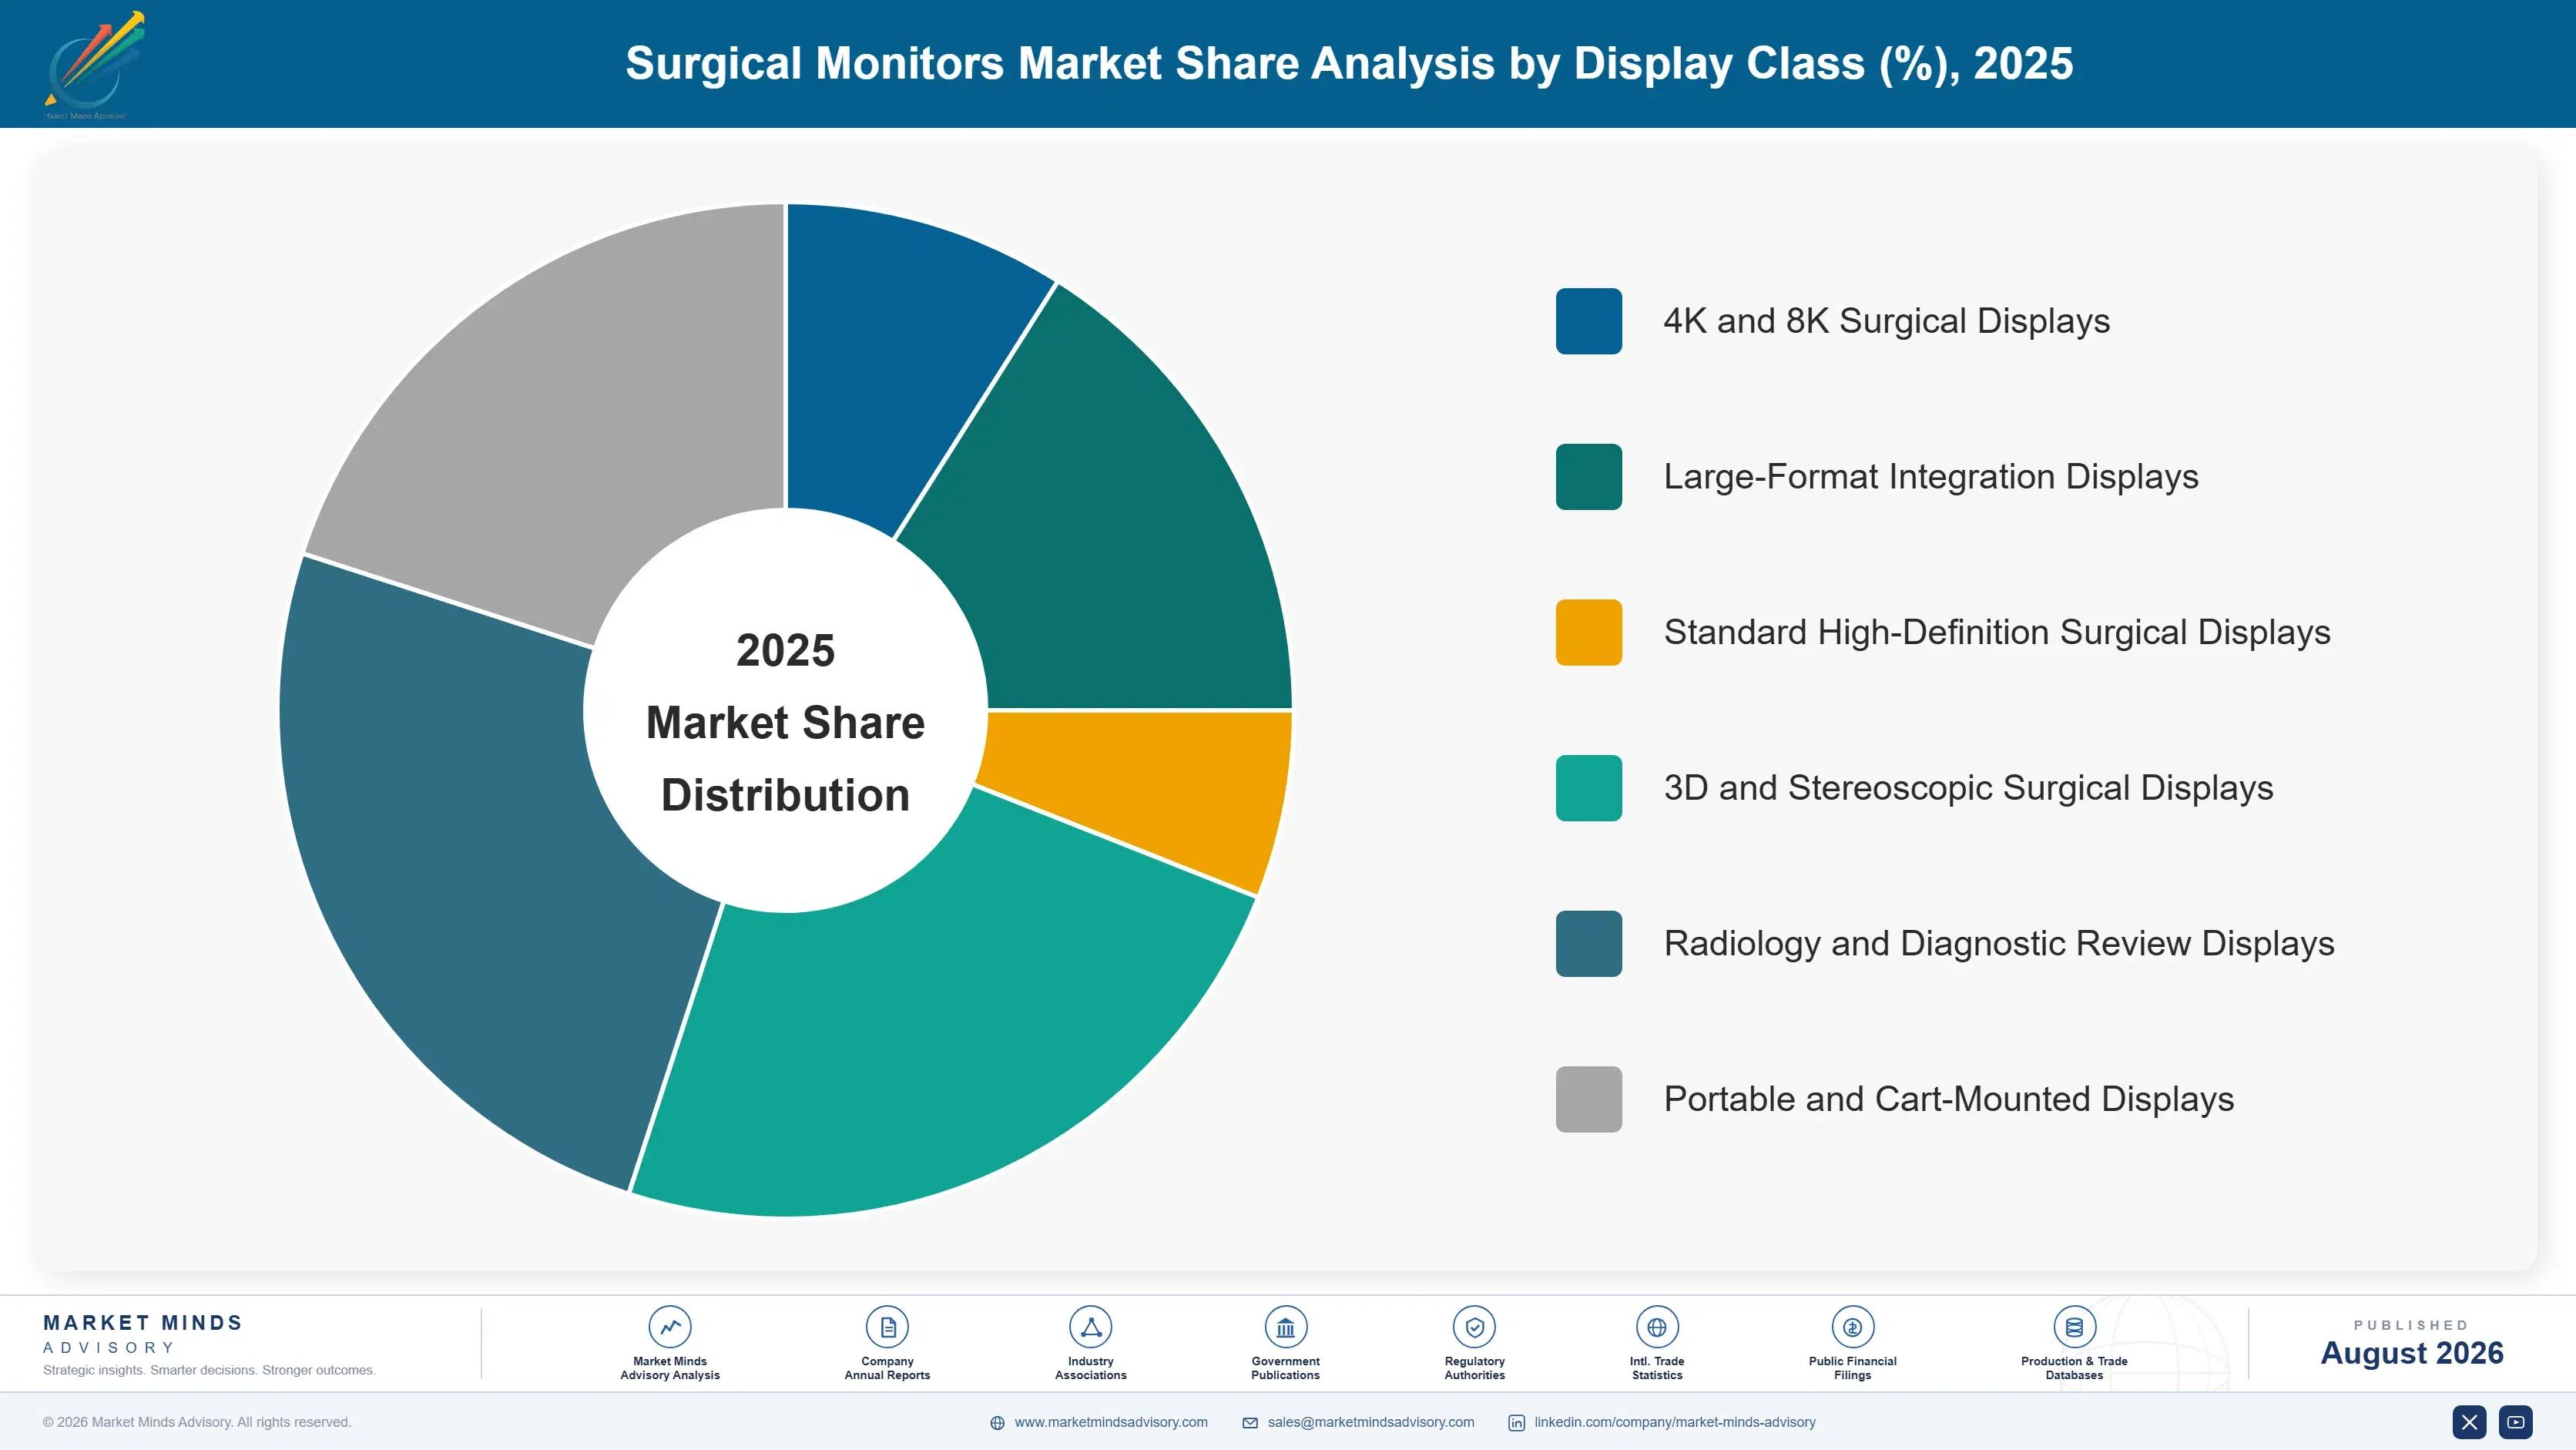
Segmentation follows display type and integration role, because those determine certification requirement, value per unit and whether the purchase is a monitor decision or part of a theatre project. A hospital specifying an integrated operating room is buying a system rather than a set of screens. Six categories sit here, separated by certification requirement and by system scope.
surgical-monitors-market-market-share-analysis-1787309369812

Four-Kilometre Resolution Surgical Displays

Four-kilometre displays compound at 10.35%, exactly 1.50 times the market, and the reason is procurement comparability as much as clinical benefit. Fine dissection and tissue plane discrimination genuinely improve at higher resolution, and the improvement is modest in most procedures compared with what latency and colour accuracy contribute. Resolution nonetheless wins because it is the one specification a procurement department can compare across competing quotations, where latency is rarely published in comparable form and colour performance requires measurement almost nobody performs. The displays also require a matched camera and processing chain to deliver anything, and hospitals routinely specify the screen without auditing the signal path feeding it, which wastes much of the benefit purchased.
CAGR 10.3%

Integrated Operating Room Video Management Displays

Integrated theatre displays grow at 9.1% by turning a monitor purchase into a video routing and management project covering four or so screens per theatre. That raises value per theatre several times over and it changes who decides, since integration involves clinical engineering, information technology and theatre management rather than a procurement officer comparing panels. Retrofitting integration into a working theatre is considerably harder and more disruptive than specifying it at build, which is why suppliers concentrate on new construction and major refurbishment. The commercial prize is that an integrated installation locks the display supplier in for the full ten year cycle across every screen rather than one. Nobody displaces an installed integration environment easily.
CAGR 9.1%
Full segment breakdown across 6 segments available in the complete report.

Regional Architecture and Country Demand Map

Demand follows theatre construction and minimally invasive procedure volume rather than population, since a display is bought when a theatre is built or refurbished rather than when a patient presents. East Asia leads on theatre construction volume, and integration penetration decides value per installation everywhere.

East Asia

East Asia holds 31% of demand, the largest regional share, growing at 7.9%. Note: this exceeds the standard band because Chinese theatre construction is the largest anywhere, display panel manufacturing is concentrated in the region, and endoscopic procedure adoption has advanced faster than in most Western markets. China compounds at 9.5%, the fastest national market. Japanese manufacturers hold much of the global surgical display position and supply demanding domestic theatres. Korean and Taiwanese hospitals specify integrated theatres routinely on new build, and regional demand is genuine new installation rather than replacement. Local display manufacturers compete hard on price into domestic construction, which compresses realised value per screen below Western levels considerably.
Share: 31% | CAGR: 7.9% (2026 to 2036)

North America

Twenty-six percent of demand sits in North America, growing at 6.6%. Integrated operating room projects are more common here than anywhere and specify around four displays per theatre, which raises value per installation substantially. Capital deferral is also more pronounced, with hospitals extending display replacement well beyond ten years under budget pressure while a working screen presents no clinical urgency. Group purchasing organisations contest the certification premium hardest here, occasionally accepting housed consumer panels where sterile field requirements permit them at all. Integrated projects specify around four displays per theatre, which raises value per installation substantially against a standalone replacement. Capital deferral is also more pronounced here than anywhere else in the world.
Share: 26% | CAGR: 6.6% (2026 to 2036)
Regional intelligence for 5 additional markets available in the complete report: Western Europe, South Asia and Pacific, Latin America, Middle East and Africa, Eastern Europe. Contact sales@marketmindsadvisory.com.
surgical-monitors-market-country-cagr-analysis-1787309370329

Selling What Surgeons Actually Notice

Hospitals buy resolution because it is comparable, surgeons care about latency and colour, and nobody measures either. Four positions matter, and two of them involve making an invisible problem visible to the person holding the budget. The other two concern reaching a theatre at construction rather than at replacement, and pricing certification honestly against where it is actually enforced.

Measure End-to-End Latency Across the Signal Chain

Surgeons detect disconnection from their instruments at around 30 milliseconds of delay, and hospitals routinely specify a fast display then feed it through a processing chain that adds far more. Suppliers who measure end-to-end latency from camera to screen, rather than quoting panel response time, expose a problem the surgeon already feels and cannot name. That reframes the purchase around something clinically real and it reaches theatre users rather than a procurement officer comparing resolution figures. Surgeons name the complaint as image quality because nothing else is available to them.
Market Impact: Latency perceptible at just 30 mill

Make Colour Drift Visible Through Calibration Services

Only around 23% of theatres perform any scheduled colour verification, so a display that has drifted over three years shows a very sharp image of tissue in slightly the wrong hue and nobody knows. Suppliers offering calibration as a service create a reason to act inside a ten year replacement cycle that otherwise produces no purchasing trigger at all. It also generates recurring revenue and regular contact with theatre staff between capital decisions. Regular theatre contact between capital decisions is worth more than the service revenue itself. Nothing else produces a trigger.
Market Impact: Calibration performed in only 23% o

Enter at Theatre Build Rather Than Display Replacement

A display is replaced roughly every ten years and an integrated theatre project replaces around four at once alongside the routing system, which locks the supplier in for a full cycle across every screen. Retrofitting integration into a working theatre is considerably harder than specifying it at build. Suppliers reaching clinical engineering during construction planning capture installations worth 4 screens each that a replacement-cycle approach never sees. A standalone display replacement is a procurement decision made on resolution and price alone, and the supplier who arrives at that point has already lost the theatre.
Market Impact: Capturing all of 4 screens per thea

Compete Where Certification Is Genuinely Enforced

Medical surgical displays command roughly 3.8 times consumer panel pricing on certification, ingress protection, cleanability and warranty in a wash-down environment rather than on image quality. Where enforcement is strict the premium holds; where a procurement department can house a consumer panel it does not. Suppliers who concentrate effort on jurisdictions and acuity settings with real enforcement defend pricing, and those bidding everywhere lose margin to a substitute they cannot match on cost. Bidding uniformly across every market simply gives that margin away. Certification depth is the only defence available.
Market Impact: Defending that entire 3.8 times cer

Who Controls the Margin Pool

Five manufacturers hold 62% measured on surgical display revenue, the basis applied throughout this section. Concentration is high because medical certification, sterile field engineering and integration capability all take years to build, while the panels themselves come from a small number of suppliers everybody shares. Sony and Barco lead from imaging and integration positions respectively.
Competition operates on three dimensions. Integration and video management capability decides participation in theatre projects worth several displays each. Camera and imaging platform relationships decide whether a display arrives as part of a system or as a standalone quotation. And certification depth decides whether the premium over housed consumer panels survives a procurement challenge. Panel quality decides almost none of it.

Two pressures are moving position. Integrated theatre projects keep raising the value of a system position over a component one, which favours suppliers with routing and management platforms. Meanwhile Asian construction adds installations where local manufacturers compete hard. Rankings will shift toward suppliers combining integration platforms with genuine regional presence. Falling panel prices strengthen the housed consumer substitute argument at the same time, which squeezes standalone display businesses from both directions simultaneously.
surgical-monitors-market-company-positioning-matrix-1787309370847

Competitive Moat and Risk Dimensions

SONY

Moat: Imaging chain and panel integration

Sony supplies surgical cameras, processing and displays as a matched chain, which addresses the end-to-end latency and colour consistency problems that a standalone display purchase cannot. A hospital buying the chain from one supplier removes the interface where latency accumulates and where responsibility for colour fidelity would otherwise be contested between vendors.
SONY

Risk: Theatre integration platform depth

Integrated operating room projects install around four displays alongside a video routing and management system, and the decision sits with clinical engineering and information technology rather than with imaging. A supplier strong on the imaging chain competes at a disadvantage where the integration platform rather than the picture determines who wins the whole theatre.
BARCO

Moat: Integration and video management platform

Barco built theatre video routing and management capability that turns a display purchase into a system project, locking the supplier in across every screen for a full ten year cycle. That platform reaches clinical engineering and information technology decision makers, and retrofitting a competitor into an installed integration environment is genuinely difficult.
BARCO

Risk: Imaging chain relationship absence

Latency and colour fidelity are determined across the whole camera and processing chain rather than at the display, and suppliers who also make the camera can address that end to end. An integration specialist depends on somebody else's imaging chain, which limits what it can promise about the two properties surgeons actually notice.

Players Tracked

Prominent Players

Sony
Barco
Olympus
Karl Storz
EIZO

Other Key Players

Stryker
Steris
Getinge
FSN Medical Technologies
Advantech
LG Electronics
Novanta
Richard Wolf
Ampronix
Double Black Imaging
Shenzhen Beacon Display
Jusha Medical
Wide Corporation
Medivators
Trilux Medical

Recent Developments

FEBRUARY 2025

Four-kilometre resolution becomes default specification on new theatre builds

Hospital construction and refurbishment specifications increasingly required four-kilometre resolution as standard rather than as a premium option, driven by procurement comparability as much as by clinical evidence. This reflects specification practice rather than any commercial development among display manufacturers. Latency and colour performance went unexamined in the same specifications.
Signal: Resolution wins because it is the single s
JUNE 2025

Latency across processing chains identified as unmeasured clinical variable

Surgical societies drew attention to end-to-end latency across camera and processing chains as a clinically relevant variable that hospitals specify displays without measuring. This reflects clinical commentary rather than any regulatory action or transaction among suppliers. Processing chains were identified as adding more delay than the displays themselves ever do.
Signal: Surgeons feel thirty milliseconds of lag a
OCTOBER 2025

Group purchasing challenges medical certification premium on displays

Purchasing organisations questioned the premium on medical-certified surgical displays where housed consumer panels might satisfy sterile field requirements in lower-acuity settings. These were procurement policy challenges rather than regulatory determinations or supplier developments. Enforcement rather than specification decided the outcome in each case. Lower-acuity settings were where substitution was accepted.
Signal: The premium survives only where certificat

Panels, Certification and Sealed Housings

Display panels account for roughly 44% of cost of goods and come from a small number of manufacturers who supply the whole industry, which means panel cost is broadly common across competitors. Sealed housings, ingress protection engineering and cleanable surfaces add about 16%. Medical device certification, testing and quality management sits outside cost of goods and is the largest barrier to entry rather than the largest cost.
Display panel pricing fell through 2023 and 2024 as consumer demand softened, which reduced input cost while simultaneously strengthening the argument that a housed consumer panel could substitute. Company annual reports across the medical display manufacturers disclose that certification and integration rather than panel supply drive their cost position. Energy Information Administration data on industrial electronics pricing documents the underlying component movement. Panel supply is common to the whole industry.

Exposure divides by integration depth rather than by scale. Component suppliers selling standalone displays compete against falling panel prices with certification as their only defence. Integration platform suppliers carry software development cost and capture system-level revenue that panel pricing barely touches. Suppliers who also make cameras absorb development cost across the chain, which is why they can address latency claims others cannot.
surgical-monitors-market-cost-volatility-analysis-1787309371041

Shift revenue mix toward integration and service contracts

Panel cost is common across competitors and falling, so a standalone display business competes on assembly and certification alone. Weighting revenue toward video management platforms and calibration service contracts moves the position away from a component whose price the whole industry shares, and it produces recurring revenue between ten year capital cycles. Ten year cycles otherwise produce silence.

Qualify dual panel sources against specification drift

Panel manufacturers periodically change specification or discontinue lines with limited notice, and a medical display certified against one panel cannot silently substitute another. Qualifying a second panel within the same certification file during initial development preserves supply continuity without a recertification exercise that would take longer than the shortage. Recertification takes longer than any shortage.

Price certification against enforcement rather than uniformly

The premium over housed consumer panels holds where certification requirements are genuinely enforced and collapses where a procurement department can substitute. Pricing by enforcement environment rather than uniformly across markets protects margin where it can be defended and avoids bidding into settings where the substitute wins on cost regardless. Uniform pricing forfeits the difference.

Portfolio Architecture for Margin Defence

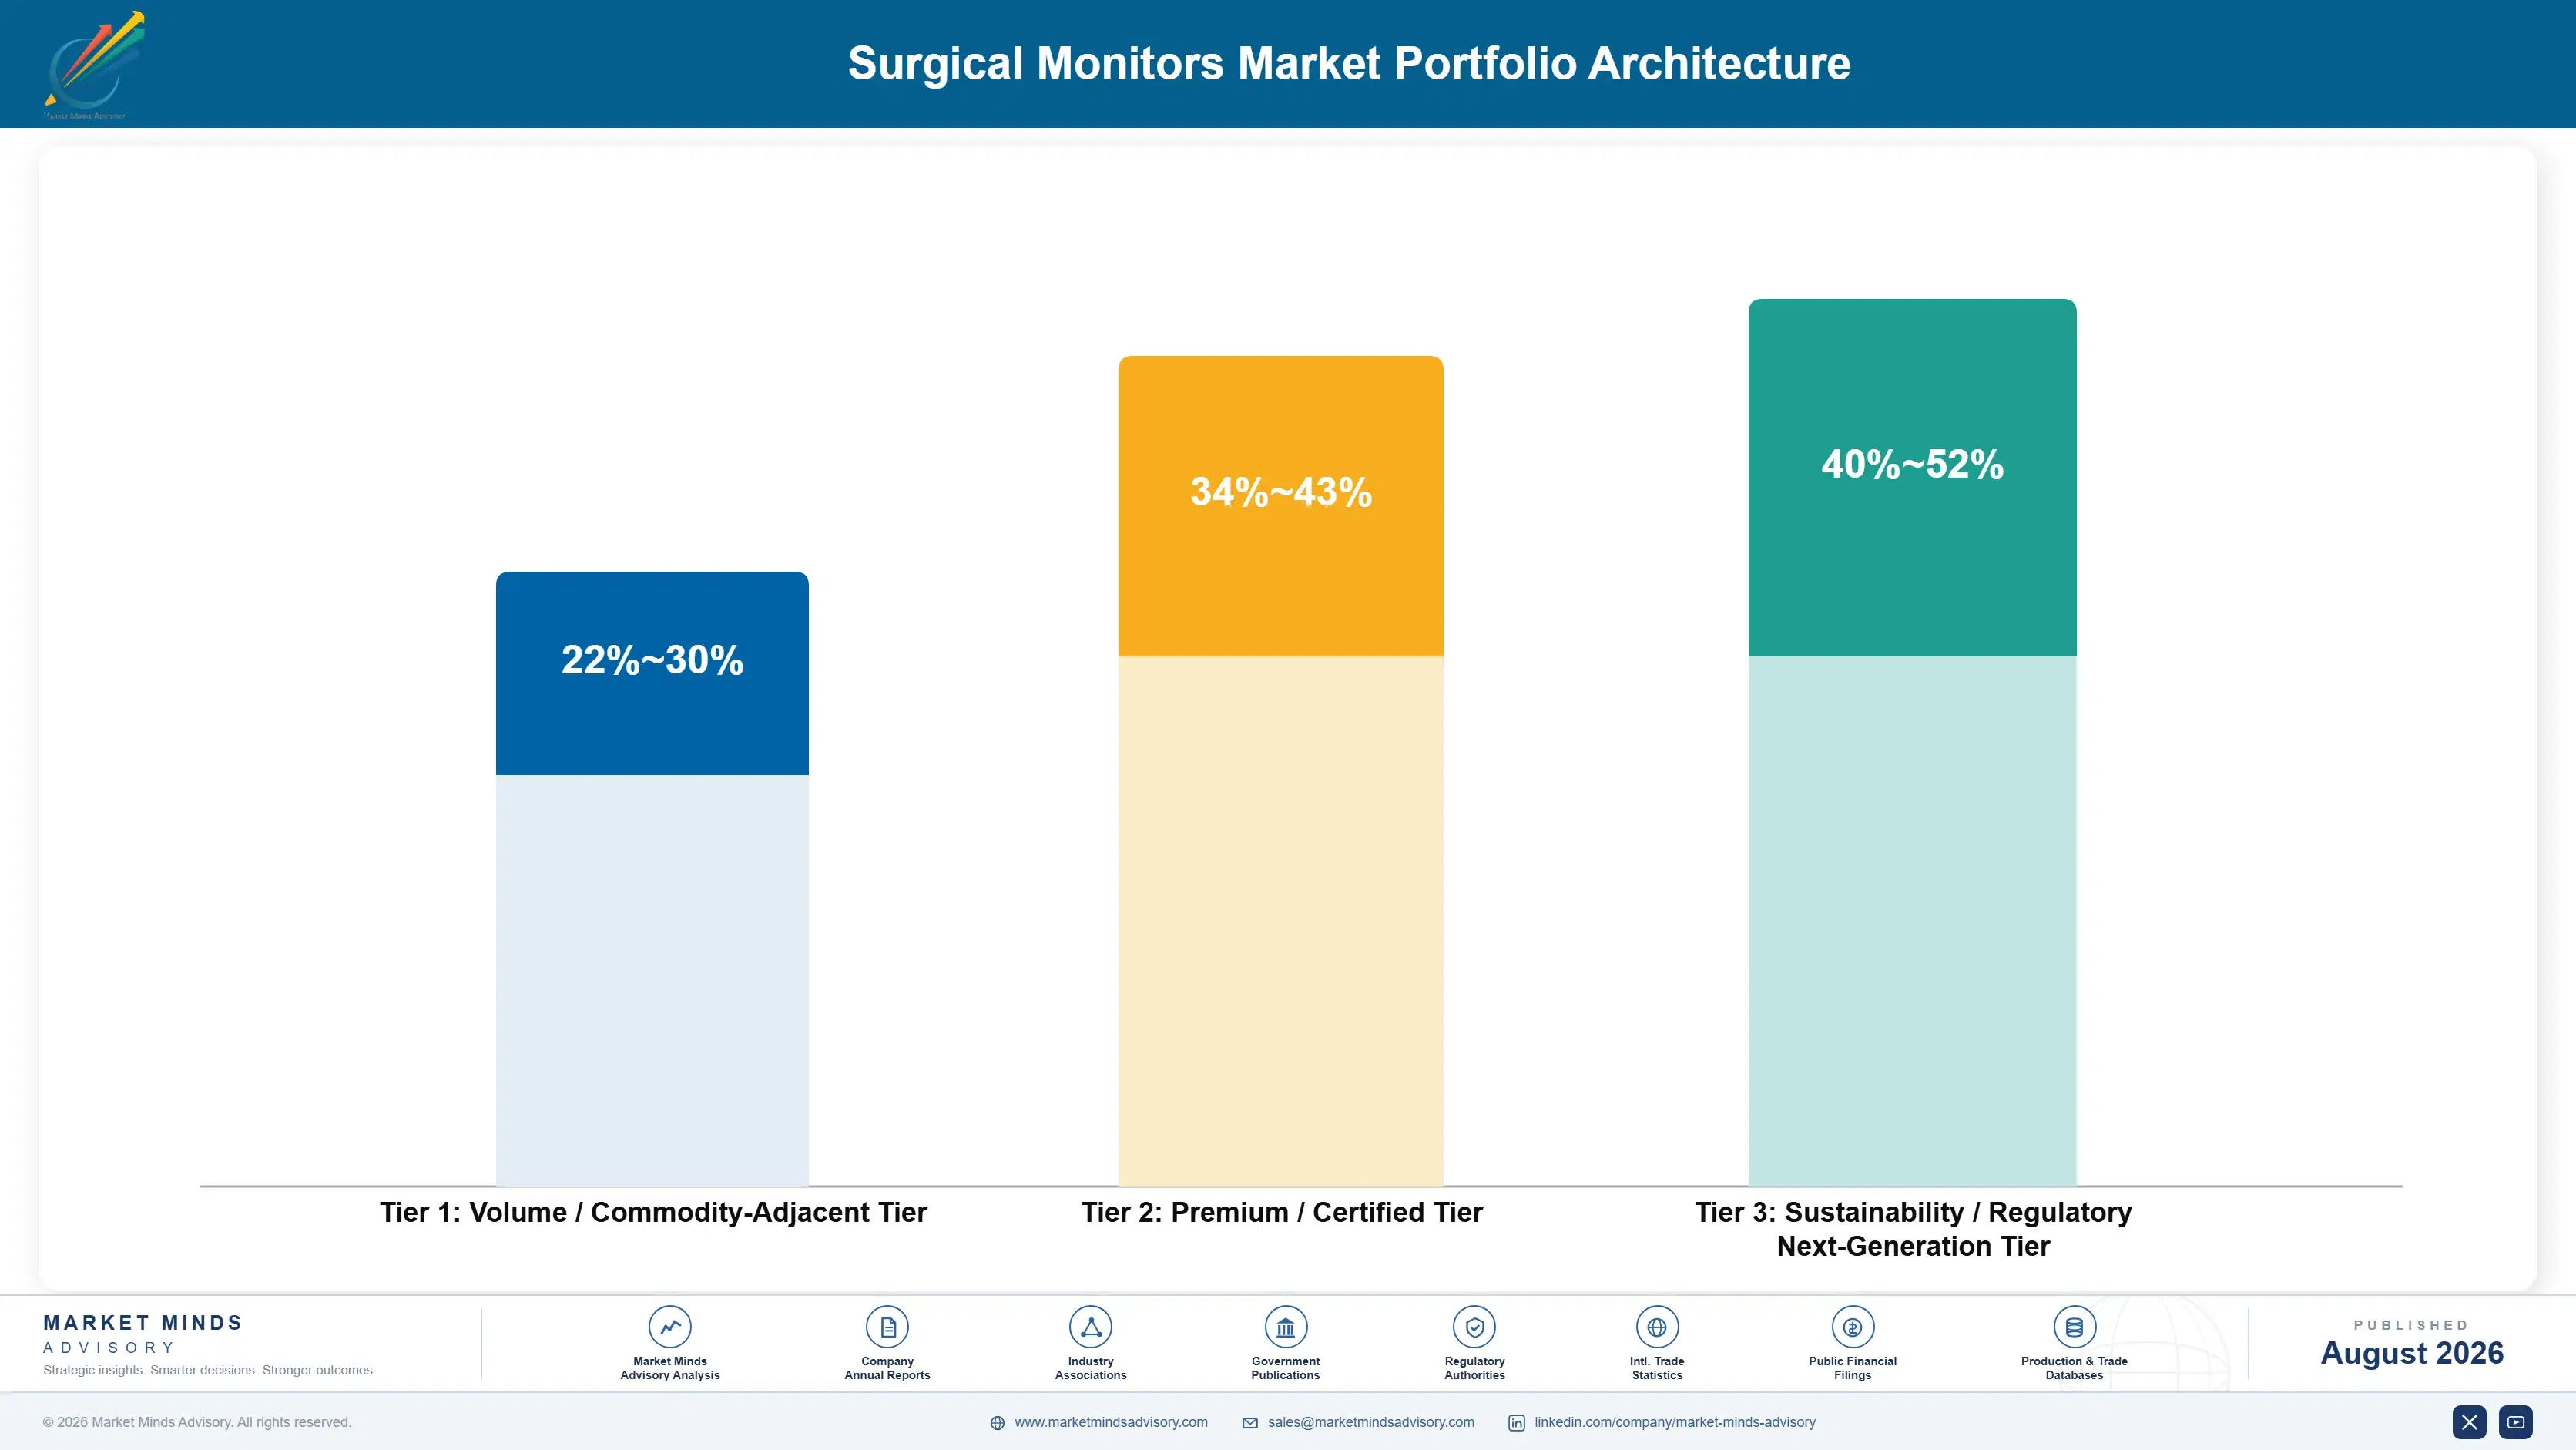
The portfolio separates on whether the display is a component or part of a system. Standalone high-definition displays are assembled certified panels competing on price. Four-kilometre displays add resolution procurement can compare. Three-dimensional displays serve robotic and specialist applications. Integrated video management displays are system sales, and hybrid theatre displays carry the most demanding certification requirements of all. Auxiliary monitors sit underneath all of it on price
The tension is between component economics and system economics. Standalone displays face falling panel prices and a housed consumer substitute, with certification as the only defence. Integrated installations command several times the value per theatre, involve entirely different decision makers, and lock the supplier in across a ten year cycle. A supplier optimised for component sales is defending a position that keeps narrowing.

High-value pools concentrate where a system rather than a screen is being bought. Integrated theatre installations, hybrid interventional suites and any position built on measured latency across a matched imaging chain all qualify, and none competes on resolution specification alone. What they share is that the customer is buying an outcome across a whole theatre rather than a panel, which is the only escape from a component comparison here.

Volume / Commodity-Adjacent Tier

Standalone high-definition surgical displays and boom-mounted auxiliary monitors sold on price and resolution through tenders. Panel cost is common across competitors, and certification is the only defence against a housed consumer panel substitute.
Gross Margin: 28-40%

Premium / Certified Tier

Four-kilometre resolution surgical displays and three-dimensional stereoscopic displays for robotic and specialist use. Certification depth and matched imaging chain performance qualify the supplier, and resolution is what procurement actually compares.
Gross Margin: 42-56%

Sustainability / Regulatory / Next-Generation Tier

Integrated operating room video management displays and hybrid theatre interventional systems. The wide margin range separates established integration platforms locking in whole theatres from newer entrants selling screens into somebody else's routing environment.
Gross Margin: 46-70%
surgical-monitors-market-portfolio-architecture-1787309371539

High-value Sub-segments and Strategic Watch-out

Four-Kilometre Resolution Displays

Compounding at 10.35% because resolution is the one specification procurement can compare across quotations. Clinical benefit is real in fine dissection and modest elsewhere against what latency and colour accuracy actually contribute to the procedure. A matched camera and processing chain is required to deliver any of it.
Gross Margin: 46-56%

Integrated Video Management Displays

Growing at 9.1% by turning a monitor purchase into a system project covering around four screens per theatre. Retrofitting a competitor into an installed integration environment is genuinely difficult, which locks the supplier in for a decade. Clinical engineering rather than procurement decides these projects.
Gross Margin: 52-70%

Standalone High-Definition Displays

The volume core at 3.4%, competing on price against falling panel costs and a housed consumer panel substitute. Certification is the only real defence, and it holds only where requirements are enforced rather than merely stated. Panel cost is common across every competitor in the segment.
Gross Margin: 28-40%

Three-Dimensional and Stereoscopic Displays

The strategic watch-out. Depth perception genuinely helps in fine reconstructive and robotic work, and adoption outside robotic consoles has stalled repeatedly on surgeon fatigue and eyewear that nobody enjoys wearing for hours. Eyewear that nobody enjoys wearing for hours is the specific obstacle, and no manufacturer has solved it.
Gross Margin: 44-64%

Bought With the Theatre, Forgotten After

Revenue arrives with construction rather than with clinical activity. A display is purchased when a theatre is built or refurbished and then runs for around ten years without generating any further revenue, which makes the installed base almost entirely dormant commercially. Integration platforms and calibration services are the only mechanisms that produce contact and revenue between capital events, and very few suppliers pursue either seriously. The installed base is commercially dormant for a
Depth varies by theatre type and acuity. Hybrid interventional suites buy the most displays at the highest certification requirement. Integrated general surgical theatres buy around four screens with routing systems. Standard laparoscopic theatres buy one or two displays. Day surgery and lower-acuity settings buy the cheapest option that satisfies whatever enforcement applies, which is where housed consumer panels appear.

The deciding party depends entirely on whether integration is involved. A standalone display replacement is a procurement decision made on resolution and price. An integrated theatre installation involves clinical engineering, information technology, theatre management and the surgical leads together over many months. Surgeons influence the second and are rarely consulted on the first, which is why latency goes unmeasured.
surgical-monitors-market-end-use-penetration-index-1787309372027

Where Display Suppliers Win

These are among the four positions where our research anticipates prominent divergence between winners and laggards over the coming forecast period. Each is grounded in the demand model, the regulatory perimeter, and the announced capacity pipeline.
01 / END-TO-END LATENCY MEASUREMENT

The surgeon feels the lag and nobody has measured it

Surgeons detect disconnection from their instruments at around 30 milliseconds of delay, and hospitals routinely specify a fast display then run it through a processing chain adding considerably more. Suppliers who measure latency from camera to screen rather than quoting panel response time expose a problem the surgeon already feels and cannot name. That reframes the purchase around something clinically real and reaches theatre users rather than procurement, who are comparing resolution figures instead and have no latency number available.
02 / COLOUR DRIFT VISIBILITY

A sharp image in the wrong hue looks perfectly fine

Only around 23% of theatres perform any scheduled colour verification at all, so a display that has drifted over three years shows a very sharp image of tissue in slightly the wrong colour and nobody notices. Suppliers who offer calibration as a service create a purchasing trigger inside a ten year cycle that otherwise generates nothing at all. It also produces both recurring revenue and regular theatre contact between capital decisions, which is worth considerably more than the calibration revenue itself.
03 / CONSTRUCTION STAGE ENTRY

Four screens at build beats one at replacement

A standalone display is replaced roughly every ten years while an integrated theatre project replaces around four at once alongside the routing system, locking the supplier in across every screen for a full cycle. Retrofitting integration into a working theatre is considerably harder and more disruptive than specifying it at build. Suppliers who reach clinical engineering during construction planning capture installations that a replacement-cycle approach never gets to see, and the integration environment then resists any competitor for a decade.
04 / ENFORCEMENT-MATCHED PRICING DISCIPLINE

Certification premiums hold only where somebody checks

Medical surgical displays command roughly 3.8 times consumer panel pricing on certification, ingress protection, cleanability and wash-down warranty rather than on image quality the shared panel already provides. Where enforcement is strict that premium holds up, and where a procurement department can simply house a consumer panel instead it does not. Concentrating effort on those jurisdictions and acuity settings with real enforcement defends margin that uniform bidding simply gives away, and the substitute wins on cost wherever nobody is actually checking.

Engagement Snapshot From the Field

A live engagement with an industry participant carrying material or product regulatory and market exposure ahead of a defining policy shift, showing how our research translates into a defensible multi-year portfolio strategy.
MARKET MINDS ADVISORY · CLIENT ENGAGEMENT SUMMARY
Surgical Monitors Producer Strategic Portfolio Review and Transition Roadmap 2026·Investment Scenario on Surgical Monitors Exposure Evaluation 2025-26
CLIENT PROFILE
A private hospital group operating 34 operating theatres across nine sites, with roughly USD 780 million in surgical revenue and a laparoscopic and robotic case mix above 60% of volume (client-reported, unverified by MMA). Displays had been purchased individually by site over a decade, with no group specification and no calibration programme anywhere. Latency had never been measured at any site.
STRATEGIC CHALLENGE
Surgeons at four sites had complained repeatedly about visualisation quality and the group had responded by approving four-kilometre display upgrades at two of them. Complaints continued after the upgrades. Nobody had measured latency across the camera and processing chain or checked colour calibration on any display in the estate. Both assumptions went unexamined.
MMA APPROACH
MMA measured end-to-end latency from camera to display across every laparoscopic stack in the group, and performed colour verification against reference standards on all 34 theatre primary displays. Results were compared against the sites where surgeons had raised complaints and against the recent upgrades. Upgrade decisions already taken were then reassessed against the measured results.
KEY FINDINGS
  1. End-to-end latency ranged from 21 to 74 milliseconds across the estate, and the three highest-latency stacks were all at sites where surgeons had complained most persistently.
  2. The two recently upgraded four-kilometre displays sat behind processing chains adding over 60 milliseconds, so the upgrade had improved resolution while leaving the actual complaint entirely untouched.
  3. Colour verification failed against reference standards on 19 of the 34 primary displays, with the worst drift on units between six and nine years old that were still considered fully serviceable.
  4. No site had ever performed scheduled colour verification, and no purchase specification in the group's entire history had mentioned latency at all.
CLIENT PROFILE
A private hospital group operating 34 operating theatres across nine sites, with roughly USD 780 million in surgical revenue and a laparoscopic and robotic case mix above 60% of volume (client-reported, unverified by MMA). Displays had been purchased individually by site over a decade, with no group specification and no calibration programme anywhere. Latency had never been measured at any site.
STRATEGIC CHALLENGE
Surgeons at four sites had complained repeatedly about visualisation quality and the group had responded by approving four-kilometre display upgrades at two of them. Complaints continued after the upgrades. Nobody had measured latency across the camera and processing chain or checked colour calibration on any display in the estate. Both assumptions went unexamined.
MMA APPROACH
MMA measured end-to-end latency from camera to display across every laparoscopic stack in the group, and performed colour verification against reference standards on all 34 theatre primary displays. Results were compared against the sites where surgeons had raised complaints and against the recent upgrades. Upgrade decisions already taken were then reassessed against the measured results.
KEY FINDINGS
  1. End-to-end latency ranged from 21 to 74 milliseconds across the estate, and the three highest-latency stacks were all at sites where surgeons had complained most persistently.
  2. The two recently upgraded four-kilometre displays sat behind processing chains adding over 60 milliseconds, so the upgrade had improved resolution while leaving the actual complaint entirely untouched.
  3. Colour verification failed against reference standards on 19 of the 34 primary displays, with the worst drift on units between six and nine years old that were still considered fully serviceable.
  4. No site had ever performed scheduled colour verification, and no purchase specification in the group's entire history had mentioned latency at all.
RECOMMENDED STRATEGY
Phase 1: Phase 1 (months 1 to 4): Replace or reconfigure the three highest-latency processing chains rather than the displays attached to them. Phase 2: Phase 2 (months 4 to 11): Establish annual colour verification across all 34 primary displays and replace the worst-drifted units. Phase 3: Phase 3 (months 11 to 20): Write latency and colour specifications into group purchasing standards for every future theatre project.
OUTCOME
Surgeon visualisation complaints ceased at all four affected sites within five months of reconfiguring the processing chains, before any further display was replaced (client-reported, unverified by MMA). Eleven displays were replaced on colour drift grounds rather than age, and visualisation capital spend fell roughly 30% against plan (client-reported, unverified by MMA). Latency and colour now appear in every purchase specification.

Frequently Asked Questions

Foundational context covering the market sizes, CAGR, scope, country, region and competition that inform every finding below. This section is provided to cover basics and most often pre-purchase conversations, answered from the MMA Primary Research Dataset.

What is the current size of the Surgical Monitors Market?

The global market was worth USD 1.9 billion in 2025, reaching USD 2.03 billion in 2026. East Asia holds the largest regional share at 31% of demand.

How large will the Surgical Monitors Market be by 2036?

MMA forecasts USD 3.96 billion by 2036, an expansion multiple of 1.95 times the 2026 base. That represents roughly USD 1.93 billion of incremental value.

What is the CAGR for the Surgical Monitors Market 2026 to 2036?

The base case compounds at 6.9% annually, with a bull case of 8.1% and a bear case of 5.7%. Historical growth from 2020 to 2025 ran at 5.8%.

Which segment is growing fastest?

Four-kilometre resolution surgical displays compound at 10.35%, exactly 1.50 times the market rate. Procurement comparability rather than clinical benefit drives most of that growth rate.

Who are the major companies in the Surgical Monitors Market?

Sony, Barco, Olympus, Karl Storz and EIZO hold a combined 62% of the market. Certification depth and integration capability sustain those positions rather than panel technology.

Which country is growing fastest?

China compounds at 9.5%, ahead of every other national market. New theatre construction there adds complete display installations rather than merely replacing any existing units.

Report Segmentation Architecture

The full report scope spans multiple orthogonal segmentation dimensions, with cross-tabulated demand data provided for each dimension pair. Coverage extends further to regional breakdowns, trend trajectories, and the competitive detail needed to support segment-level decision-making.

By Display Type and Integration Role

  • High-Definition Surgical Displays
  • Four-Kilometre Resolution Surgical Displays
  • Three-Dimensional and Stereoscopic Surgical Displays
  • Integrated Operating Room Video Management Displays
  • Hybrid Theatre and Interventional Imaging Displays
  • Portable and Boom-Mounted Auxiliary Monitors

By End-Use Industry

  • General and Laparoscopic Surgery Theatres
  • Robotic Surgery Suites
  • Hybrid and Interventional Cardiology Suites
  • Orthopaedic and Arthroscopy Theatres
  • Day Surgery and Ambulatory Centres

By Commercial Dimension

  • Integrated Theatre Project Supply
  • Direct Hospital and Tender Sales
  • Imaging Platform Bundled Supply
  • Calibration and Service Contracts

By Region

  • North America
  • Western Europe
  • East Asia
  • South Asia and Pacific
  • Latin America
  • Middle East and Africa
  • Eastern Europe

Scope, Methodology, and Coverage

Every figure in this report is reproducible from documented input assumptions. The scope below maps the historical period, the forecast horizon, the segmentation dimensions, and the countries covered, alongside the underlying primary and qualitative methodology.
Historical Period
2020 to 2025
Forecast Period
2026 to 2036
Base Year
2025 (USD billions; MMA Primary Research Dataset, August 2026)
Market Definition
The market covers displays and visualisation monitors used within the sterile field and operating room environment, spanning high-definition surgical displays, four-kilometre resolution surgical displays, three-dimensional and stereoscopic surgical displays, integrated operating room video management displays, hybrid theatre and interventional imaging displays, and portable and boom-mounted auxiliary monitors, together with the calibration and service contracts supplied alongside them. Diagnostic radiology reading displays, endoscopes and camera systems, surgical robotic consoles and their integrated displays, surgical lighting and booms, general clinical and administrative displays, and video recording and archiving systems are excluded. Sizing is measured at manufacturer revenue in current prices.
Quantitative Units
USD billions (current prices); display units, theatre installations and latency in milliseconds where applicable
Segmentation Dimensions
By Display Type and Integration Role; By End-Use Industry; By Commercial Dimension; By Region
Regions Covered
North America, Western Europe, East Asia, South Asia and Pacific, Latin America, Middle East and Africa, Eastern Europe
Countries Covered
China, USA, Japan, Germany, South Korea, India, France, UK, Italy, Spain, Netherlands, Canada, Taiwan, Thailand, Malaysia, Vietnam, Indonesia, Australia, Brazil, Mexico, Argentina, Colombia, Turkey, Saudi Arabia, UAE, South Africa, Egypt, Poland, Czech Republic, Switzerland, and additional markets relevant to this sector
Key Companies Profiled
Sony, Barco, Olympus, Karl Storz, EIZO, Stryker, Steris, Getinge, FSN Medical Technologies, Advantech, LG Electronics, Novanta, Richard Wolf, Ampronix, Double Black Imaging, Shenzhen Beacon Display, Jusha Medical, Wide Corporation, Medivators, Trilux Medical
Quantitative Methodology
Primary survey, n=3,800 respondents, Q4 2025, six countries; demand-side model with trade association cross-validation
Qualitative Methodology
47 expert interviews, Q4 2025; applied to validate demand model assumptions, identify emerging dynamics, and assess competitive positioning
Report Format
PDF and XLSX data workbook (Word format preview document)
Publisher
Market Minds Advisory
Report Code
MMA-2026-MED-990
Published
August 2026
Contact
sales@marketmindsadvisory.com | www.marketmindsadvisory.com

Purchase the full Surgical Monitors Market Report (2026 to 2036).

The full report sizes surgical monitors across six display categories, three commercial dimensions and seven regions, with annual forecasts to 2036 under base, bull and bear scenarios. End-to-end latency across camera and processing chains is measured against surgeon perception thresholds, which is the clinically relevant variable that purchase specifications routinely omit. Colour calibration compliance is quantified by health system and theatre type. Integrated theatre project penetration is tracked against standalone display replacement. Panel supply concentration is mapped across the manufacturer base, and twenty manufacturers are profiled on a consistent surgical display revenue basis.
End-to-end latency measured against surgeon perception thresholds
Colour calibration compliance quantified by health system and theatre
Integrated theatre penetration tracked against standalone display replacement
Certification premium durability assessed by enforcement environment
Panel supply concentration mapped across medical display manufacturers
Replacement cycle length compared across public and private operators

Built For The People Who Decide

From boardroom strategy to bench-side execution, this report is read cover-to-cover by leaders shaping the next decade of their industry, turning demand scenarios, market dynamics and valuation benchmarks into decisions.
CXOs/ Presidents/ VPs/ Managers
M&A and Corporate Development
Strategy Teams and R&D Heads
Procurement and Product Directors
Regulatory and Compliance Leaders
Investor Relations and Equity Analysts