Market Minds Advisory
Surfactants for Enhanced Oil Recovery (EOR) Market

Surfactants for Enhanced Oil Recovery (EOR) Market: Surfactants for Enhanced Oil Recovery Market: The Application Moved And Nobody Followed

Chemical flooding has been five years away for forty years. Meanwhile most of the surfactant now sold to oilfields goes into completions, and hardly anybody in it has repositioned for it.

Lead Analyst

Published

September 2026

Make Smarter Decisions with Customized Research Insights

Request a free sample report and evaluate market opportunities, growth trends, and competitive dynamics relevant to your business needs.

2025 MARKET VALUE$2.1BMarket Size 2025
2036 FORECAST VALUE$5.4BBase Case , 2026 to 2036
CAGR 2026 TO 20369.0 %Bull 10.2% / Bear 7.8%
INCREMENTAL OPPORTUNITY$3.1BNet 10- year value creation
EXPANSION MULTIPLE2.37x2036 value over 2026 base
Strategic Levers
M&A Pipeline
Regional Outlook
Country Rankings
Competitive Intelligence
Segmental Deep-dive
Call-Us : 91 93563 13602

Executive Snapshot and Market Trajectory.

The category quietly changed application while everybody argued about tertiary recovery. Some 64% of oilfield surfactant volume now goes into fracturing fluid and flowback rather than into any chemical flood, and that use pays sooner, contracts faster and never waits thirty months for a reservoir to respond.
Bio-based surfactants and biosurfactants grow at 13.5%, half again the market rate of 9.0%, and the driver is produced water disposal rather than any environmental preference, because a readily degradable molecule is easier to permit downstream. North America holds 38% of demand, far outside any normal band, because unconventional completions consume surfactant at volumes no chemical flooding programme anywhere approaches. That inversion took a single decade and most suppliers still run the old model.
Concentration is moderate at 41% of oilfield supply, because the chemistry is made by large surfactant producers serving many industries and oilfield is rarely the largest of them. The commercially decisive capability is not molecular design. It is being qualified with the service companies who actually specify the blend, since an operator almost never buys a surfactant directly. Most producers still call on operators who cannot buy from them.
Market Definition
The surfactants for enhanced oil recovery market covers interfacial active chemistries supplied into oilfield applications that mobilise trapped hydrocarbon, spanning anionic sulfonates and sulfates, nonionic ethoxylates and alkyl polyglucosides, amphoteric and betaine surfactants, cationic surfactants, internal olefin and alkyl aryl sulfonates, and bio-based surfactants and biosurfactants. Scope covers volume supplied into chemical flooding programmes and into well completion, fracturing and flowback applications. Excluded are polymers supplied for viscosity control, alkali chemicals, demulsifiers and production chemicals, drilling fluid additives, and surfactants supplied to non-oilfield industries.
Base Year Value
$2.1B in 2025 (MMA Primary Research Dataset, September 2026)
Forecast Period
2026 to 2036, eleven discrete annual values
CAGR
9.0% base case. Bull 10.2%. Bear 7.8%.
Fastest Growth Segment
Bio-Based Surfactants and Biosurfactants: 13.5% CAGR
Fastest Growth Country
India: 11.2% CAGR
Fastest Growth Region
South Asia and Pacific: 11.2% CAGR
Largest Region
North America: 38% of 2025 global value
Market Leaders
BASF, Stepan Company, Sasol, Nouryon and Syensqo. Source: MMA Analysis, July 2026.
Primary Survey
n=3,800 procurement and R&D decision-makers, Q4 2025, six countries
Methodology
Demand-side build-up, cross-validated against public data, 47 expert interviews

Surfactants for Enhanced Oil Recovery (EOR) Market Forecast Scenarios

surfactants-for-enhanced-oil-recovery-eor-market-size-forecast-scenario-1788234734854
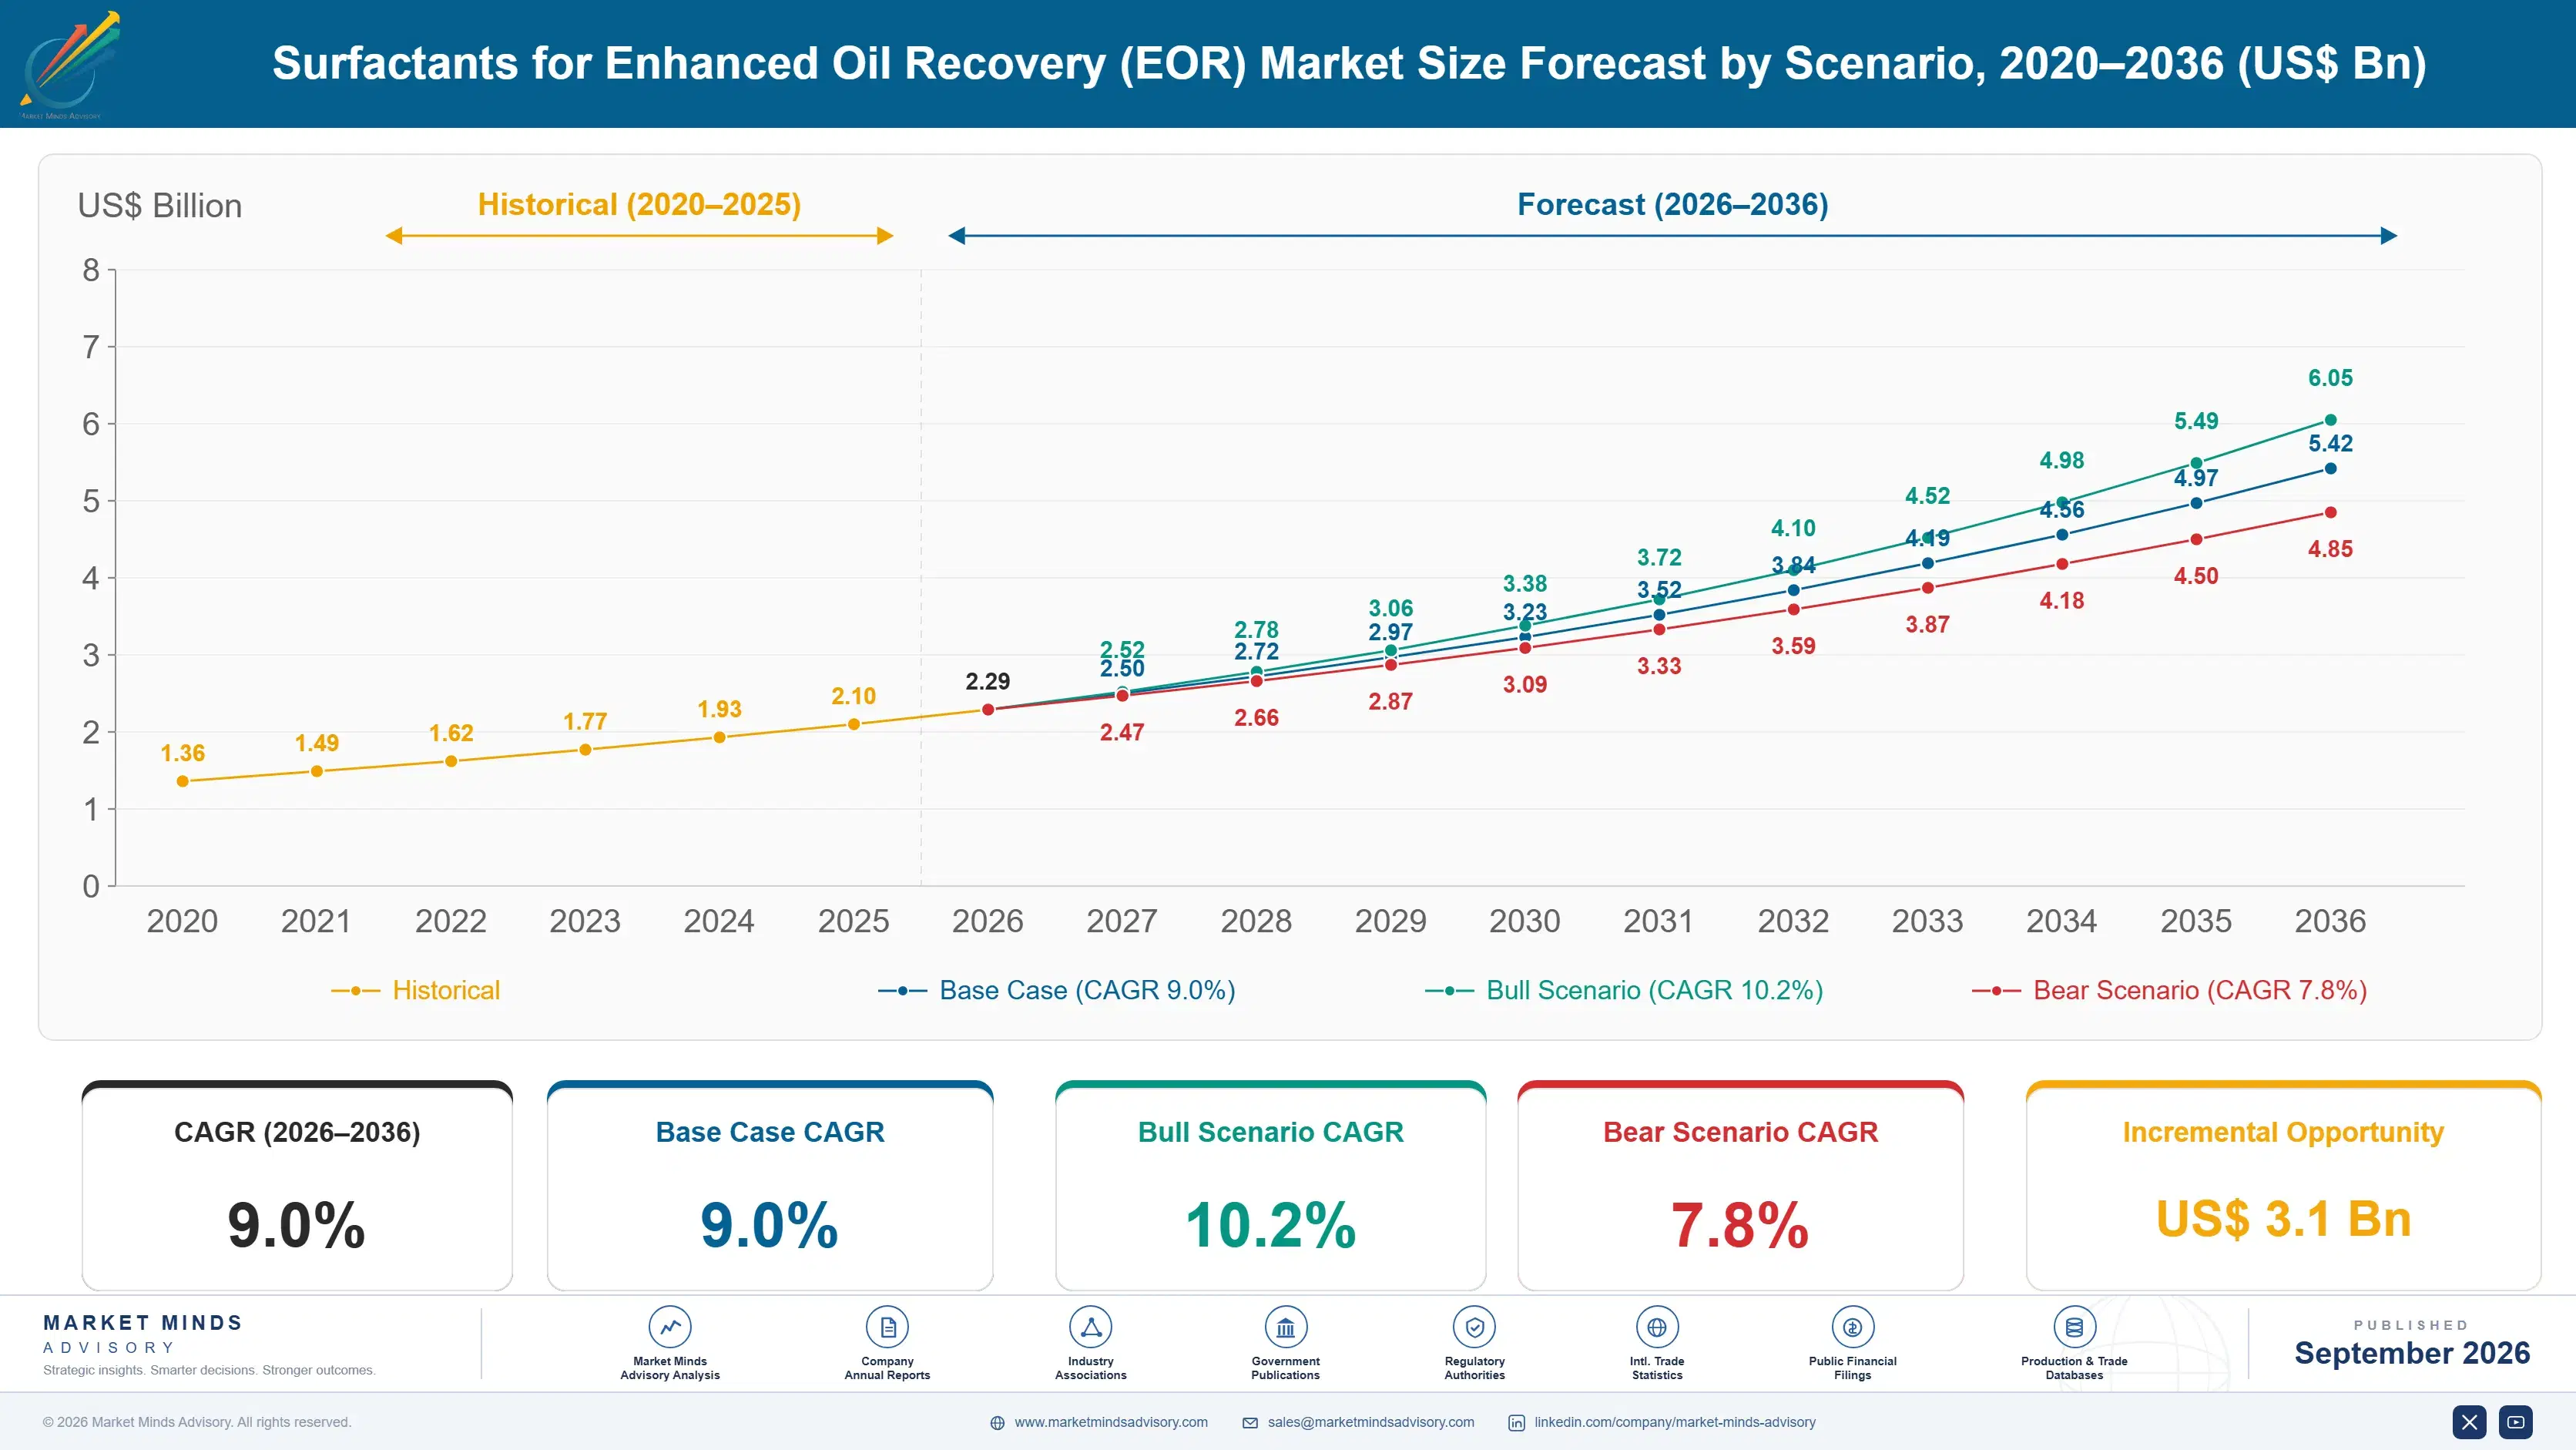
Between 2020 and 2025 the sector compounded at 7.8% and the composition changed far more than the total. Flooding volumes stagnated as pilots stalled on cost per incremental barrel, while completions consumption rose with every longer lateral and larger fracturing job. The category grew because unconventional drilling grew, and very little of that had anything to do with enhanced recovery at all.
The 9.0% base case rests on three mechanisms. Completions surfactant volume tracks lateral length and proppant loading, both of which keep rising independently of oil price. Produced water disposal rules are tightening across producing regions, which favours degradable chemistries and raises the value of the specification. And national oil companies with recovery factor mandates keep funding flooding programmes through cycles that stop commercial operators. None of the three depends on chemical flooding finally becoming economic.
The bull case at 10.2% turns on surfactant costs falling far enough that flooding pencils at prevailing oil prices without any policy support, which forty years of effort have not yet achieved. The bear case at 7.8% is unconventional activity: this is now a completions business, and a sustained fall in North American drilling removes much of the demand within two quarters.

Completions Took The Volume

The name of this category no longer describes most of what it sells. Some 64% of oilfield surfactant volume goes into fracturing fluid and flowback recovery on unconventional wells, where the chemistry helps load fluid return and improves early production. That application buys on schedule and price against a blend sheet, and pays within weeks rather than waiting for a reservoir.
TOP FIVE CONCENTRATION41%Share of oilfield supply volume held by five producers
COMPLETIONS VOLUME SHARE64%Portion now used in well completion rather than flooding
INCREMENTAL BARREL COSTUSD 19Chemical cost per additional barrel recovered from flooding
ROCK ADSORPTION LOSS0.9 mg/gChemical bound to reservoir rock instead of reaching oil
FEEDSTOCK COST SHARE37%Portion of production cost from a single feedstock
RECOVERY FACTOR UPLIFT12 pointsAdditional oil in place recovered by a successful flood
Chemical flooding remains the more interesting technical problem and the smaller business. A successful flood adds around twelve recovery factor points, and the chemistry costs around USD 19 per incremental barrel before facility modifications. Adsorption onto reservoir rock at roughly 0.9 milligrams per gram takes a substantial share of what is injected. Those numbers have improved for forty years without crossing the line operators need.
The route to market explains more than the chemistry does. An operator almost never buys a surfactant; a service company specifies a blend and buys the components, so a producer's commercial position depends on being qualified with three or four service organisations rather than on any relationship with the company drilling the well. Producers still calling on operators are calling on people who cannot place an order.
"The laboratories in this business are still solving tertiary recovery and the invoices are being written for frac fluid. Whoever admits that first and rebuilds the sales organisation around service company qualification is going to take a great deal of share very quietly."
Director, Oilfield Chemistry Practice · MMA Chemicals and Materials Practice · September 2026

Market Trends

Completions consumption overtook flooding within a decade

Unconventional wells with laterals running several kilometres and fracturing jobs consuming enormous fluid volumes now take 64% of oilfield surfactant supply, using the chemistry to aid load recovery and early production rather than to mobilise residual oil in a mature reservoir. That application contracts in weeks against a service company blend sheet, pays within a single quarter and scales directly with lateral length and proppant loading. Chemical flooding remains the category's identity and no longer its revenue. Most producers still run laboratories and sales organisations built entirely around the smaller application.
Market Impact: Scales across 3 kilometre laterals
Produced water rules now drive chemistry selection

Tightening produced water disposal and reuse requirements across North American and Middle Eastern producing regions have made downstream permitability a selection criterion alongside performance, because a chemistry that complicates water treatment costs the operator more than it saves at the wellhead. Readily degradable and bio-based molecules clear that hurdle where persistent chemistries increasingly do not. Bio-based surfactants grow at 13.5% against a market rate of 9.0% for that reason rather than for any environmental preference anybody holds. The regulator moved the specification and the marketing has yet to catch up.
Market Impact: Adds 12 recovery factor points

Market Opportunities and Growth Drivers

Lateral length and proppant loading keep rising

Unconventional wells have grown longer and fracturing jobs larger every year for a decade, and surfactant consumption scales directly with both because more fluid and more rock contact require more chemistry to recover the load. That growth is independent of oil price within any normal range, since operators drilling at all drill the longest laterals their equipment allows. North America takes 38% of category demand almost entirely on this basis. The demand is mechanical rather than economic, which makes it considerably more predictable than anything in chemical flooding has ever been.
Market Impact: Costs USD 19 per incremental barrel

Recovery mandates keep national programmes funded

State oil companies across China, India and the Middle East operate under recovery factor targets set as policy rather than derived from barrel economics, which keeps chemical flooding programmes funded through price cycles that stop commercial operators within weeks. A successful flood adds around twelve recovery factor points on fields that have already produced for decades, which is exactly what those mandates require. Indian growth at 11.2% is the fastest of any country covered and rests on this mechanism. It is a policy signal rather than a market one, and suppliers reading it as demand misjudge its durability.
Market Impact: Costs more than 12 points gain

Market Restraints and Challenges

Cost per incremental barrel has never crossed the line

Chemical flooding costs around USD 19 per incremental barrel in surfactant alone before facility modifications, produced fluid handling and the polymer that usually accompanies it, and that figure has improved steadily for forty years without ever reaching where commercial operators will commit capital. The root cause is adsorption onto reservoir rock at roughly 0.9 milligrams per gram, which means a large share of what is injected never reaches oil. Commercial impact is a permanently deferred market. Participants are responding with sacrificial agents, lower dosage chemistries, co-injection design and targeting national programmes where the arithmetic is not the test.
Market Impact: Takes 64% of supply volume

Alkali improves recovery and damages the facility

Alkali-surfactant-polymer flooding delivers better recovery than surfactant and polymer alone, and the alkali produces scaling in wellbores, stable emulsions in separators and corrosion across surface equipment that frequently costs more than the additional oil is worth. The root cause is that alkali changes water chemistry throughout the production system rather than only in the reservoir. Commercial impact is that operators who tried ASP often will not try it twice. Mitigation runs through alkali-free surfactant-polymer designs, scale inhibitor programmes, facility upgrades priced into the project and lower alkali concentrations traded against recovery.
Market Impact: Grows at 13.5% against 9.0%
3 additional market trends, 4 additional growth drivers, and 2 additional restraints and challenges are covered in the full report. Contact sales@marketmindsadvisory.com to access the complete intelligence.

Segment CAGR and Growth Architecture

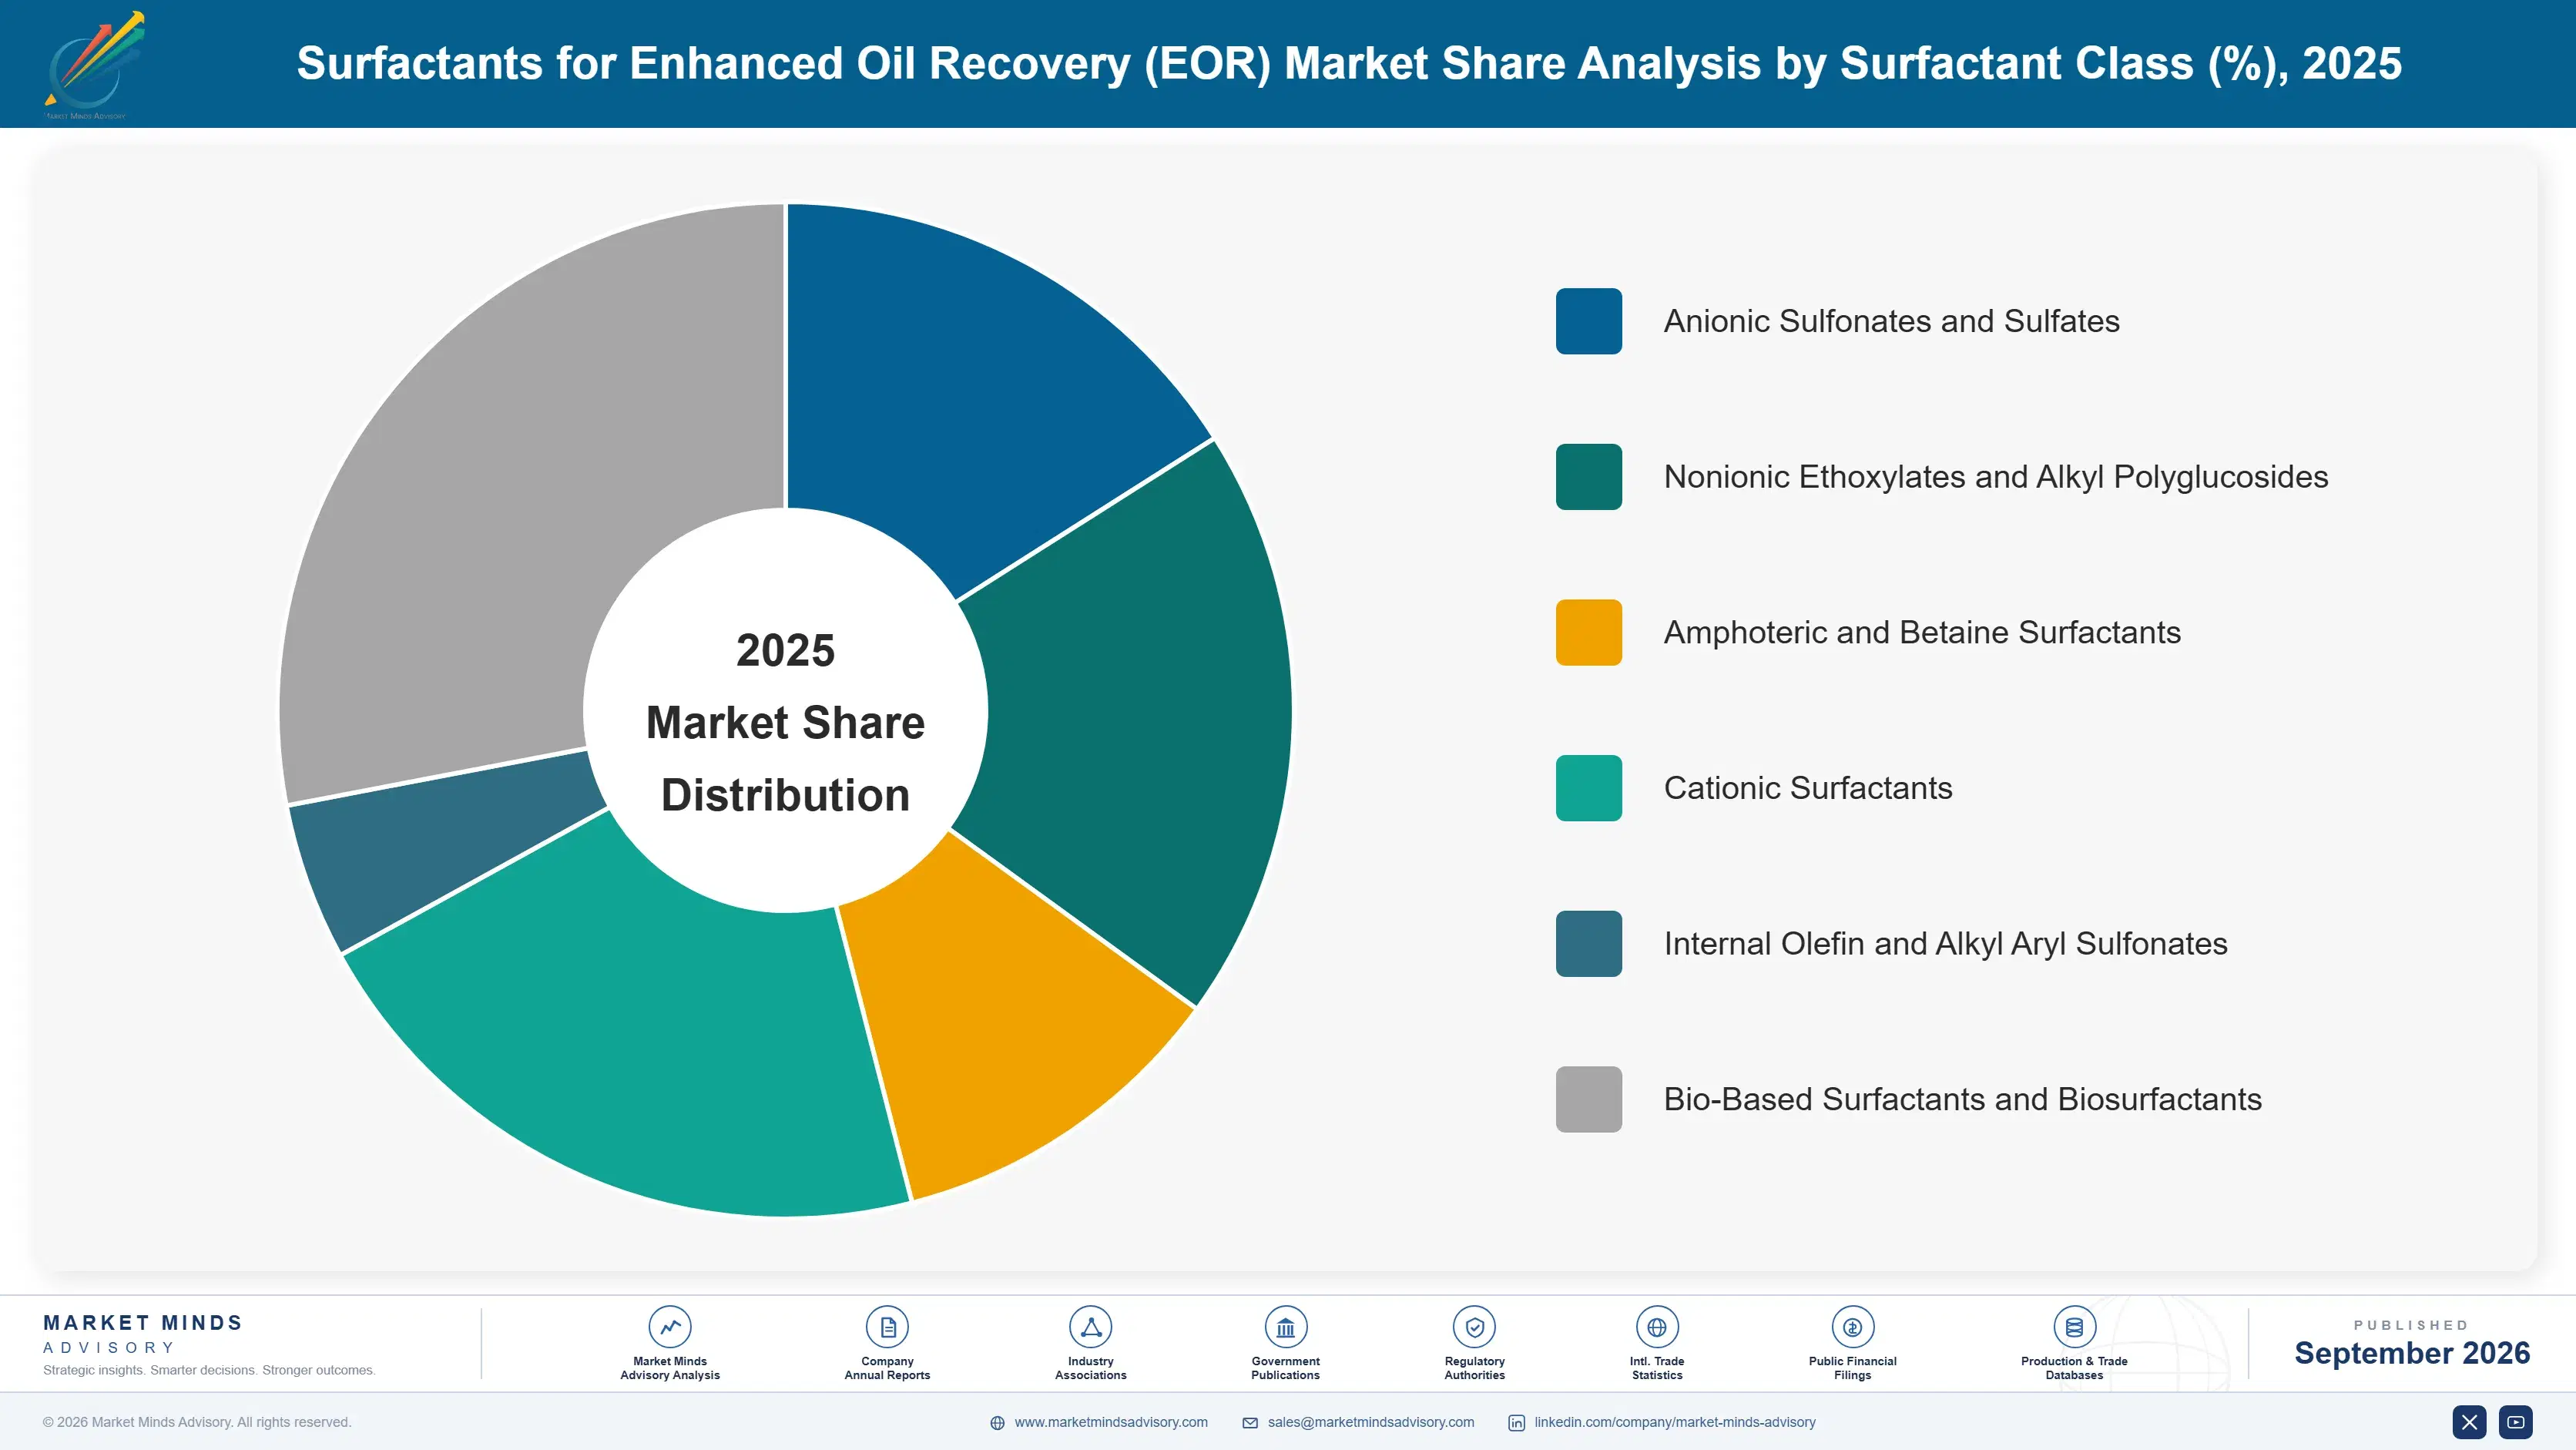
Segmentation follows surfactant class, the dimension on which feedstock, salinity tolerance and permitting exposure all move together. Sulfonates and ethoxylates carry the volume across both flooding and completions at commodity economics. Amphoterics and bio-based chemistries carry the growth, because both survive conditions and disposal rules that the older classes increasingly do not. Regulation is doing the sorting.
surfactants-for-enhanced-oil-recovery-eor-market-market-share-analysis-1788234735394

Bio-Based Surfactants and Biosurfactants

Bio-based surfactants and biosurfactants grow at 13.5%, half again the market rate of 9.0%, and produced water regulation rather than environmental sentiment created the demand. Rhamnolipids, sophorolipids and sugar-derived nonionics degrade readily enough that they complicate downstream water treatment far less than persistent chemistries, which matters enormously now that disposal and reuse requirements are tightening across the major producing regions. Performance in high salinity and high temperature is genuinely good and production cost remains well above petrochemical equivalents, which limits use to applications where the permitting advantage pays for it. Fermentation capacity is the binding constraint rather than any chemistry, and scaling it is a manufacturing investment nobody has yet made at oilfield volumes.
CAGR 13.5%

Amphoteric and Betaine Surfactants

Amphoteric and betaine surfactants at 10.8% carry both charges on the same molecule, which makes them indifferent to brine composition and to the divalent calcium and magnesium that precipitate conventional sulfonates outright. That matters because formation water in mature fields is far harder than the water available for injection, and treating the brine frequently costs more than upgrading the chemistry would. These molecules also tolerate the temperatures that mature deep reservoirs reach, where sulfonate performance degrades. Chinese producers hold much of the manufacturing base after decades of domestic flooding programmes, and completions applications have adopted the same chemistries for their tolerance of recycled produced water. Two applications converged on one chemistry class, which almost nobody predicted.
CAGR 10.8%
Full segment breakdown across 6 segments available in the complete report.

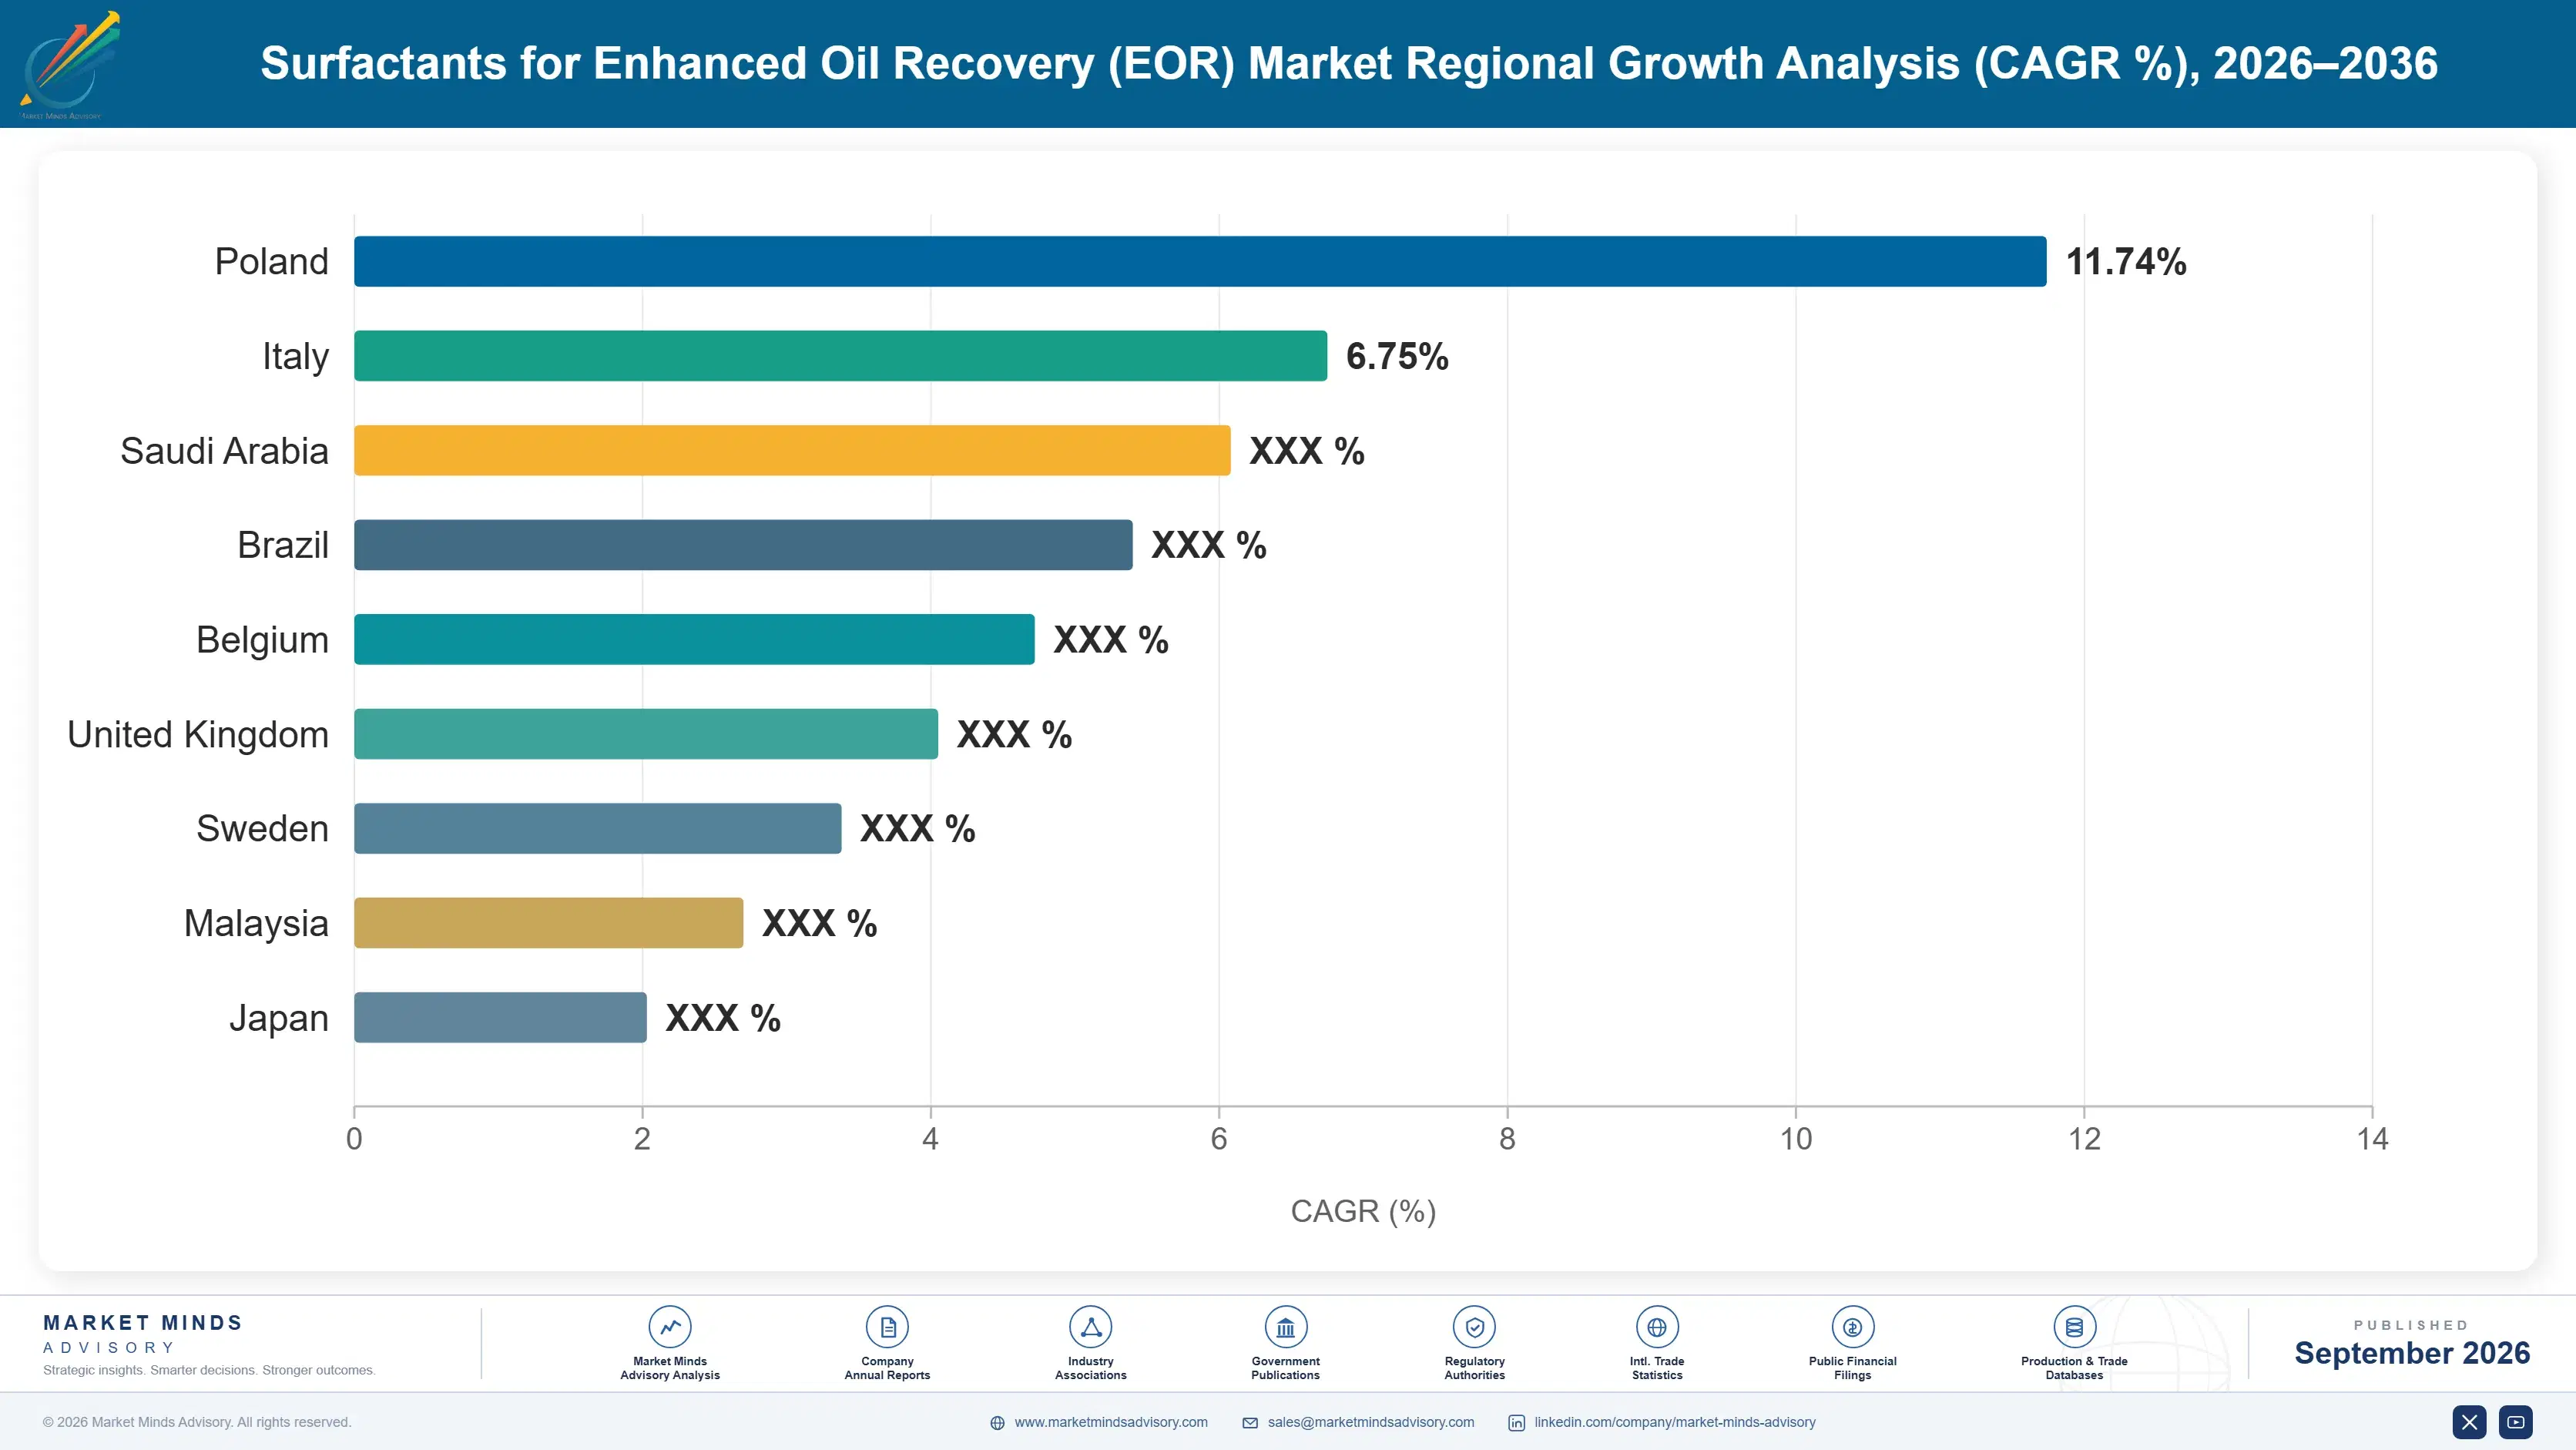
Regional Architecture and Country Demand Map

North America takes 38%, far outside any normal band, because unconventional completions rather than chemical flooding now consume most of this category. Middle East and Africa reaches 14% on mandated recovery programmes. Almost every position here follows either completions volume or a national recovery mandate rather than reserves.

North America

A 38% share far outside any normal band has almost nothing to do with enhanced recovery and everything to do with completions. Unconventional wells across the Permian, Bakken, Eagle Ford and Appalachian basins consume surfactant in fracturing fluid and flowback at volumes no chemical flooding programme anywhere approaches, and consumption scales directly with lateral length and proppant loading rather than with oil price. Service companies rather than operators specify and purchase the chemistry, which makes qualification with three or four organisations worth more than any operator relationship. Produced water reuse requirements are tightening fastest here, which is pulling chemistry selection toward degradable molecules. Nothing about this position resembles enhanced recovery as the term is normally used.
Share: 38% | CAGR: 8.6% (2026 to 2036)

East Asia

Chinese chemical flooding at Daqing and Shengli remains the largest sustained programme of its kind anywhere, running continuously for four decades through price cycles that ended every comparable Western effort. State ownership removes the quarterly arithmetic that stops these programmes elsewhere, and recovery factor targets are set as national policy. That continuity built a domestic surfactant manufacturing base, particularly in betaine and amphoteric chemistries, that now exports into Middle Eastern and South Asian evaluation programmes. Japanese and Korean demand is negligible. The 20% share reflects genuine flooding volume rather than completions, which makes this region's composition the opposite of North America's. The export capability built on that base now competes everywhere else.
Share: 20% | CAGR: 9.8% (2026 to 2036)
Regional intelligence for 5 additional markets available in the complete report: Western Europe, South Asia and Pacific, Latin America, Middle East and Africa, Eastern Europe. Contact sales@marketmindsadvisory.com.
surfactants-for-enhanced-oil-recovery-eor-market-country-cagr-analysis-1788234735925

Four Moves On Where Volume Sits

None of these four requires better chemistry, because the molecules already outperform what the commercial arithmetic will pay for. Each works on where the volume actually is, who signs for it, and which regulation is quietly rewriting the specification without anybody announcing it. Two of the four are commercial organisation problems rather than anything a laboratory can solve at all.

Qualify with the service companies, not the operators

An operator almost never buys a surfactant. A service company specifies a blend, buys the components and delivers a fluid system, so 64% of category volume passes through three or four organisations that most producers treat as channels rather than as customers. Qualification with those organisations is what puts a molecule on a blend sheet, and it takes testing time rather than relationship spending. Producers running sales teams calling on operating companies are calling on people with no ability to place an order, which several have been doing for years.
Market Impact: Reaches the 64% that now holds category volume

Sell degradability to the water treatment budget

Produced water disposal and reuse rules are tightening across North American and Middle Eastern producing regions, and a persistent chemistry that complicates downstream treatment costs the operator more than it saves at the wellhead. Bio-based molecules grow at 13.5% against a market rate of 9.0% for exactly that reason. A producer presenting degradability as an avoided water treatment cost rather than as an environmental attribute reaches the operations budget rather than the sustainability function. Almost every supplier still markets it the other way round. The budget holder is different, and so is the argument.
Market Impact: Targets a segment now growing at 13.5% annually

Design out the alkali rather than defending it

Alkali-surfactant-polymer flooding delivers better recovery than surfactant and polymer alone, and the scaling, emulsion and corrosion it causes in surface facilities frequently costs more than the additional oil is worth. Operators who tried it once often will not try it again. A supplier arriving with an alkali-free surfactant-polymer design reaching comparable recovery, within about 2 points of the alkali case, removes the objection rather than arguing with it. Very few producers lead with that, because the alkali chemistry improves their own dosage economics. Expensive experience is hard to argue against.
Market Impact: Avoids facility damage costing all 12 recovery points

Blend regionally where duty and currency bite

Argentina, Brazil and India all combine growing demand with import duty and currency exposure that make delivered chemistry considerably more expensive than the same product costs at the plant. Indian growth runs at 11.2%, the fastest of any country covered. Regional blending or toll arrangements convert an import problem into a local supply position at modest capital cost, and local content preference in national company procurement often makes it a qualification requirement rather than an advantage. Several producers have discovered this after losing a tender they expected to win. Losing a tender teaches this quickly.
Market Impact: Serves markets now growing at 11.2% every year

Who Controls the Margin Pool

CR5 stands at 41% of volume supplied into oilfield application, which is the only comparable basis since surfactant producers report across many industries and oilfield is rarely the largest. Concentration is moderate because the chemistry is manufactured by large diversified producers rather than by oilfield specialists. The gap between leaders and the field is a gap in service company qualification rather than in manufacturing capability.
Competition runs on qualification position, feedstock integration and regional supply. Qualification decides who appears on a service company blend sheet, which is where 64% of volume is specified. Feedstock integration decides cost, since ethylene oxide and alcohol economics dominate production. Regional supply decides who wins where duty and currency bite. Molecular novelty differentiates far less than the technical literature implies.

Rankings will move on completions rather than on flooding, and most participants are organised for the opposite. A producer qualified across the major service companies captures volume that scales with lateral length regardless of oil price. The pressure comes from a route to market rather than from any technology, and rebuilding a commercial organisation takes longer than developing a molecule does.
surfactants-for-enhanced-oil-recovery-eor-market-company-positioning-matrix-1788234736443

Competitive Moat and Risk Dimensions

BASF

Moat: Feedstock integration and qualification breadth

Backward integration into ethylene oxide and alcohol feedstocks gives the group a cost position that non-integrated producers cannot match on the commodity classes carrying most volume. Long qualification history across service company blend sheets and national company programmes compounds it. Both positions took decades to build and neither can be assembled quickly by anybody arriving now.
BASF

Risk: Oilfield is a minor segment

Oilfield surfactants sit inside a business serving detergents, agriculture and personal care, where they compete for capacity and capital against segments with steadier demand and better margins. Internal allocation rather than external competition decides how much attention this market receives. A cyclical downturn tends to see oilfield capacity redirected rather than defended, which customers notice.
STEPAN COMPANY

Moat: Surfactant depth and formulation flexibility

Deep manufacturing capability across a wide surfactant range lets the company produce and vary chemistry at commercial scale rather than only in a laboratory, which matters because oilfield performance is reservoir and fluid specific. Producing a tailored variant at pilot volumes defeats most competitors. That flexibility wins qualification work that a narrow producer never reaches at all.
STEPAN COMPANY

Risk: Limited feedstock backward integration

Buying ethylene oxide and alcohols rather than producing them leaves the company exposed on the commodity classes where price decides the sale and where integrated competitors hold a permanent cost advantage. Formulation capability defends the specialty end and not the volume end. With 64% of demand being completions chemistry bought on price, that exposure sits where the volume is.

Players Tracked

Prominent Players

BASF
Stepan Company
Sasol
Nouryon
Syensqo

Other Key Players

Halliburton
SLB
ChampionX
Clariant
Dow
Huntsman
Kao Corporation
Croda International
Innospec
Evonik Industries
Oil Chem Technologies
SNF Group
Lubrizol
Locus Bio-Energy
Shell Chemicals

Recent Developments

JANUARY 2025

Produced water reuse rules tightened across producing states

Several North American producing states tightened produced water reuse and disposal requirements, making downstream treatability a practical constraint on which chemistries operators would accept in completions fluid. Service companies then began requesting degradation data alongside performance data during blend qualification for the very first time.
Signal: A water disposal rule is now rewriting the chemistry specification that nobody in laboratories was expecting.
MAY 2025

Service company consolidated surfactant supplier qualification list

A major service company consolidated its approved surfactant supplier list for completions fluid systems, reducing the number of qualified producers and lengthening the qualification process for anybody outside it. Producers not on the resulting list lost access to volume without any operator ever being involved in the decision.
Signal: Losing a blend sheet position removes volume from a producer that never met the customer anyway.
SEPTEMBER 2025

Indian operator expanded mature field chemical programme

An Indian national operator expanded chemical flooding across additional mature onshore fields under recovery factor targets set as national policy rather than by barrel economics. The programme carries a domestic manufacturing preference, which strongly favours producers holding local blending capability over those supplying from distant export plants.
Signal: Policy funds these programmes and local content decides who gets to supply them, in exactly that order.

Ethylene Oxide, Alcohols And Freight

Ethylene oxide accounts for roughly 37% of production cost across the ethoxylated classes, fatty and synthetic alcohols around 26%, and sulfonating agents a further 12%. Ethylene oxide cannot be shipped safely over distance, which means ethoxylation happens near the producer and the cost position depends on whether that producer owns the upstream unit. Freight and drum packaging make up most of what remains delivered.
European energy pricing through 2022 tested this cost base directly. Ethylene oxide production is energy intensive and European producers absorbed severe increases, which the International Energy Agency documented, while alcohol feedstock moved separately on petrochemical and oleochemical drivers. Producers with integrated ethylene oxide units and long-term energy contracts held pricing. Those buying ethoxylate on the merchant market passed increases to customers who had alternatives available.

The disadvantage falls on integration rather than on procurement skill. Ethylene oxide is 37% of cost and cannot be transported far, so a producer without an upstream unit buys from a competitor at a price that competitor sets. No purchasing arrangement resolves a position that plant geography created decades ago. That fact explains most of the cost differences visible across this category.
surfactants-for-enhanced-oil-recovery-eor-market-cost-volatility-analysis-1788234736639

Secure ethoxylation capacity through long-term tolling

Ethylene oxide is 37% of cost and cannot be shipped over distance, so a non-integrated producer depends entirely on merchant ethoxylate priced by a competitor. Long-term tolling agreements at fixed conversion terms give price visibility that spot purchasing never provides. It costs volume commitment rather than capital, and producers holding them weathered the last energy cycle without repricing.

Qualify dual alcohol feedstock routes

Fatty and synthetic alcohols are 26% of cost and move on entirely different drivers, one on harvest and export policy and the other on petrochemical economics. Qualifying both into one specification costs testing rather than capital and converts a feedstock exposure into a purchasing choice. Producers committed to a single oleochemical route learned that lesson expensively in the last cycle.

Blend regionally to remove freight and duty

Delivered cost into Argentina, Brazil and India carries freight, duty and currency exposure that frequently exceeds the manufacturing margin on the product itself. Regional blending or toll arrangements convert an import into a local supply position at modest capital cost, and local content preference often makes it a qualification requirement rather than merely an advantage worth having.

Portfolio Architecture for Margin Defence

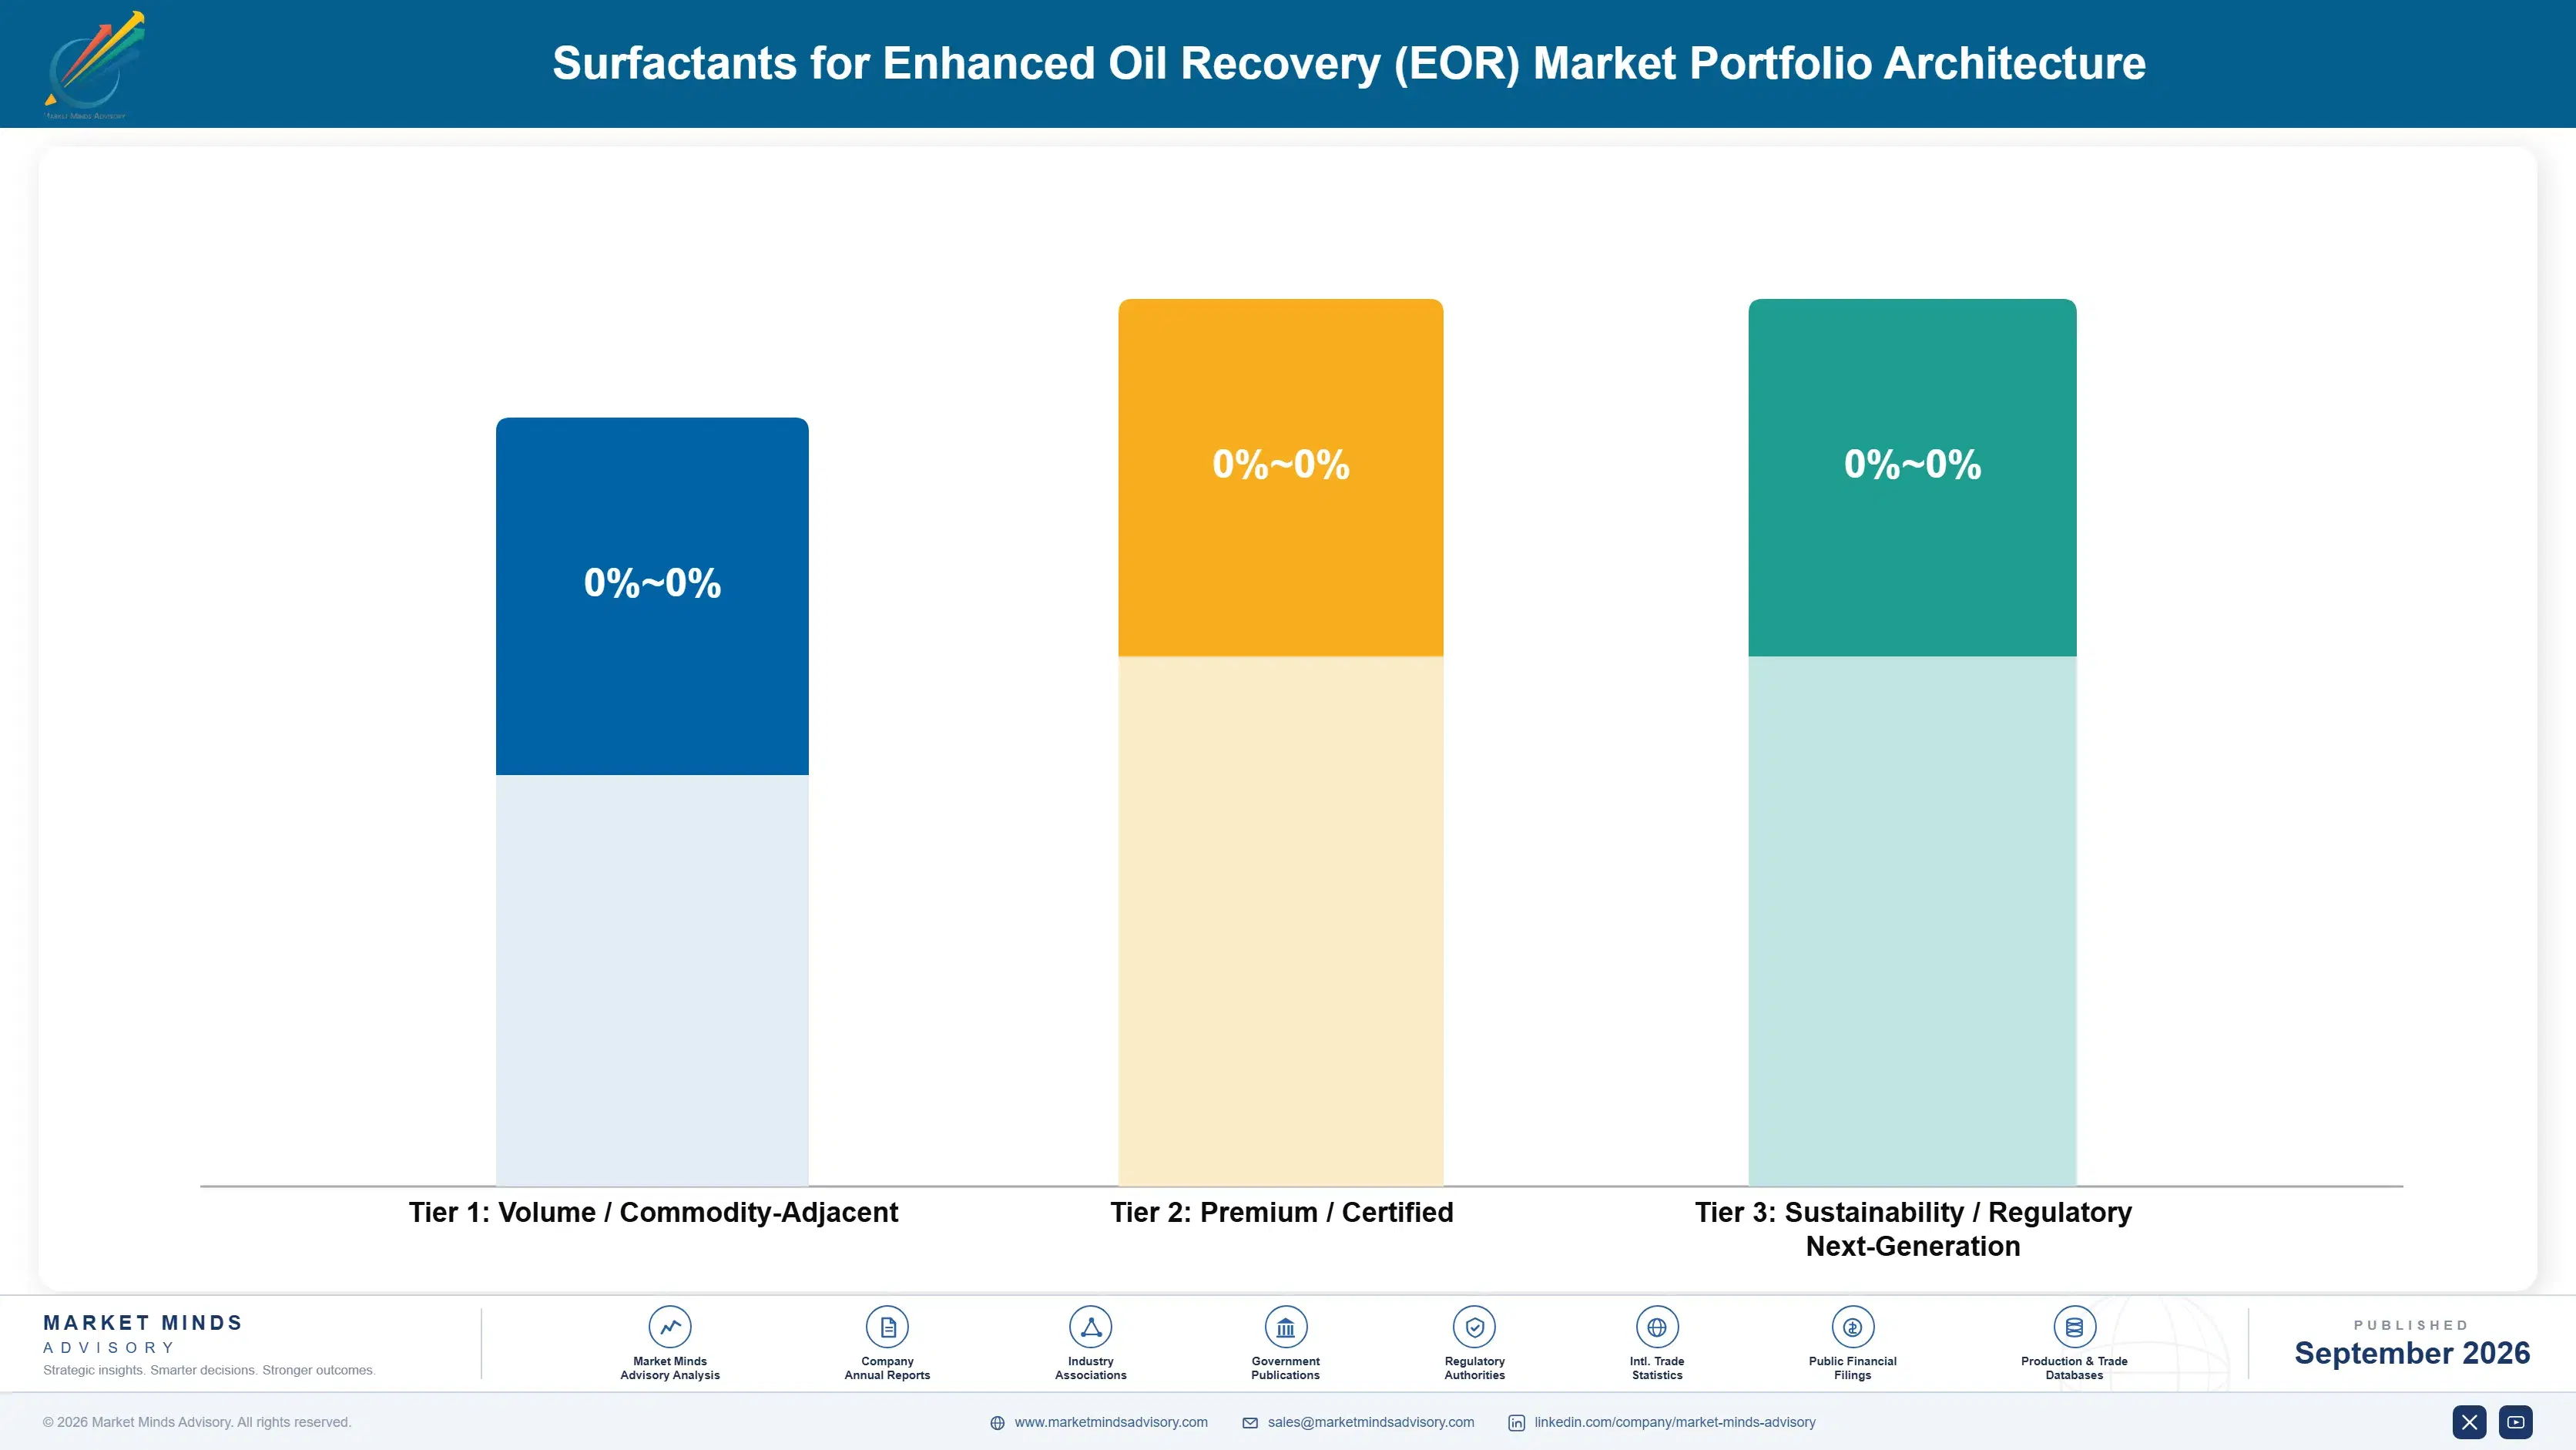
Margin here follows qualification and integration rather than chemistry, which is not how the technical literature frames it. A commodity ethoxylate sold into completions blends earns whatever an integrated producer's cost position allows, while a qualified specialty on a national company flooding programme earns a multiple of it. Participants costing by route to market rather than by molecule run a completely different business from the rest.
Volume and premium pull against each other through the service company relationship rather than the plant. Commodity completions chemistry carries the tonnage that keeps a producer on the blend sheet and inside the qualification conversation, and that position is what gets a specialty considered when a difficult application arises. Losing the commodity volume removes the access, and the access is worth more than the margin given up to hold it.

High-value pools sit in bio-based chemistries, in carbonate-compatible cationics and in reservoir screening data almost nobody treats as a product. The third is the least priced: a producer holding core flood and phase behaviour results across many reservoir and brine conditions can answer a new application in weeks rather than starting a two year programme, and that speed decides who gets specified first.

Volume / Commodity-Adjacent

Anionic sulfonates and standard ethoxylates supplied into completions fluid systems against competing product on price and delivery. Differentiation is minimal and volume decides everything. The 9 point spread reflects whether the producer is integrated back into ethylene oxide production.
Gross Margin: 16 to 25%

Premium / Certified

Amphoteric, betaine and internal olefin chemistries qualified against specific reservoir temperature, salinity and mineralogy conditions. Qualification position rather than chemistry supports the price. The 9 point spread reflects how many reservoir types the product holds field data against.
Gross Margin: 32 to 41%

Sustainability / Regulatory / Next-Generation

Bio-based surfactants, carbonate-compatible cationics and reservoir screening services sold alongside supply. Margins are high because permitting advantage and qualified alternatives are both scarce. The 18 point spread separates chemical supply from screening and technical service work entirely.
Gross Margin: 40 to 58%
surfactants-for-enhanced-oil-recovery-eor-market-portfolio-architecture-1788234737133

High-value Sub-segments and Strategic Watch-out

Bio-Based Surfactants and Biosurfactants

High value and high growth at 13.5%. Produced water rules rather than sentiment created the demand, and fermentation capacity rather than chemistry is what constrains supply today. The 8 point spread reflects whether the fermentation capacity is owned outright or contracted in from a third party.
Gross Margin: 44 to 52%

Amphoteric and Betaine Surfactants

High value with strong growth at 10.8%. Dual charge makes these indifferent to hard brine and to the recycled produced water that completions work increasingly relies on. The 8 point spread reflects whether the producer manufactures the betaine intermediate itself or simply buys it in.
Gross Margin: 36 to 44%

Anionic Sulfonates and Sulfates

The volume core. It earns modestly and it holds the blend sheet position that gets every specialty chemistry considered whenever a difficult application finally arrives. The 8 point spread reflects feedstock integration, which decides these economics far more than any formulation difference does. Nothing else differentiates it.
Gross Margin: 18 to 26%

Cationic Surfactants

The strategic watch-out. Demand depends almost entirely on carbonate reservoir programmes that a small number of national oil companies fund under policy rather than under economics. The 22 point spread separates the qualified carbonate specialties from general cationic supply now competing on price alone. Policy decides everything.
Gross Margin: 24 to 46%

Blend Sheets And Well Counts

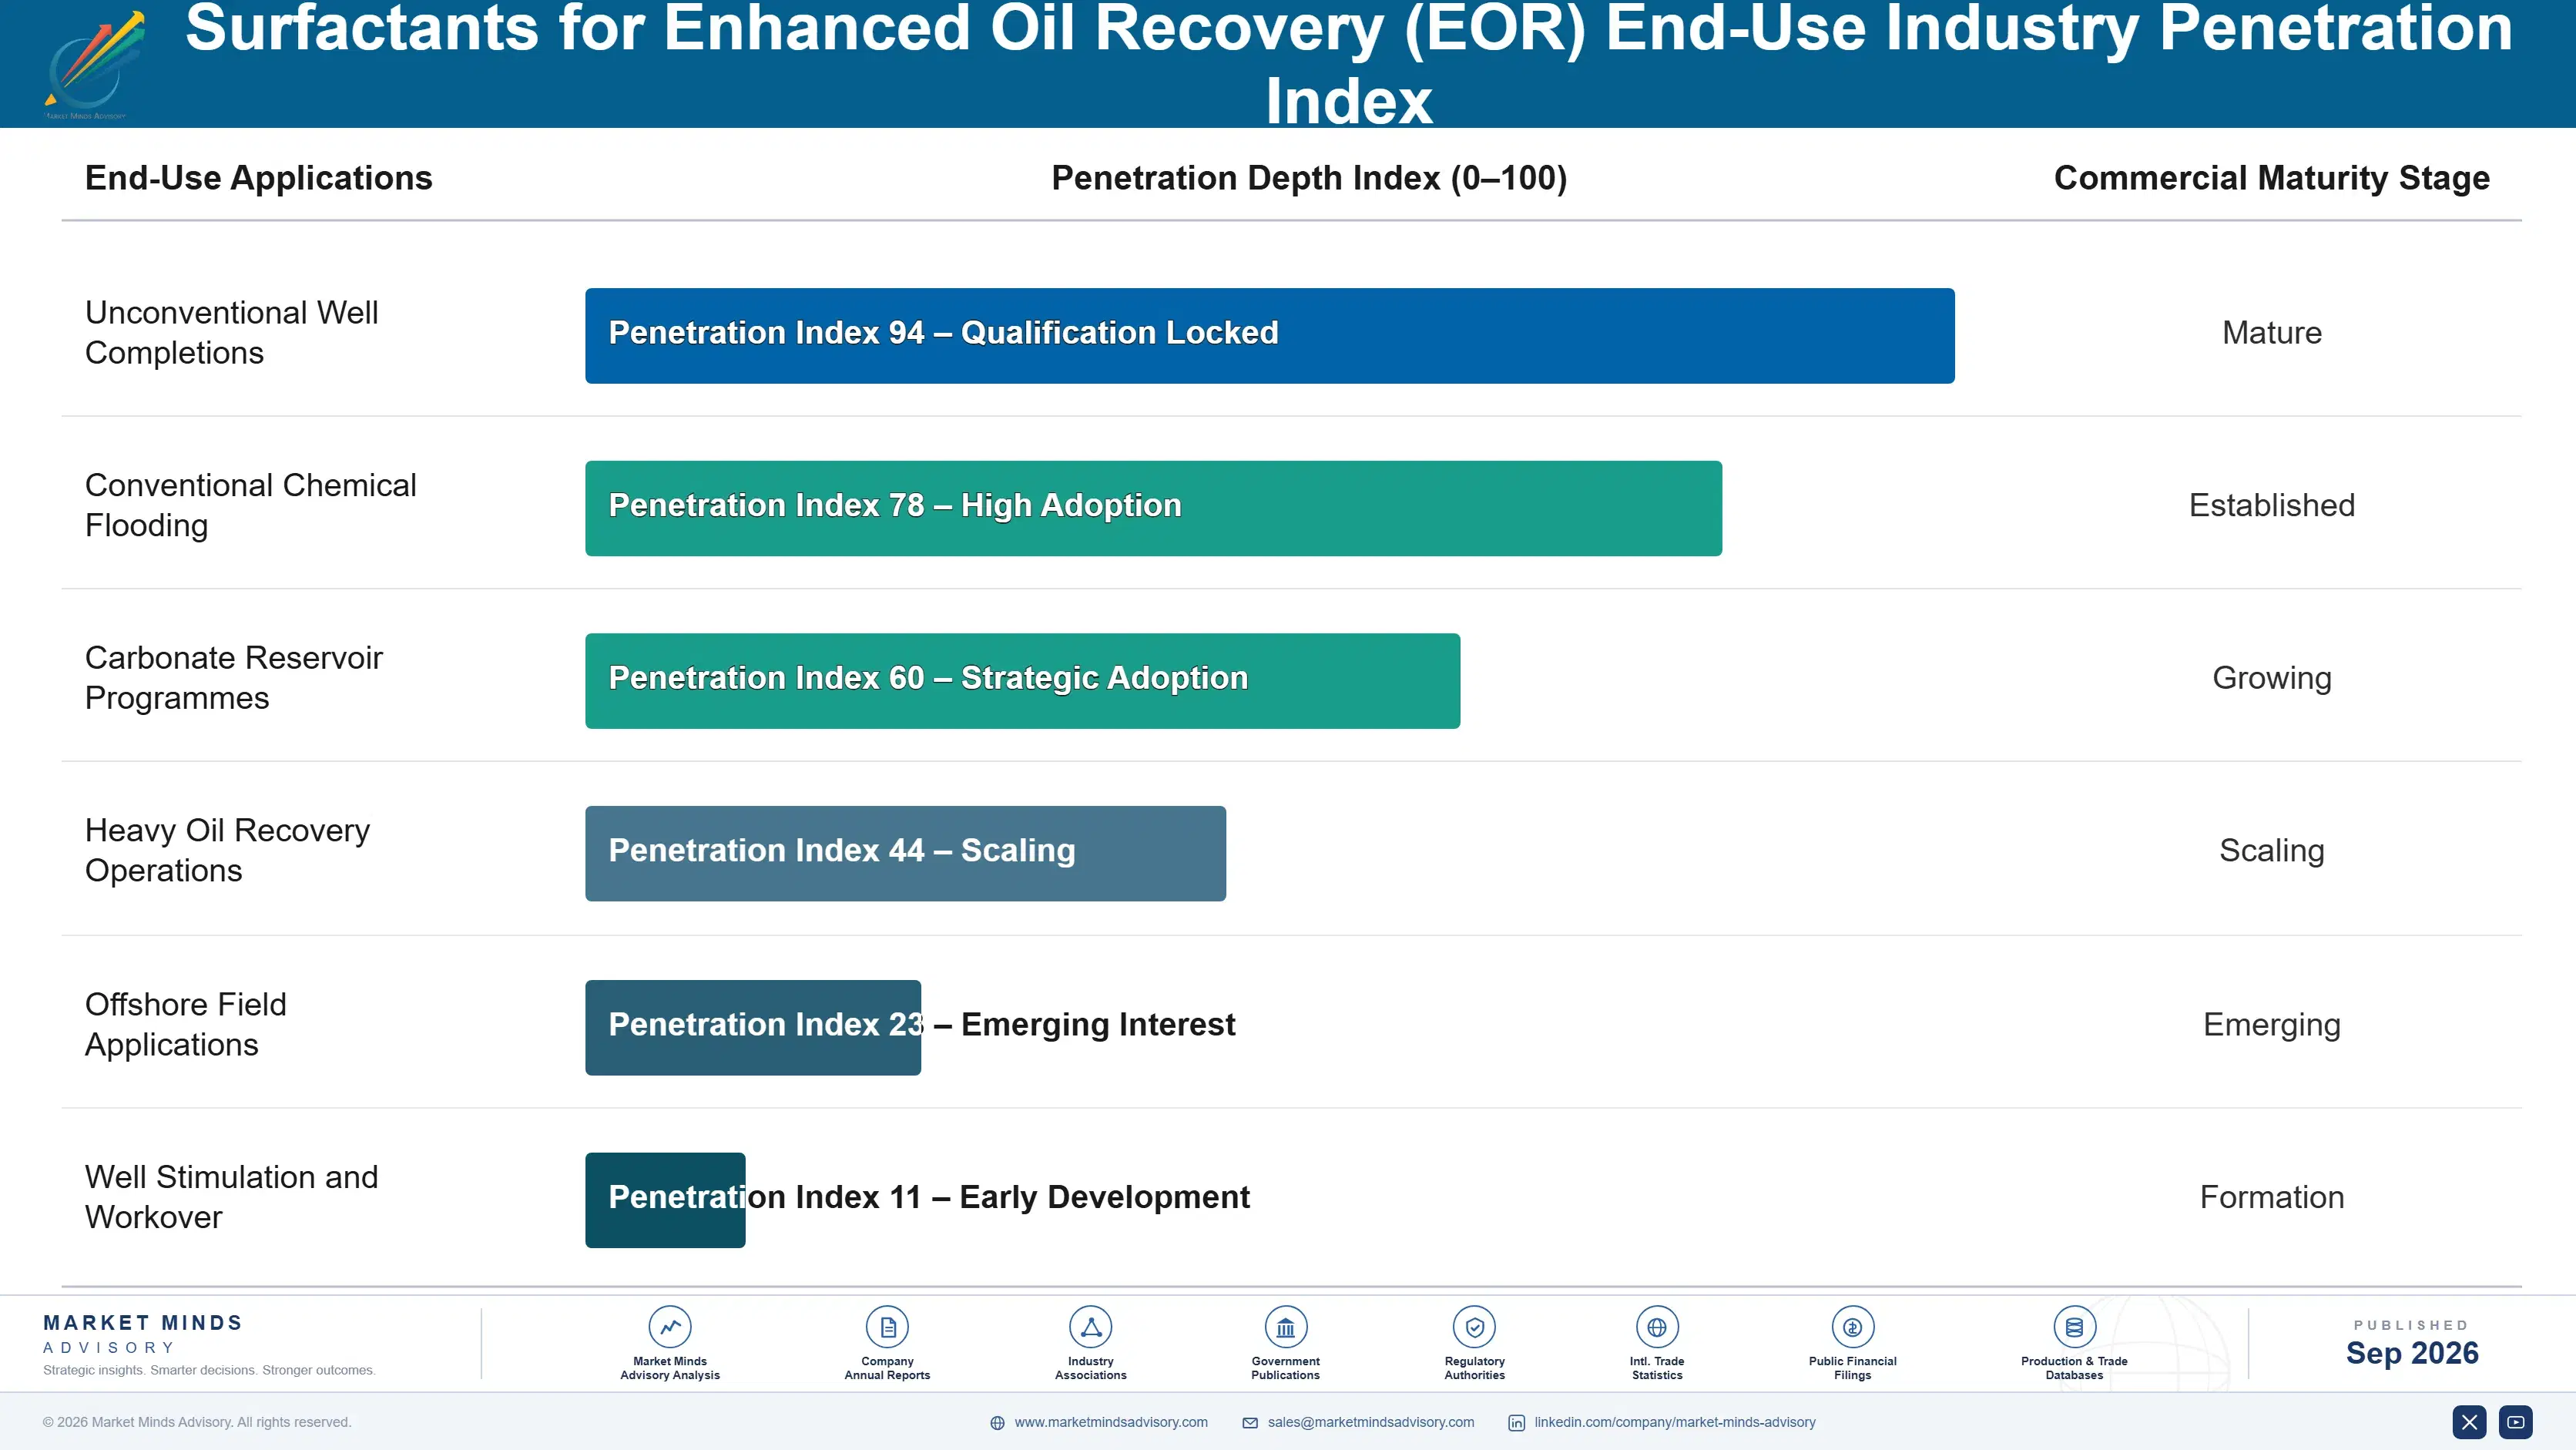
The annuity here runs through a blend sheet rather than through any customer relationship, which is unusual and uncomfortable. A producer qualified on a service company's approved list supplies every well that company completes using that fluid system, without meeting the operator or bidding on any individual job. That volume arrives automatically and it disappears just as automatically if the qualification list is consolidated, which happens without warning.
Stickiness varies enormously by application rather than by customer. A completions chemistry is qualified once and then bought on price against alternatives on the same list, which is far softer than it appears. A flooding chemistry written into an active programme is effectively permanent, because nobody changes surfactant mid-flood when the reservoir response is the only test and it takes years to read.

Buyer profiles have shifted from reservoir engineers toward completions engineers and water management functions, and the sales organisations have not moved with them. A reservoir engineer asked about interfacial tension and adsorption isotherms. A completions engineer asks about compatibility with recycled produced water and delivery to a pad on schedule. The second buyer now specifies most of the volume and is rarely called on by anybody selling chemistry.
surfactants-for-enhanced-oil-recovery-eor-market-end-use-penetration-index-1788234737621

Where This Volume Now Sits

These are among the four positions where our research anticipates prominent divergence between winners and laggards over the coming forecast period. Each is grounded in the demand model, the regulatory perimeter, and the announced capacity pipeline.
01 / SERVICE COMPANY QUALIFICATION

Sell to whoever actually writes the blend sheet

An operator almost never buys a surfactant directly, because a service company specifies the blend, purchases the components and delivers a complete fluid system to the wellsite instead. Some 64% of category volume therefore passes through three or four organisations that most producers still treat as distribution channels rather than as the customers they genuinely are. Qualification with those organisations costs testing time rather than relationship spending, and producers calling on operating companies are calling on people who cannot place an order.
02 / WATER BUDGET POSITIONING

Price degradability as an avoided treatment cost

Produced water disposal and reuse requirements are tightening across North American and Middle Eastern producing regions, and a persistent chemistry that complicates downstream treatment costs the operator considerably more than it ever saves at the wellhead. Bio-based molecules grow at 13.5% against a market rate of 9.0% for precisely that reason rather than for any environmental preference. Presenting degradability as an avoided water treatment cost reaches the operations budget, and almost every supplier still markets it to the sustainability function instead.
03 / ALKALI FREE DESIGN

Remove the objection instead of arguing it

Alkali-surfactant-polymer flooding delivers better recovery than surfactant and polymer together, and the scaling, stable emulsions and corrosion it causes throughout surface facilities frequently cost more than the additional oil is actually worth. Operators who tried it once will very often refuse to try it again, and that refusal rests on expensive direct experience rather than on any theoretical concern. Arriving with an alkali-free design reaching comparable recovery removes the objection, which very few producers lead with because alkali improves their own dosage economics.
04 / REGIONAL BLENDING POSITION

Blend where the duty and currency actually bite

Argentina, Brazil and India all combine genuinely growing demand with import duty and currency exposure that makes delivered chemistry considerably more expensive than the same product costs at the manufacturing plant. Indian growth runs at 11.2%, the fastest of any country covered anywhere in this report. Regional blending or toll arrangements convert an import problem into a local supply position at modest capital cost, and local content preference in national company procurement frequently makes it a qualification requirement rather than an advantage.

Engagement Snapshot From the Field

A live engagement with an industry participant carrying material or product regulatory and market exposure ahead of a defining policy shift, showing how our research translates into a defensible multi-year portfolio strategy.
MARKET MINDS ADVISORY · CLIENT ENGAGEMENT SUMMARY
Surfactants for Enhanced Oil Recovery (EOR) Producer Strategic Portfolio Review and Transition Roadmap 2026·Investment Scenario on Surfactants for Enhanced Oil Recovery (EOR) Exposure Evaluation 2025-26
CLIENT PROFILE
A European surfactant producer with an established oilfield business built around chemical flooding chemistries, with annual oilfield revenue in the low tens of millions of euros and a technical reputation considerably stronger than its market position (client-reported, unverified by MMA). Completions volume across its served regions had grown substantially and the client's share of it had not.
STRATEGIC CHALLENGE
Management could see the category growing and could not participate in the growth, having built a laboratory, a sales organisation and a product range entirely around chemical flooding programmes that were not expanding. They needed to know whether the completions volume was reachable at all and what it would actually take to reach any of it.
MMA APPROACH
MMA mapped every completions fluid blend sheet across the client's served regions, identifying which producers held qualification with which service companies and how those positions had been won. Forty-seven expert interviews with service company chemists, completions engineers, water management specialists and competing producers established what qualification required and how long it took.
KEY FINDINGS
  1. Some 64% of regional volume passed through 4 service companies, and the client held qualification with none of them for completions fluid systems.
  2. Qualification required roughly 14 months of testing and cost less than the client spent annually calling on operators who could not purchase anything.
  3. The client's amphoteric chemistries performed well in recycled produced water, which service companies rated highly and had never been shown any data on.
  4. Every service company interviewed was actively seeking additional qualified suppliers, because their own consolidated lists had left them with far too little competition.
CLIENT PROFILE
A European surfactant producer with an established oilfield business built around chemical flooding chemistries, with annual oilfield revenue in the low tens of millions of euros and a technical reputation considerably stronger than its market position (client-reported, unverified by MMA). Completions volume across its served regions had grown substantially and the client's share of it had not.
STRATEGIC CHALLENGE
Management could see the category growing and could not participate in the growth, having built a laboratory, a sales organisation and a product range entirely around chemical flooding programmes that were not expanding. They needed to know whether the completions volume was reachable at all and what it would actually take to reach any of it.
MMA APPROACH
MMA mapped every completions fluid blend sheet across the client's served regions, identifying which producers held qualification with which service companies and how those positions had been won. Forty-seven expert interviews with service company chemists, completions engineers, water management specialists and competing producers established what qualification required and how long it took.
KEY FINDINGS
  1. Some 64% of regional volume passed through 4 service companies, and the client held qualification with none of them for completions fluid systems.
  2. Qualification required roughly 14 months of testing and cost less than the client spent annually calling on operators who could not purchase anything.
  3. The client's amphoteric chemistries performed well in recycled produced water, which service companies rated highly and had never been shown any data on.
  4. Every service company interviewed was actively seeking additional qualified suppliers, because their own consolidated lists had left them with far too little competition.
RECOMMENDED STRATEGY
Phase 1: Phase one: begin qualification with all 4 service companies simultaneously, presenting recycled produced water compatibility data the client already held. Phase 2: Phase two: redirect the operator-facing sales organisation toward completions engineers and water management functions, who between them specify the actual volume. Phase 3: Phase three: retain the flooding business and stop funding its expansion, since national programmes rather than commercial ones now drive it.
OUTCOME
Within six quarters the client held qualification with three of the four service companies and completions volume had overtaken flooding revenue (client-reported, unverified by MMA). No new molecule was developed at any stage. The laboratory budget was left unchanged and the sales organisation was rebuilt entirely.

Frequently Asked Questions

Foundational context covering the market sizes, CAGR, scope, country, region and competition that inform every finding below. This section is provided to cover basics and most often pre-purchase conversations, answered from the MMA Primary Research Dataset.

What is the current size of the Surfactants for Enhanced Oil Recovery (EOR) Market?

The global surfactants for enhanced oil recovery market was valued at USD 2.1 billion in 2025, covering chemistries supplied into flooding and completions applications. The 2026 figure reaches USD 2.29 billion.

How large will the Surfactants for Enhanced Oil Recovery (EOR) Market be by 2036?

MMA forecasts USD 5.42 billion by 2036, an increase of USD 3.13 billion over the 2026 base. That represents an expansion multiple of 2.37 times across the forecast period.

What is the CAGR for the Surfactants for Enhanced Oil Recovery (EOR) Market 2026 to 2036?

The base case compound annual growth rate is 9.0%, with a bull case at 10.2% and a bear case at 7.8%. Historical growth between 2020 and 2025 ran at 7.8%.

Which segment is growing fastest?

Bio-based surfactants and biosurfactants grow at 13.5%, half again the market rate of 9.0%, because produced water rules favour degradable chemistries. Amphoterics follow at 10.8%.

Who are the major companies in the Surfactants for Enhanced Oil Recovery (EOR) Market?

BASF, Stepan Company, Sasol, Nouryon and Syensqo lead on oilfield supply volume, with combined CR5 of 41%. Concentration is moderate because large diversified producers rather than oilfield specialists make the chemistry.

Which country is growing fastest?

India grows fastest at 11.2%, where national recovery factor targets fund mature field programmes through price cycles that stop commercial operators. South Asia and Pacific leads regionally at 11.2%.

Report Segmentation Architecture

The full report scope spans multiple orthogonal segmentation dimensions, with cross-tabulated demand data provided for each dimension pair. Coverage extends further to regional breakdowns, trend trajectories, and the competitive detail needed to support segment-level decision-making.

By Surfactant Class

  • Anionic Sulfonates and Sulfates
  • Nonionic Ethoxylates and Alkyl Polyglucosides
  • Amphoteric and Betaine Surfactants
  • Cationic Surfactants
  • Internal Olefin and Alkyl Aryl Sulfonates
  • Bio-Based Surfactants and Biosurfactants

By End-Use Industry

  • Unconventional Well Completions
  • Conventional Chemical Flooding
  • Carbonate Reservoir Programmes
  • Heavy Oil Recovery Operations
  • Offshore Field Applications
  • Well Stimulation and Workover

By Commercial Dimension

  • Service Company Blend Supply
  • Direct Operator Supply
  • National Company Framework Agreements
  • Regional Distribution and Blending
  • Toll Manufacturing Arrangements
  • Technical Screening Services

By Region

  • North America
  • Western Europe
  • East Asia
  • South Asia and Pacific
  • Latin America
  • Middle East and Africa
  • Eastern Europe

Scope, Methodology, and Coverage

Every figure in this report is reproducible from documented input assumptions. The scope below maps the historical period, the forecast horizon, the segmentation dimensions, and the countries covered, alongside the underlying primary and qualitative methodology.
Historical Period
2020 to 2025
Forecast Period
2026 to 2036
Base Year
2025 (USD billions; MMA Primary Research Dataset, September 2026)
Market Definition
The surfactants for enhanced oil recovery market covers interfacial active chemistries supplied into oilfield applications that mobilise trapped hydrocarbon, spanning anionic sulfonates and sulfates, nonionic ethoxylates and alkyl polyglucosides, amphoteric and betaine surfactants, cationic surfactants, internal olefin and alkyl aryl sulfonates, and bio-based surfactants and biosurfactants. Scope covers volume supplied into chemical flooding programmes and into well completion, fracturing and flowback applications. Excluded are polymers supplied for viscosity control, alkali chemicals, demulsifiers and production chemicals, drilling fluid additives, and surfactants supplied to non-oilfield industries.
Quantitative Units
USD billion, 2025 base year, 2026 to 2036 forecast period
Segmentation Dimensions
Surfactant class, oilfield application, commercial channel, region
Regions Covered
North America, Western Europe, East Asia, South Asia and Pacific, Latin America, Middle East and Africa, Eastern Europe
Countries Covered
United States, Canada, United Kingdom, Norway, Germany, Netherlands, Romania, Kazakhstan, China, Japan, Malaysia, India, Australia, Brazil, Argentina, Saudi Arabia, United Arab Emirates, Oman
Key Companies Profiled
20 companies across chemical producers, oilfield service groups and regional blenders
Quantitative Methodology
Primary survey, n=3,800 respondents, Q4 2025, six countries; demand-side model with trade association cross-validation
Qualitative Methodology
47 expert interviews, Q4 2025; applied to validate demand model assumptions, identify emerging dynamics, and assess competitive positioning
Report Format
PDF and XLSX data workbook (Word format preview document)
Publisher
Market Minds Advisory
Report Code
MMA-2026-CHM-291
Published
September 2026
Contact
sales@marketmindsadvisory.com | www.marketmindsadvisory.com

Purchase the full Surfactants for Enhanced Oil Recovery (EOR) Market Report (2026 to 2036).

The full MMA report on the surfactants for enhanced oil recovery market runs to detailed chemistry and regional models across the 2026 to 2036 forecast period, with production cost benchmarks separated by feedstock route and integration position. It profiles 20 companies on a consistent oilfield supply volume basis, covering chemical producers, oilfield service groups and regional blenders. Completions and flooding demand are modelled separately, since the two applications behave nothing alike. Regional chapters cover the seven MMA regions with country-level detail on the eighteen markets surveyed. Primary research draws on a quantitative survey of 3,800 respondents across six countries and 47 expert interviews conducted in Q4 2025.
Production cost benchmarks by feedstock route and integration
Completions and flooding demand modelled entirely separately by region
Service company qualification positions mapped across major blend systems
Twenty company profiles on consistent oilfield supply volume basis
Produced water regulation tracked against chemistry selection criteria
Seven regional chapters with eighteen country detail tables

Built For The People Who Decide

From boardroom strategy to bench-side execution, this report is read cover-to-cover by leaders shaping the next decade of their industry, turning demand scenarios, market dynamics and valuation benchmarks into decisions.
CXOs/ Presidents/ VPs/ Managers
M&A and Corporate Development
Strategy Teams and R&D Heads
Procurement and Product Directors
Regulatory and Compliance Leaders
Investor Relations and Equity Analysts