Market Minds Advisory
Sugar Substitutes Market

Sugar Substitutes Market: The Industry Sells Sweetness and Customers Need Mass

Pricing conventions in this industry run on cost per unit of sweetness, which quietly hides the fact that most reformulation projects fail on missing bulk rather than on missing sweetness.

Lead Analyst

Lisa Gevelber

Published

September 2026

Make Smarter Decisions with Customized Research Insights

Request a free sample report and evaluate market opportunities, growth trends, and competitive dynamics relevant to your business needs.

2025 MARKET VALUE$22.4BMarket Size 2025
2036 FORECAST VALUE$46.2BBase Case , 2026 to 2036
CAGR 2026 TO 20366.8 %Bull 8.0% / Bear 5.6%
INCREMENTAL OPPORTUNITY$22.3BNet 10- year value creation
EXPANSION MULTIPLE1.93x2036 value over 2026 base
Strategic Levers
M&A Pipeline
Regional Outlook
Country Rankings
Competitive Intelligence
Segmental Deep-dive
Call-Us : 91 93563 13602

Executive Snapshot and Market Trajectory

This industry prices itself on sucrose equivalence, meaning cost per unit of sweetness delivered. That convention is convenient and misleading, because a compound sweet at 600 times sucrose supplies none of the mass that sugar contributed, and mass is what most reformulations actually run short of.
The consequence shows up in project failure rates rather than in sales figures. A beverage or bakery reformulation runs around 30 months from brief to relaunch, and the ones that collapse usually do so on texture, body or yield rather than on sweetness or aftertaste. Suppliers selling sweetness alone are answering a question the formulator solved first. The mass problem is where the money and the difficulty both sit.
Demand itself is policy driven, which very few participants say plainly. Around 110 jurisdictions now levy some form of tax on sweetened beverages, and that single fact drives more reformulation than consumer preference ever has. Mexico grows fastest anywhere at 11.8% on exactly that mechanism, with front-of-pack warnings reinforcing what the tax started. Reformulation follows tax bands rather than research findings, which makes legislative tracking a considerably better forecasting input than any consumer panel.
Market Definition
Sweetening compounds supplied as food and beverage ingredients, covering steviol glycosides, allulose and rare sugars, sucralose, polyols, aspartame and other synthetic high-intensity sweeteners, and monk fruit and other plant extracts. Measured at producer selling value. Excludes sucrose and other caloric sugars, high fructose corn syrup, honey and syrups sold as foods, finished sugar-free consumer products, and flavour modifiers without sweetening function.
Base Year Value
$22.4B in 2025 (MMA Primary Research Dataset, August 2026)
Forecast Period
2026 to 2036, eleven discrete annual values
CAGR
6.8% base case. Bull 8.0%. Bear 5.6%.
Fastest Growth Segment
Steviol Glycosides: 10.2% CAGR
Fastest Growth Country
Mexico: 11.8% CAGR
Fastest Growth Region
South Asia and Pacific: 8.8% CAGR
Largest Region
East Asia: 30% of 2025 global value
Market Leaders
Tate and Lyle, Cargill, Ingredion, PureCircle, Ajinomoto. Source: MMA Primary Research Dataset, July 2026.
Primary Survey
n=3,800 procurement and R&D decision-makers, Q4 2025, six countries
Methodology
Demand-side build-up, cross-validated against public data, 47 expert interviews

Sugar Substitutes Market Forecast Scenarios

sugar-substitutes-market-trends-size-forecast-scenario-1787639538941
Growth ran near 5.8% between 2020 and 2025 and the composition moved considerably more than the total. Sugar-sweetened beverage taxes spread across new jurisdictions and drove reformulation faster than consumer demand did, steviol glycoside demand shifted from leaf extraction toward bioconversion, and aspartame carried a reputational overhang after its hazard classification regardless of the intake conclusion that accompanied it.
Base case 6.8% rests on three mechanisms. Steviol glycosides grow at 10.2% as bioconverted Rebaudioside M and D replace the bitter first-generation fractions that limited earlier adoption. Allulose and rare sugars grow at 9.4% because they supply bulk as well as sweetness, which is the constraint most reformulations actually hit. And Mexico grows fastest of any country at 11.8% under sugar taxation and warning labelling together. Two of the three depend on regulation rather than preference.
The bull case at 8.0% assumes European regulatory treatment of allulose resolving, which would open bulk replacement to formulators currently working without it. The bear case at 5.6% is sugar tax expansion stalling in new jurisdictions, since policy rather than preference has driven most of the reformulation activity that this industry has been supplying. Policy is the variable that matters here.

Sweetness Was Never the Hard Part

The convention this industry prices on is sucrose equivalence: what does it cost to deliver the sweetness of a kilogram of sugar. It is a clean number and it describes only one of sugar's jobs. A compound sweet at 600 times sucrose is dosed in grams where sugar was dosed in kilograms, which leaves around 92% of the mass unaccounted for. Mass is what gives a biscuit structure and a drink body.
TOP FIVE CONCENTRATION42%Chinese producers hold much of the remaining capacity globally
PEAK SWEETNESS INTENSITY600xStrength of the most potent compounds measured against sucrose
SUGAR TAX JURISDICTIONS110Territories applying a levy on sweetened beverage products
BULK REPLACEMENT GAP92%Portion of sugar mass a high intensity compound cannot supply
PREFERRED GLYCOSIDE IN LEAF0.5%Share of the best tasting fraction occurring naturally in leaf
REFORMULATION CYCLE30 monthsTime from brief to relaunch on a major beverage line
That gap is where reformulation projects actually die. A major beverage or bakery line takes roughly 30 months from brief to relaunch, and the failures cluster on texture, mouthfeel, yield and process behaviour rather than on sweetness or aftertaste, which formulators generally solve early. A supplier arriving with a better tasting sweetener and no view on bulk is answering the question that was already settled in month three.
Demand is also more political than commercial. Roughly 110 jurisdictions apply some form of levy on sweetened beverages, and reformulation follows tax thresholds far more reliably than it follows consumer research. Manufacturers reformulate to fall below a banding rather than to satisfy a stated preference, which makes fiscal policy the useful forecasting input rather than any consumer panel.
"Ask any beverage technologist what killed their last reformulation and they will say mouthfeel, never sweetness. The industry has spent twenty years perfecting the one part of the problem that was never really in doubt, and pricing itself on a metric that describes exactly that part."
Director, Sweeteners and Food Ingredients Practice · MMA Agriculture and Food Practice · August 2026

Market Trends

Stevia shifting from agricultural extraction to fermentation manufacture

Rebaudioside M and D taste markedly better than the first-generation fractions that gave stevia its reputation for bitterness, and they occur at around 0.5% of leaf glycoside content, which makes extraction alone uneconomic. Bioconversion and precision fermentation now supply most of the volume, which turns stevia from an agricultural business into a fermentation one with entirely different capital requirements, intellectual property positions and competitive dynamics. Growers and extractors are being displaced by companies that never farmed anything. Capital intensity and intellectual property now decide who competes, a very different picture from a decade ago.
Market Impact: Applies across 110 jurisdictions
Bulk replacement becoming the binding formulation constraint

High-intensity compounds leave roughly 92% of sugar's mass unreplaced, and that missing bulk is where reformulation projects fail rather than on sweetness. Allulose, polyols, soluble fibres and protein systems all address it at different costs and with different regulatory treatment, and the combinations are genuinely difficult to get right. Suppliers who can specify a complete bulk and sweetness system rather than a single compound are winning positions that pure sweetener sellers never reach. Pricing on sucrose equivalence actively obscures that, since it makes bulk systems look expensive against compounds that solve only part of the problem.
Market Impact: Rare sugars growing at 9.4%

Market Opportunities and Growth Drivers

Beverage taxation spreading across new jurisdictions steadily

Around 110 jurisdictions now apply some levy on sweetened beverages, generally banded by sugar content, and manufacturers reformulate to fall below a threshold rather than in response to any consumer request. That makes fiscal policy the most reliable demand indicator in this market. Mexico grows fastest of any country at 11.8% where taxation and front-of-pack warning labelling reinforce one another, and beverage reformulation there has been considerably more thorough than elsewhere. Legislative drafting is public well before any reformulation brief is issued, giving a prepared supplier a year or more of warning.
Market Impact: Ignores 92% of the mass

Rare sugars supplying bulk that high-intensity compounds cannot

Allulose and related rare sugars bulk, brown and behave close enough to sucrose to address the mass problem rather than the sweetness one, which is why they grow at 9.4% despite costing considerably more per kilogram than established alternatives. Regulatory treatment differs sharply between markets, with American and Japanese formulation permitted and European non-sugar treatment absent. That divergence shapes where formulation investment goes far more than technical merit does. Cost per kilogram makes them look expensive, and cost per problem solved makes them look entirely reasonable, which is the argument suppliers should be making.
Market Impact: Splits formulation across 2 regimes

Market Restraints and Challenges

Sucrose equivalence pricing obscuring where value actually sits

Quoting cost per unit of sweetness delivered makes high-intensity compounds look overwhelmingly cheap and bulk systems look expensive, which is arithmetically true and commercially misleading. The root cause is a pricing convention inherited from when sweetness was the only question anybody asked. Commercially it pushes buyers toward compounds that leave 92% of the mass problem unsolved and then blames formulation for the failure. Complete system pricing is the mitigation, and very few suppliers offer it. It requires holding bulking ingredients as well as sweeteners. Very few sweetener suppliers hold both, which is why the convention persists.
Market Impact: Preferred fraction is 0.5% of leaf

Regulatory divergence forcing separate formulations by market

Allulose is permitted in American and Japanese formulation and not treated as a non-sugar in Europe, while several other compounds face differing approval and labelling treatment across major markets. The root cause is independent regulatory assessment rather than any safety disagreement. Commercially it obliges a global manufacturer to run separate formulations and separate supply chains for the same product. Regional formulation strategies are the only practical answer available at present. Manufacturers running one global system end up imposing the most restrictive market's constraint on every product they sell everywhere else.
Market Impact: Leaves 92% of mass unreplaced
4 additional market trends, 3 additional growth drivers, and 2 additional restraints and challenges are covered in the full report. Contact sales@marketmindsadvisory.com to access the complete intelligence.

Segment CAGR and Growth Architecture

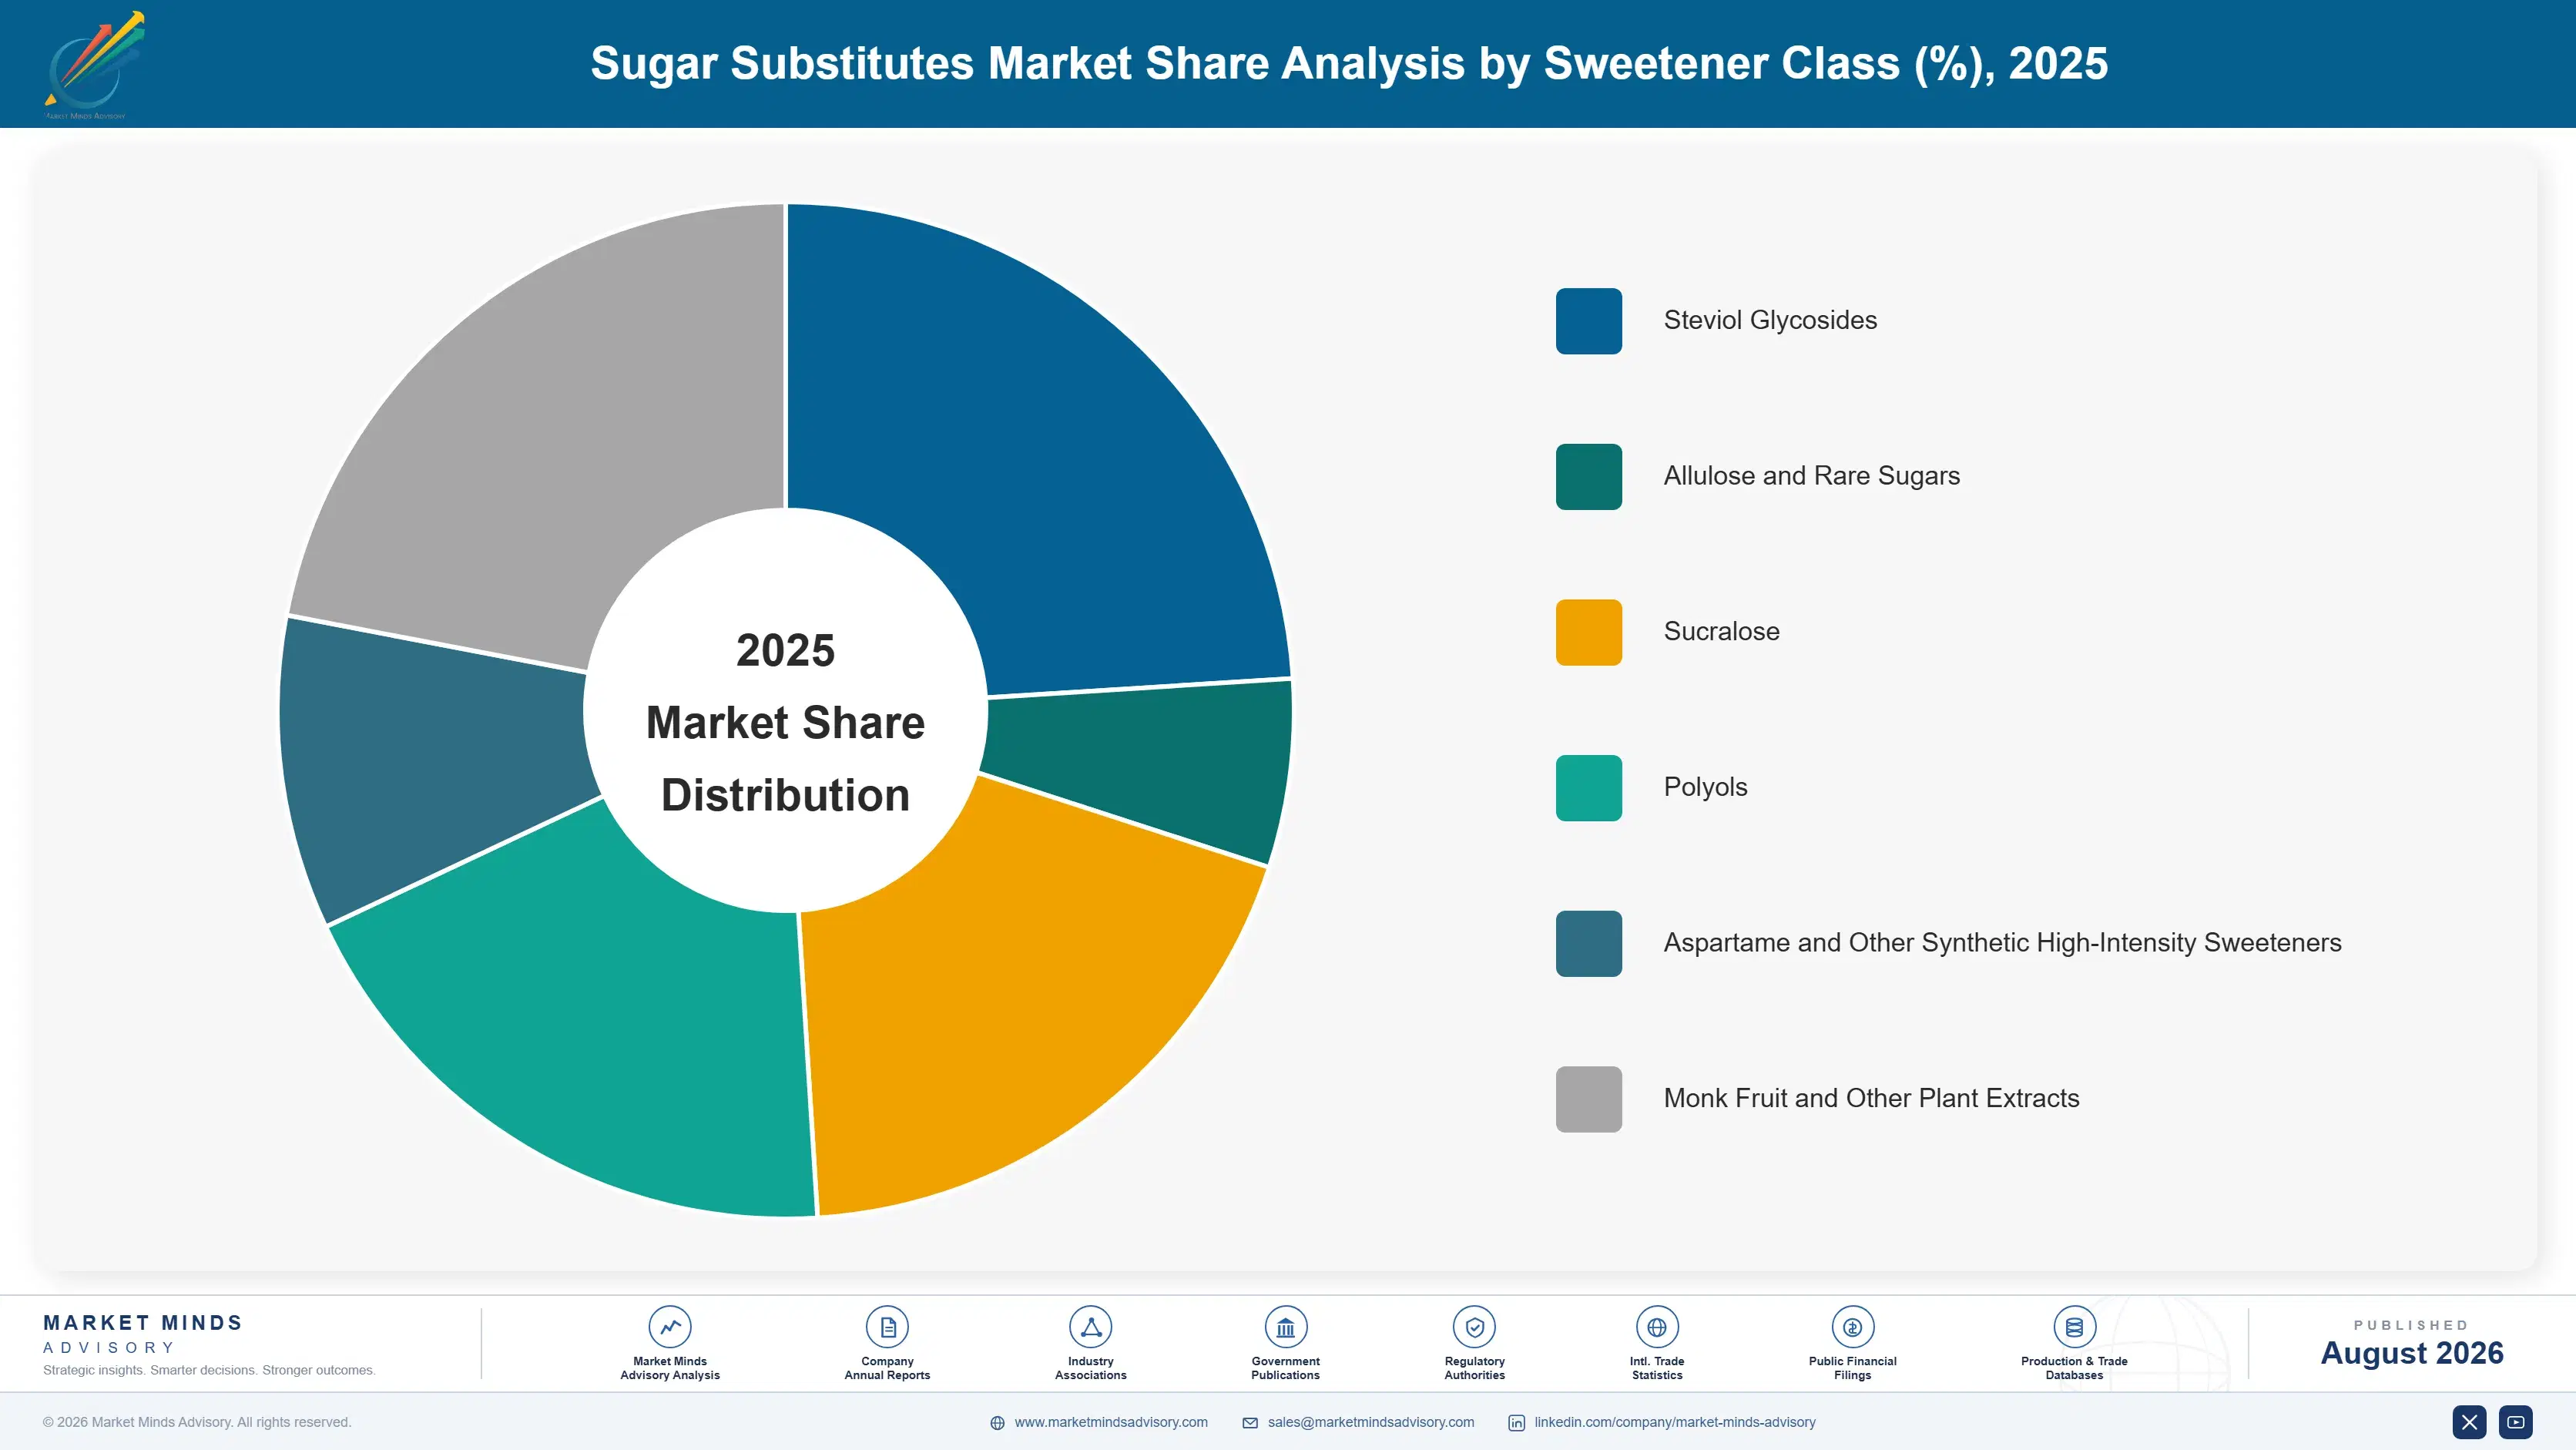
Six segments are split by sweetener class, because class determines the sweetening intensity and whether any bulk is contributed, the manufacturing route and its capital requirements, the regulatory treatment across markets and the price a producer can realistically command. Grade variants sit inside each class. Application and channel are handled separately in the framework. Manufacturing route follows class too.
sugar-substitutes-market-trends-market-share-analysis-1787639539499

Steviol Glycosides

Growing at 10.2%, half again the market rate of 6.8%, steviol glycosides have moved decisively from leaf extraction toward bioconversion because Rebaudioside M and D taste far better than earlier fractions and occur at only around 0.5% of leaf glycoside content. That shift turns the business from agriculture into fermentation, with different capital intensity, intellectual property positions and competitors than the extraction industry had. Clean label positioning drives demand alongside taste improvement, and blends with bulking systems are where most commercial formulation work now sits. Extraction producers are being displaced by companies with fermentation capability, and the capability gap widens with each product generation. Agricultural sourcing relationships no longer decide much of anything.
CAGR 10.2%

Allulose and Rare Sugars

At 9.4% allulose bulks, browns and behaves closely enough to sucrose to address the mass problem that high-intensity compounds leave entirely unsolved, at roughly a tenth of the calories. That makes it a different kind of product from a sweetener, and it explains growth that per-kilogram pricing would not predict. Regulatory divergence is the constraint rather than supply, since American and Japanese formulation permits it while European treatment does not, which splits global manufacturers into running two separate recipes for one product. Cost per kilogram sits well above high-intensity compounds, which is exactly why sucrose equivalence pricing understates its value to a formulator wrestling with a missing third of the recipe mass.
CAGR 9.4%
Full segment breakdown across 6 segments available in the complete report.

Regional Architecture and Country Demand Map

East Asia holds 30% of value because Chinese producers dominate manufacturing capacity across steviol glycosides, sucralose and erythritol. North America follows at 25% on reformulation activity rather than on any production position. South Asia and Pacific grows fastest of the seven regions covered here. Shares stay inside band.

North America

Allulose availability has made bulk replacement genuinely possible here in a way it is not in Europe, which shows in the quality of reformulated products reaching shelf. Beverage taxation exists at municipal and state level rather than nationally, so reformulation drivers vary considerably between jurisdictions. Precision fermentation capability for steviol glycosides is concentrated among a small number of participants with real intellectual property positions. Growth at 6.2% reflects mature consumption against continuing reformulation work across categories. Reformulation quality is visibly better here than in Europe as a direct result of that ingredient availability rather than any difference in formulation skill. Municipal and state level taxation varies enough that reformulation drivers differ considerably between neighbouring jurisdictions across the country.
Share: 25% | CAGR: 6.2% (2026 to 2036)

Western Europe

Regulatory treatment excludes allulose from non-sugar status, which removes the most capable bulk replacement compound and leaves formulators combining polyols, fibres and proteins to reach the same place less well. Sugar taxation is established across several markets and drives steady reformulation. Novel food approval requirements slow the introduction of newer compounds considerably. Clean label scrutiny favours steviol glycosides over synthetic high-intensity sweeteners. Growth of 5.2% is the slowest anywhere on regulatory constraint and mature demand. European producers additionally carry the highest industrial energy costs, which weighs on fermentation routes more heavily than on extraction or synthesis. Novel food approval timelines run to several years, which delays newer compounds well beyond their availability in other major markets and compounds the disadvantage.
Share: 20% | CAGR: 5.2% (2026 to 2036)
Regional intelligence for 5 additional markets available in the complete report: East Asia, South Asia and Pacific, Latin America, Middle East and Africa, Eastern Europe. Contact sales@marketmindsadvisory.com.
sugar-substitutes-market-trends-country-cagr-analysis-1787639540002

Four Moves Past Sucrose Equivalence

Pricing on cost per unit of sweetness describes the part of the problem formulators solve in month three of a thirty month project. The moves that matter sell complete systems including bulk, follow tax policy rather than consumer research, and treat regulatory divergence as a formulation strategy rather than an inconvenience. Policy leads the rest.

Sell complete sweetness and bulk systems together

High-intensity compounds leave around 92% of sugar's mass unreplaced, and that gap is where thirty month reformulation projects actually fail. A supplier specifying a complete system including bulking, mouthfeel and process behaviour is solving the customer's real problem rather than the easy part of it. Those relationships hold across the whole project rather than ending when a sweetener is chosen, and they command pricing that compound supply never does. It also requires holding or partnering for bulking ingredients, which is a portfolio decision rather than a sales one. Few suppliers hold both today.
Market Impact: Addresses 92% of the missing sugar mass entirely

Track fiscal policy rather than consumer research

Around 110 jurisdictions apply beverage levies banded by sugar content, and manufacturers reformulate to fall below a threshold rather than to satisfy any stated preference. Following tax legislation identifies reformulation demand a year or more before a brief is issued, which is time no competitor watching consumer panels will have. Mexico grows fastest at 11.8% on exactly that mechanism, and several jurisdictions are drafting comparable measures now. Engaging a manufacturer before the brief exists is a fundamentally different commercial position from quoting against one. Legislative drafting is entirely public and almost nobody reads it.
Market Impact: Anticipates levies across all 110 taxing jurisdictions worldwide

Build regional formulation strategies rather than global compromises

Allulose is permitted in American and Japanese formulation and excluded from European non-sugar treatment, so a manufacturer running one global system imposes the European constraint everywhere it sells. Offering deliberately different regional systems costs complexity and delivers materially better products where regulation allows. Suppliers who present that as a strategy rather than an inconvenience reach formulators who have been struggling with the same problem internally. Running 2 deliberate regional systems costs supply chain complexity and produces materially better products wherever the regulation actually allows it. Formulators have wrestled with this internally without help.
Market Impact: Serves 2 divergent regulatory regimes properly at once

Invest in fermentation capability for premium glycoside fractions

Rebaudioside M and D occur at around 0.5% of leaf glycoside content, which makes bioconversion and precision fermentation the only economic route and turns stevia into a fermentation business. Steviol glycosides grow at 10.2% on that quality improvement. Extraction based producers are being displaced by companies with fermentation capability and intellectual property, and the capital and capability gap between the two widens with each product generation. The capital requirement is substantial and the position it buys is genuinely difficult for an extraction business to answer at any price. Each product generation widens the gap further.
Market Impact: Serves the 10.2% glycoside segment growth every year

Who Controls the Margin Pool

Participation is measured on annual sweetener volume supplied on a tonnage basis, and the top five hold 42%. Concentration is moderate because Chinese producers hold substantial capacity across several compound classes without holding the customer relationships. Tate and Lyle and Cargill lead through formulation service capability and complete system supply rather than through any single compound advantage. The gap to challengers is application capability rather than manufacturing capacity.
Competition runs on three fronts. Formulation service decides which supplier gets into a reformulation project early, which is where the position is actually won. Manufacturing cost decides commodity compound supply, where Chinese producers compete hard. And fermentation capability decides access to the premium glycoside fractions driving segment growth. Regulatory navigation has become a fourth front, since compound availability now differs materially between a customer's own markets.

Pressure ahead comes from fermentation displacing extraction in stevia, and from bulk replacement becoming the deciding formulation question. Expect service-capable suppliers to take position from pure compound sellers. Rankings shift on who can specify a complete system rather than quote a sweetener. Concentration should rise as system supply consolidates relationships. Chinese capacity keeps commodity pricing under pressure.
sugar-substitutes-market-trends-company-positioning-matrix-1787639540530

Competitive Moat and Risk Dimensions

TATE AND LYLE

Moat: Formulation service and system breadth

Holding sweeteners, fibres, starches and texturants together allows the company to specify a complete reformulation system rather than a compound, which addresses the bulk problem where projects actually fail. That breadth positions it inside a thirty month project from the brief rather than at the point a sweetener gets selected, which is a fundamentally stronger commercial position.
TATE AND LYLE

Risk: Commodity compound price exposure

Parts of the portfolio compete against Chinese producers holding substantial capacity and lower manufacturing cost across sucralose and polyols, where formulation service adds little and price decides. That exposure grows as those producers add capacity, and no amount of service capability protects a compound sold on specification alone.
CARGILL

Moat: Fermentation capability and ingredient reach

Precision fermentation capability for premium steviol glycoside fractions combined with very broad food ingredient reach positions the business where the fastest segment growth is happening and where extraction based producers cannot follow. Building comparable fermentation capacity requires capital and intellectual property that agricultural extractors do not have and cannot readily acquire.
CARGILL

Risk: Regulatory divergence complexity

Serving global manufacturers across markets that treat allulose and several other compounds differently forces separate formulation systems and separate supply chains for the same customer product. That complexity is regulatory rather than operational, and it consumes technical resource that would otherwise fund product development. It also complicates capacity planning considerably.

Players Tracked

Prominent Players

Tate and Lyle
Cargill
Ingredion
PureCircle
Ajinomoto

Other Key Players

ADM
Roquette
Beneo
Merisant
Anhui Jinhe Industrial
Niutang Chemical
Shandong Sanyuan Biotechnology
GLG Life Tech
Sweegen
Layn Natural Ingredients
Samyang Corporation
Matsutani Chemical
DSM-Firmenich
Baolingbao Biology
Sunwin Stevia

Recent Developments

MARCH 2026

Beverage manufacturer abandons reformulation on mouthfeel rather than taste

A beverage manufacturer abandoned a reformulation project close to relaunch after mouthfeel and body failed consumer testing, with sweetness and aftertaste having been resolved early in the thirty month development cycle. The sweetener supplier had no bulk system to offer. Roughly two years of development work was written off.
Signal: Projects die on the mass problem, which most sweetener suppliers have no answer for at all
OCTOBER 2025

Further jurisdictions introduce banded beverage sugar levies

Additional jurisdictions introduced beverage levies banded by sugar content, prompting manufacturers to reformulate toward thresholds rather than in response to any consumer research. Suppliers tracking the legislation had engaged with those manufacturers well before briefs were issued. Reformulation briefs followed within roughly a year across affected categories.
Signal: Reformulation demand appears where tax bands land, not where consumer preference sits in any market at all
JANUARY 2026

Fermentation producer displaces extraction supplier on glycoside fraction

A precision fermentation producer displaced a leaf extraction supplier on premium steviol glycoside fractions, on consistency and cost that leaf sourcing could not match given the fraction occurs at roughly half a percent of leaf content. Batch consistency rather than delivered price decided the outcome.
Signal: Fermentation is displacing agriculture in stevia, and the capability gap keeps widening year after year now

Fermentation, Feedstock and Energy

Fermentation feedstock, principally dextrose and other carbohydrate substrates, carries around 27% of cost for bioconverted compounds. Energy for fermentation, separation and drying takes about 24%, which is high because purification to food grade is demanding. Chemical synthesis inputs account for around 19% across synthetic compounds. Purification media, quality testing, packaging and freight absorb the balance across most producers.
Industrial energy pricing rose sharply through 2022 and has stayed elevated in Europe, per IEA industrial energy reporting alongside Tate and Lyle Annual Report 2025 and Ingredion Annual Report 2025 commentary on energy and feedstock exposure. Fermentation routes absorbed that movement more heavily than extraction did, which briefly narrowed the cost advantage bioconversion had established over leaf sourcing for premium fractions. Energy siting has since become a live consideration in capacity planning.

Exposure divides on manufacturing route rather than on scale. A fermentation producer carries feedstock and energy across roughly half of cost with process yield as the main lever. A synthetic producer carries chemical inputs behaving quite differently. Chinese producers across both routes carry lower energy cost and considerable capacity, which is why compounds without formulation service attached compete almost entirely on delivered price.
sugar-substitutes-market-trends-cost-volatility-analysis-1787639540726

Improve fermentation yield rather than contracting feedstock

Feedstock and energy together carry around half of bioconverted compound cost, and strain and process yield improvements reduce both simultaneously rather than repricing either. That work is slow and permanent, and it compounds across every subsequent product generation, which contracting simply does not do at any negotiated price. Yield gains hold permanently once achieved.

Attach formulation service to compounds facing price competition

Compounds sold on specification alone compete against Chinese capacity on delivered price and nothing else. Bundling formulation service, bulk system design and application support changes what is being purchased, and it moves the conversation from procurement to product development where price sensitivity is considerably lower. Product development budgets behave quite differently from procurement ones.

Site fermentation capacity against industrial energy cost

Fermentation and purification are energy intensive enough that regional industrial energy pricing meaningfully changes competitive position, which European producers discovered during the last cost cycle. Capacity siting decisions should weight energy cost alongside proximity to customers, since the two frequently point in opposite directions. Customer proximity and cheap energy rarely coincide. Weighting both is the discipline.

Portfolio Architecture for Margin Defence

Margin here follows how far a supplier sits from a specification sheet, because a compound quoted against a purity specification competes only on delivered price. Commodity synthetic compounds and standard polyols earn margins in the high single digits to mid teens, where Chinese manufacturing capacity sets the price and formulation service adds nothing a buyer will pay for. There is nothing else to compete on there.
Premium glycoside fractions and rare sugars do better in the mid twenties to mid thirties, because fermentation capability and regulatory approval both narrow the supplier field considerably, and the compounds solve problems that cheaper alternatives demonstrably do not solve at any dose. Regulatory approval status varies by market, which narrows the field further in some places than in others.

Complete formulation systems hold the strongest position, reaching into the low forties, where a supplier specifies sweetness, bulk, mouthfeel and process behaviour together and enters a thirty month project at the brief. Those margins reflect application capability and customer relationship rather than any advantage in compound manufacturing cost. Very few suppliers hold both the sweeteners and the bulking ingredients that a complete system actually requires.

Synthetic Compounds and Standard Polyols

Compounds sold against purity specifications where delivered price decides every award. The seven point range reflects manufacturing energy cost and scale rather than any product difference a formulator could detect between suppliers.
Gross Margin: 9-16%

Premium Glycoside Fractions and Rare Sugars

Bioconverted fractions and rare sugars where fermentation capability and regulatory approval narrow the supplier field. The eleven point range reflects intellectual property position and how far the compound solves problems cheaper alternatives cannot.
Gross Margin: 24-35%

Complete Formulation Systems

Sweetness, bulk, mouthfeel and process systems specified together from the project brief onward. The eleven point range reflects application capability depth and how early the supplier enters the reformulation cycle with the customer.
Gross Margin: 31-42%
sugar-substitutes-market-trends-portfolio-architecture-1787639541246

High-value Sub-segments and Strategic Watch-out

Complete Formulation Systems

High value and growing as bulk replacement becomes the deciding constraint on thirty month reformulation projects. A supplier specifying sweetness and mass together enters at the brief rather than at compound selection. Those positions survive the entire development cycle rather than ending at compound selection.
Gross Margin: 33-42%

Premium Glycoside Fractions

High value and the fastest growth at 10.2% as bioconverted Rebaudioside M and D replace bitter early fractions. Fermentation capability and intellectual property exclude the extraction producers that once held this business. Capital and intellectual property decide participation now, not agricultural sourcing relationships. Extraction is being displaced.
Gross Margin: 26-35%

Synthetic High-Intensity Compounds

The volume core, competing on delivered price against Chinese manufacturing capacity where formulation service adds nothing. Aspartame additionally carries a reputational overhang that reformulation briefs increasingly specify against. Price is the only variable left and Chinese capacity sets it. Reformulation briefs increasingly specify against it.
Gross Margin: 9-16%

Regulatory Divergence Exposure

The strategic watch-out. Allulose and other compounds face incompatible treatment across major markets, and the range reflects whether a supplier offers deliberate regional systems or one global compromise satisfying nobody. One global recipe imposes the strictest market's limits everywhere. Regional systems are the only real answer.
Gross Margin: 7-40%

Tax Bands Set the Brief

Demand originates in fiscal policy far more often than in consumer preference. A beverage manufacturer reformulates because a levy band sits at a particular sugar content and crossing it changes the landed cost of every case shipped. The brief that reaches a sweetener supplier is downstream of a tax schedule, which is why legislative tracking predicts demand better than any consumer panel does.
Stickiness follows how early a supplier enters the project. A compound selected at month three of a thirty month cycle can be swapped at any later stage if something better appears. A supplier who specified the complete system, ran the pilot trials and solved the mouthfeel problem is embedded in a formulation that would have to be redeveloped to replace, which almost never happens.

The deciding functions have widened as bulk became the binding constraint. Sweetener selection once sat with a flavour or beverage technologist alone. It now involves process engineering, who care about behaviour on the line, and regulatory affairs, who determine which compounds are usable in each market. A supplier answering only the sweetness question is addressing one of three people.
sugar-substitutes-market-trends-end-use-penetration-index-1787639541736

Where We Would Put Effort

These are among the four positions where our research anticipates prominent divergence between winners and laggards over the coming forecast period. Each is grounded in the demand model, the regulatory perimeter, and the announced capacity pipeline.
01 / COMPLETE SYSTEM SELLING

Sell the mass, not just the sweetness

High-intensity compounds leave around 92% of sugar's mass unreplaced, and reformulation projects running roughly thirty months collapse on texture, body and line process behaviour rather than on sweetness or aftertaste. A supplier who specifies bulking, mouthfeel and line behaviour together alongside sweetness enters the project at the brief stage rather than at the point of compound selection. Those positions survive the whole development cycle and command pricing that quoting a compound against a purity specification could ever hope to achieve.
02 / FISCAL POLICY TRACKING

Tax schedules beat consumer panels

Around 110 jurisdictions apply beverage levies banded by sugar content, and manufacturers reformulate in order to drop below a threshold rather than to answer any stated consumer preference at all. Legislative drafting is public well before a reformulation brief is issued, which gives a prepared supplier a year or more of warning that nobody else has. Mexico grows fastest of any country at 11.8% on exactly that mechanism, and several jurisdictions are drafting comparable measures right now for introduction shortly.
03 / REGIONAL FORMULATION STRATEGY

Stop pretending one recipe works everywhere

Allulose is permitted in American and Japanese formulation and excluded from European non-sugar treatment, so any manufacturer insisting on a single global system imposes the European constraint on every market it serves. Offering deliberately different regional formulations costs supply chain complexity and delivers materially better products in whichever markets the regulation actually permits them to be made. Presenting that as a strategy reaches formulators who have been wrestling with the same problem internally without a single supplier ever acknowledging that it exists.
04 / FERMENTATION CAPABILITY BUILDING

Stevia stopped being an agricultural business

Rebaudioside M and D taste far better than the fractions that gave stevia its early reputation and occur at roughly half a percent of leaf glycoside content, which makes extraction uneconomic and bioconversion the only viable route. Steviol glycosides grow at 10.2% against a market rate of 6.8% on that quality improvement alone. Extraction producers are being displaced by companies that have never farmed anything at all, and the capability gap widens further with each successive product generation that arrives.

Engagement Snapshot From the Field

A live engagement with an industry participant carrying material or product regulatory and market exposure ahead of a defining policy shift, showing how our research translates into a defensible multi-year portfolio strategy.
MARKET MINDS ADVISORY · CLIENT ENGAGEMENT SUMMARY
Sugar Substitutes Producer Strategic Portfolio Review and Transition Roadmap 2026·Investment Scenario on Sugar Substitutes Exposure Evaluation 2025-26
CLIENT PROFILE
A global sweetener producer supplying synthetic high-intensity compounds and polyols to beverage and food manufacturers across four continents, at annual revenue near 620 million dollars (client-reported, unverified by MMA). Sales were organised around compound specifications and no formulation service capability existed within the commercial organisation. Margins had compressed for four consecutive years. No bulking ingredients were held.
STRATEGIC CHALLENGE
Volume was holding while margins compressed against Chinese capacity, and the business kept losing reformulation projects to competitors offering broader ingredient ranges. Management wanted to know whether to compete on manufacturing cost or to build something the compound business did not currently have. A capital decision was pending that year.
MMA APPROACH
MMA reconstructed why the client had lost fifteen recent reformulation projects, tracked how beverage tax legislation had preceded reformulation briefs across several markets, assessed the client's regulatory position by compound and market, and compared margin performance between compound sales and competitors' system sales. Interviews with 47 experts covered beverage formulation, food ingredient supply and sweetener regulation.
KEY FINDINGS
  1. Fourteen of the fifteen lost projects had turned on bulk, texture or process behaviour rather than on sweetness, aftertaste or compound pricing at any point in the evaluation.
  2. Competitors offering complete systems were entering projects at the brief while the client was being asked to quote at compound selection, roughly a year and a half later.
  3. Beverage tax legislation had preceded every reformulation brief examined by at least twelve months, and the client had no process for tracking any of it systematically.
  4. Compound margins had compressed for four consecutive years against Chinese capacity, while competitors' system sales had held margin through the same period entirely.
CLIENT PROFILE
A global sweetener producer supplying synthetic high-intensity compounds and polyols to beverage and food manufacturers across four continents, at annual revenue near 620 million dollars (client-reported, unverified by MMA). Sales were organised around compound specifications and no formulation service capability existed within the commercial organisation. Margins had compressed for four consecutive years. No bulking ingredients were held.
STRATEGIC CHALLENGE
Volume was holding while margins compressed against Chinese capacity, and the business kept losing reformulation projects to competitors offering broader ingredient ranges. Management wanted to know whether to compete on manufacturing cost or to build something the compound business did not currently have. A capital decision was pending that year.
MMA APPROACH
MMA reconstructed why the client had lost fifteen recent reformulation projects, tracked how beverage tax legislation had preceded reformulation briefs across several markets, assessed the client's regulatory position by compound and market, and compared margin performance between compound sales and competitors' system sales. Interviews with 47 experts covered beverage formulation, food ingredient supply and sweetener regulation.
KEY FINDINGS
  1. Fourteen of the fifteen lost projects had turned on bulk, texture or process behaviour rather than on sweetness, aftertaste or compound pricing at any point in the evaluation.
  2. Competitors offering complete systems were entering projects at the brief while the client was being asked to quote at compound selection, roughly a year and a half later.
  3. Beverage tax legislation had preceded every reformulation brief examined by at least twelve months, and the client had no process for tracking any of it systematically.
  4. Compound margins had compressed for four consecutive years against Chinese capacity, while competitors' system sales had held margin through the same period entirely.
RECOMMENDED STRATEGY
Phase 1: Phase one: build formulation service capability with bulking and texturant partners, so the business can specify complete systems rather than quote compounds. Phase 2: Phase two: establish systematic tracking of beverage tax legislation, which precedes reformulation briefs by a year or more in every market examined. Phase 3: Phase three: stop defending commodity compound share against Chinese capacity and redirect that commercial effort into system selling instead. That effort is better spent elsewhere.
OUTCOME
The producer established a formulation service function during 2026 and entered several projects at brief stage rather than at compound selection (client-reported, unverified by MMA). Commodity compound promotion was reduced, and legislative tracking became a standing commercial input. Compound margins stabilised as mix shifted toward system supply across the year.

Frequently Asked Questions

Foundational context covering the market sizes, CAGR, scope, country, region and competition that inform every finding below. This section is provided to cover basics and most often pre-purchase conversations, answered from the MMA Primary Research Dataset.

What is the current size of the Sugar Substitutes Market?

MMA sizes it at USD 22.4 billion in 2025, rising to USD 23.92 billion in 2026. The figure covers sweetening compounds supplied as ingredients at producer selling value across all classes.

How large will the Sugar Substitutes Market be by 2036?

USD 46.19 billion by 2036, an incremental USD 22.27 billion over the 2026 base and an expansion multiple of 1.93 times. Steviol glycosides account for a disproportionate share of that.

What is the CAGR for the Sugar Substitutes Market 2026 to 2036?

6.8% in the base case, with a bull case at 8.0% and a bear case at 5.6%. The spread turns largely on whether beverage tax expansion continues into new jurisdictions.

Which segment is growing fastest?

Steviol glycosides at 10.2%, half again the market rate of 6.8%. Bioconverted Rebaudioside M and D taste far better than the early fractions that limited stevia adoption.

Who are the major companies in the Sugar Substitutes Market?

Tate and Lyle, Cargill, Ingredion, PureCircle and Ajinomoto lead on sweetener tonnage supplied. Fifteen further participants are profiled in the full report on that same basis.

Which country is growing fastest?

Mexico at 11.8%, where beverage taxation and mandatory front-of-pack warning labelling reinforce each other and have driven more thorough reformulation than most markets attempted. Reformulation there has been unusually thorough.

Report Segmentation Architecture

The full report scope spans multiple orthogonal segmentation dimensions, with cross-tabulated demand data provided for each dimension pair. Coverage extends further to regional breakdowns, trend trajectories, and the competitive detail needed to support segment-level decision-making.

By Sweetener Class

  • Steviol Glycosides
  • Allulose and Rare Sugars
  • Sucralose
  • Polyols
  • Aspartame and Other Synthetic High-Intensity Sweeteners
  • Monk Fruit and Other Plant Extracts

By End-Use Industry

  • Carbonated and Still Beverages
  • Dairy and Frozen Desserts
  • Bakery and Confectionery
  • Tabletop and Retail Sweeteners
  • Pharmaceutical and Nutraceutical
  • Animal Nutrition and Other Industrial

By Commercial Dimension

  • Direct Manufacturer Supply
  • Ingredient Distributor Channels
  • Formulation System Contracts
  • Contract Manufacture and Toll Processing
  • Private Label Tabletop Supply
  • Export and Cross-Border Supply

By Region

  • North America
  • Western Europe
  • East Asia
  • South Asia and Pacific
  • Latin America
  • Middle East and Africa
  • Eastern Europe

Scope, Methodology, and Coverage

Every figure in this report is reproducible from documented input assumptions. The scope below maps the historical period, the forecast horizon, the segmentation dimensions, and the countries covered, alongside the underlying primary and qualitative methodology.
Historical Period
2020 to 2025
Forecast Period
2026 to 2036
Base Year
2025 (USD billions; MMA Primary Research Dataset, August 2026)
Market Definition
Sweetening compounds supplied as food and beverage ingredients, covering steviol glycosides, allulose and rare sugars, sucralose, polyols, aspartame and other synthetic high-intensity sweeteners, and monk fruit and other plant extracts. Measured at producer selling value. Sucrose and other caloric sugars, high fructose corn syrup, honey and syrups sold as foods, finished sugar-free consumer products, and flavour modifiers without sweetening function are excluded from scope.
Quantitative Units
USD billions (current prices); thousand tonnes supplied; USD per kilogram by sweetener class
Segmentation Dimensions
Sweetener class; end-use industry; commercial dimension; region
Regions Covered
North America, Western Europe, East Asia, South Asia and Pacific, Latin America, Middle East and Africa, Eastern Europe
Countries Covered
United States, Canada, Mexico, United Kingdom, Germany, France, Netherlands, Spain, China, Japan, South Korea, India, Indonesia, Australia, Brazil, Chile, Saudi Arabia, South Africa, Poland, Czech Republic
Key Companies Profiled
Tate and Lyle, Cargill, Ingredion, PureCircle, Ajinomoto, ADM, Roquette, Beneo, Merisant, Anhui Jinhe Industrial, Niutang Chemical, Shandong Sanyuan Biotechnology, GLG Life Tech, Sweegen, Layn Natural Ingredients, Samyang Corporation, Matsutani Chemical, DSM-Firmenich, Baolingbao Biology, Sunwin Stevia
Quantitative Methodology
Primary survey, n=3,800 respondents, Q4 2025, six countries; demand-side model with trade association cross-validation
Qualitative Methodology
47 expert interviews, Q4 2025; applied to validate demand model assumptions, identify emerging dynamics, and assess competitive positioning
Report Format
PDF and XLSX data workbook (Word format preview document)
Publisher
Market Minds Advisory
Report Code
MMA-2026-AGR-194
Published
August 2026
Contact
sales@marketmindsadvisory.com | www.marketmindsadvisory.com

Purchase the full Sugar Substitutes Market Report (2026 to 2036).

The full report abandons sucrose equivalence as the organising metric, because it describes the part of the problem formulators solve first and hides the bulk replacement where projects actually fail. It sizes all six sweetener classes independently through 2036, maps beverage tax legislation against reformulation briefs by market, and models regulatory divergence effects on formulation strategy. Regional chapters cover all seven regions with manufacturing capacity assessed separately from consumption. Competitive profiling covers 20 participants on one consistent tonnage basis throughout. Reformulation project failure modes are analysed by category.
Six sweetener classes sized independently through 2036
Beverage tax legislation mapped against reformulation brief timing
Bulk replacement requirements quantified by application category
Regulatory divergence modelled across formulation strategy by market
Fermentation against extraction economics compared for glycoside fractions
Twenty participants profiled on one consistent tonnage basis

Built For The People Who Decide

From boardroom strategy to bench-side execution, this report is read cover-to-cover by leaders shaping the next decade of their industry, turning demand scenarios, market dynamics and valuation benchmarks into decisions.
CXOs/ Presidents/ VPs/ Managers
M&A and Corporate Development
Strategy Teams and R&D Heads
Procurement and Product Directors
Regulatory and Compliance Leaders
Investor Relations and Equity Analysts