Market Minds Advisory
Substation Monitoring System Market

Substation Monitoring System Market: Substation Monitoring System Market. Grid Modernization Drives Predictive Analytics Adoption

Aging grid infrastructure and expanding renewable energy integration are pushing utilities toward continuous substation condition monitoring, as unplanned transformer failures grow more costly under tightening reliability regulations that penalize extended outage durations.

Lead Analyst

Published

September 2026

Make Smarter Decisions with Customized Research Insights

Request a free sample report and evaluate market opportunities, growth trends, and competitive dynamics relevant to your business needs.

2025 MARKET VALUE$3.2BMarket Size 2025
2036 FORECAST VALUE$8.7BBase Case , 2026 to 2036
CAGR 2026 TO 20369.5 %Bull 10.7% / Bear 8.3%
INCREMENTAL OPPORTUNITY$5.2BNet 10- year value creation
EXPANSION MULTIPLE2.48x2036 value over 2026 base
Strategic Levers
M&A Pipeline
Regional Outlook
Country Rankings
Competitive Intelligence
Segmental Deep-dive
Call-Us : 91 93563 13602

Executive Snapshot and Market Trajectory.

Utilities are shifting from scheduled maintenance to continuous condition monitoring, since unplanned transformer failures now trigger regulatory penalties and replacement power costs that dwarf the price of monitoring hardware many times over across a single serious grid incident happening today alone.
Grid operators facing aging transformer fleets and rising renewable energy variability are the primary commercial force behind sensor deployment, since a single unplanned failure can cost millions in replacement power and regulatory penalties combined across a service territory. AI-based predictive analytics platforms have become the fastest-growing product category as utilities move beyond raw sensor data toward software that flags degrading equipment before failure, while deployment concentrates heavily among large investor-owned utilities with dedicated modernization budgets.
Competition has split between established grid equipment manufacturers bundling monitoring into new transformer sales and specialized analytics vendors selling retrofit sensor packages for existing infrastructure across aging utility fleets nationwide today. Regulatory pressure is building too: expanding grid reliability standards and renewable interconnection requirements are pushing utilities to document substation health more rigorously than voluntary maintenance programs ever required, adding monitoring investment utilities previously treated as discretionary spending entirely.
Market Definition
This market covers hardware sensors, communication infrastructure, and analytics software used to monitor the operational condition of electrical substations, including transformers, circuit breakers, and switchgear. It excludes the substation equipment itself, such as transformers and breakers, and broader grid management software not specifically focused on substation asset condition monitoring.
Base Year Value
$3.2B in 2025 (MMA Primary Research Dataset, September 2026)
Forecast Period
2026 to 2036, eleven discrete annual values
CAGR
9.5% base case. Bull 10.7%. Bear 8.3%.
Fastest Growth Segment
AI-Based Predictive Analytics Platforms: 15.5% CAGR
Fastest Growth Country
India: 16.5% CAGR
Fastest Growth Region
South Asia and Pacific: 11.5% CAGR
Largest Region
East Asia: 29% of 2025 global value
Market Leaders
Siemens Energy, Hitachi Energy, Schneider Electric, GE Vernova, ABB
Primary Survey
n=3,800 procurement and R&D decision-makers, Q4 2025, six countries
Methodology
Demand-side build-up, cross-validated against public data, 47 expert interviews

Substation Monitoring System Market Forecast Scenarios

substation-monitoring-system-market-size-forecast-scenario-1788677604815
Substation monitoring demand grew steadily from 2020 through 2025 as grid operators faced increasing renewable energy variability and aging transformer fleets approaching end of design life across major developed grid networks worldwide, particularly in North America and Western Europe where infrastructure investment cycles had lagged underlying demand growth for many years running without adequate correction.
The base case assumes continued renewable interconnection growth requiring tighter grid condition visibility, expanding regulatory reliability standards forcing more rigorous asset documentation, and growing utility willingness to fund predictive analytics software as a genuine cost-avoidance investment rather than a discretionary technology purchase that gets deferred during budget tightening. Vendors combining hardware sensors with analytics software capture disproportionate new contract value as utilities tire of managing separate sensor and software vendor relationships across multiple procurement cycles.
A bull scenario assumes accelerating renewable interconnection mandates force broader utility investment across previously underserved regional grid operators facing capacity constraints and reliability shortfalls; a bear scenario assumes utility capital budget constraints delay monitoring rollout, confining adoption mostly to the largest investor-owned utilities with dedicated grid modernization funding already secured well in advance of the forecast period.

Where Aging Infrastructure Meets Predictive Analytics

Substation monitoring has evolved from a niche reliability tool into core grid infrastructure investment as utilities face simultaneous pressure from aging equipment and expanding renewable interconnection requirements across their entire service territory footprint today. The economics finally favor broader deployment as sensor costs fall and utilities recognize that a single prevented failure can pay for years of monitoring investment upfront.
MARKET CONCENTRATION (CR5)48%Moderate concentration seen among leading grid equipment manufacturers globally
AVERAGE SENSOR RETROFIT COST$45,000Typical per-substation retrofit investment cost for existing infrastructure
TOP PRODUCING COUNTRY SHARE34%China dominates global grid monitoring hardware manufacturing capacity
PREDICTIVE ANALYTICS ADOPTION RATE38%Share of large utilities using predictive analytics platforms today
TRANSFORMER FLEET AVERAGE AGE38 yearsTypical age of transformers nearing end of design life
FAILURE DETECTION LEAD TIME6 monthsAverage advance warning provided before actual equipment failure
Predictive analytics adoption is expanding fastest among large investor-owned utilities with dedicated grid modernization budgets, where software that flags degrading equipment before failure directly reduces both unplanned outage costs and regulatory penalty exposure considerably each fiscal year. Manufacturing concentration in China keeps hardware costs falling as production volume scales across the broader global grid infrastructure market steadily over time and across regions.
Competitive dynamics increasingly favor vendors who combine hardware sensors with analytics software under one platform, since this bundling captures more contract value than selling sensors alone to utilities that then integrate third-party analytics separately at meaningful additional cost and delay. Established grid equipment manufacturers increasingly bundle monitoring capability directly into new transformer sales, squeezing pure-play retrofit sensor vendors on new construction opportunities specifically.
"Every utility still running scheduled-only maintenance on its substation fleet is quietly accepting a failure it could have seen coming. The regulators noticed that gap before the vendors did."
Practice Lead, Grid Infrastructure and Energy Technology · MMA Digital Substation Monitoring Hardware and Grid Condition Analytics Software Practice · September 2026

Market Trends

AI Analytics Platforms Displace Raw Sensor Dashboards

Utilities are moving beyond raw sensor dashboards toward AI-based predictive analytics platforms that flag degrading transformer insulation, bushing wear, and partial discharge activity before failure occurs, reflecting a documented 45 percent reduction in unplanned outages among early adopters according to utility industry benchmarking studies. Vendors that can demonstrate predictive accuracy rather than simple data visualization are winning larger, longer contracts as utility asset management teams demand evidence before committing capital budget. This shift toward outcomes-based analytics is reshaping vendor selection criteria across the entire industry, favoring specialized analytics providers over pure hardware sensor manufacturers lacking software depth.
Market Impact: Average fleet age reaches 38 years

Renewable Interconnection Requirements Expand Monitoring Scope

Expanding renewable energy interconnection, which introduces variable power flows that traditional substation equipment was never designed to handle continuously, is forcing utilities to monitor substation condition more granularly than legacy scheduled maintenance programs ever required across their entire service territory. Grid operators integrating significant solar and wind capacity report needing monitoring coverage across roughly 30 percent more substation assets than five years ago simply to maintain equivalent reliability margins. This expanding scope broadens the addressable market for monitoring hardware and software well beyond the aging-infrastructure replacement cycle that historically drove most industry demand for decades.
Market Impact: New penalty rules added since 2023

Market Opportunities and Growth Drivers

Aging Transformer Fleets Approach End of Design Life

The average transformer in North American and Western European grids is roughly 38 years old, according to utility asset management industry surveys, exceeding the typical 40-year design life threshold that traditionally triggered replacement rather than continued monitoring and extended operation across most existing service territories nationwide right now today. Utilities increasingly choose condition-based monitoring over blanket fleet replacement, since replacing every aging transformer simultaneously would require capital spending far beyond what regulators typically allow utilities to recover through customer rates in any single multi-year rate case proceeding period without delay.
Market Impact: Adds 20 to 35 percent

Reliability Regulations Penalize Extended Outage Durations

Expanding grid reliability regulations in the US and European Union increasingly tie utility revenue directly to measured outage duration and frequency metrics, creating direct financial incentive for utilities to prevent failures rather than simply respond to them after the fact each and every single time. Several US state regulators have introduced performance-based rate structures since 2023 that penalize utilities for outage minutes beyond specified thresholds, adding real revenue exposure to substation reliability that did not exist under traditional cost-of-service regulatory frameworks used previously across most state jurisdictions nationwide for decades.
Market Impact: Adds 1 to 2 years delay

Market Restraints and Challenges

Retrofit Costs Remain High for Legacy Substations

Retrofitting sensor and communication infrastructure into decades-old substations often costs considerably more than installing monitoring in new construction, since legacy substations frequently lack the wiring conduits, network connectivity, and physical space that modern monitoring hardware requires as standard installation prerequisites in most cases. The root cause is that most existing substations were designed decades before continuous digital monitoring was ever contemplated as a design requirement at all. Some vendors now offer wireless retrofit sensor packages specifically to reduce installation cost and complexity, though these remain more expensive than wired alternatives on a per-sensor basis.
Market Impact: Cuts unplanned outages 45 percent

Utility Capital Budget Cycles Slow Adoption Pace

Utility capital spending operates on multi-year regulatory approval cycles that move considerably slower than the pace at which monitoring technology and vendor offerings evolve, creating a persistent lag between available technology and actual utility deployment timelines. The root cause is that utilities must justify capital expenditure to rate regulators through formal proceedings that can take a year or more to complete, discouraging opportunistic technology adoption outside planned budget cycles. Some utilities now pursue smaller pilot deployments funded through operating budgets specifically to build the evidence base needed for larger capital requests later.
Market Impact: Expands monitoring scope 30 percent
3 additional market trends, 4 additional growth drivers, and 2 additional restraints and challenges are covered in the full report. Contact sales@marketmindsadvisory.com to access the complete intelligence.

Segment CAGR and Growth Architecture

Substation monitoring systems segment by core technology function, spanning AI-based predictive analytics platforms, partial discharge and dissolved gas sensors, transformer condition monitoring hardware, circuit breaker and switchgear monitoring devices, communication and networking infrastructure, and asset management reporting software, each addressing a genuinely distinct layer of the overall monitoring technology stack that utilities deploy currently.
substation-monitoring-system-market-market-share-analysis-1788677605355

AI-Based Predictive Analytics Platforms

AI-based predictive analytics platforms ingest sensor data streams from transformers, breakers, and switchgear to identify degradation patterns and forecast probable failure timelines before equipment actually fails, a capability that raw sensor dashboards displaying live readings without interpretation cannot provide on their own accord or initiative. Growth reflects utility recognition that sensor hardware alone delivers limited value without software that translates readings into actionable maintenance decisions, alongside expanding regulatory pressure to document proactive asset management practices thoroughly and consistently. Siemens Energy and Hitachi Energy have both expanded machine learning capability within their monitoring software specifically to compete against specialized analytics-only vendors entering the space with venture-backed capital and narrower product focus.
CAGR 15.5%

Partial Discharge and Dissolved Gas Sensors

Partial discharge and dissolved gas sensors detect early-stage insulation degradation inside transformers and switchgear well before the degradation progresses to a point where failure becomes imminent or unavoidable through normal continued operation and ongoing service life expectancy overall. Growth reflects expanding utility recognition that insulation failure represents the leading root cause of unplanned transformer outages, making early detection sensors a foundational monitoring investment ahead of any analytics software layered on top of the underlying hardware itself. GE Vernova and ABB have both expanded dissolved gas sensor product lines specifically to address this foundational demand across aging transformer fleets nearing end of design life across major developed grid networks worldwide today.
CAGR 12.5%
Full segment breakdown across 6 segments available in the complete report.

Regional Architecture and Country Demand Map

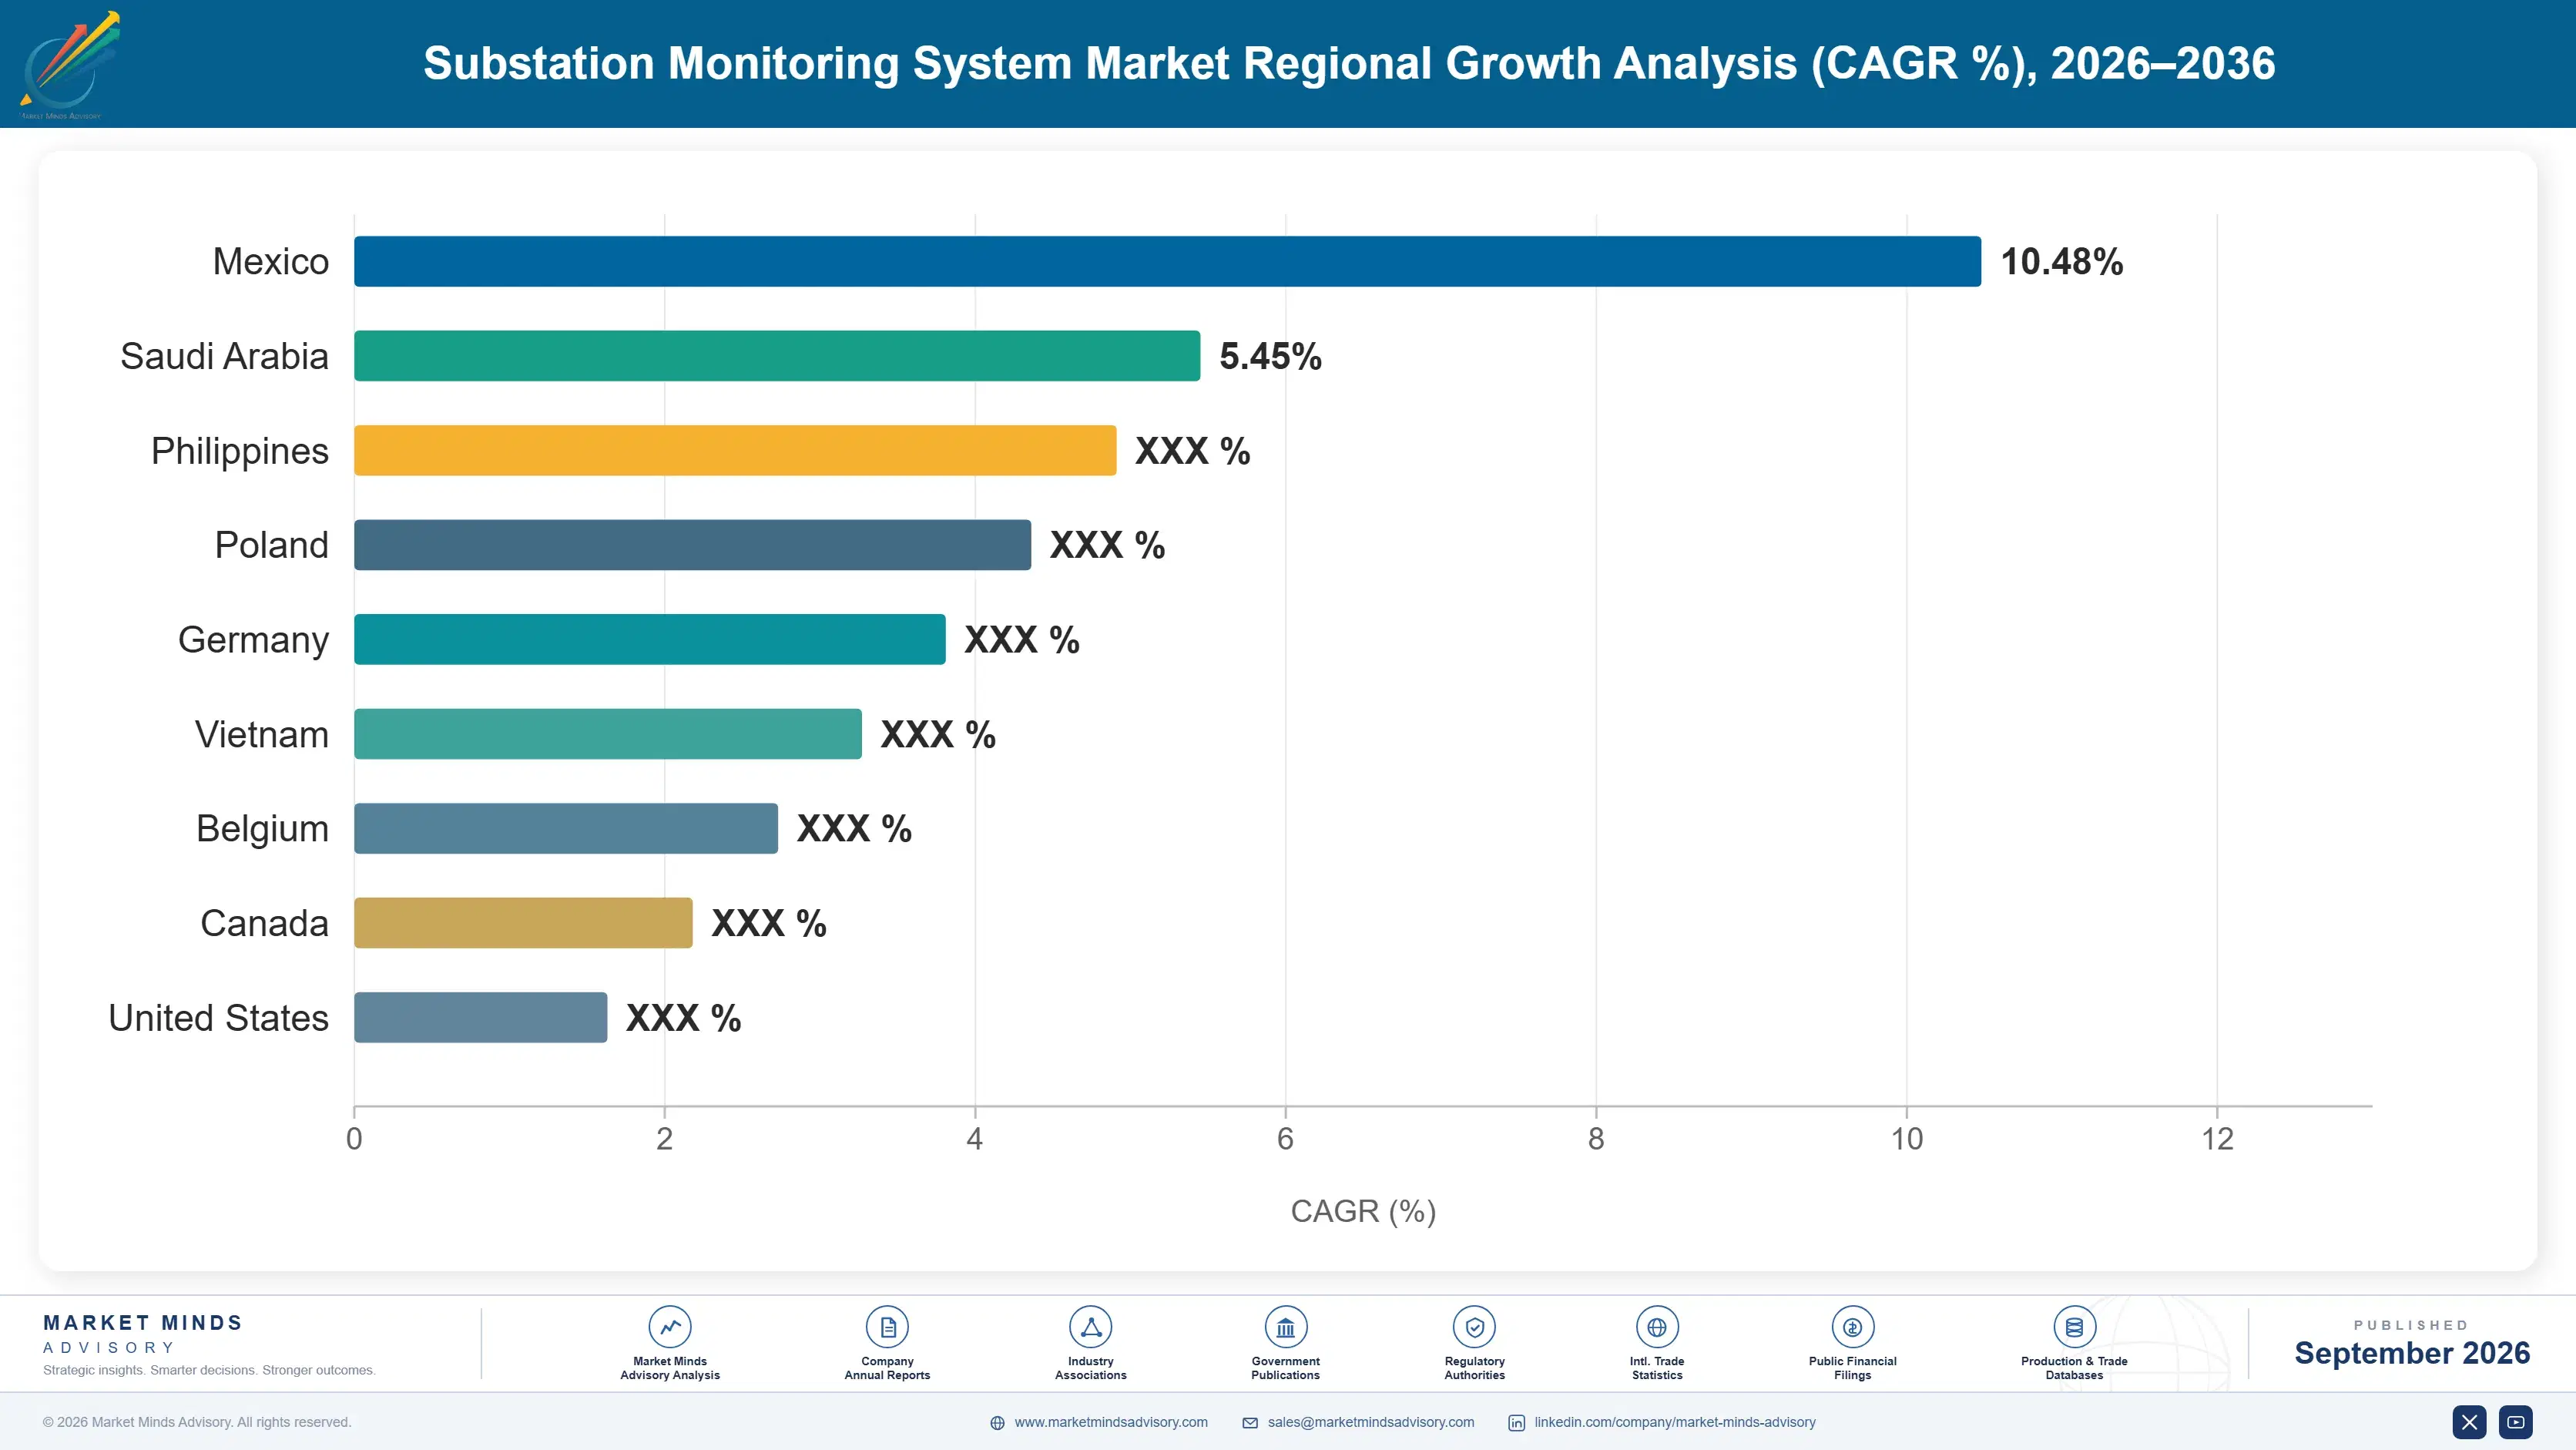
East Asia leads given China's massive state-directed grid infrastructure investment scale, while North America follows closely on aging transformer replacement demand, and South Asia and Pacific posts the fastest regional growth as India rapidly expands its national smart grid modernization programs each and every year.

North America

US utilities operating aging transformer fleets, many exceeding 40 years of service, face mounting pressure from state regulators who increasingly tie utility revenue to measured reliability performance under performance-based rate structures introduced since 2023 across multiple states nationwide. Investor-owned utilities with dedicated grid modernization budgets lead adoption, deploying both retrofit sensors on legacy substations and integrated monitoring on new construction simultaneously across their service territories. Canadian utilities follow similar adoption patterns given closely integrated North American grid interconnection standards and shared vendor relationships across the border. Expanding renewable interconnection across both countries adds further monitoring demand as variable solar and wind generation strains substation equipment designed for steadier historical load patterns decades ago.
Share: 26% | CAGR: 9.0% (2026 to 2036)

Western Europe

German and UK utilities lead regional adoption, driven by aggressive national renewable energy targets that require substantially tighter grid condition visibility than legacy scheduled maintenance programs ever provided under prior regulatory frameworks used for many decades now. European Union grid reliability standards, generally stricter than comparable US requirements, push utilities toward more comprehensive substation monitoring documentation across their entire operating territory and asset base nationwide. French utilities show somewhat slower adoption, reflecting a nuclear-heavy generation mix that historically required less substation-level variability management than wind and solar-heavy grids elsewhere in the region. Manufacturing presence remains modest, with most hardware imported from established Asian and North American suppliers serving the market.
Share: 20% | CAGR: 8.0% (2026 to 2036)
Regional intelligence for 5 additional markets available in the complete report: East Asia, South Asia and Pacific, Latin America, Middle East and Africa, Eastern Europe. Contact sales@marketmindsadvisory.com.
substation-monitoring-system-market-country-cagr-analysis-1788677605883

Analytics Software Margin Expansion Pathways

Substation monitoring vendors capture disproportionate margin not from hardware sensor sales alone but from analytics software subscriptions and long-term service contracts layered directly on top, since utilities increasingly value predictive insight over raw sensor readings that require in-house interpretation and dedicated engineering staff to act upon meaningfully and consistently over multiple annual budget cycles.

Bundling Predictive Analytics Software With Hardware Sensors

Vendors that bundle predictive analytics software subscriptions alongside hardware sensors capture 20 to 30 percent higher total contract value than hardware-only sales, since utilities increasingly refuse to purchase raw sensors without accompanying interpretation software built specifically for their equipment fleet and operating conditions nationwide. This requires deeper software development investment than pure hardware manufacturers typically maintain, creating genuine differentiation opportunity that competitors struggle to replicate quickly without years of investment. Siemens Energy and Hitachi Energy have both expanded analytics software capability specifically to capture this growing higher-margin segment of enterprise utility demand nationwide.
Market Impact: Adds 20 to 30 percent to contract value

Offering Multi-Year Managed Monitoring Service Contracts

Vendors offering multi-year managed monitoring services, where the vendor rather than utility staff manages sensor maintenance and software updates, capture recurring revenue worth 15 to 25 percent more than one-time equipment sales over a comparable contract term length and scope. Utilities facing internal staffing shortages in specialized grid engineering roles increasingly prefer this managed approach over building in-house monitoring expertise from scratch on their own account and budget. GE Vernova has expanded managed service offerings specifically to capture this growing segment of utility demand facing genuine staffing constraints nationwide today.
Market Impact: Adds 15 to 25 percent recurring contract value

Pricing Contracts Against Demonstrated Outage Prevention

Vendors offering outcomes-based pricing, where a portion of contract value ties directly to measured outage reduction, now command 12 to 18 percent higher total contract value than flat subscription pricing alone across most enterprise utility accounts nationwide today. This requires vendors to maintain confidence in their own predictive accuracy, favoring established players with substantial deployment history over newer entrants lacking comparable track records in the field currently. Regulatory pressure tying utility revenue to reliability metrics makes this pricing model increasingly attractive to utility finance teams evaluating vendor proposals directly and carefully.
Market Impact: Adds 12 to 18 percent to contract value

Expanding Into Adjacent Grid Asset Monitoring Categories

Vendors extending core substation monitoring capability into adjacent grid asset categories, including overhead transmission line and distribution transformer monitoring, capture new recurring revenue streams beyond substation-specific hardware sales alone, typically adding 25 to 35 percent to total account revenue once adjacent categories are fully established and scaled across the entire account. This expansion applies existing utility relationships and data integration infrastructure rather than requiring entirely new customer acquisition efforts from scratch each time around. Schneider Electric has pursued this expansion aggressively across distribution-level grid assets beyond core substation accounts nationwide.
Market Impact: Adds 25 to 35 percent to account revenue

Who Controls the Margin Pool

Substation monitoring shows moderate concentration at a cr5 of 48 percent, reflecting a market split between large diversified grid equipment manufacturers and specialized analytics vendors. Siemens Energy and Hitachi Energy lead on combined hardware and software capability, while the gap to challengers like Schneider Electric and GE Vernova has narrowed as analytics software becomes the primary competitive battleground rather than sensor hardware alone.
Current competitive activity centers on bundling predictive analytics software with hardware sensors, since utilities increasingly refuse standalone hardware purchases without accompanying interpretation software. Several vendors have expanded managed monitoring service offerings to address utility staffing shortages in specialized grid engineering roles. Partnership activity between hardware sensor manufacturers and software-focused analytics startups continues, as fewer companies attempt full in-house software development independently given the required capital and talent.

Emerging pressure comes from Chinese manufacturers scaling domestic monitoring hardware production with state backing, threatening to compress Western pricing power in cost-sensitive emerging market deployments. Smaller specialists focused narrowly on partial discharge sensing or specific analytics niches could gain share where incumbents underinvest. Rankings among the top five look reasonably durable through 2030, but the mid-tier analytics-only vendor segment faces genuine consolidation pressure.
substation-monitoring-system-market-company-positioning-matrix-1788677606459

Competitive Moat and Risk Dimensions

SIEMENS ENERGY

Moat: Integrated Grid Equipment Platform

Siemens Energy sells transformers, switchgear, and monitoring systems as an integrated offering, giving it deep installed-base relationships with utilities that pure monitoring vendors lack entirely, since customers already trust Siemens Energy for core grid equipment and naturally extend that relationship into adjacent monitoring services and analytics.
SIEMENS ENERGY

Risk: Software Innovation Pace Lags Startups

Siemens Energy's large diversified organization moves more slowly on software innovation than venture-backed analytics startups focused exclusively on predictive monitoring, potentially ceding the most advanced analytics capability to smaller competitors who iterate faster and are not managing a broader hardware product portfolio simultaneously across multiple business units.
HITACHI ENERGY

Moat: Global Utility Relationship Depth

Hitachi Energy holds decades-long relationships with major utilities across multiple continents, built through sustained grid equipment supply and service contracts that a new monitoring-only entrant attempting global expansion would need many years and considerable capital to approach at comparable scale, trust, and geographic reach worldwide.
HITACHI ENERGY

Risk: Complex Organizational Decision Speed

Hitachi Energy's global scale and complex organizational structure can slow decision-making on emerging monitoring technology investment relative to smaller, more focused analytics competitors who can commit capital and engineering resources to a specific opportunity considerably faster without extensive internal coordination requirements across many business divisions.

Players Tracked

Prominent Players

Siemens Energy
Hitachi Energy
Schneider Electric
GE Vernova
ABB

Other Key Players

Eaton Corporation
Mitsubishi Electric
Toshiba Energy Systems
Doble Engineering
Qualitrol
Kalkitech
OMICRON electronics
Megger Group
Camlin Group
Kries-Energietechnik
Arteche Group
Ormazabal
CG Power and Industrial Solutions
Bharat Heavy Electricals
TE Connectivity

Recent Developments

MARCH 2026

Siemens Energy Launches AI Transformer Health Platform

Siemens Energy introduced a new AI-based transformer health prediction platform combining dissolved gas analysis with machine learning models trained on decades of failure data, extending its monitoring software capability beyond traditional threshold-based alerting into genuine predictive failure timeline forecasting for utility asset management teams nationwide.
Signal: Signals incumbent investment in advanced predictive capability beyond traditional threshold-based alerting systems currently used industry-wide today.
OCTOBER 2025

GE Vernova Acquires Partial Discharge Sensor Startup

GE Vernova acquired a specialized partial discharge sensor startup to add early-stage insulation degradation detection to its existing monitoring portfolio, extending coverage further upstream in the failure timeline before dissolved gas indicators typically become detectable through conventional monitoring approaches used broadly across the entire industry today.
Signal: Signals continued industry consolidation as incumbents acquire specialized early-detection sensor technology capability directly rather than build.
JUNE 2025

Schneider Electric Signs Managed Service Agreement With Utility

Schneider Electric signed a multi-year managed monitoring service agreement with a major US investor-owned utility covering sensor maintenance and software updates across the utility's entire substation fleet, addressing internal staffing shortages in specialized grid engineering roles that the utility had long struggled to fill internally.
Signal: Signals growing utility preference for managed monitoring services over building in-house technical expertise internally over time.

Sensor Electronics and Copper Costs

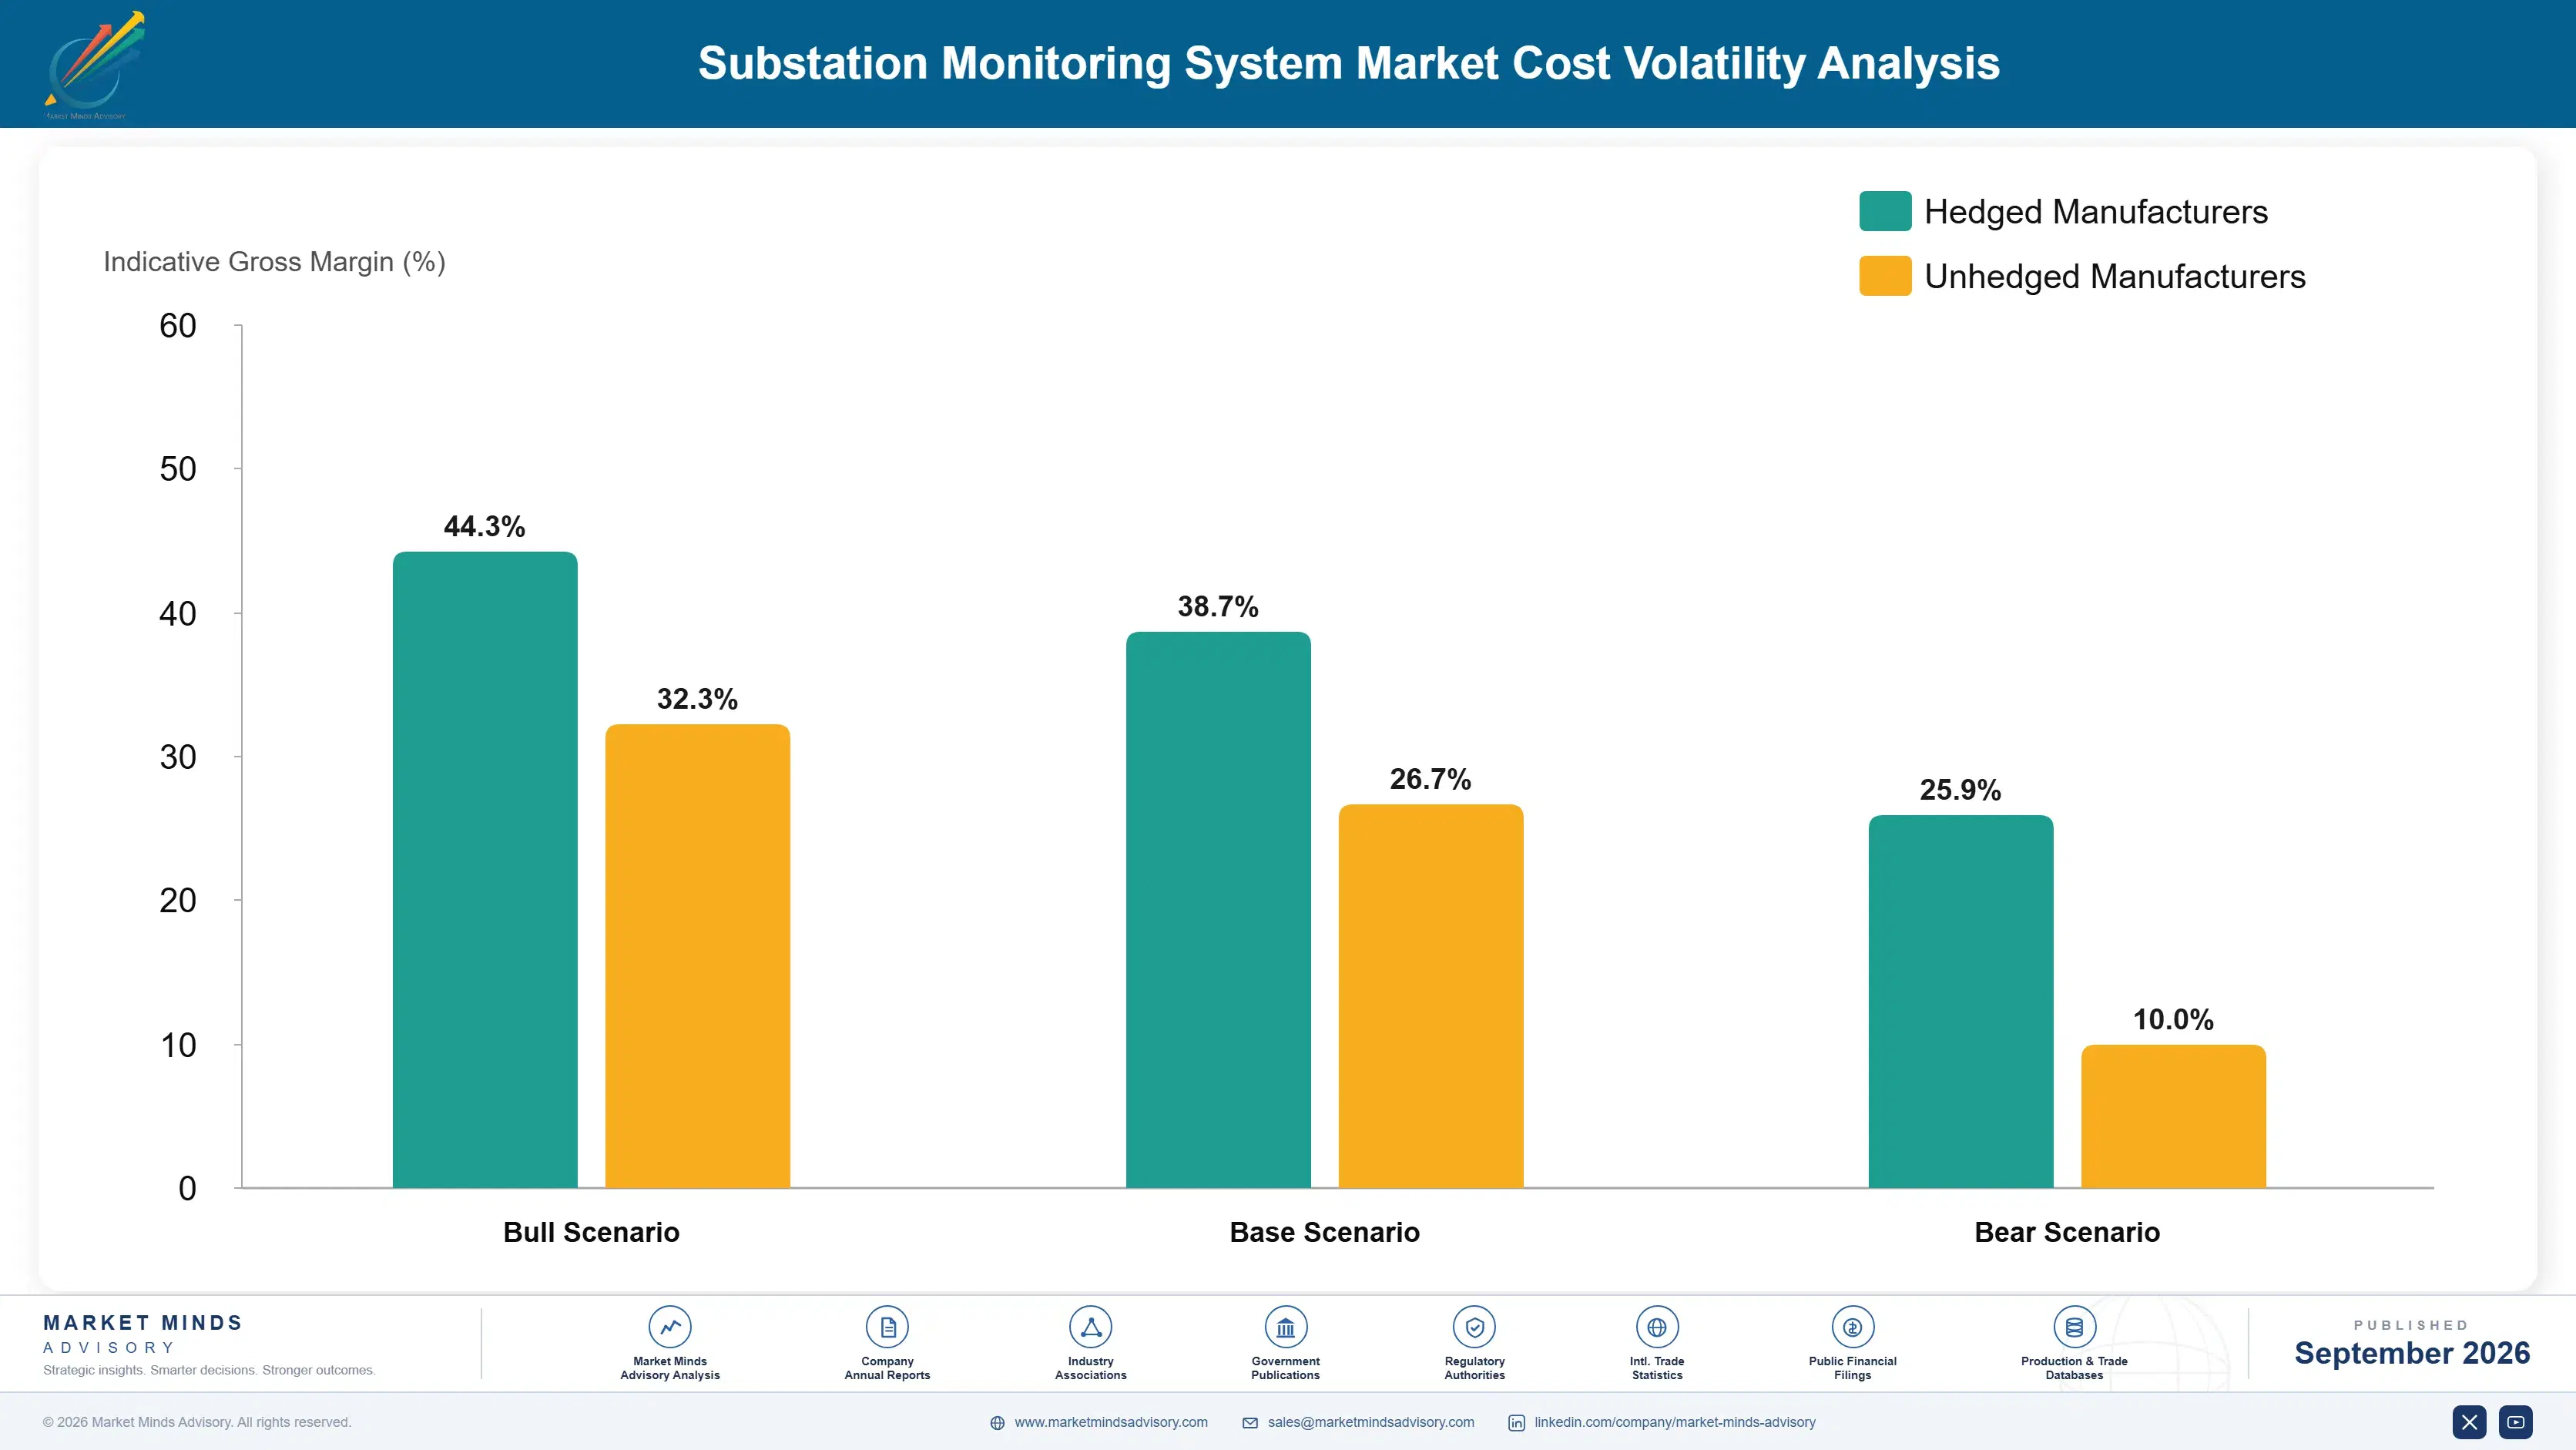
Sensor electronics and copper wiring components together account for roughly 35 to 40 percent of monitoring system cost of goods sold, sourced from a concentrated group of semiconductor and metal component suppliers based primarily in East Asia, with copper pricing tracking global commodity markets directly and immediately across the entire electrical equipment supply chain worldwide.
Copper prices spiked sharply during 2021 and 2022 as global infrastructure spending and renewable energy buildout simultaneously increased demand across multiple competing end markets, according to IEA energy transition reporting tracking critical material demand growth. This pricing pressure raised monitoring hardware costs meaningfully at a time when utilities were simultaneously being asked to expand monitoring deployment, creating budget tension between rising input costs and expanding coverage requirements.

Smaller monitoring vendors lacking long-term component supply agreements face higher input cost volatility than diversified equipment manufacturers like Siemens Energy, which purchase copper and electronic components at much larger consolidated volumes across their broader product portfolio. This gives larger vendors a durable cost advantage on hardware manufacturing specifically, even though software development costs scale similarly across vendors of nearly any size in the category.
substation-monitoring-system-market-cost-volatility-analysis-1788677606656

Diversifying Component Supplier Relationships

Vendors increasingly qualify multiple electronic component suppliers across different geographies to reduce dependence on any single source, accepting modestly higher per-unit costs during qualification in exchange for reduced exposure to future supply disruption or single-supplier constraint events affecting production continuity and delivery reliability across the entire account base and long-term customer relationship going forward.

Hedging Copper Price Exposure Contractually

Larger vendors increasingly hedge copper price exposure through forward purchasing contracts negotiated directly with metal suppliers, trading some pricing flexibility for predictable input costs that protect margin during periods of commodity price volatility affecting the broader electrical equipment manufacturing sector and its many direct competitors nationwide and internationally each and every single fiscal year.

Reducing Copper Content Through Design Changes

Vendors are redesigning sensor housings and wiring architecture to reduce copper content per unit, trading modest upfront engineering investment for meaningfully lower long-term material cost exposure that becomes considerably more valuable as copper prices continue trending upward gradually over the coming years and decades still further ahead of most current industry cost projections available today.

Portfolio Architecture for Margin Defence

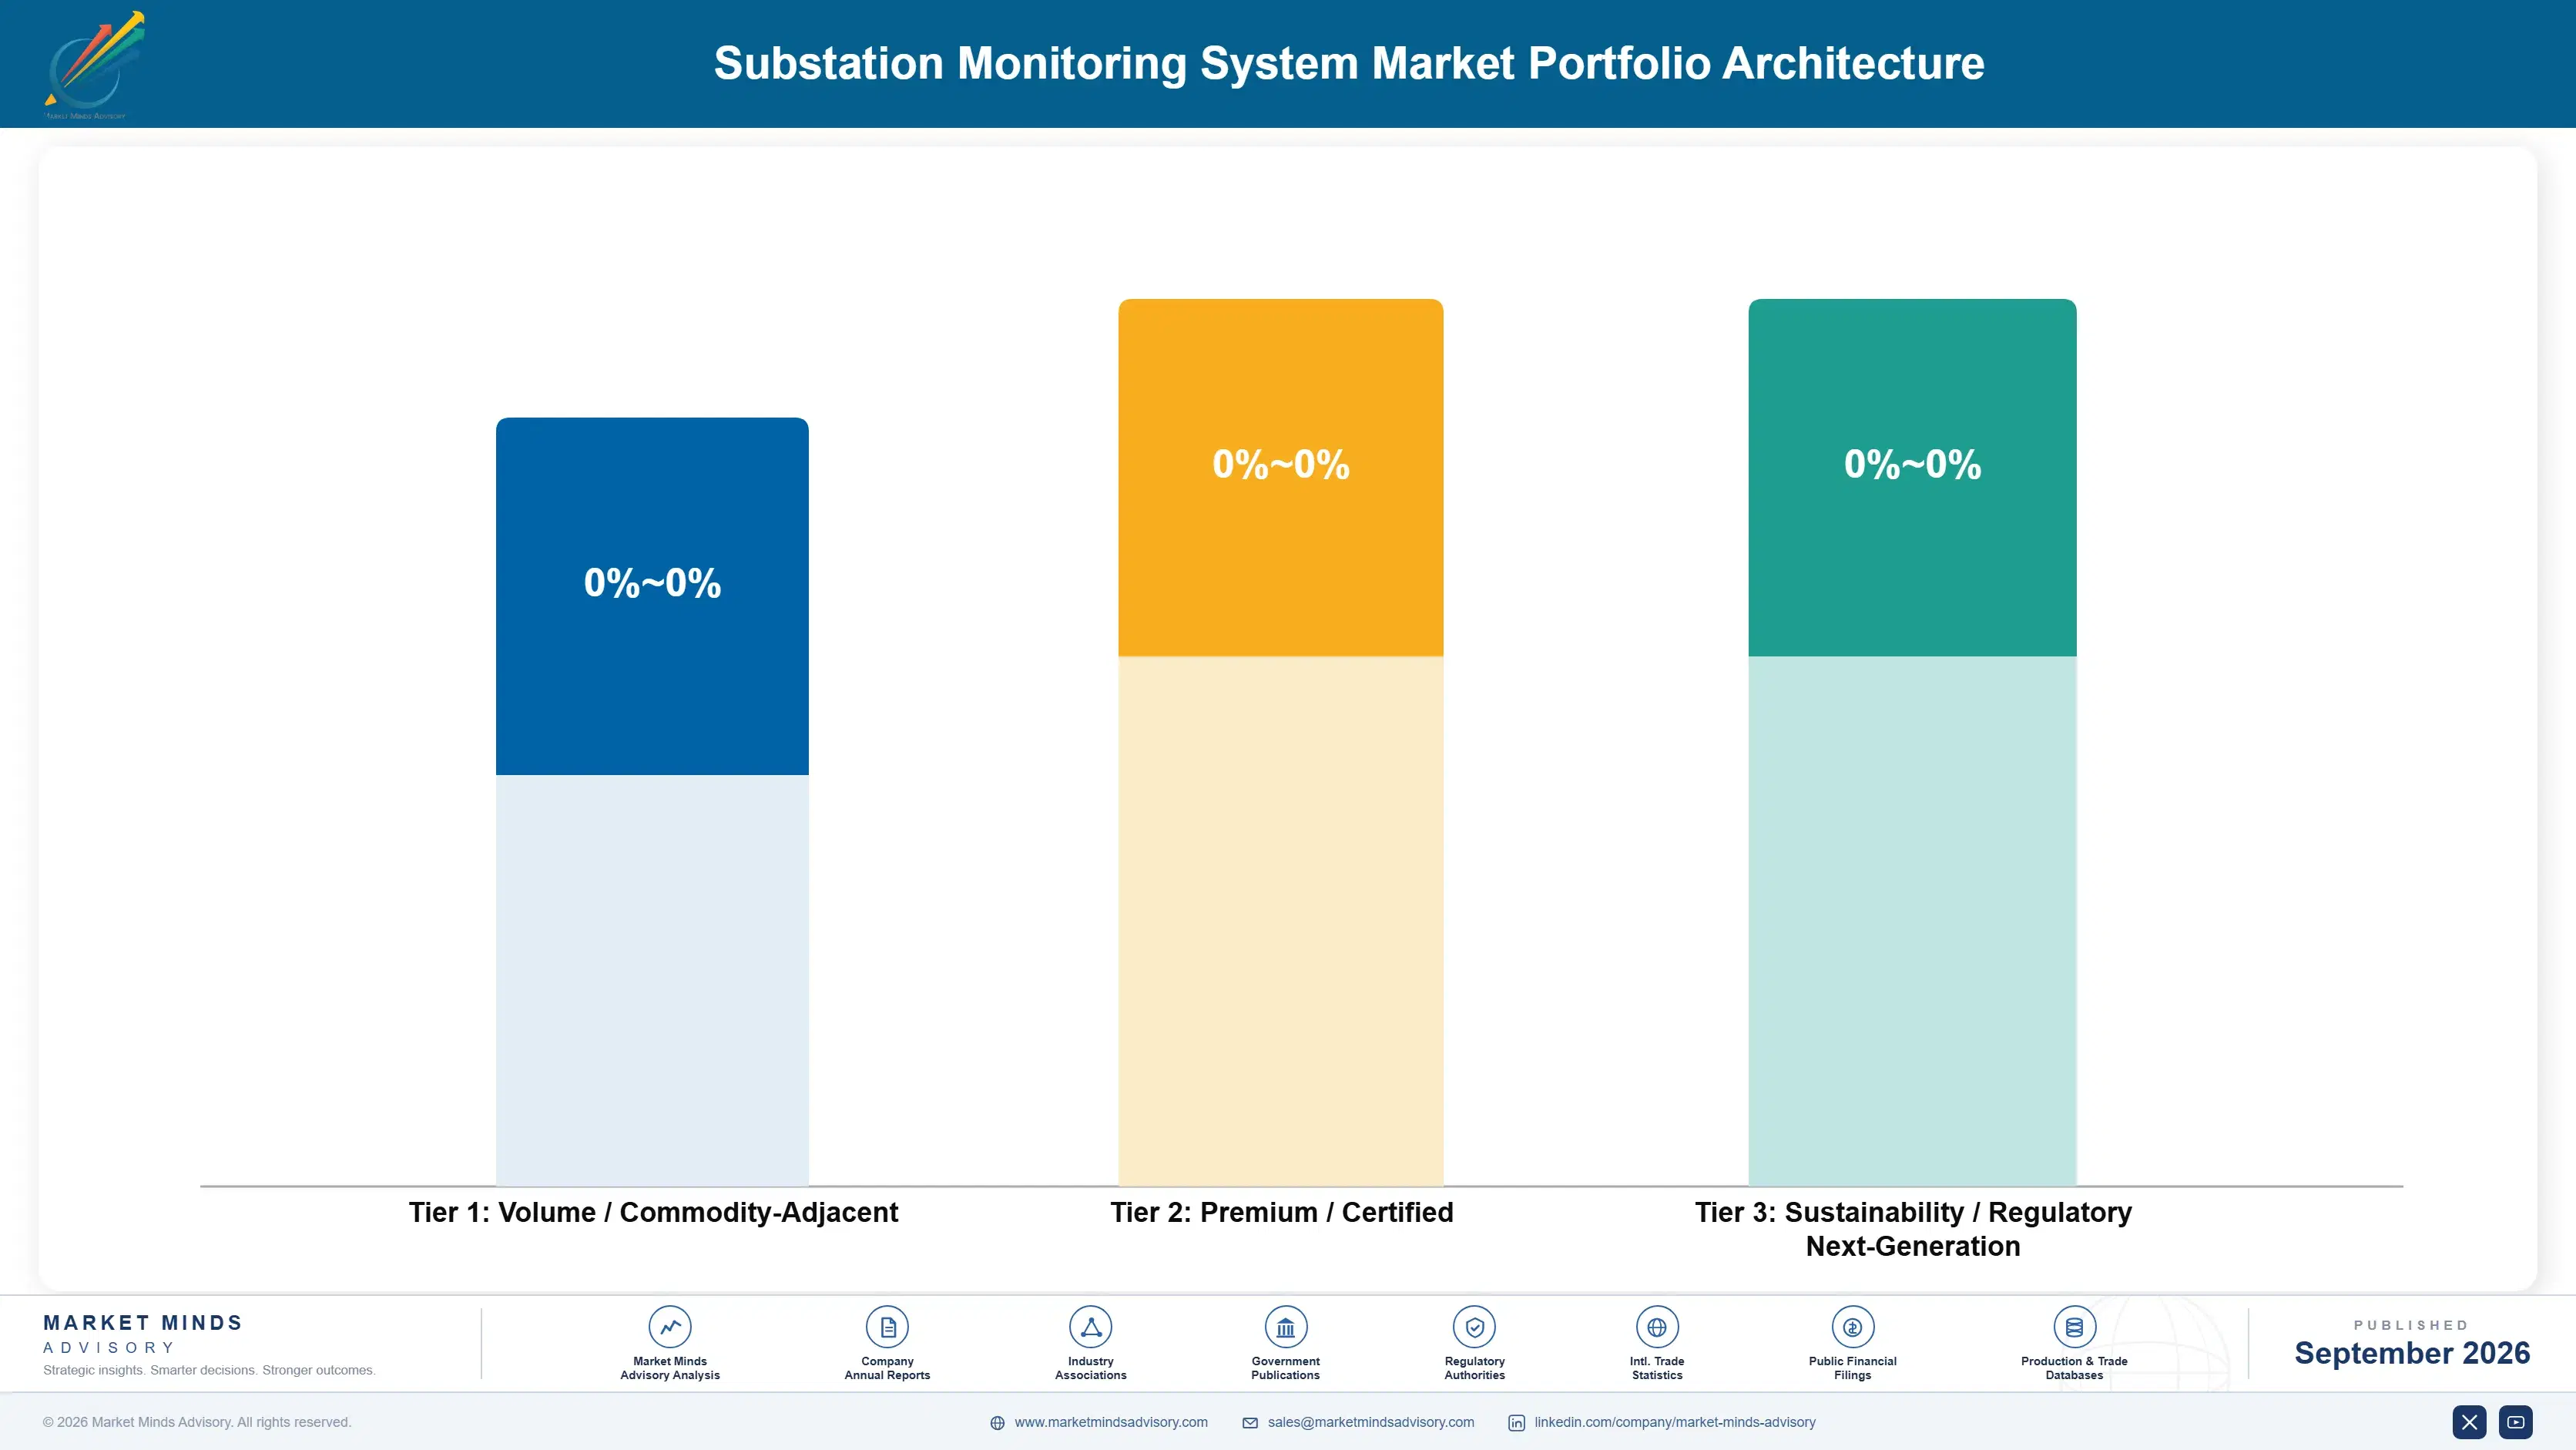
Substation monitoring vendors operate across three margin tiers, from commodity hardware sensors sold at volume with thin margin to premium AI-based analytics platforms commanding substantially better economics. Tier separation reflects software sophistication and predictive accuracy depth rather than raw hardware component cost differences alone, since a basic sensor and a fully integrated analytics platform can share similar underlying sensing technology at the component level.
Volume tension is sharpest in commodity hardware sensors, where utility procurement teams push relentlessly for lower per-unit pricing given the sheer number of substations requiring instrumentation across a large service territory. Utilities purchasing analytics software behave oppositely, valuing predictive accuracy and demonstrated outage prevention over unit price, which is why the highest-value revenue pools concentrate in software subscriptions rather than hardware sensor sales.

Managed monitoring services, where vendors rather than utility staff maintain sensors and interpret data, sit between these extremes: growing quickly but priced closer to hardware than premium analytics licensing alone, since service-based buyers remain more cost-conscious than pure software buyers evaluating predictive accuracy claims. Vendors positioned across all three tiers simultaneously capture the broadest addressable revenue base, though few manage the operational complexity of serving such differently motivated utility buyer segments well.

Volume / Commodity-Adjacent

Standardized hardware sensors and basic monitoring dashboards sold at volume to utilities with minimal analytics or interpretation capability included in the base product offering itself at initial purchase time and installation.
Gross Margin: 22 to 30%

Premium / Certified

AI-based predictive analytics platforms requiring extensive software development, machine learning model training, and demonstrated predictive accuracy justifying substantially higher enterprise pricing than hardware alone could ever command in the broader market.
Gross Margin: 42 to 52%

Sustainability / Regulatory / Next-Generation

Managed monitoring services and renewable interconnection compliance tools serving regulatory-driven demand at margins between commodity hardware and premium analytics tiers, growing steadily as utility staffing constraints continue to expand nationwide.
Gross Margin: 35 to 45%
substation-monitoring-system-market-portfolio-architecture-1788677607164

High-value Sub-segments and Strategic Watch-out

AI-Based Predictive Analytics Platforms

AI-based predictive analytics platforms combine high growth with premium software pricing, representing the clearest high-value high-growth opportunity as utilities move steadily beyond raw sensor data toward genuine predictive maintenance capability tied directly to regulatory reliability requirements, penalty avoidance strategies, and long-term asset planning pursued aggressively nationwide.
Gross Margin: high

Managed Monitoring Service Contracts

Managed monitoring service contracts combine strong margins with steady growth tied to utility staffing shortages, representing a high-value moderate-growth pool anchored by multi-year recurring revenue rather than one-time hardware sales alone, improving revenue predictability considerably for vendors managing large enterprise utility accounts across many different service territories.
Gross Margin: high

Commodity Hardware Sensor Sales

Standardized hardware sensors form the volume core of the market, generating steady revenue at compressed margins as utilities negotiate aggressively on price given the sheer number of substations requiring instrumentation across their entire fleet nationwide each and every single year without any meaningful exception whatsoever.
Gross Margin: moderate

Chinese Manufacturer Price Competition

Chinese manufacturers scaling domestic monitoring hardware production with state backing represent the clearest strategic watch-out, since rapidly expanding local capacity threatens to compress Western pricing power in cost-sensitive emerging market deployments over the coming decade steadily, considerably, and increasingly across nearly every regional market worldwide.
Gross Margin: uncertain

Recurring Analytics Subscription Economics

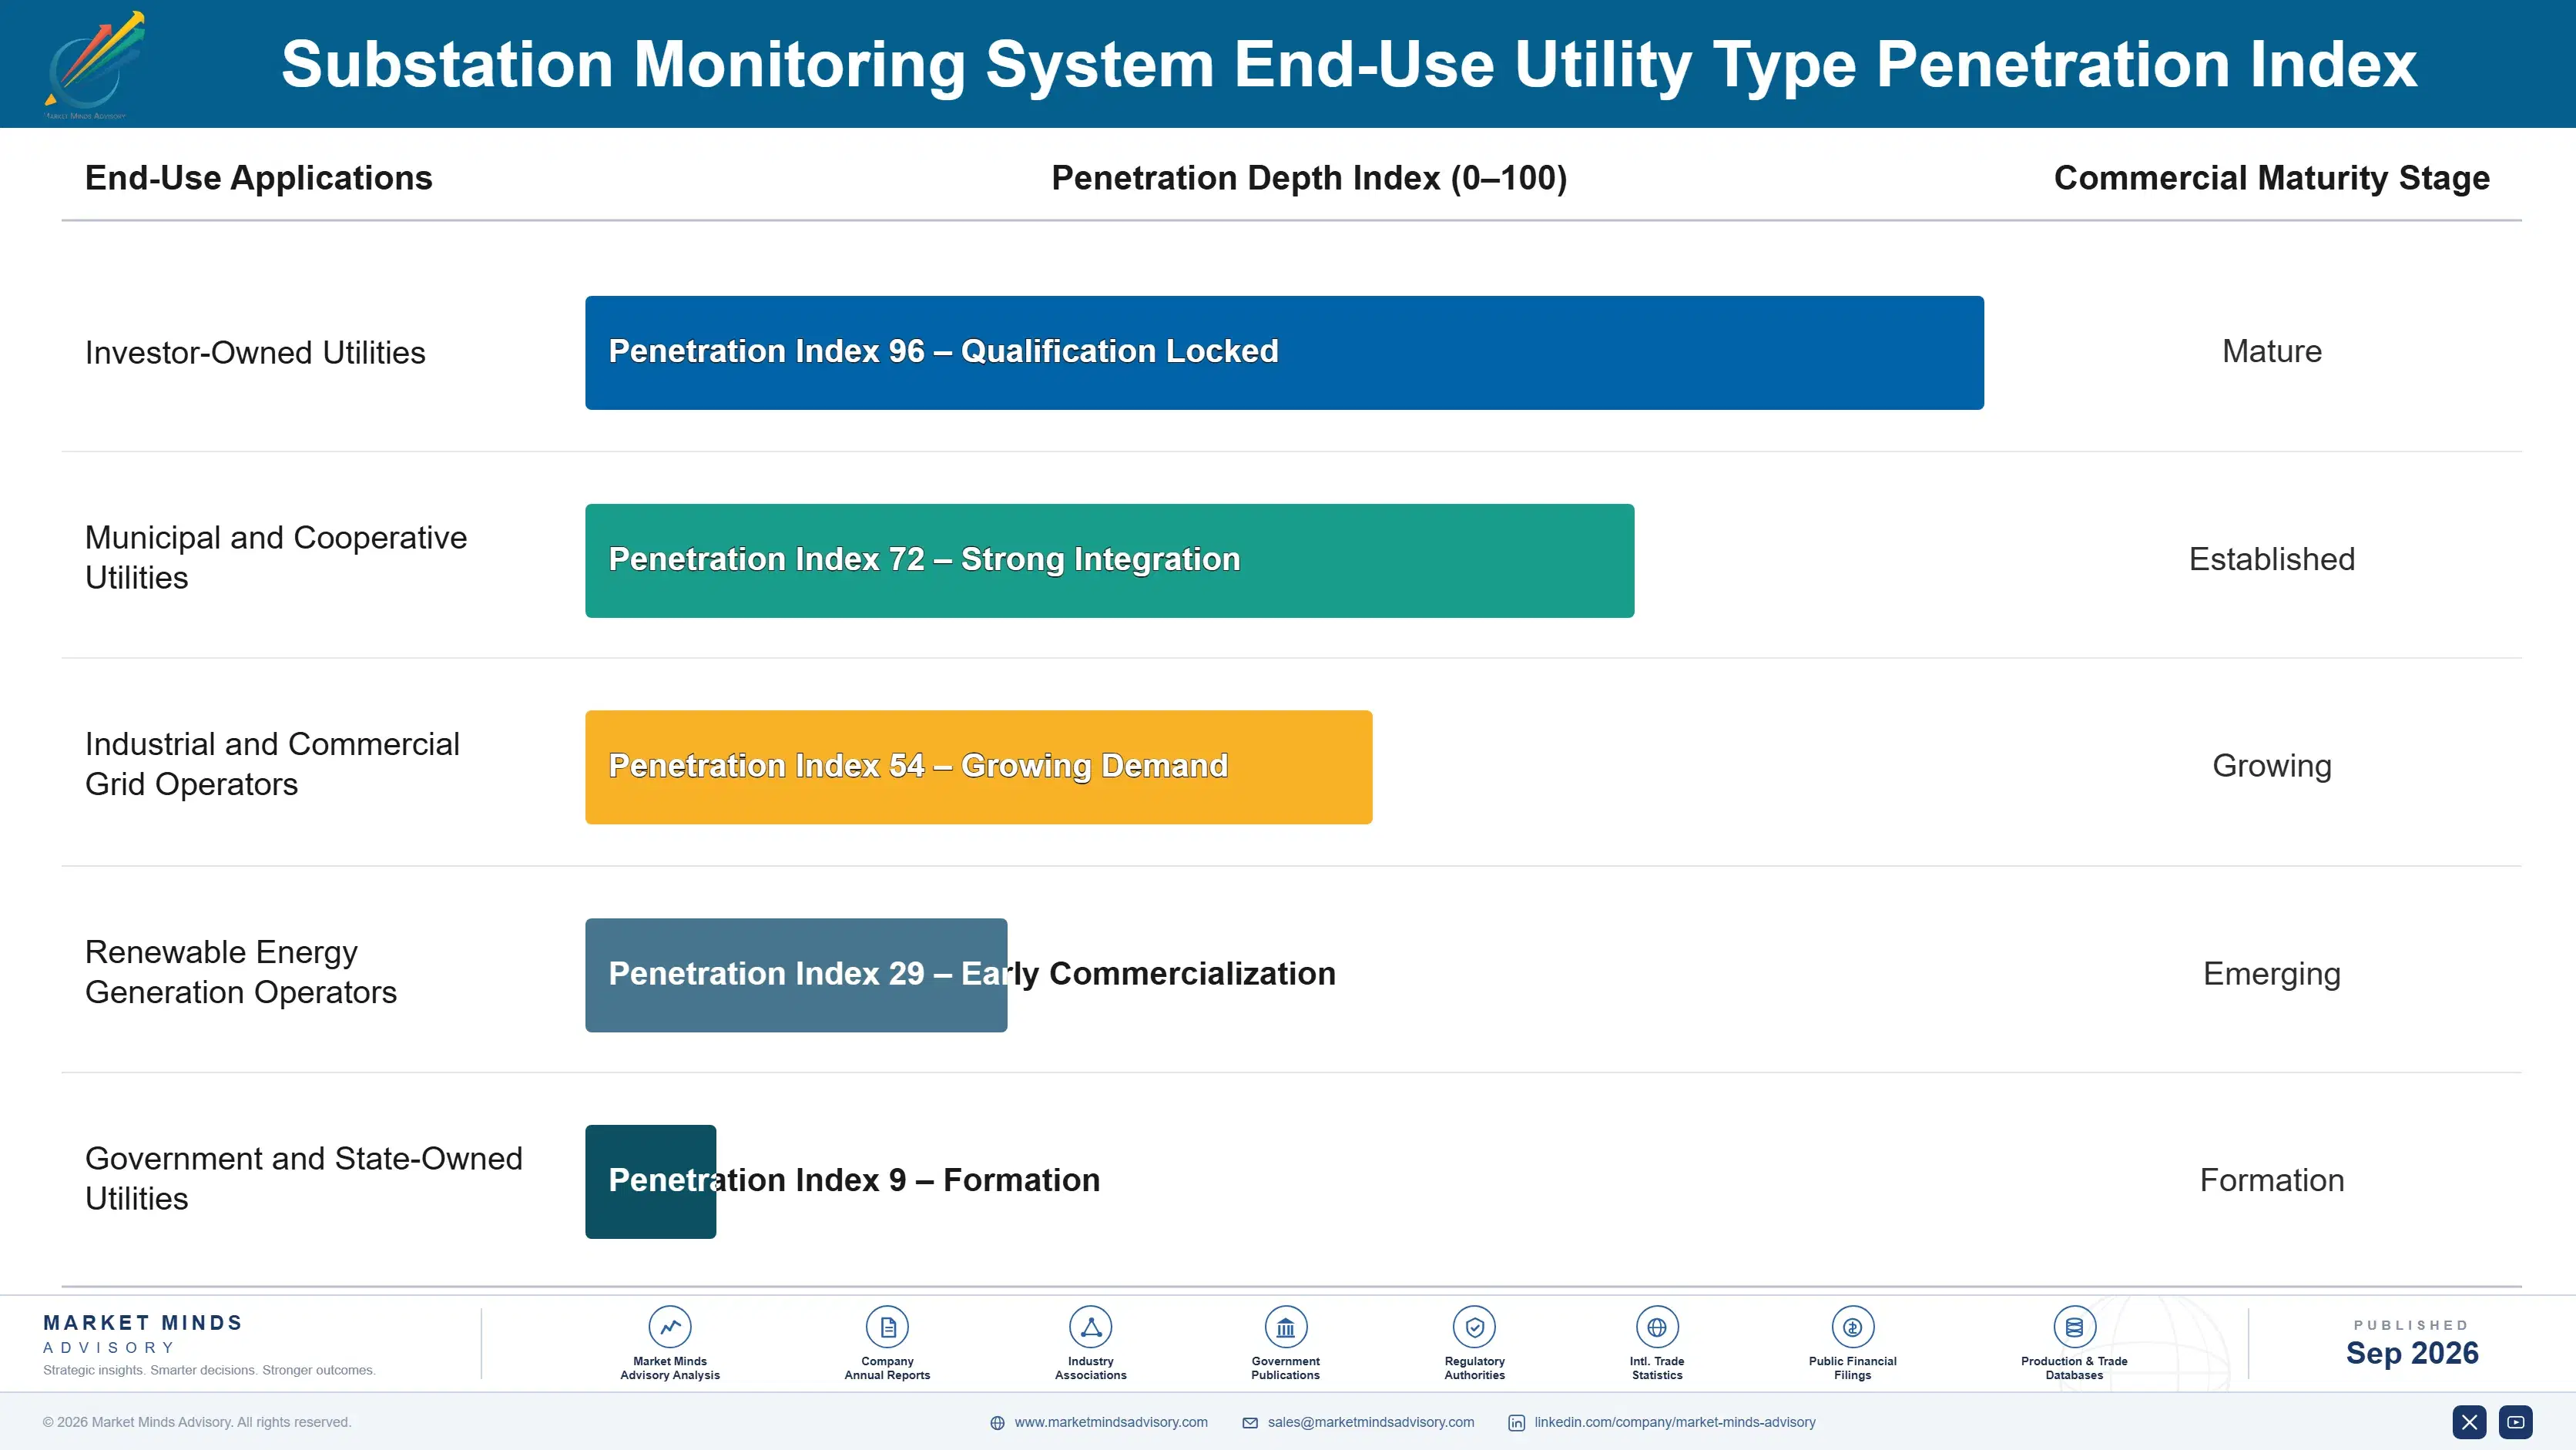
Substation monitoring generates meaningful annuity revenue through multi-year analytics software subscriptions, since utilities that build maintenance planning processes around predictive alerts face real switching costs when considering an alternate vendor mid-contract term. Vendors that demonstrate measurable outage prevention within the first contract term convert this into multi-year renewals worth considerably more than the initial hardware sale alone across the account relationship.
Adoption stickiness varies sharply by end-use vertical. Large investor-owned utilities show the deepest engagement, integrating monitoring analytics into broader grid asset management systems that make switching costly and operationally disruptive across their entire operation. Smaller municipal and cooperative utilities show markedly shallower adoption, often limited to basic sensor deployment without the analytics software layer that requires dedicated technical staff to interpret and act upon effectively over time.

Buyer profiles are shifting generationally as data-focused grid engineers, rather than traditional maintenance planners, increasingly drive monitoring investment decisions, prioritizing predictive analytics accuracy over the simple threshold-alerting systems that dominated substation monitoring a decade ago and earlier. This generational shift favors vendors offering genuine machine learning capability over vendors whose value proposition rests primarily on basic sensor hardware and static alarm thresholds from an earlier era.
substation-monitoring-system-market-end-use-penetration-index-1788677607652

Where MMA Sees the Opportunity

These are among the four positions where our research anticipates prominent divergence between winners and laggards over the coming forecast period. Each is grounded in the demand model, the regulatory perimeter, and the announced capacity pipeline.
01 / ANALYTICS SOFTWARE STRATEGY

Build predictive analytics capability ahead of hardware-only rivals

Utilities increasingly refuse standalone hardware purchases without accompanying interpretation software, so vendors clinging to hardware-only value propositions will lose contracts to competitors offering genuine predictive maintenance capability built directly into their platform. Building this capability requires software development investment that most pure hardware manufacturers currently lack, meaning vendors should start now rather than waiting for utilities to demand it during a competitive procurement cycle already well underway. This is the single clearest differentiator separating winners from laggards over the coming decade of industry consolidation.
02 / REGULATORY RELIABILITY POSITIONING

Position monitoring investment around penalty avoidance economics

Performance-based rate structures introduced since 2023 now tie utility revenue directly to measured outage duration, creating financial incentive that utilities previously lacked to invest proactively in substation condition monitoring across their entire fleet. Vendors that frame monitoring investment explicitly around penalty avoidance economics, rather than generic reliability improvement, win budget approval faster since finance teams can quantify the return more concretely against actual regulatory exposure and risk. This framing shift matters more than most vendors currently recognize within their broader sales approach and messaging.
03 / INDIA MARKET ENTRY TIMING

Enter the Indian market now ahead of full-scale competition

India is growing at 16.5 percent annually as government-directed grid modernization investment accelerates, yet the competitive field remains considerably less crowded than in North America or Western Europe where established relationships already favor entrenched incumbents heavily and durably. Vendors that establish local partnerships and manufacturing presence now secure preferred positioning before the market fully matures and international competitors arrive at genuine scale nationwide. This window will not stay open indefinitely as global vendors increasingly recognize India's growth trajectory clearly and act accordingly.
04 / CHINESE COMPETITIVE RESPONSE

Prepare for Chinese price competition in commodity hardware sensors

Chinese manufacturers are scaling domestic monitoring hardware production with substantial state backing, and this pricing pressure will land hardest on standardized commodity sensors where technical differentiation between competing suppliers is thinnest today across most markets. Western vendors should shift commodity-tier hardware production toward automation to defend margin, while concentrating genuine differentiation investment in analytics software and managed services where Chinese suppliers currently lack meaningful qualification history or track record. Waiting for pricing pressure to fully materialize before acting will already be too late.

Engagement Snapshot From the Field

A live engagement with an industry participant carrying material or product regulatory and market exposure ahead of a defining policy shift, showing how our research translates into a defensible multi-year portfolio strategy.
MARKET MINDS ADVISORY · CLIENT ENGAGEMENT SUMMARY
Substation Monitoring System Producer Strategic Portfolio Review and Transition Roadmap 2026·Investment Scenario on Substation Monitoring System Exposure Evaluation 2025-26
CLIENT PROFILE
The client is a mid-sized US regional electric utility serving approximately 650,000 customers, operating a substation fleet with an average transformer age of 35 years (client-reported, unverified by MMA). The utility faced a new state performance-based rate structure tying revenue to outage duration metrics and needed to evaluate monitoring investment priorities across its aging infrastructure.
STRATEGIC CHALLENGE
Leadership needed an independent assessment of which substations to prioritize for monitoring investment first, given limited capital budget and uncertainty about which equipment posed the greatest near-term failure risk. Internal engineering estimates of failure probability varied widely across departments, with no consensus on total multi-year investment requirements or realistic payback timelines.
MMA APPROACH
MMA conducted a comparative risk assessment across the utility's substation fleet, correlating existing maintenance records and equipment age data against industry failure rate benchmarks to identify the highest-risk installations across the network. The engagement included interviews with three monitoring vendors and modeling of realistic payback timelines under two different rollout sequencing scenarios.
KEY FINDINGS
  1. Twelve substations, representing 18 percent of the fleet, accounted for a disproportionate share of projected failure risk based on age and maintenance history (client-reported, unverified by MMA).
  2. Prioritized monitoring deployment at these twelve substations was projected to reduce overall fleet outage risk exposure by roughly 40 percent within three years.
  3. Vendor analytics accuracy varied meaningfully across the three evaluated suppliers, with only one demonstrating validated predictive performance on comparable utility fleets previously.
  4. The utility's existing maintenance record-keeping had significant data quality gaps that would need remediation before analytics platforms could function at full effectiveness.
CLIENT PROFILE
The client is a mid-sized US regional electric utility serving approximately 650,000 customers, operating a substation fleet with an average transformer age of 35 years (client-reported, unverified by MMA). The utility faced a new state performance-based rate structure tying revenue to outage duration metrics and needed to evaluate monitoring investment priorities across its aging infrastructure.
STRATEGIC CHALLENGE
Leadership needed an independent assessment of which substations to prioritize for monitoring investment first, given limited capital budget and uncertainty about which equipment posed the greatest near-term failure risk. Internal engineering estimates of failure probability varied widely across departments, with no consensus on total multi-year investment requirements or realistic payback timelines.
MMA APPROACH
MMA conducted a comparative risk assessment across the utility's substation fleet, correlating existing maintenance records and equipment age data against industry failure rate benchmarks to identify the highest-risk installations across the network. The engagement included interviews with three monitoring vendors and modeling of realistic payback timelines under two different rollout sequencing scenarios.
KEY FINDINGS
  1. Twelve substations, representing 18 percent of the fleet, accounted for a disproportionate share of projected failure risk based on age and maintenance history (client-reported, unverified by MMA).
  2. Prioritized monitoring deployment at these twelve substations was projected to reduce overall fleet outage risk exposure by roughly 40 percent within three years.
  3. Vendor analytics accuracy varied meaningfully across the three evaluated suppliers, with only one demonstrating validated predictive performance on comparable utility fleets previously.
  4. The utility's existing maintenance record-keeping had significant data quality gaps that would need remediation before analytics platforms could function at full effectiveness.
RECOMMENDED STRATEGY
Phase 1: Phase one: deploy monitoring hardware and analytics software at the twelve highest-risk substations within the first twelve months of the new program. Phase 2: Phase two: remediate maintenance record data quality gaps while simultaneously expanding monitoring to the next risk tier of identified substations. Phase 3: Phase three: integrate validated analytics platform findings into the utility's formal multi-year capital planning and budgeting process going forward each year.
OUTCOME
The utility approved the phased monitoring rollout and began deployment at the highest-risk substations within two months of the engagement's conclusion (client-reported, unverified by MMA). Early outage risk reduction results from the deployment were not yet available for independent verification at the time of publication.

Frequently Asked Questions

Foundational context covering the market sizes, CAGR, scope, country, region and competition that inform every finding below. This section is provided to cover basics and most often pre-purchase conversations, answered from the MMA Primary Research Dataset.

What is the current size of the Substation Monitoring System Market?

The global substation monitoring system market is valued at 3.2 billion dollars in 2025, the report's base year. This reflects spending on sensors, communication infrastructure, and analytics software combined across all utility deployments.

How large will the Substation Monitoring System Market be by 2036?

MMA projects the market will reach 8.67 billion dollars by 2036, a 2.48 times expansion from 2026's forecast value. Growth is driven mainly by aging transformer replacement and renewable interconnection demand.

What is the CAGR for the Substation Monitoring System Market 2026 to 2036?

The market is forecast to grow at a 9.5 percent compound annual rate between 2026 and 2036. Bull and bear scenarios range from 10.7 percent to 8.3 percent depending on utility capital budget cycles.

Which segment is growing fastest?

AI-based predictive analytics platforms lead at a 15.5 percent CAGR, roughly 1.63 times the overall market rate. Demand is driven by utilities moving beyond raw sensor data toward genuine predictive maintenance.

Who are the major companies in the Substation Monitoring System Market?

Siemens Energy, Hitachi Energy, Schneider Electric, GE Vernova, and ABB lead the market on combined hardware and analytics software capability. Together they hold a combined cr5 of 48 percent.

Which country is growing fastest?

India leads at a 16.5 percent forecast CAGR, driven by massive government-directed grid modernization investment under national smart grid mission programs. This outpaces the broader South Asia and Pacific regional average.

Report Segmentation Architecture

The full report scope spans multiple orthogonal segmentation dimensions, with cross-tabulated demand data provided for each dimension pair. Coverage extends further to regional breakdowns, trend trajectories, and the competitive detail needed to support segment-level decision-making.

By Monitoring Technology

  • AI-Based Predictive Analytics Platforms
  • Partial Discharge and Dissolved Gas Sensors
  • Transformer Condition Monitoring Hardware
  • Circuit Breaker and Switchgear Monitoring Devices
  • Communication and Networking Infrastructure
  • Asset Management Reporting Software

By End-Use Utility Type

  • Investor-Owned Utilities
  • Municipal and Cooperative Utilities
  • Industrial and Commercial Grid Operators
  • Renewable Energy Generation Operators
  • Government and State-Owned Utilities

By Commercial Dimension

  • Direct Utility Purchase
  • Managed Monitoring Service Contracts
  • System Integrator Channel
  • Original Equipment Manufacturer Bundled Sales

By Region

  • North America
  • Western Europe
  • East Asia
  • South Asia and Pacific
  • Latin America
  • Middle East and Africa
  • Eastern Europe

Scope, Methodology, and Coverage

Every figure in this report is reproducible from documented input assumptions. The scope below maps the historical period, the forecast horizon, the segmentation dimensions, and the countries covered, alongside the underlying primary and qualitative methodology.
Historical Period
2020 to 2025
Forecast Period
2026 to 2036
Base Year
2025 (USD billions; MMA Primary Research Dataset, September 2026)
Market Definition
This market covers hardware sensors, communication infrastructure, and analytics software used to monitor the operational condition of electrical substations, including transformers, circuit breakers, and switchgear. It excludes the substation equipment itself, such as transformers and breakers, and broader grid management software not specifically focused on substation asset condition monitoring.
Quantitative Units
USD billions (current prices); per-substation deployment cost where applicable
Segmentation Dimensions
By Monitoring Technology; By End-Use Utility Type; By Commercial Dimension; By Region
Regions Covered
North America, Western Europe, East Asia, South Asia and Pacific, Latin America, Middle East and Africa, Eastern Europe
Countries Covered
USA, China, Germany, France, UK, Japan, South Korea, India, Australia, Canada, Brazil, Mexico, Indonesia, Vietnam, Thailand, Malaysia, UAE, Saudi Arabia, South Africa, Nigeria, Turkey, Poland, Netherlands, Italy, Spain, Sweden, Switzerland, Argentina, Colombia, Singapore, and additional markets relevant to this sector
Key Companies Profiled
Siemens Energy, Hitachi Energy, Schneider Electric, GE Vernova, ABB, Eaton Corporation, Mitsubishi Electric, Toshiba Energy Systems, Doble Engineering, Qualitrol, Kalkitech, OMICRON electronics, Megger Group, Camlin Group, Kries-Energietechnik, Arteche Group, Ormazabal, CG Power and Industrial Solutions, Bharat Heavy Electricals, TE Connectivity
Quantitative Methodology
Primary survey, n=3,800 respondents, Q4 2025, six countries; demand-side model with trade association cross-validation
Qualitative Methodology
47 expert interviews, Q4 2025; applied to validate demand model assumptions, identify emerging dynamics, and assess competitive positioning
Report Format
PDF and XLSX data workbook (Word format preview document)
Publisher
Market Minds Advisory
Report Code
MMA-2026-ENE-133
Published
September 2026
Contact
sales@marketmindsadvisory.com | www.marketmindsadvisory.com

Purchase the full Substation Monitoring System Market Report (2026 to 2036).

The full report delivers a comprehensive assessment of the global substation monitoring system market across monitoring technology, end-use utility type, and commercial channel dimensions through 2036. It includes detailed competitive profiles of twenty companies, seven regional demand analyses, and input cost risk modeling tied to sensor electronics and copper supply chains. Analysts receive segment-level CAGR forecasts, portfolio margin benchmarking, and a strategic verdict section identifying where near-term investment should concentrate. The report also includes an anonymized client case study illustrating real-world monitoring prioritization strategy decisions.
Seven-region demand and CAGR growth forecasts
Twenty-company competitive profiling and moat analysis
Six-dimension segmentation with detailed growth rates
Sensor electronics input cost risk modeling
Portfolio margin tier benchmarking analysis framework
Anonymized client monitoring prioritization case study

Built For The People Who Decide

From boardroom strategy to bench-side execution, this report is read cover-to-cover by leaders shaping the next decade of their industry, turning demand scenarios, market dynamics and valuation benchmarks into decisions.
CXOs/ Presidents/ VPs/ Managers
M&A and Corporate Development
Strategy Teams and R&D Heads
Procurement and Product Directors
Regulatory and Compliance Leaders
Investor Relations and Equity Analysts