Market Minds Advisory
Submarine Communication Cables Market

Submarine Communication Cables Market: Submarine Communication Cables Market: Wet Plant, Marine Installation and Terminal Equipment, 2026 to 2036

A route can be funded, permitted and fully surveyed and still wait nearly two years for a ship. The binding constraint in this industry is a small ageing fleet, not manufacturing capacity.

Lead Analyst

Published

September 2026

Make Smarter Decisions with Customized Research Insights

Request a free sample report and evaluate market opportunities, growth trends, and competitive dynamics relevant to your business needs.

2025 MARKET VALUE$4.6BMarket Size 2025
2036 FORECAST VALUE$12.3BBase Case , 2026 to 2036
CAGR 2026 TO 20369.4 %Bull 10.7% / Bear 8.2%
INCREMENTAL OPPORTUNITY$7.3BNet 10- year value creation
EXPANSION MULTIPLE2.46x2036 value over 2026 base
Strategic Levers
M&A Pipeline
Regional Outlook
Country Rankings
Competitive Intelligence
Segmental Deep-dive
Call-Us : 91 93563 13602

Executive Snapshot and Market Trajectory.

There are about 62 cable ships in the world, many of them old, and most are committed years ahead. A funded, permitted, surveyed route still waits a median 22 months for a vessel. Shipyard slots and crew training run years ahead. Manufacturing capacity is not the limit here.
The buyers changed and the supply base is still adjusting. Content and cloud platforms now fund 71% of new system capacity, and they want fibre pairs rather than complete systems, negotiating on delivered cost per pair per route kilometre. Submarine line terminal equipment grows at 14.1%, half again the market rate of 9.4%, because open architecture separated it from the wet plant supplier entirely.
Five suppliers hold 79% of contracted system value, which is among the highest concentration in any infrastructure category we cover, and the barrier is shipyards and marine crews rather than technology. Reported faults requiring vessel intervention run near 184 a year, and the repair fleet is thinner than the installation fleet, which is a problem the industry discusses privately and rarely in public. Zone pricing set when claims were rare has plainly failed.
Market Definition
This market covers submarine communication cable systems and associated services worldwide, including cable and wet plant manufacture, repeaters and branching units, marine survey and route engineering, cable laying and installation services, submarine line terminal equipment, and maintenance, repair and spare capacity contracts. It excludes terrestrial backhaul networks, landing station real estate, capacity resale and bandwidth trading, subsea power transmission cables, and offshore oil and gas umbilicals.
Base Year Value
$4.6B in 2025 (MMA Primary Research Dataset, September 2026)
Forecast Period
2026 to 2036, eleven discrete annual values
CAGR
9.4% base case. Bull 10.7%. Bear 8.2%.
Fastest Growth Segment
Submarine Line Terminal Equipment: 14.1% CAGR
Fastest Growth Country
India: 13.2% CAGR
Fastest Growth Region
South Asia and Pacific: 11.5% CAGR
Largest Region
East Asia: 27% of 2025 global value
Market Leaders
SubCom, Alcatel Submarine Networks, NEC, HMN Technologies, and Prysmian lead the field. Source: MMA Primary Research Dataset, July 2026.
Primary Survey
n=3,800 procurement and R&D decision-makers, Q4 2025, six countries
Methodology
Demand-side build-up, cross-validated against public data, 47 expert interviews

Submarine Communication Cables Market Forecast Scenarios

submarine-communication-cables-market-size-forecast-scenario-1790006613910
Growth between 2020 and 2025 was funded by a buyer that barely existed a decade earlier. Content and cloud platforms moved from purchasing capacity on consortium systems to funding their own routes outright, and system orders followed their data centre build rather than any telecommunications investment cycle. Historical growth of 8.3% understates the change, since the money came from elsewhere and behaved differently.
The base case at 9.4% rests on three mechanisms. Platform operators continue funding routes that connect their own regions, and their capital plans extend well past the forecast horizon. Terminal equipment upgrades add capacity on existing cables at a fraction of new system cost, which suits operators facing vessel shortages. And millennium era systems reach end of design life on routes where traffic has multiplied since. None of the three depends on new corridors opening.
The bull case at 10.7% depends on new vessel capacity entering service faster than currently ordered, which would release projects presently queued behind ship availability. The bear case at 8.2% is a geopolitical constraint on routes: permitting delays and territorial disputes across several important corridors can defer systems for years, and a few blocked routes remove visible forecast value quickly.

Ships Decide What Gets Built

Everything commercially interesting about this industry follows from the fleet. Roughly 62 cable ships exist worldwide, a substantial share of them built decades ago, and they are committed years in advance. A project with funding, permits, and a completed survey still waits a median 22 months for a vessel, and no amount of manufacturing capacity shortens that. Order intake and revenue conversion are separate problems here.
TOP FIVE CONCENTRATION79%Share of contracted system value held by leading suppliers
GLOBAL CABLE SHIP FLEET62 vesselsVessels available worldwide for installation and repair work
VESSEL WAITING PERIOD22 monthsTypical delay between project funding and vessel availability
PLATFORM FUNDED SHARE71%New system capacity funded by content and cloud operators
ANNUAL CABLE FAULTS184Reported breaks requiring vessel intervention across all systems
COST PER FIBRE PAIRUSD 1.9 millionDelivered price per pair on a typical long route
The buyer has changed more than the supply base has. Content and cloud platforms fund 71% of new capacity now, and they negotiate on delivered cost per fibre pair per route kilometre rather than on the capacity a system delivers. That reframing suits them and unsettles suppliers whose commercial models were built around selling designed capacity to telecommunications consortia. Designed system capacity is not what they are buying.
Repair is the part nobody advertises. Around 184 faults a year require a vessel, most caused by fishing gear and anchors in shallow water, and the maintenance fleet is older and thinner than the installation fleet. Maintenance agreements have historically been priced as insurance nobody expected to claim on, which is becoming difficult to sustain. Most damage happens in water shallower than two hundred metres.
"You can order a cable system in eighteen months and wait two years for someone to lay it. Every conversation in this industry that starts with technology ends with vessel schedules, and the companies building ships now will be the ones setting prices in a decade."
Practice Director, Network Infrastructure and Subsea Systems · MMA Technology Practice · September 2026

Market Trends

Open Architecture Separated Terminal Equipment From Wet Plant

Systems were once sold complete, with the terminal equipment supplied by whoever built the cable, and open cable architecture ended that. Operators now buy wet plant from one supplier and terminal equipment from another, upgrading the latter repeatedly across a system's life to add capacity without touching anything underwater. Submarine line terminal equipment grows at 14.1% as a result. For wet plant suppliers this removed a profitable attached business; for optical equipment vendors it opened a market they previously could not enter at all. Upgrades also require no vessel, which matters enormously.
Market Impact: Covers 29% of forecast value

Platform Operators Fund Routes Their Own Regions Need

Content and cloud platforms fund 71% of new system capacity, choosing routes that connect their own data centre regions rather than routes serving general telecommunications demand. That changes which corridors get built and when, and it decouples system orders from telecommunications capital cycles entirely. These buyers hold fibre pairs for their own traffic rather than reselling capacity, and they negotiate on delivered cost per pair per route kilometre, which is a harder commercial conversation than selling designed system capacity ever was. Corridor selection now follows data centre geography rather than general telecommunications demand.
Market Impact: Drives 184 annual faults

Market Opportunities and Growth Drivers

Millennium Era Systems Reach End Of Design Life

A large population of systems installed between 1998 and 2005 was designed for twenty-five years, and those dates are arriving on routes where traffic has grown by orders of magnitude since. Replacement is not optional, because a failed system on a major corridor cannot be restored quickly with the fleet as it stands. Roughly 29% of forecast new system value over the next decade replaces capacity that already exists rather than adding routes, which is a quieter demand source than platform expansion and considerably more predictable. Failure on a major corridor cannot be restored quickly.
Market Impact: Delays projects 22 months

Fault Rates Rise With Shipping Density And Attention

Around 184 faults a year require vessel intervention, most caused by fishing gear and anchors in water shallower than two hundred metres, and incident counts have risen with shipping density and with deliberate attention to cables in contested waters. Repair demand therefore grows independently of new construction. Maintenance, repair and spare capacity contracts grow at 12.6%, and pricing that was set when claims were rare is being reconsidered across most maintenance zones as actual utilisation of the repair fleet climbs. Repair demand therefore grows independently of any new construction at all.
Market Impact: Crosses 12 jurisdictions typically

Market Restraints and Challenges

Vessel Availability Delays Projects By Nearly Two Years

A funded and permitted project waits a median 22 months for a ship, and the root cause is a fleet of about 62 vessels, many built decades ago, with newbuild capacity constrained by specialised shipyard availability and by crew training pipelines measured in years. Commercially this caps how fast the industry can convert demand into revenue regardless of order intake. Participants respond by ordering vessels well ahead of contracted demand, by improving campaign efficiency to fit more systems into a season, and by scheduling installations across multiple projects. Order intake is not the limit.
Market Impact: Segment grows at 14.1%

Route Permitting Crosses Jurisdictions With Competing Interests

A long system crosses territorial waters and exclusive economic zones belonging to many states, each with its own permitting process, and the root cause is that no single authority governs a route. Delays compound rather than run in parallel. Commercially this makes schedules unreliable and occasionally strands committed vessel time, which is the most expensive thing that can happen to a project. Participants respond by routing around difficult jurisdictions at additional cable cost, by beginning permitting well before financing closes, and by building schedule contingency. Stranded vessel time is the most expensive outcome available.
Market Impact: Funds 71% of new capacity
3 additional market trends, 4 additional growth drivers, and 2 additional restraints and challenges are covered in the full report. Contact sales@marketmindsadvisory.com to access the complete intelligence.

Segment CAGR and Growth Architecture

Segmentation follows scope of supply. Six segments cover the market: cable and wet plant manufacture, repeaters and branching units, marine survey and route engineering, cable laying and installation services, submarine line terminal equipment, and maintenance, repair and spare capacity contracts. Wet plant carries most value while terminal equipment grows fastest. Marine services carry the scarcity.
submarine-communication-cables-market-market-share-analysis-1790006614516

Submarine Line Terminal Equipment

Terminal equipment grows at 14.1%, half again the market rate of 9.4%, and open cable architecture is the entire reason. Systems were once sold complete with terminals from whoever built the cable, and separating them let operators upgrade capacity repeatedly across a system's life without touching anything underwater or waiting for a vessel. That last point matters enormously given a median 22 month wait for a ship. Optical equipment vendors who could not previously enter this market now compete directly, and wet plant suppliers lost an attached business that had been reliably profitable for decades. Capacity arrives without a marine campaign. Wet plant suppliers lost a business that had been reliably profitable for decades.
CAGR 14.1%

Maintenance Repair And Spare Capacity Contracts

Maintenance grows at 12.6% on rising fault rates and a repair fleet thinner than the installation fleet. Around 184 faults a year require vessel intervention, most from fishing gear and anchors in shallow water, and incident counts have climbed with shipping density and with deliberate attention to cables in contested waters. Maintenance zone agreements were priced when claims were genuinely rare, and that pricing is now being reconsidered across most zones. The awkward part is that repair vessels compete for the same crews and shipyard slots as installation vessels, so capacity cannot expand quickly. Repair vessels compete for the same crews and shipyard slots as installation vessels, so capacity cannot expand quickly.
CAGR 12.6%
Full segment breakdown across 6 segments available in the complete report.

Regional Architecture and Country Demand Map

Regional shares reflect where system value lands, allocated across the routes and corridors each region anchors rather than to any single supplier headquarters. Two shares fall outside the standard bands, reflecting corridor concentration that has little to do with regional economic size. Corridors rather than economies drive it.

East Asia

Trans-Pacific corridors and the dense intra-Asia mesh together make this the largest anchor region, and two of the five leading system suppliers manufacture here. Japanese and Chinese wet plant production covers a substantial share of global cable output, and regional shipyards build a meaningful part of the fleet. Platform operators fund most new trans-Pacific capacity, choosing landings that serve their own regions. Growth of 10.3% runs above the world rate because intra-Asia routes are being added faster than any other corridor group, and because replacement demand on millennium era systems is heaviest here. Regional shipyards build a meaningful part of the global fleet, which matters more than manufacturing share does.
Share: 27% | CAGR: 10.3% (2026 to 2036)

North America

Trans-Pacific and trans-Atlantic corridors both anchor here, and the platform operators funding 71% of new capacity are headquartered in this region even where the routes they build touch it only at one end. That headquarters concentration shapes which corridors receive capital far more than domestic landing demand does. Growth of 8.6% is moderate, held back by mature trans-Atlantic capacity and by permitting that has become slower on some approaches. Replacement of ageing systems accounts for a rising share of what does get ordered here. Headquarters concentration shapes which corridors receive capital far more than domestic landing demand does anywhere. Replacement of ageing systems accounts for a rising share of what does get ordered.
Share: 24% | CAGR: 8.6% (2026 to 2036)
Regional intelligence for 5 additional markets available in the complete report: Western Europe, South Asia and Pacific, Middle East and Africa, Latin America, Eastern Europe. Contact sales@marketmindsadvisory.com.
submarine-communication-cables-market-country-cagr-analysis-1790006615054

Where Suppliers Capture Project Value

Four commercial moves matter in an industry limited by ships rather than by factories. Each recognises that vessel capacity, not manufacturing, decides how much revenue the industry can convert, and that the buyer funding most new systems negotiates on entirely different terms from the consortia that came before. Everything follows from the fleet. Nothing else binds.

Order Vessel Capacity Ahead Of Contracted Demand

A fleet of about 62 ships with a median 22 month wait means whoever holds vessel capacity controls project schedules and therefore pricing. Suppliers ordering newbuilds against forecast rather than contracted demand carry real balance sheet risk and command installation pricing 25% to 40% above competitors chartering third-party capacity. Shipyard slots and crew training both run years ahead, so the decision has to be made long before the demand is visible enough to make anybody comfortable about it. Nobody feels comfortable making that commitment. Whoever holds vessels controls schedules and therefore pricing.
Market Impact: Commands 25% to 40% higher installation pricing overall

Price Per Fibre Pair Rather Than Per System

Platform operators funding 71% of new capacity buy fibre pairs for their own traffic and compare delivered cost per pair per route kilometre across suppliers and routes. Suppliers still quoting designed system capacity are answering a question these buyers stopped asking. Those who restructured commercial terms around pair economics win platform-funded awards at roughly 2.6 times the rate of those who did not. The arithmetic is less flattering under this framing, which is precisely why several suppliers resisted the change for years. Several suppliers resisted the change for years. The arithmetic is less flattering.
Market Impact: Wins 2.6 times more platform funded awards overall

Reprice Maintenance Zones Against Actual Utilisation

Maintenance agreements were priced when faults were rare and vessels sat idle, and with 184 annual faults against a thinner repair fleet that assumption no longer holds. Operators repricing zones against measured utilisation rather than historical convention report maintenance margins improving 8 to 14 points, and the conversation is easier than expected because cable owners understand the fleet position perfectly well. Delaying it simply transfers the cost of rising fault rates from the cable owner to the maintenance provider indefinitely. Cable owners understand the fleet position perfectly well. Delay simply transfers the cost.
Market Impact: Improves maintenance margins by 8 to 14 points

Sell Terminal Upgrades Against Vessel Wait Times

Adding capacity by upgrading terminal equipment requires no ship, no permit, and no marine campaign, which against a median 22 month vessel wait is an argument that sells itself to any operator facing near-term capacity pressure. Terminal equipment grows at 14.1% on exactly this logic. Suppliers positioning upgrades as an alternative to waiting, rather than as an incremental product, close roughly 3.1 times more upgrade projects and reach operators who had not budgeted for anything at all. It also reaches operators who had not budgeted for anything at all this year.
Market Impact: Closes 3.1 times more terminal upgrade projects overall

Who Controls the Margin Pool

Concentration here is among the highest of any infrastructure category. Five suppliers hold 79% of contracted system value, measured consistently on that basis across all participants, and the barrier protecting them is shipyards, marine crews, and decades of route experience rather than any patent position. The gap between the leader and the fifth is moderate, and it moves with vessel availability more than with commercial performance. No patent position protects anybody in this field.
Competition currently turns on three things: vessel capacity a supplier controls directly, willingness to price on fibre pair economics that platform buyers demand, and repair capability in the maintenance zones a customer's route crosses. Manufacturing capability differentiates less than outsiders assume, because every credible supplier can build cable and the constraint sits downstream of that. The constraint sits downstream of manufacturing entirely.

Pressure comes from two directions. Optical equipment vendors have entered terminal equipment through open architecture and taken a business wet plant suppliers previously kept. Meanwhile marine services companies holding vessels are capturing more project value as scarcity increases. Rankings will shift toward whoever adds fleet capacity fastest, since that is what converts demand into revenue. Fleet additions decide the ranking over the next decade.
submarine-communication-cables-market-company-positioning-matrix-1790006615581

Competitive Moat and Risk Dimensions

SUBCOM

Moat: Owned Fleet And Route Experience

Controlling installation vessels directly rather than chartering them means project schedules can be committed with confidence that competitors relying on third-party capacity cannot match. Combined with decades of route survey and engineering experience across difficult corridors, that position converts into pricing power whenever fleet availability is the binding constraint, which is most of the time.
SUBCOM

Risk: Terminal Equipment Business Lost

Open cable architecture removed a profitable attached business that once came automatically with every system sold, and optical vendors now compete for it directly on capability the company has no particular advantage in. That segment grows faster than anything else in the market, and defending a position there means competing against specialists with far larger optical development budgets.
ALCATEL SUBMARINE NETWORKS

Moat: Integrated Manufacture And Marine Operations

Holding cable manufacture, repeater production, and marine installation within one organisation allows schedule commitments across the whole delivery chain, which matters enormously to buyers whose data centre plans depend on a landing date. Few competitors can commit across every element without a third-party dependency somewhere in the sequence.
ALCATEL SUBMARINE NETWORKS

Risk: Fleet Age And Renewal Cost

A substantial part of the marine fleet was built decades ago and renewal requires shipyard slots booked years ahead against capital commitments made well before the demand supporting them is contracted. Competitors ordering newbuilds earlier will hold schedule advantages during exactly the periods when vessel scarcity is most acute.

Players Tracked

Prominent Players

SubCom
Alcatel Submarine Networks
NEC
HMN Technologies
Prysmian

Other Key Players

Nokia
Ciena
Infinera
NKT
Hengtong Group
Fujitsu
Orange Marine
Global Marine Group
E-Marine
IT International Telecom
Elettra Tlc
Kokusai Cable Ship
S.B. Submarine Systems
Xtera
Padtec

Recent Developments

MARCH 2026

SubCom Awarded Trans-Pacific System Contract By Platform Consortium

SubCom was selected to build and install a trans-Pacific system funded by a group of content and cloud platform operators, with commercial terms structured around delivered cost per fibre pair rather than around total designed system capacity. Landing dates were tied to the funders' own region launch schedules.
Signal: Fibre pair economics are now the commercial framing platform buyers use, and suppliers have finally adapted.
SEPTEMBER 2025

Orange Marine Orders Replacement Cable Ship For European Fleet

Orange Marine placed an order for a replacement cable installation and repair vessel, committing shipyard capacity years ahead of contracted project demand as fleet age and rising fault rates strain existing marine capability across European maintenance zones. Delivery is scheduled several years ahead of the current order book.
Signal: Fleet renewal decisions are now being made well before the demand supporting them becomes contractually visible.
MAY 2025

Ciena Secures Terminal Equipment Supply For Open Cable System

Ciena was selected to supply submarine line terminal equipment for an open architecture system whose wet plant came from a different supplier entirely, continuing the separation that opened this segment to optical vendors previously excluded from it. Upgrade capability across the system life formed part of the award criteria.
Signal: Open architecture keeps transferring terminal equipment value away from wet plant suppliers toward optical specialists instead.

What Building A System Costs

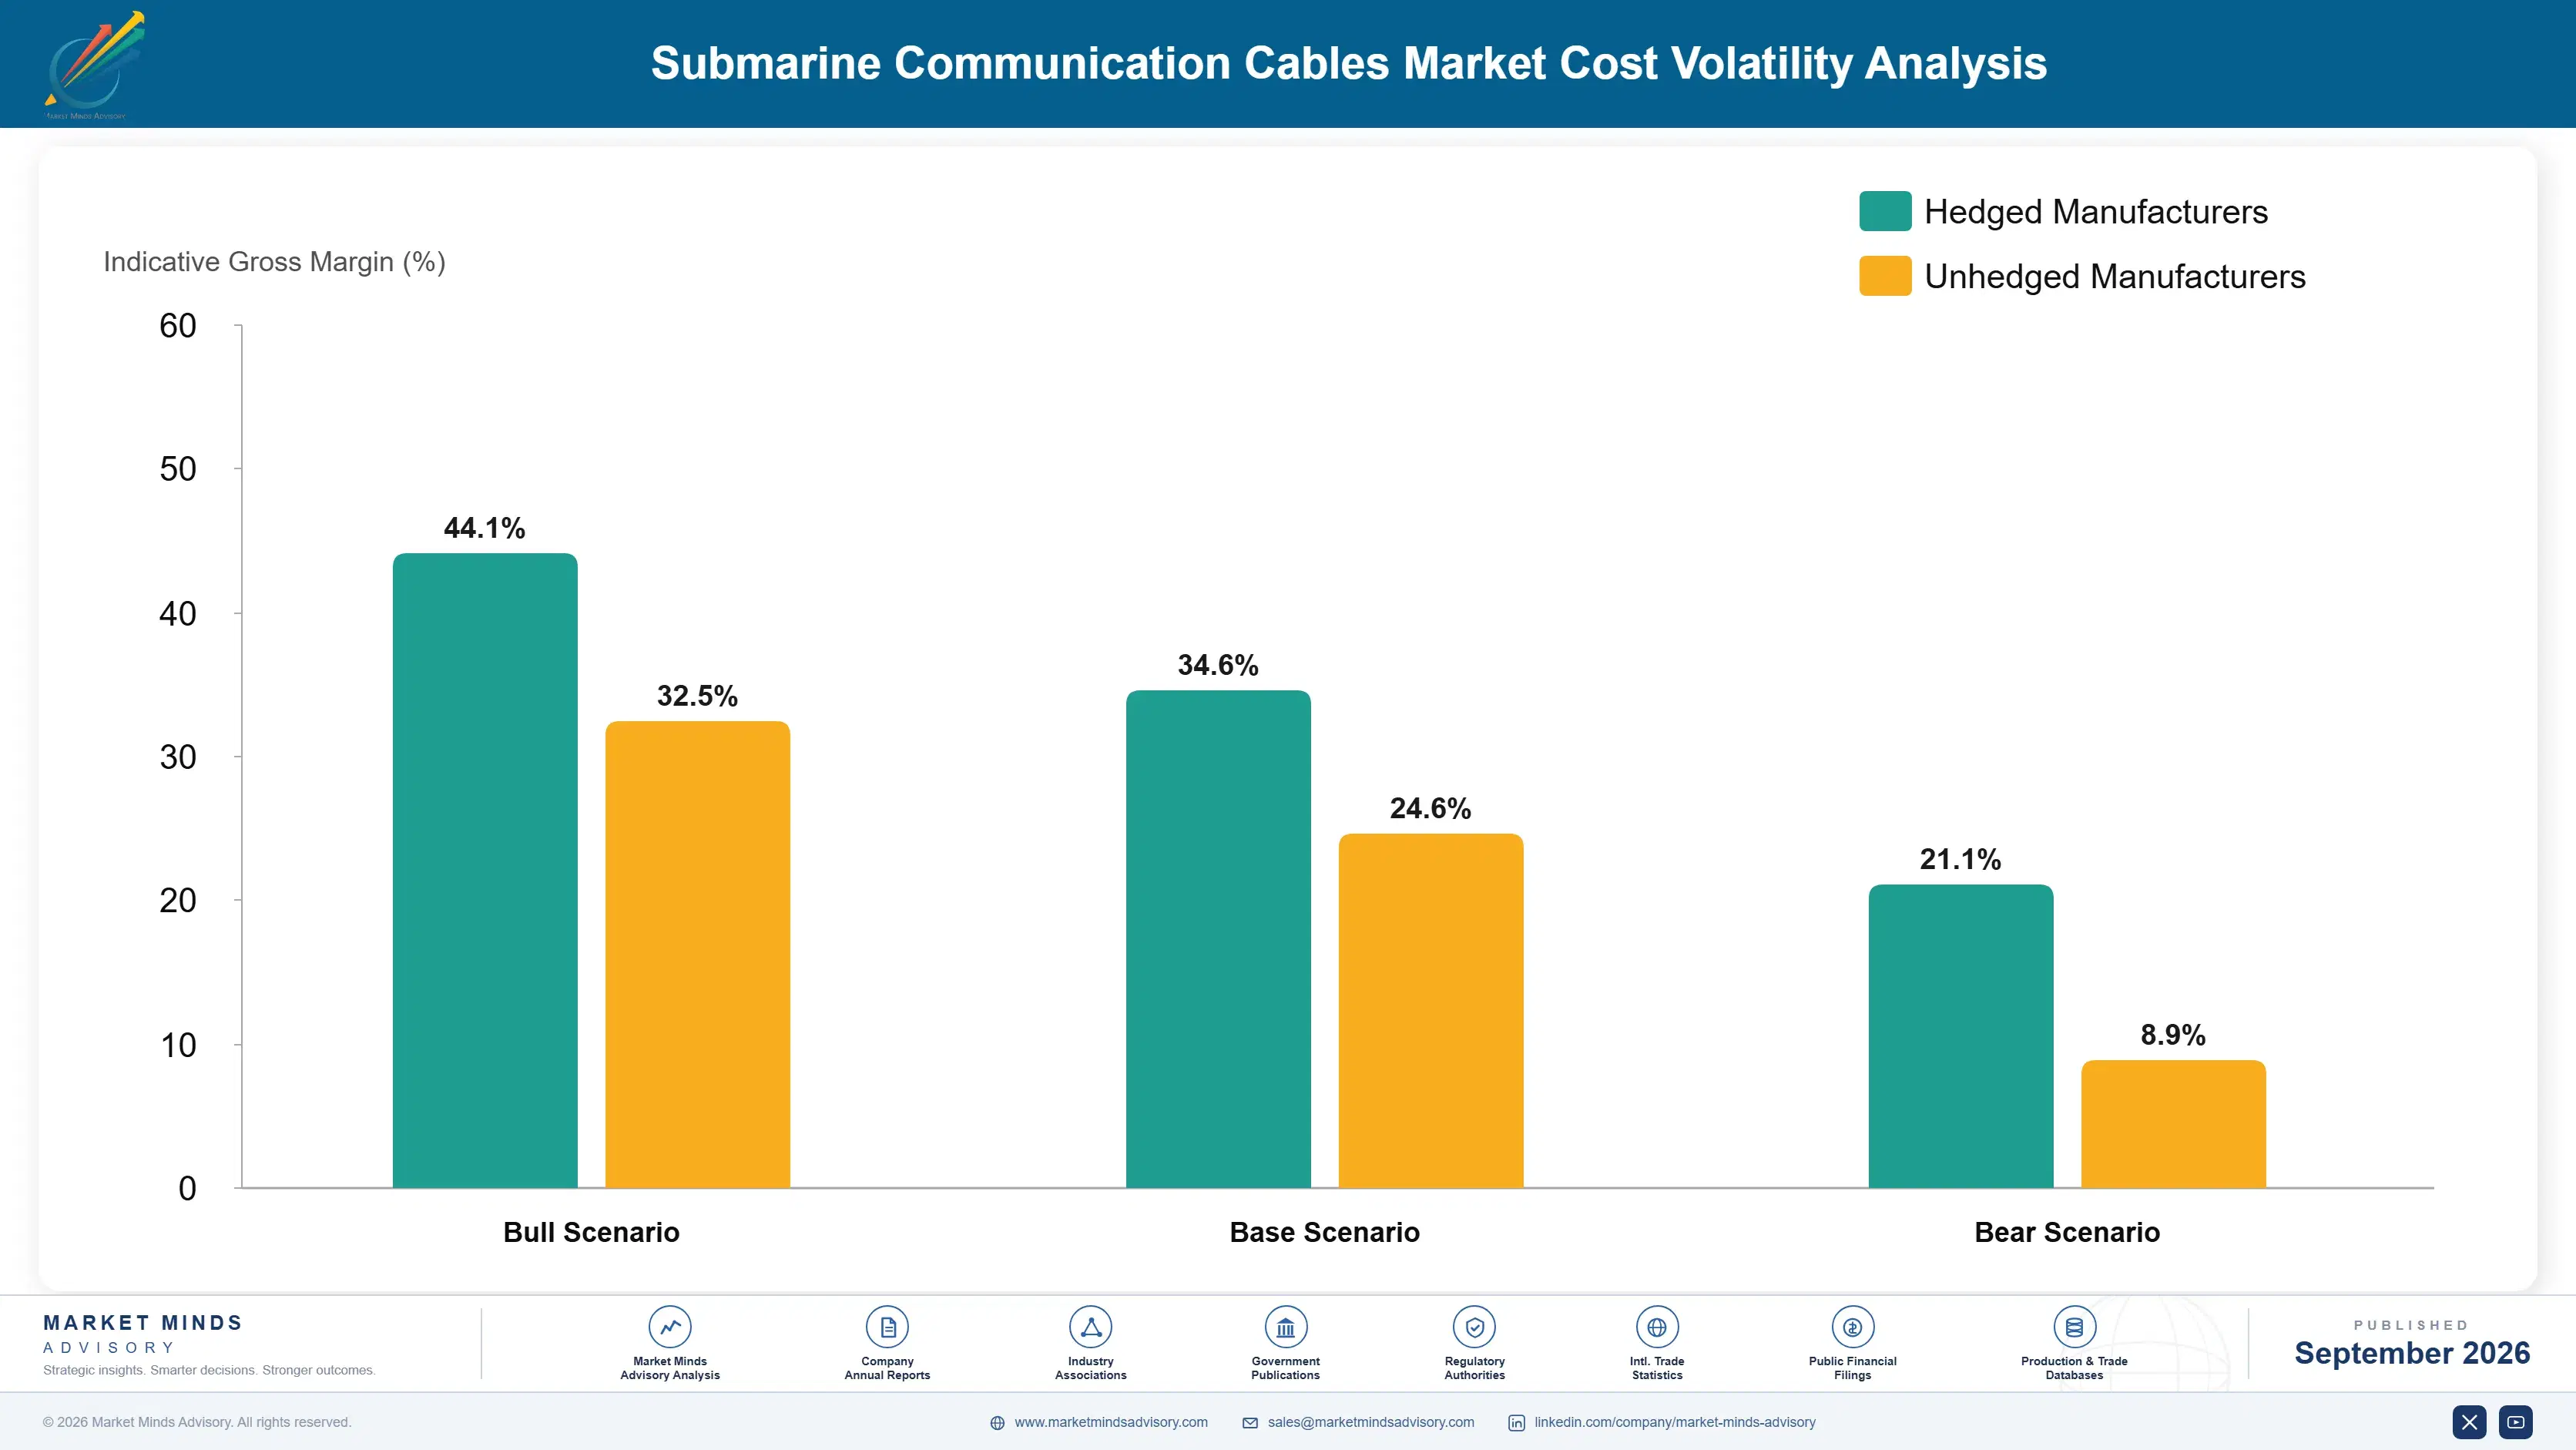
Three inputs dominate delivered project cost. Optical fibre, cable armouring, and jointing materials run 26% to 33% of cost of goods sold. Repeaters, branching units, and wet plant electronics take 20% to 26%. Marine vessel operations, including charter or ownership cost, fuel, and crew, account for a further 28% to 35%. Vessel cost behaves differently, being largely fixed against a season rather than variable with length.
Marine fuel prices moved materially through 2024 and 2025, and EIA petroleum data documents the underlying movement across the relevant bunker grades. Several marine services operators described the resulting margin pressure in their annual reports for those years, compounded by vessel day rates rising as scarcity increased. Fixed-price installation contracts signed earlier absorbed both movements without any recovery mechanism. No recovery mechanism existed in those agreements.

The competitive disadvantage mechanism runs through vessel control rather than through manufacturing. A supplier chartering third-party capacity pays market rates that rise precisely when demand is strongest, and cannot commit schedules with the confidence a fleet owner can. Exposure varies by participant type. Integrated suppliers owning vessels convert scarcity into pricing power. Manufacturing-only participants pay that premium to somebody else on every project they win.
submarine-communication-cables-market-cost-volatility-analysis-1790006615778

Commit Shipyard Slots Ahead Of Contracted Demand

Cable ship construction requires specialised yards with limited slots booked years ahead, and waiting for contracted demand before ordering guarantees arriving late. Operators committing early carry genuine balance sheet risk and hold schedule advantages during exactly the periods when scarcity peaks and installation pricing is at its strongest. Arriving late is the guaranteed alternative.

Improve Campaign Efficiency Within A Marine Season

Vessel cost is largely fixed against a season, so fitting more system kilometres into the same weather window improves margin without any additional capital. Operators investing in loading efficiency, jointing speed, and route sequencing report meaningfully more delivered kilometres per vessel year than competitors running comparable ships. No additional capital is required for the gain.

Structure Contracts With Fuel And Day Rate Adjustment

Fixed-price installation against multi-year projects leaves the supplier carrying fuel and charter movements nobody can forecast reliably. Adjustment clauses indexed to published fuel benchmarks and to charter market rates move that exposure to a buyer better able to absorb it across a portfolio of projects. Portfolio buyers absorb the movement more comfortably. Forecasting either reliably is impossible.

Portfolio Architecture for Margin Defence

Margin follows scarcity rather than sophistication. Cable and armouring manufacture is close to commodity, since several suppliers can produce it and buyers compare delivered cost per kilometre directly. Repeaters and wet plant electronics earn more, requiring qualification few can meet. Marine installation and repair earn most, because the fleet is small, ageing, and cannot be expanded inside any timeframe a project cares about. Scarcity, not sophistication, sets the ladder.
The tension between volume and premium runs through vessel utilisation. Manufacturing scale looks attractive and delivers thin margin against buyers comparing cost per kilometre, while marine capacity delivers high margin on a fixed number of vessel days that cannot be increased by spending faster. A supplier can win more manufacturing volume than its fleet can install, which helps nobody. Spending faster does not add vessel days.

High-value pools concentrate where the fleet is the constraint: installation on committed schedules, repair in maintenance zones where response time is contractual, and terminal upgrades that add capacity without any vessel at all. These share a buyer whose alternative is waiting nearly two years. Cable manufacture, by contrast, has no such scarcity behind it and prices accordingly.

Volume / Commodity-Adjacent

Cable, armouring, and jointing material manufacture where several suppliers compete and buyers compare delivered cost per kilometre directly. No scarcity protects pricing. The nine-point range reflects wide variation in fibre sourcing and manufacturing scale between participants.
Gross Margin: 16% to 25%

Premium / Certified

Repeaters, branching units, and wet plant electronics requiring qualification for twenty-five year submerged operation that very few suppliers can demonstrate. Failure is unrecoverable without a vessel. The nine-point range separates integrated manufacturers from those supplying components into others' systems.
Gross Margin: 33% to 42%

Sustainability / Regulatory / Next-Generation

Marine installation on committed schedules, contracted repair response, and terminal equipment upgrades that need no vessel at all. Fleet scarcity and open architecture both support pricing here. The fourteen-point range reflects the difference between owning vessels and chartering them at market rates.
Gross Margin: 44% to 58%
submarine-communication-cables-market-portfolio-architecture-1790006616279

High-value Sub-segments and Strategic Watch-out

Owned Fleet Installation Capacity

Highest value in the market, since a fleet of roughly 62 ships with a median 22 month wait makes vessel control the binding constraint on everything. Pricing runs well above chartered alternatives. The twelve-point range separates owners from suppliers paying market charter rates. Schedules can be committed.
Gross Margin: 46% to 58%

Submarine Line Terminal Equipment

Fastest growth at 14.1%, adding capacity without any ship, permit, or marine campaign, which sells itself against a two year vessel wait. Open architecture opened the segment to optical vendors. The ten-point range reflects competitive intensity between specialists and incumbent system suppliers. No marine campaign required.
Gross Margin: 42% to 52%

Maintenance Zone Repair Contracts

Growing at 12.6% on 184 annual faults against a repair fleet thinner than the installation fleet. Pricing set when claims were rare is being reconsidered across most zones. The twelve-point range reflects how far different operators have moved toward utilisation-based repricing so far. Repricing is now underway.
Gross Margin: 36% to 48%

Cable And Armouring Manufacture

The strategic watch-out. Several suppliers can produce it, buyers compare cost per kilometre directly, and no scarcity protects the price. Winning more of it than the fleet can install helps nobody. The thirteen-point range reflects fibre sourcing and manufacturing scale differences across participants. Installation capacity binds it.
Gross Margin: 14% to 27%

How Project Revenue Recurs

New system revenue is lumpy, competitive, and individually enormous, arriving as projects awarded years apart with nothing resembling an annuity attached. What recurs instead is maintenance, which continues for the twenty-five year life of every system installed and generates predictable revenue from an installed base that only grows. That contrast makes maintenance strategically more valuable than its share of revenue suggests to anybody reading the numbers quickly.
Commitment depth varies sharply by buyer type. Platform operators funding 71% of capacity run repeated programmes and build genuine supplier relationships across successive systems, though they retender each one properly. Telecommunications consortia are slower, more committee-driven, and less likely to switch once a supplier has delivered acceptably. Government-backed systems are the stickiest of all, since security review and sovereignty considerations narrow the acceptable supplier field considerably.

The buyer profile has changed completely within a decade. Telecommunications capacity planners once specified systems around traffic forecasts and consortium economics. Data centre infrastructure teams now drive most decisions, and they think in delivered fibre pairs, landing dates that gate region launches, and route diversity against outage risk. Suppliers still presenting designed system capacity are describing something these buyers do not purchase.
submarine-communication-cables-market-end-use-penetration-index-1790006616770

Where This Market Rewards

These are among the four positions where our research anticipates prominent divergence between winners and laggards over the coming forecast period. Each is grounded in the demand model, the regulatory perimeter, and the announced capacity pipeline.
01 / FLEET CAPACITY OWNERSHIP

Ships convert demand into revenue, factories do not

A global fleet of roughly 62 vessels, many built decades ago, imposes a median 22 month wait between project funding and installation, which caps how fast the whole industry can convert orders into revenue. Suppliers ordering newbuilds against forecast rather than contracted demand command installation pricing 25% to 40% above those chartering third-party capacity. The commitment must be made years before demand is visible enough to make anybody comfortable, which is exactly why so few make it, and why fleet ownership keeps deciding rankings.
02 / FIBRE PAIR COMMERCIAL FRAMING

Platform buyers stopped purchasing designed capacity

Content and cloud operators fund 71% of new system capacity and compare delivered cost per fibre pair per route kilometre across suppliers and routes, holding pairs for their own traffic rather than reselling anything. Suppliers restructuring commercial terms around pair economics win platform-funded awards roughly 2.6 times more often than those still quoting system capacity. The arithmetic looks worse under that framing, which explains the years several suppliers spent resisting it, and buyers noticed which suppliers adapted and which did not.
03 / MAINTENANCE REPRICING DISCIPLINE

Repair was priced as insurance nobody would claim

Maintenance zone agreements were set when faults were rare and repair vessels sat idle, and with 184 annual faults against a repair fleet thinner than the installation fleet that assumption has clearly failed. Operators repricing against measured utilisation report maintenance margins improving 8 to 14 points, and cable owners accept the conversation because they understand the fleet position themselves. Delaying it simply transfers the cost of rising fault rates onto the provider indefinitely, and cable owners are already asking for the conversation.
04 / VESSEL FREE CAPACITY SALES

Terminal upgrades beat waiting two years for ships

Upgrading submarine line terminal equipment adds capacity with no ship, no permit, and no marine campaign required, which against a median 22 month vessel wait is an argument that closes itself with any operator facing near-term capacity pressure. The segment grows at 14.1%, half again the market rate of 9.4%. Suppliers positioning upgrades as an alternative to waiting rather than as an incremental product close roughly 3.1 times more projects, reaching operators who had budgeted for nothing at all this year.

Engagement Snapshot From the Field

A live engagement with an industry participant carrying material or product regulatory and market exposure ahead of a defining policy shift, showing how our research translates into a defensible multi-year portfolio strategy.
MARKET MINDS ADVISORY · CLIENT ENGAGEMENT SUMMARY
Submarine Communication Cables Producer Strategic Portfolio Review and Transition Roadmap 2026·Investment Scenario on Submarine Communication Cables Exposure Evaluation 2025-26
CLIENT PROFILE
A content platform operator running data centre regions across four continents, with annual infrastructure capital expenditure above USD 14 billion (client-reported, unverified by MMA). The company had funded three submarine systems outright and held fibre pairs on six consortium cables, and two further regions were scheduled to launch on capacity from a system whose installation date had already slipped twice.
STRATEGIC CHALLENGE
Region launch dates depended on landing dates that the company did not control, and two slipped installations had already forced expensive interim capacity leases. Procurement compared suppliers on system price without any consistent view of vessel commitment behind the quoted schedules, so schedule risk was invisible until it materialised. Schedule risk stayed invisible until it materialised.
MMA APPROACH
MMA assessed vessel ownership, fleet age, and committed capacity behind each candidate supplier's schedule, modelled delivered cost per fibre pair per route kilometre across supplier and route combinations, and tested whether terminal equipment upgrades on existing systems could cover the capacity gap during any further installation delay. Interim lease costs from prior slippages were quantified.
KEY FINDINGS
  1. Two of the four shortlisted suppliers had no owned vessel capacity in the relevant period and had quoted schedules dependent on charter availability they had not secured.
  2. Delivered cost per fibre pair varied by 34% across supplier and route combinations that procurement had been treating as broadly equivalent on headline system price.
  3. Terminal equipment upgrades on two existing consortium systems could supply 61% of the required interim capacity within nine months and without any vessel at all.
  4. Interim capacity leases taken during the two previous slippages had cost considerably more than the terminal upgrade programme would have cost outright.
CLIENT PROFILE
A content platform operator running data centre regions across four continents, with annual infrastructure capital expenditure above USD 14 billion (client-reported, unverified by MMA). The company had funded three submarine systems outright and held fibre pairs on six consortium cables, and two further regions were scheduled to launch on capacity from a system whose installation date had already slipped twice.
STRATEGIC CHALLENGE
Region launch dates depended on landing dates that the company did not control, and two slipped installations had already forced expensive interim capacity leases. Procurement compared suppliers on system price without any consistent view of vessel commitment behind the quoted schedules, so schedule risk was invisible until it materialised. Schedule risk stayed invisible until it materialised.
MMA APPROACH
MMA assessed vessel ownership, fleet age, and committed capacity behind each candidate supplier's schedule, modelled delivered cost per fibre pair per route kilometre across supplier and route combinations, and tested whether terminal equipment upgrades on existing systems could cover the capacity gap during any further installation delay. Interim lease costs from prior slippages were quantified.
KEY FINDINGS
  1. Two of the four shortlisted suppliers had no owned vessel capacity in the relevant period and had quoted schedules dependent on charter availability they had not secured.
  2. Delivered cost per fibre pair varied by 34% across supplier and route combinations that procurement had been treating as broadly equivalent on headline system price.
  3. Terminal equipment upgrades on two existing consortium systems could supply 61% of the required interim capacity within nine months and without any vessel at all.
  4. Interim capacity leases taken during the two previous slippages had cost considerably more than the terminal upgrade programme would have cost outright.
RECOMMENDED STRATEGY
Phase 1: Phase one: require documented vessel commitment as a condition of any installation schedule accepted during evaluation, weighting owned capacity above chartered arrangements. Phase 2: Phase two: procure terminal equipment upgrades on the two existing systems immediately, covering interim capacity without depending on any further marine campaign. Phase 3: Phase three: standardise supplier comparison on delivered cost per fibre pair per route kilometre rather than on headline system price across all future awards.
OUTCOME
Both region launches proceeded on schedule using upgraded capacity on existing systems while the new build continued (client-reported, unverified by MMA). Interim lease spending fell by an estimated 71%. The next system award went to a supplier with owned vessel capacity despite quoting a higher headline price than one competitor.

Frequently Asked Questions

Foundational context covering the market sizes, CAGR, scope, country, region and competition that inform every finding below. This section is provided to cover basics and most often pre-purchase conversations, answered from the MMA Primary Research Dataset.

What is the current size of the Submarine Communication Cables Market?

The market was worth USD 4.6 billion in 2025 and reaches USD 5.0 billion in 2026. Value covers wet plant, marine services, terminal equipment, and maintenance contracts.

How large will the Submarine Communication Cables Market be by 2036?

MMA forecasts USD 12.3 billion by 2036, an increase of USD 7.3 billion across the forecast period. That represents 2.46 times the 2026 base of USD 5.0 billion.

What is the CAGR for the Submarine Communication Cables Market 2026 to 2036?

The base case compound annual growth rate is 9.4%, with a bull case at 10.7% and a bear case at 8.2%. Historical growth from 2020 to 2025 ran at 8.3%.

Which segment is growing fastest?

Submarine line terminal equipment grows at 14.1%, half again the market rate of 9.4%. Upgrades add capacity without any vessel, permit, or marine campaign at all.

Who are the major companies in the Submarine Communication Cables Market?

SubCom, Alcatel Submarine Networks, NEC, HMN Technologies, and Prysmian lead, holding 79% of contracted system value. The barrier is ships and crews rather than technology.

Which country is growing fastest?

India grows at 13.2%, driven by multiplying landings at Chennai and Mumbai and by regulatory reform easing landing permission. New corridors rather than replacement drive it.

Report Segmentation Architecture

The full report scope spans multiple orthogonal segmentation dimensions, with cross-tabulated demand data provided for each dimension pair. Coverage extends further to regional breakdowns, trend trajectories, and the competitive detail needed to support segment-level decision-making.

By Scope Of Supply

  • Cable and Wet Plant Manufacture
  • Repeaters and Branching Units
  • Marine Survey and Route Engineering
  • Cable Laying and Installation Services
  • Submarine Line Terminal Equipment
  • Maintenance, Repair and Spare Capacity Contracts

By End-Use Industry

  • Content and Cloud Platform Operators
  • Telecommunications Carrier Consortia
  • Government and Defence Networks
  • Offshore Energy and Island Connectivity
  • Research and Scientific Networks
  • Wholesale Capacity and Neutral Operators

By Commercial Dimension

  • Turnkey System Contract
  • Supply Only Manufacture
  • Marine Services Subcontract
  • Open Cable Terminal Supply
  • Maintenance Zone Agreement
  • Development Institution Funded Project

By Region

  • East Asia
  • North America
  • Western Europe
  • South Asia and Pacific
  • Middle East and Africa
  • Latin America
  • Eastern Europe

Scope, Methodology, and Coverage

Every figure in this report is reproducible from documented input assumptions. The scope below maps the historical period, the forecast horizon, the segmentation dimensions, and the countries covered, alongside the underlying primary and qualitative methodology.
Historical Period
2020 to 2025
Forecast Period
2026 to 2036
Base Year
2025 (USD billions; MMA Primary Research Dataset, September 2026)
Market Definition
This market covers submarine communication cable systems and associated services worldwide, including cable and wet plant manufacture, repeaters and branching units, marine survey and route engineering, cable laying and installation services, submarine line terminal equipment, and maintenance, repair and spare capacity contracts. It excludes terrestrial backhaul networks, landing station real estate, capacity resale and bandwidth trading, subsea power transmission cables, and offshore oil and gas umbilicals.
Quantitative Units
USD billions, contracted system and services value
Segmentation Dimensions
Scope of supply, end-use industry, commercial dimension, region
Regions Covered
East Asia, North America, Western Europe, South Asia and Pacific, Middle East and Africa, Latin America, Eastern Europe
Countries Covered
Japan, China, South Korea, Taiwan, Singapore, United States, Canada, Mexico, United Kingdom, France, Ireland, Spain, Portugal, Italy, Norway, Denmark, India, Indonesia, Malaysia, Australia, Brazil, Chile, Egypt, Saudi Arabia, United Arab Emirates, South Africa, Nigeria, Kenya, Poland, Estonia
Key Companies Profiled
SubCom, Alcatel Submarine Networks, NEC, HMN Technologies, Prysmian, Nokia, Ciena, Infinera, NKT, Hengtong Group, Fujitsu, Orange Marine, Global Marine Group, E-Marine, IT International Telecom, Elettra Tlc, Kokusai Cable Ship, S.B. Submarine Systems, Xtera, Padtec
Quantitative Methodology
Primary survey, n=3,800 respondents, Q4 2025, six countries; demand-side model with trade association cross-validation
Qualitative Methodology
47 expert interviews, Q4 2025; applied to validate demand model assumptions, identify emerging dynamics, and assess competitive positioning
Report Format
PDF and XLSX data workbook (Word format preview document)
Publisher
Market Minds Advisory
Report Code
MMA-2026-TEC-511
Published
September 2026
Contact
sales@marketmindsadvisory.com | www.marketmindsadvisory.com

Purchase the full Submarine Communication Cables Market Report (2026 to 2036).

The full report sizes the submarine communication cables market across six scopes of supply, seven regions, and thirty countries, with forecasts to 2036 under base, bull, and bear cases. It examines why vessel availability rather than manufacturing capacity limits the industry, how platform operators funding most new systems have changed commercial terms, and what rising fault rates mean for maintenance economics. Competitive analysis covers twenty participants evaluated consistently on contracted system value, with detailed treatment of fleet ownership, open cable architecture, and corridor concentration risk. Cost structure, margin architecture by supply scope, and regional corridor drivers are analysed in full. Primary research includes 3,800 survey responses and 47 expert interviews.
Six supply scopes sized and forecast separately
Twenty participants evaluated on contracted system value
Regional corridor drivers across seven anchor geographies
Margin architecture by supply scope and fleet ownership
Vessel availability analysis against project schedule slippage
Fault rate and maintenance zone utilisation benchmarks

Built For The People Who Decide

From boardroom strategy to bench-side execution, this report is read cover-to-cover by leaders shaping the next decade of their industry, turning demand scenarios, market dynamics and valuation benchmarks into decisions.
CXOs/ Presidents/ VPs/ Managers
M&A and Corporate Development
Strategy Teams and R&D Heads
Procurement and Product Directors
Regulatory and Compliance Leaders
Investor Relations and Equity Analysts