

Market Minds Advisory
Korea Submarine Cable Market

Korea Submarine Cable Market: Korea Submarine Cable Market: Route Concentration, Repair Ship Scarcity and Landings Nobody Wants Nearby 2026 to 2036

Korea sits at the end of a peninsula with a closed northern border, so every bit of international traffic leaves by sea. That geography is the whole market and it is not going to change.

Lead Analyst

Published

September 2026

Make Smarter Decisions with Customized Research Insights

Request a free sample report and evaluate market opportunities, growth trends, and competitive dynamics relevant to your business needs.

2025 MARKET VALUE$1.9BMarket Size 2025
2036 FORECAST VALUE$5.2BBase Case , 2026 to 2036
CAGR 2026 TO 20369.6 %Bull 10.9% / Bear 8.4%
INCREMENTAL OPPORTUNITY$3.1BNet 10- year value creation
EXPANSION MULTIPLE2.48x2036 value over 2026 base
Strategic Levers
M&A Pipeline
Regional Outlook
Country Rankings
Competitive Intelligence
Segmental Deep-dive
Call-Us : 91 93563 13602

Executive Snapshot and Market Trajectory.

Korea sits at the end of a peninsula with a closed northern border, so every bit of international traffic leaves the country by sea. That single geographic fact is the whole market, and nothing about it is going to change. Nine landing stations carry all of it.
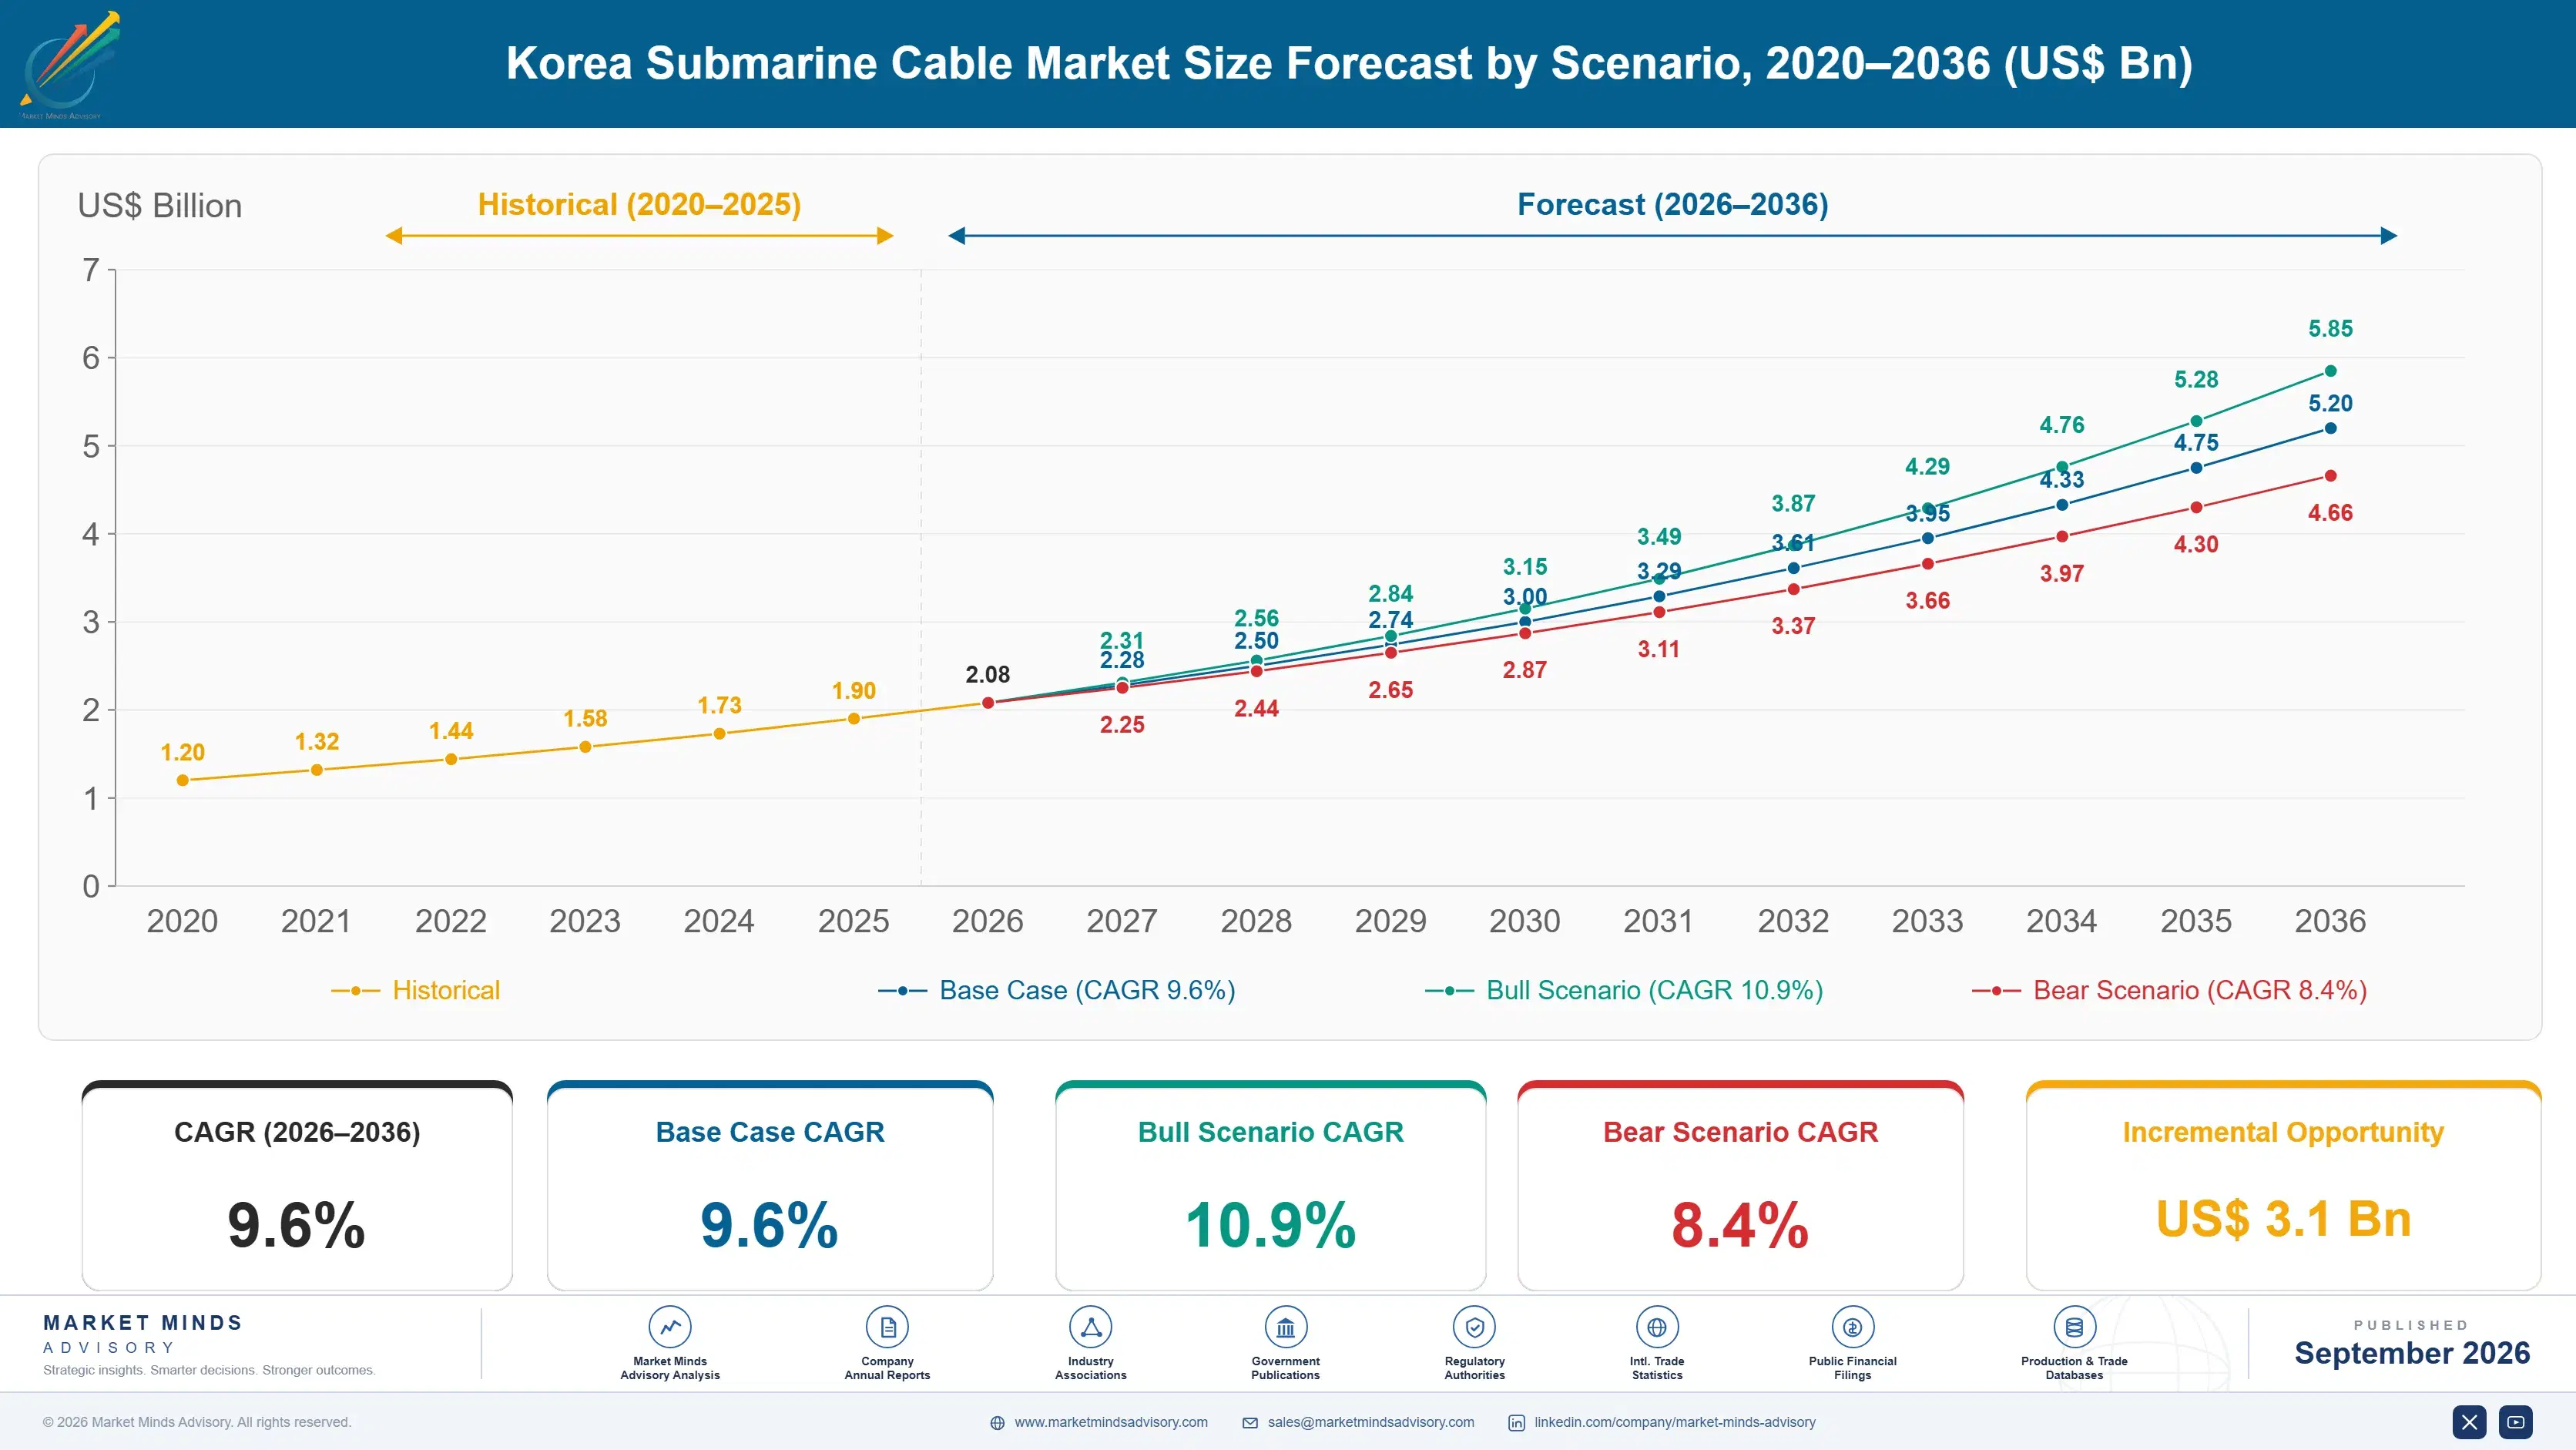
The market reaches USD 2.1 billion in 2026 and USD 5.2 billion by 2036, a 2.48 times expansion at 9.6% annually across Korean submarine cable systems. Hyperscaler private and consortium capacity grows at 14.4%, half again the market rate of 9.6%, because content operators now fund cables directly rather than buying capacity on somebody else's. Vietnam routes compound fastest at 15.8%. Vessel availability decides schedules. Route selection is an exercise in avoiding fishing boats.
Five participants hold 72% of Korean submarine cable value, which is very high and reflects installation vessel availability rather than any technology position. SubCom, Alcatel Submarine Networks, NEC Corporation, KT Submarine and HMN Technologies lead. Repair vessel availability decides more schedules than manufacturing capacity does. Around 64% of Korean cable faults come from fishing gear and anchor contact and only nine landing stations operate around the coast.
Market Definition
This report covers submarine cable systems serving Korea: wet plant supply and installation for international and domestic cable systems, submarine line terminal equipment at Korean landing stations, cable landing station facilities and interconnection, marine survey and route engineering, cable maintenance and repair services under zone agreements, and capacity and indefeasible right of use sales on Korean-landing systems. It excludes terrestrial backhaul networks, satellite capacity, subsea power cables, offshore oil and gas umbilicals, and domestic data centre interconnection within Korea.
Base Year Value
$1.9B in 2025 (MMA Primary Research Dataset, September 2026)
Forecast Period
2026 to 2036, eleven discrete annual values
CAGR
9.6% base case. Bull 10.9%. Bear 8.4%.
Fastest Growth Segment
Hyperscaler Private And Consortium Capacity: 14.4% CAGR
Fastest Growth Country
Vietnam: 15.8% CAGR
Fastest Growth Region
South Asia and Pacific: 11.6% CAGR
Largest Region
East Asia: 46% of 2025 global value
Market Leaders
SubCom, Alcatel Submarine Networks, NEC Corporation, KT Submarine and HMN Technologies lead on Korean submarine cable system value. Source: MMA Analysis.
Primary Survey
n=3,800 procurement and R&D decision-makers, Q4 2025, six countries
Methodology
Demand-side build-up, cross-validated against public data, 47 expert interviews

Korea Submarine Cable Market Forecast Scenarios

submarine-cable-industry-analysis-in-korea-size-forecast-scenario-1790000795790
Between 2020 and 2025 the category compounded at 8.5%, and who paid for cables changed completely. Telecommunications consortia had funded systems for decades against traffic they carried themselves. Content operators moved in, funding capacity for their own platforms at scale no carrier consortium could match, and Korean landings shifted from carrier-led projects toward systems where the anchor investor was never a telecommunications company at all.
The base case holds 9.6% on three mechanisms. Content operators keep funding capacity directly for platforms serving Korean users, which is a fundamentally different investment logic from carrier consortium economics. Southeast Asian route demand keeps growing as manufacturing and data centre capacity moves toward Vietnam and Indonesia. And existing systems keep approaching end of design life, with several Korean landings carrying cables installed well over twenty years ago. Those three mechanisms run largely independently of one another.
The bull case at 10.9% assumes Korean data centre capacity attracts regional hub traffic rather than merely serving domestic demand, which would change route economics considerably. The bear case at 8.4% is route permitting friction, where landing station approvals and fishing ground negotiations delay systems long enough that operators land elsewhere in the region and reach Korea terrestrially.

Everything Leaves By Sea

Geography does the work here. Korea's northern border is closed, so international connectivity leaves entirely by sea through nine landing stations around a coastline where fishing activity is intense. Around 64% of cable faults come from fishing gear and anchor contact, which is high even by regional standards and makes route selection an exercise in avoiding boats rather than in finding the shortest path between two points.
TOP FIVE CONCENTRATION72%Very high, reflecting installation vessel availability rather than technology
LANDING STATION COUNT9Active international cable landing facilities operating around the Korean coast
HYPERSCALER FUNDED CAPACITY58%New capacity funded by content operators rather than carrier consortia
REPAIR RESPONSE TIME18 daysTypical interval from fault to restoration on regional cable systems
FISHING ACTIVITY FAULTS64%Cable faults attributable to fishing gear and anchor contact
SYSTEM DESIGN LIFE25 yearsIntended service life before a system requires full replacement
Who funds the cable has changed and the industry has not fully adjusted. Around 58% of new capacity is funded by content operators rather than carrier consortia, and those investors size systems against their own platform traffic rather than against wholesale demand. Hyperscaler private and consortium capacity grows at 14.4% against 9.6% for the market. Suppliers organised around carrier procurement cycles are selling to a customer type that is shrinking.
Repair capability rather than manufacturing decides schedules. Restoration takes around 18 days on regional systems, constrained by vessel availability under zone maintenance agreements rather than by spare cable or jointing capacity. KT Submarine operates regionally on that basis. An operator choosing a supplier is partly choosing how quickly a cut gets fixed, and that consideration rarely appears in any technical evaluation.
"People assume submarine cable is about cable. In Korean waters it is about fishing boats and whether a repair ship is already somewhere else when your system breaks. The manufacturing is the easy part and nobody involved would tell you otherwise."
Director, Subsea Networks and International Connectivity Practice · MMA Technology Practice · September 2026

Market Trends

Content Operators Displaced Carrier Consortium Funding

Around 58% of new Korean-landing capacity is funded by content operators rather than by carrier consortia, and those investors size systems against their own platform traffic rather than against any wholesale demand forecast. Hyperscaler private and consortium capacity grows at 14.4% against 9.6% for the market. Suppliers organised around carrier procurement cycles and consortium governance are selling into a customer type that is steadily shrinking, and the new buyers negotiate quite differently. Consortium governance is being bypassed by investors who never needed it and negotiate on entirely their own timetables instead.
Market Impact: Vietnam routes compound at 15.8%
Fishing Activity Governs Route Selection Entirely

Around 64% of cable faults in Korean waters come from fishing gear and anchor contact, which is high even against regional comparisons and makes route engineering an exercise in avoiding vessels rather than minimising distance. That drives burial depth requirements, armouring specification and survey cost well above what open ocean segments require. Route permitting also involves fishing cooperative negotiation that adds schedule risk no technical assessment captures at all. Suppliers treating permitting as an administrative step after route selection discover the negotiation late, when only nine landing stations exist and alternatives are correspondingly scarce.
Market Impact: Design life runs 25 years

Market Opportunities and Growth Drivers

Southeast Asian Routes Absorb Growing Korean Traffic

Vietnam routes compound at 15.8%, faster than any other Korean international corridor, as manufacturing and data centre capacity shifts toward Vietnam and Indonesia and Korean operators follow that traffic. Those corridors were historically served indirectly through Hong Kong or Singapore. Direct routes reduce latency and remove dependence on chokepoints where regional cable faults concentrate, which matters more to content operators than to the carriers who previously specified these systems. Route positions established now persist for the whole design life of a system, which makes corridor timing worth more than any capacity argument.
Market Impact: Only 9 landing stations operate

Ageing Systems Approach End Of Design Life

Several Korean landings carry cables installed well over twenty years ago against a 25 year design life, which creates replacement demand independent of any traffic growth. Retiring a system also frees landing station capacity that permitting constraints make genuinely scarce around the Korean coast. Operators facing that decision are generally replacing with higher fibre pair counts rather than like for like, which lifts value per system considerably above the original. Landing station capacity freed by retirement is genuinely scarce, since permitting constraints make new sites difficult to establish anywhere along the coast.
Market Impact: Restoration takes 18 days

Market Restraints and Challenges

Landing Permits And Fishing Negotiations Delay Systems

Landing station approvals and fishing cooperative negotiations extend Korean project schedules well beyond what the marine engineering requires on its own. The root cause is that coastal waters are intensively fished and landing sites are contested locally rather than merely regulated. Commercially this creates schedule risk operators price into route decisions. Mitigation runs through early cooperative engagement, through landing at existing stations rather than new sites, and through route options developed in parallel. None of those removes the negotiation; they start it early enough that engineering rather than permitting sets the schedule.
Market Impact: Content funds 58% of capacity

Repair Vessel Availability Constrains Every Restoration

Restoration takes around 18 days on regional systems, and the constraint is vessel availability under zone maintenance agreements rather than spare cable or jointing capacity. The root cause is that few ships serve a large area and multiple faults compete for the same hull. Commercially this exposes operators to outages longer than their service commitments assume. Mitigation runs through dedicated vessel arrangements, through route diversity across separate systems, and through regional maintenance zone participation. Route diversity is consequently bought as insurance against restoration times that nobody can shorten quickly. Nobody can shorten it.
Market Impact: Fishing causes 64% of faults
3 additional market trends, 4 additional growth drivers, and 2 additional restraints and challenges are covered in the full report. Contact sales@marketmindsadvisory.com to access the complete intelligence.

Segment CAGR and Growth Architecture

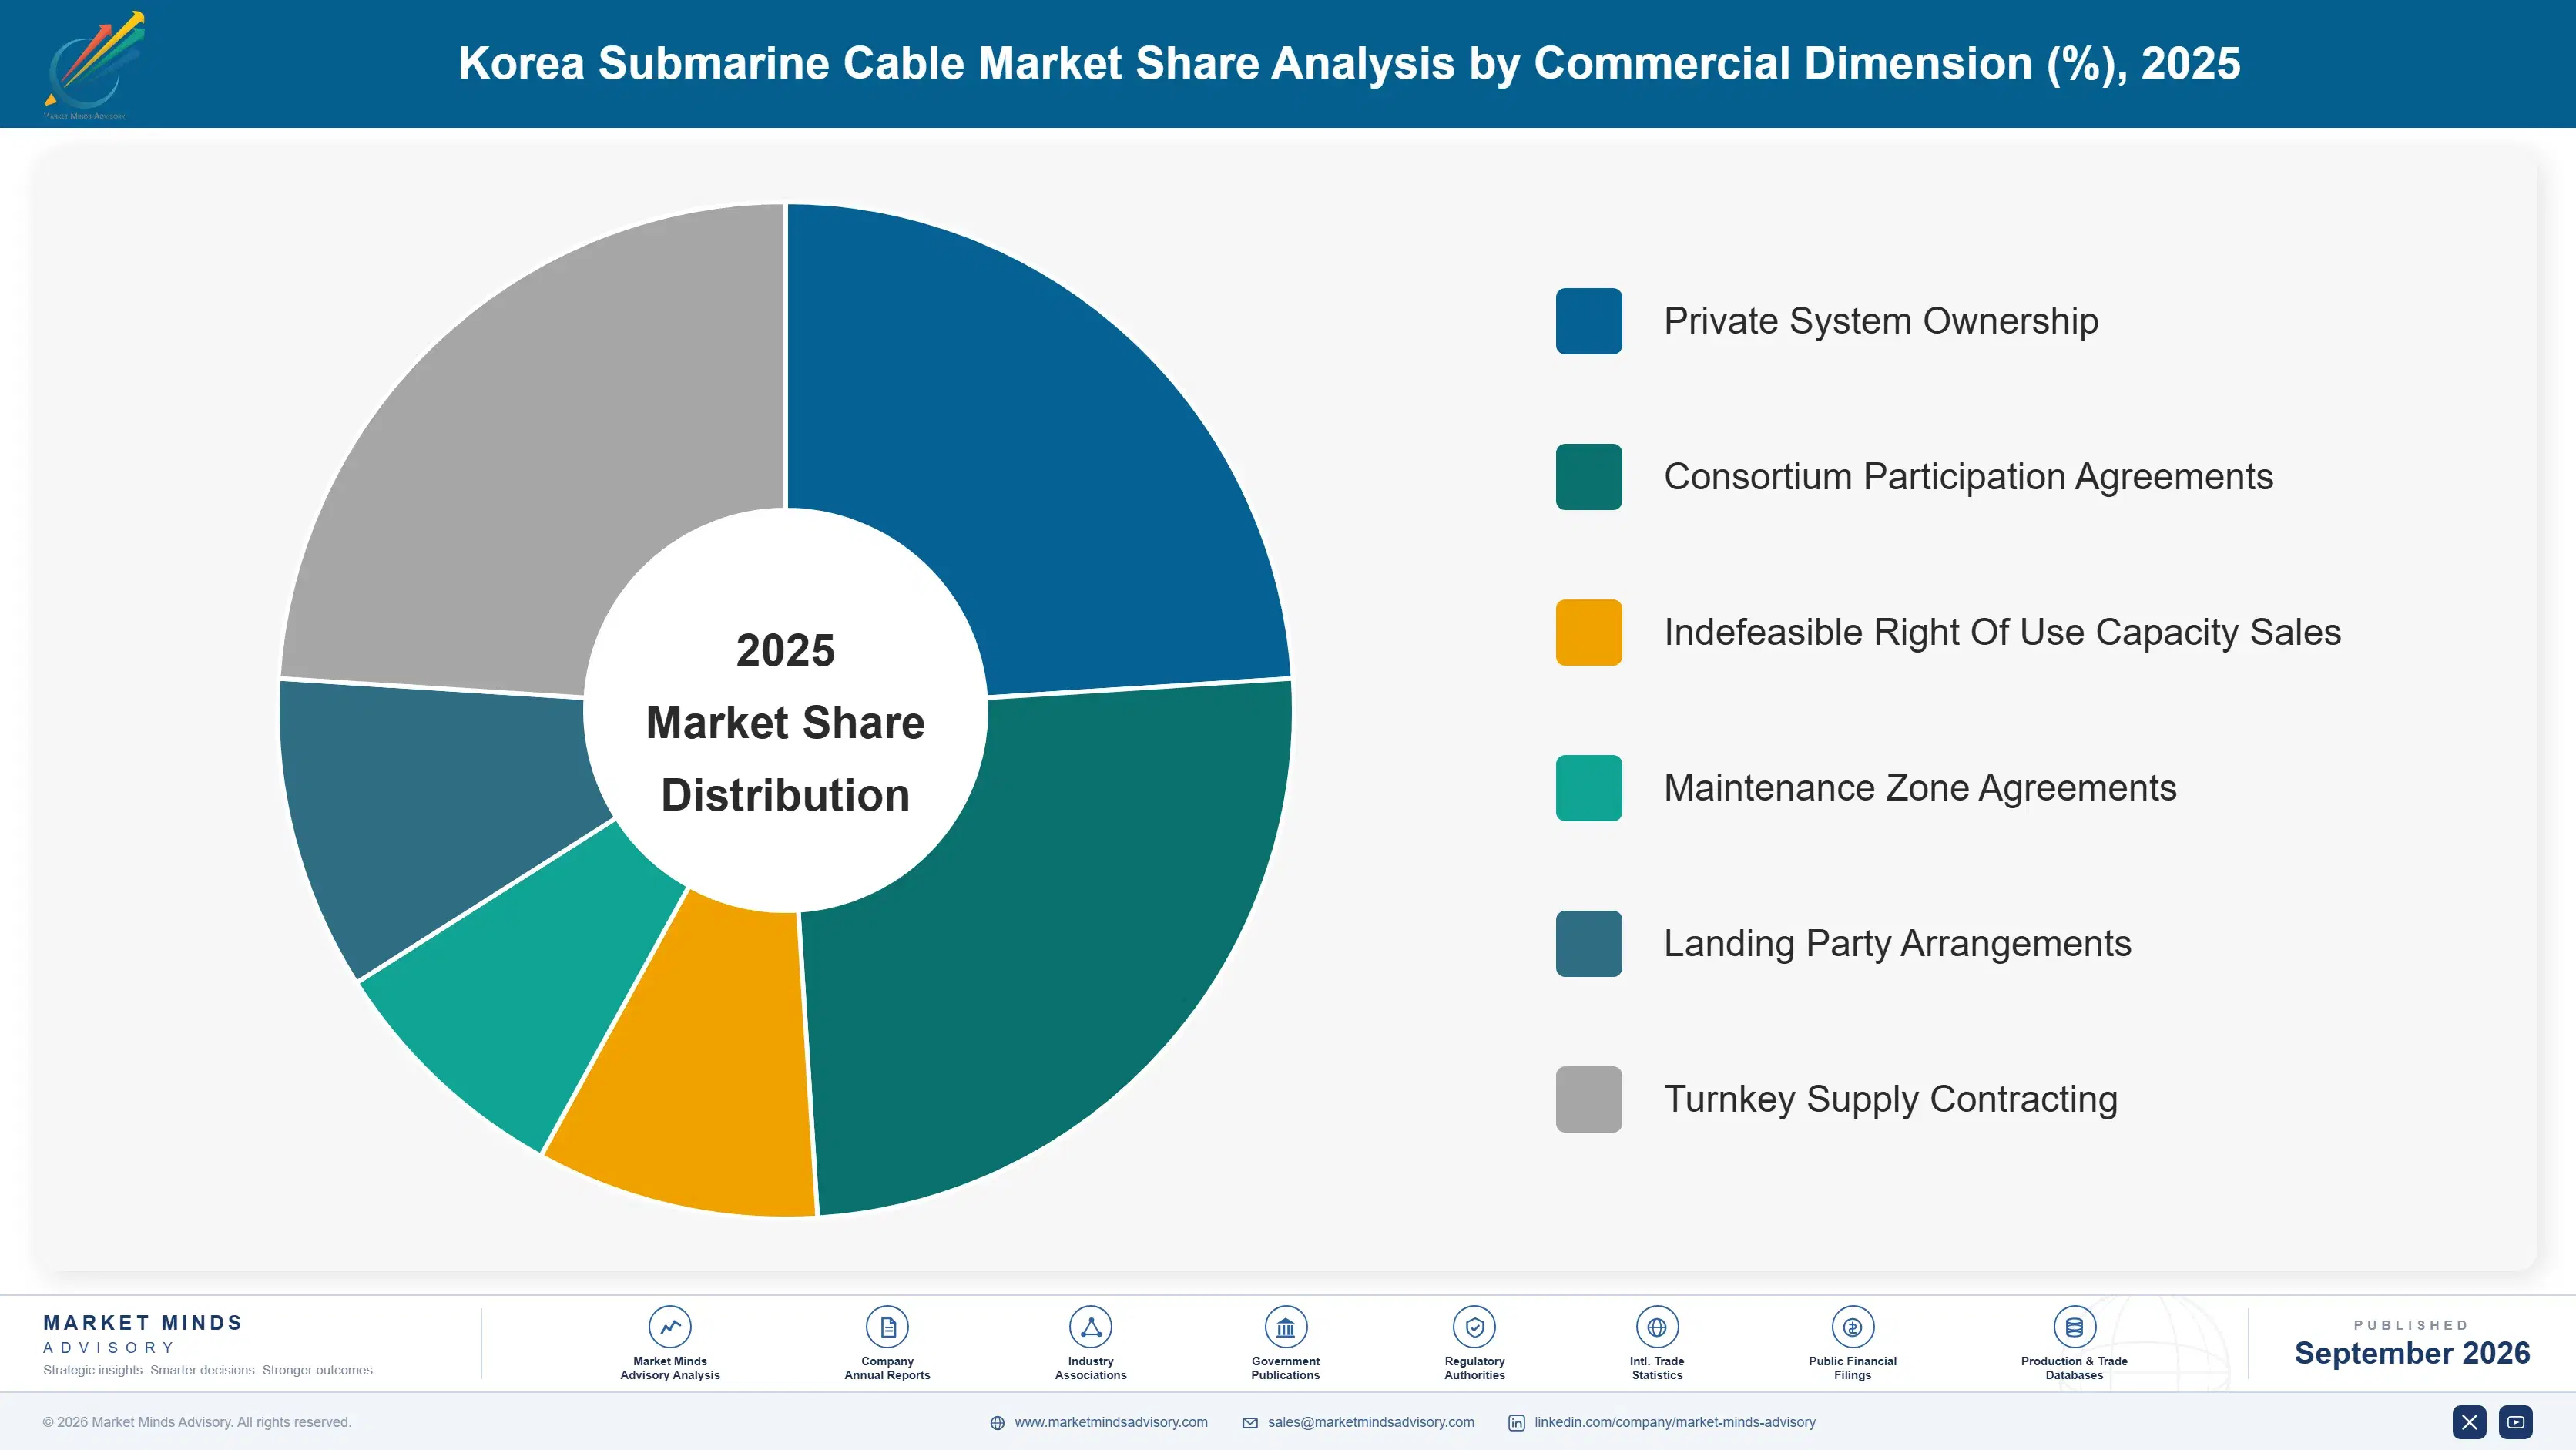
Segmentation follows system component and service class, since each carries quite different capital intensity, vessel dependency and buyer within a cable project. Six classes cover the market: hyperscaler private and consortium capacity, wet plant supply and installation, cable maintenance and repair services, submarine line terminal equipment, marine survey and route engineering, and cable landing station facilities and interconnection.
submarine-cable-industry-analysis-in-korea-market-share-analysis-1790000796342

Hyperscaler Private And Consortium Capacity

Hyperscaler private and consortium capacity grows at 14.4%, half again the market rate of 9.6%, because content operators now fund cables directly for their own platform traffic rather than buying capacity on systems that carriers built. Around 58% of new Korean-landing capacity arrives this way. These investors size against platform demand rather than wholesale forecasts, procure on their own timetables and negotiate quite differently from consortium governance, which suppliers organised around carrier relationships have found consistently difficult to adapt to across the past decade. Relationship terms matter more than transmission capability to these buyers. Suppliers built around consortium processes have found the adjustment consistently difficult across the past decade. The gap keeps widening.
CAGR 14.4%

Cable Maintenance And Repair Services

Cable maintenance and repair services compound at 11.7% because restoration takes around 18 days on regional systems and around 64% of Korean faults come from fishing gear and anchor contact, which makes repair frequency high rather than exceptional. The constraint is vessel availability under zone agreements rather than spare cable or jointing capability. KT Submarine operates in this segment regionally. Operators choosing a supplier are partly choosing restoration speed, though that consideration rarely appears explicitly in any technical evaluation. Recurring maintenance revenue also holds an account across a system's full design life, which installation contracts on their own never do. Installation contracts never do. Local fishing knowledge compounds with every fault worked.
CAGR 11.7%
Full segment breakdown across 6 segments available in the complete report.

Regional Architecture and Country Demand Map

This is a Korea scoped report, so the regional table records the international corridors Korean systems connect to rather than domestic geography. East Asia holds 46% through intra-regional routes and Korean domestic segments. North America carries 21% through transpacific systems. South Asia and Pacific carries 18% on fast-growing corridors.

East Asia

East Asia accounts for 46% of Korean submarine cable value, far above the usual band because this is a Korea scoped report and intra-regional routes to Japan, China and Taiwan alongside Korean domestic segments carry most of the traffic. Those corridors are short, heavily fished and consequently fault-prone, which raises maintenance value relative to installation value on these routes. NEC Corporation and HMN Technologies both supply regionally. Growth at 10.4% runs above the market rate on data centre interconnection between regional hubs. Fault frequency on these short heavily fished corridors is the highest anywhere Korea connects, which makes maintenance relationships worth considerably more than the installation contracts behind them. Repair frequency dominates the economics.
Share: 46% | CAGR: 10.4% (2026 to 2036)

North America

North America accounts for 21% of Korean cable value through transpacific systems carrying platform and enterprise traffic to United States landing points. These are the longest and most capital intensive routes Korea participates in, and content operators fund most new transpacific capacity rather than carrier consortia. SubCom supplies the majority of transpacific wet plant. Growth at 9.9% tracks platform traffic growth rather than any carrier wholesale demand, which has been flat for years across the corridor. Delivery certainty matters more here than anywhere else, since a schedule slip on a transpacific system directly affects platform capacity plans that were built around the service date. Capacity plans depend on the date.
Share: 21% | CAGR: 9.9% (2026 to 2036)
Regional intelligence for 5 additional markets available in the complete report: South Asia and Pacific, Western Europe, Middle East and Africa, Eastern Europe, Latin America. Contact sales@marketmindsadvisory.com.
submarine-cable-industry-analysis-in-korea-country-cagr-analysis-1790000796870

Where Korean Cable Value Sits

Content operators rather than carriers now fund the systems, fishing activity governs route engineering and cost, and repair vessel availability decides restoration rather than manufacturing capacity. The four levers below follow those conditions rather than any argument about fibre pair counts or transmission capability. Each addresses a commercial condition instead. Capability comes last here.

Sell To Platform Investors, Not Carrier Consortia

Around 58% of new Korean-landing capacity is funded by content operators sizing systems against their own platform traffic rather than wholesale demand. Those buyers procure on their own timetables and negotiate outside consortium governance entirely. Suppliers organised around carrier procurement cycles are calling on a customer type that keeps shrinking, and the commercial relationship a platform investor wants looks almost nothing like the consortium processes this industry was built around. Platform investors want speed and control rather than governance. Consortium processes reach nobody they need. Speed and control are what these buyers want.
Market Impact: Content now funds a full 58% of capacity

Price Repair Response Into The System Sale

Restoration takes around 18 days on regional systems and the constraint is vessel availability rather than manufacturing, yet repair capability rarely appears explicitly in technical evaluations. Suppliers who quantify restoration commitments alongside the wet plant sale reach an operator's actual exposure rather than its specification checklist. That reframing wins systems on a dimension competitors are not presenting, and it carries recurring maintenance revenue behind the initial installation contract. Maintenance revenue is steadier than installation revenue and considerably less lumpy across a system's life. That dimension goes unaddressed otherwise. Competitors present nothing comparable.
Market Impact: Restoration now takes a full 18 days regionally

Engage Fishing Cooperatives Before Route Approval

Around 64% of Korean cable faults come from fishing gear and anchor contact, and landing approvals involve cooperative negotiation that no technical assessment captures. Suppliers and operators engaging early convert a schedule risk into a manageable process. Those treating permitting as an administrative step after route selection discover the negotiation late, when only 9 landing stations exist and alternatives are correspondingly limited across the whole coastline. Cooperative agreement reached early converts an open-ended risk into a known duration. Engineering then sets the schedule. Alternatives along the coast are scarce. Nine stations leave little room.
Market Impact: Fishing now causes fully 64% of all faults

Follow Traffic Toward Southeast Asian Corridors

Vietnam routes compound at 15.8% as manufacturing and data centre capacity moves toward Vietnam and Indonesia and Korean operators follow it with direct systems. Those corridors also avoid chokepoints where regional faults concentrate, which content operators weigh far more heavily than carriers historically did. Suppliers positioned on transpacific and intra-regional routes alone are absent from the corridor growing fastest, and route positions established now persist for a system's whole life. A corridor position taken now lasts 25 years. Transpacific positions do not help here. Corridor timing beats capacity argument. Absence there is expensive.
Market Impact: Vietnam routes now compound at a full 15.8%

Who Controls the Margin Pool

Five participants hold 72% of Korean submarine cable value, which is very high and reflects installation and repair vessel availability rather than any manufacturing or transmission technology position. SubCom, Alcatel Submarine Networks, NEC Corporation, KT Submarine and HMN Technologies lead. All participants are assessed on Korean submarine cable system value rather than on broader telecommunications equipment or marine engineering businesses they also operate. Concentration this high reflects how few organisations own installation and repair hulls, which takes years and considerable capital to change.
Competition runs on vessel access and route experience in Korean and regional waters far more than on transmission capability, which converges across serious suppliers. The second dimension is relationship with content operators, since those investors now fund most new capacity and procure quite differently from the consortium processes this industry was built around. Transmission specification competes a distant third behind both of those.

Pressure is emerging from content operators contracting suppliers directly and bypassing carrier intermediation entirely. Rankings shift where Southeast Asian corridors grow and where ageing systems reach replacement, particularly across the Vietnam and Indonesia routes over the coming decade. Suppliers without regional vessel presence carry the most exposure to that shift in buyer behaviour.
submarine-cable-industry-analysis-in-korea-company-positioning-matrix-1790000797395

Competitive Moat and Risk Dimensions

SUBCOM

Moat: Transpacific Route Experience

SubCom holds route engineering and installation experience across transpacific systems that represent the longest and most capital intensive corridors Korea participates in. Content operators funding most new transpacific capacity value delivery certainty on routes where a schedule slip costs platform capacity plans directly. Competitors without comparable deep ocean installation record face a credibility gap that pricing does not close.
SUBCOM

Risk: Regional Repair Presence

Restoration near 18 days is governed by vessel availability under regional zone agreements, and a supplier without strong regional maintenance presence competes on installation while somebody else holds the recurring relationship. Repair revenue is steadier and less lumpy. Route experience wins the build and does not hold the account across a twenty-five year life.
KT SUBMARINE

Moat: Korean Waters Repair Capability

KT Submarine operates repair and maintenance capability in Korean and regional waters where around 64% of faults come from fishing activity and restoration takes about 18 days. That presence makes it the practical maintenance choice regardless of who supplied the original wet plant. Local knowledge of fishing patterns cannot be assembled quickly.
KT SUBMARINE

Risk: Wet Plant Scale Limits

Repair and maintenance capability does not extend to supplying wet plant for long transpacific systems, where scale and deep ocean installation record decide awards. That leaves the largest single contracts to global suppliers. A position strong in recurring regional services and absent from major system supply captures the steadier revenue and not the larger one.

Players Tracked

Prominent Players

SubCom
Alcatel Submarine Networks
NEC Corporation
KT Submarine
HMN Technologies

Other Key Players

Prysmian Group
NKT
Fujitsu
Ciena
Infinera
Nokia
LS Cable and System
Global Marine Group
E-Marine
Orange Marine
Elettra Tlc
Hexatronic
Xtera
Padtec
IT International Telecom

Recent Developments

MARCH 2025

Content Operators Contract Korean Landings Directly

Content operators contracted Korean cable landings and wet plant supply directly rather than through carrier consortium arrangements, a procurement development rather than any corporate transaction. Around 58% of new capacity is now funded this way, and those investors size systems against their own platform traffic rather than wholesale demand.
Signal: Consortium governance is now being bypassed by investors who never needed it in the first place.
SEPTEMBER 2024

Regional Cable Damage Raises Route Diversity Spending

Cable damage across regional chokepoints prompted Korean operators to fund alternative routing rather than expanding capacity on existing paths, a risk decision rather than any acquisition. Restoration near 18 days on regional systems is governed by vessel availability, and multiple simultaneous faults compete directly for the same limited repair hulls.
Signal: Route diversity is now bought as insurance against repair times that nobody can shorten quickly at all.
JUNE 2025

Vietnam Corridors Attract Direct Korean Capacity

Korean operators and content platforms funded direct capacity toward Vietnam and Indonesia rather than routing through established regional hubs, a routing development rather than any corporate event. Manufacturing and data centre capacity shifting toward those markets is what pulled the traffic, and direct routes also avoid chokepoints where faults concentrate.
Signal: Route positions established now will persist across a system's entire twenty-five year operating life ahead of it.

What A Cable System Costs

Wet plant manufacturing including cable, repeaters and branching units absorbs roughly 44% of Korean system cost, and repeater count drives that figure more than route distance alone does. Installation vessel operation takes around 27%, priced by day rate against schedules that permitting delays extend. Marine survey and route engineering absorb about 11%, with landing station works taking the remaining balance.
Installation vessel day rates rose sharply through 2023 and 2024 as global cable construction demand outpaced the available fleet, which has expanded slowly because ships take years to build. NEC Corporation Annual Report 2024 and Prysmian Group Annual Report 2024 both record vessel availability and copper and fibre input costs among principal operating variables. Suppliers owning vessels rather than chartering them retained margin that competitors could not.

The competitive disadvantage mechanism is vessel access rather than manufacturing cost. A supplier owning installation and repair hulls controls schedule and captures day rate margin, while one chartering competes for the same scarce ships at whatever the market charges. Exposure concentrates among suppliers without owned fleet, since permitting delays in Korean waters extend charter periods on projects that were priced against a shorter schedule.
submarine-cable-industry-analysis-in-korea-cost-volatility-analysis-1790000797597

Own Installation And Repair Vessels Rather Than Chartering

Installation vessel operation absorbs around 27% of system cost at day rates that rose sharply as construction demand outpaced a fleet expanding only as fast as ships can be built. Owned hulls control schedule and capture the day rate margin instead of paying it. The capital commitment determines who can credibly commit to a delivery date.

Develop Route Options In Parallel Before Permitting

Landing approvals and fishing cooperative negotiation extend Korean schedules beyond what marine engineering requires, and only nine landing stations operate around the coast. Carrying two viable routes through early permitting keeps a project moving when one path stalls. The survey cost of the second option is small against the vessel charter cost of a delayed installation programme.

Reduce Repeater Count Through Fibre Pair Optimisation

Wet plant absorbs roughly 44% of system cost and repeater count drives that more than route distance does. Designs balancing fibre pair count against repeater spacing reduce the most expensive component of the wet plant. The engineering trade is where deep transmission capability differentiates on cost rather than headline capacity. Headline capacity figures conceal that trade entirely.

Portfolio Architecture for Margin Defence

Margin architecture separates on recurrence and vessel dependency rather than on engineering difficulty. Submarine line terminal equipment earns least, since it competes against terrestrial optical vendors and gets refreshed on shorter cycles. Marine survey and landing station works sit above on specialisation. Maintenance services, hyperscaler capacity and wet plant supply earn most, because each combines scarce capability with either recurrence or scale.
The volume versus premium tension runs between installation contracts and maintenance recurrence, which reward opposite asset commitments entirely. Installation is lumpy, capital intensive and won on delivery certainty. Maintenance is steady, requires regional vessel presence and holds the customer across a system's twenty-five year life. Suppliers holding only one of the two either ride project cycles or never reach the largest contracts at all. Very few hold both properly.

High-value pools concentrate in maintenance services and in hyperscaler capacity relationships, and neither is reached through manufacturing capability. Maintenance requires regional vessel presence and local knowledge of fishing patterns and coastal conditions. Hyperscaler relationships require procurement approaches unlike consortium governance. Both explain why five participants hold 72% while the recurring revenue concentrates in fewer hands still.

Volume / Commodity-Adjacent

Submarine line terminal equipment, competing against terrestrial optical transmission vendors and refreshed on considerably shorter cycles than the wet plant it terminates. The twelve point spread separates suppliers integrating terminal equipment with system supply from those selling it standalone.
Gross Margin: 19% to 31%

Premium / Certified

Marine survey and route engineering and cable landing station facilities and interconnection, where local knowledge and permitting experience determine selection rather than any price comparison. The thirteen point spread tracks how much survey work each participant performs with owned rather than chartered marine assets.
Gross Margin: 36% to 49%

Sustainability / Regulatory / Next-Generation

Cable maintenance and repair services, hyperscaler private and consortium capacity and wet plant supply and installation, each combining scarce capability with recurrence or scale. The sixteen point spread reflects owned vessel position, which determines both schedule control and day rate margin.
Gross Margin: 54% to 70%
submarine-cable-industry-analysis-in-korea-portfolio-architecture-1790000798105

High-value Sub-segments and Strategic Watch-out

Hyperscaler Private And Consortium Capacity

Grows at 14.4% because content operators now fund cables directly for their own platform traffic. The sixteen point spread reflects vessel position. These investors procure on their own timetables entirely outside consortium governance arrangements. Relationship terms decide these awards. Timetables belong to the investor. Governance is absent.
Gross Margin: 54% to 70%

Cable Maintenance And Repair Services

Grows at 11.7% because around 64% of Korean faults come from fishing gear and restoration takes about 18 days. The sixteen point spread reflects regional vessel presence. Recurring revenue holds accounts across a system's whole design life. Regional presence cannot be improvised. Hulls decide restoration.
Gross Margin: 54% to 70%

Marine Survey And Route Engineering

Grows at 8.9% on route work made demanding by intensive fishing activity and contested coastal landing sites. The thirteen point spread reflects owned marine assets. Permitting experience matters more here than any survey technology does. Coastal landing sites are contested locally. Permitting beats survey technology.
Gross Margin: 36% to 49%

Submarine Line Terminal Equipment

Grows at 6.1%, slowest of the six classes, competing against terrestrial optical vendors on refresh cycles far shorter than the wet plant. The twelve point spread reflects system integration. Capacity upgrades happen without touching anything in the water. Terrestrial vendors compete here directly. Wet plant stays untouched.
Gross Margin: 19% to 31%

Why Repair Holds Accounts

The annuity here is the maintenance zone agreement rather than the installation contract. A system runs for around 25 years and gets cut repeatedly across that life, with roughly 64% of Korean faults coming from fishing activity. Whoever holds the maintenance relationship earns steadily for decades while installation revenue arrives once. Suppliers competing only for the build are competing for the lumpy half of a much longer commercial relationship.
Depth varies by whether the supplier has vessels in the region. Restoration near 18 days is governed by hull availability rather than by spare cable, and a supplier with a ship already in Korean or regional waters holds a position that cannot be replicated by a competitor promising to sail one in. Local knowledge compounds with every fault worked.

The buyer has changed more than the technology has. A carrier consortium evaluated capacity cost per unit against wholesale demand forecasts over long committee processes. A content operator evaluates whether the system serves its own platform traffic and lands on its own schedule. A risk function increasingly evaluates route diversity against chokepoint exposure. Only the first buyer used the procurement processes this industry was built around.
submarine-cable-industry-analysis-in-korea-end-use-penetration-index-1790000798619

What Wins Korean Systems

These are among the four positions where our research anticipates prominent divergence between winners and laggards over the coming forecast period. Each is grounded in the demand model, the regulatory perimeter, and the announced capacity pipeline.
01 / INVESTOR TYPE COVERAGE

Call On Platforms, Not Consortia

Around 58% of new Korean-landing capacity is funded by content operators sizing systems against their own platform traffic rather than against any wholesale demand forecast. Those buyers procure on their own timetables and negotiate entirely outside the consortium governance this industry spent decades building around. Suppliers organised around carrier procurement cycles keep calling on a customer type that is shrinking, and the relationship a platform investor wants looks nothing like it at any point in the process during the procurement.
02 / RESTORATION COMMITMENT SELLING

Quote The Repair, Not The Cable

Restoration takes around 18 days on regional systems and the binding constraint is vessel availability rather than manufacturing capacity or spare cable inventory anywhere. Repair capability nonetheless rarely appears explicitly in technical evaluations, which means an operator's real exposure goes unaddressed in the comparison. Suppliers quantifying restoration commitments alongside wet plant reach that exposure directly and win on a dimension no competitor is presenting, and the recurring maintenance revenue follows the installation contract for decades afterwards and across every subsequent fault.
03 / PERMITTING PATH MANAGEMENT

Talk To Fishermen Before Regulators

Around 64% of Korean cable faults come from fishing gear and anchor contact, and landing approvals involve cooperative negotiation that no technical route assessment captures at any stage. Suppliers and operators engaging early convert schedule risk into a manageable process with a known duration. Those treating permitting as an administrative step after route selection discover the negotiation late, when only nine landing stations exist and alternatives are scarce along the entire Korean coastline and difficult to establish anywhere new on that coastline.
04 / CORRIDOR POSITION TIMING

Land In Vietnam Before Everyone Does

Vietnam routes compound at 15.8% as manufacturing and data centre capacity moves toward Vietnam and Indonesia, and Korean operators are following that traffic with direct systems rather than routing through hubs. Those corridors also avoid the chokepoints where regional faults concentrate, which content operators weigh far more heavily than carriers ever did. Route positions established now persist for the entire twenty-five year design life of a system, which makes corridor timing worth more than capacity arguments made on capacity grounds alone.

Engagement Snapshot From the Field

A live engagement with an industry participant carrying material or product regulatory and market exposure ahead of a defining policy shift, showing how our research translates into a defensible multi-year portfolio strategy.
MARKET MINDS ADVISORY · CLIENT ENGAGEMENT SUMMARY
Korea Submarine Cable Producer Strategic Portfolio Review and Transition Roadmap 2026·Investment Scenario on Korea Submarine Cable Exposure Evaluation 2025-26
CLIENT PROFILE
A Korean network operator planning additional transpacific capacity on an existing corridor while its Southeast Asian traffic grew faster than anything else it carried. Management treated route selection as a capacity question, without examining how restoration times and chokepoint exposure differed between the corridors under consideration. Nobody had compared restoration exposure between the corridors under consideration at any point.
STRATEGIC CHALLENGE
Network planning wanted transpacific capacity on the established route for operational simplicity. Risk management wanted diversity after regional cable damage elsewhere. Nobody had compared restoration exposure between corridors, and a capacity commitment decision was due within two quarters that would fix the operator's routing for the following two decades. Neither position had been quantified.
MMA APPROACH
MMA compared corridor options on restoration exposure, fault history and chokepoint dependency alongside capacity cost, and modelled traffic growth by destination rather than in aggregate. We assessed landing permitting timelines for each option against the operator's committed service dates. Work drew on 47 expert interviews conducted in Q4 2025 with operators, suppliers and marine maintenance providers.
KEY FINDINGS
  1. Southeast Asian traffic was growing at more than 3 times the transpacific rate, and the planned investment addressed the slower of the two corridors.
  2. Restoration exposure on the established route ran materially longer than on direct Southeast Asian paths because of chokepoint fault concentration and vessel competition.
  3. Landing permitting on the preferred alternative site required fishing cooperative negotiation that had not been started at all (client-reported, unverified by MMA).
  4. Route positions taken on this decision would persist for roughly 25 years, which nobody in the planning process had stated explicitly anywhere.
CLIENT PROFILE
A Korean network operator planning additional transpacific capacity on an existing corridor while its Southeast Asian traffic grew faster than anything else it carried. Management treated route selection as a capacity question, without examining how restoration times and chokepoint exposure differed between the corridors under consideration. Nobody had compared restoration exposure between the corridors under consideration at any point.
STRATEGIC CHALLENGE
Network planning wanted transpacific capacity on the established route for operational simplicity. Risk management wanted diversity after regional cable damage elsewhere. Nobody had compared restoration exposure between corridors, and a capacity commitment decision was due within two quarters that would fix the operator's routing for the following two decades. Neither position had been quantified.
MMA APPROACH
MMA compared corridor options on restoration exposure, fault history and chokepoint dependency alongside capacity cost, and modelled traffic growth by destination rather than in aggregate. We assessed landing permitting timelines for each option against the operator's committed service dates. Work drew on 47 expert interviews conducted in Q4 2025 with operators, suppliers and marine maintenance providers.
KEY FINDINGS
  1. Southeast Asian traffic was growing at more than 3 times the transpacific rate, and the planned investment addressed the slower of the two corridors.
  2. Restoration exposure on the established route ran materially longer than on direct Southeast Asian paths because of chokepoint fault concentration and vessel competition.
  3. Landing permitting on the preferred alternative site required fishing cooperative negotiation that had not been started at all (client-reported, unverified by MMA).
  4. Route positions taken on this decision would persist for roughly 25 years, which nobody in the planning process had stated explicitly anywhere.
RECOMMENDED STRATEGY
Phase 1: Phase one: redirect the capacity commitment toward direct Southeast Asian routing, where traffic grows at more than three times the transpacific rate. Phase 2: Phase two: begin fishing cooperative negotiation immediately at the preferred landing site, since permitting rather than engineering sets the schedule. Phase 3: Phase three: evaluate restoration exposure alongside capacity cost on every future corridor decision rather than treating it as an operational detail.
OUTCOME
The operator redirected its capacity commitment toward direct Southeast Asian routing and opened cooperative negotiation early (client-reported, unverified by MMA). The system reached service on schedule, which comparable projects starting permitting later did not. Restoration exposure is now assessed alongside capacity cost on every corridor decision, which outlasted the engagement.

Frequently Asked Questions

Foundational context covering the market sizes, CAGR, scope, country, region and competition that inform every finding below. This section is provided to cover basics and most often pre-purchase conversations, answered from the MMA Primary Research Dataset.

What is the current size of the Korea Submarine Cable Market?

Korean value reaches USD 2.1 billion in 2026, measured across wet plant, terminal equipment, maintenance and capacity sales. The 2025 base was USD 1.9 billion.

How large will the Korea Submarine Cable Market be by 2036?

The market reaches USD 5.2 billion by 2036, an increase of USD 3.1 billion across the forecast period. That represents 2.48 times expansion from the 2026 base.

What is the CAGR for the Korea Submarine Cable Market 2026 to 2036?

The base case runs at 9.6% annually, with a bull case at 10.9% if Korean data centre capacity attracts regional hub traffic and a bear case at 8.4% if permitting friction delays systems.

Which segment is growing fastest?

Hyperscaler private and consortium capacity grows at 14.4%, half again the market rate of 9.6%. Content operators now fund cables directly rather than buying capacity from carriers.

Who are the major companies in the Korea Submarine Cable Market?

SubCom, Alcatel Submarine Networks, NEC Corporation, KT Submarine and HMN Technologies lead on Korean system value, holding 72% between them. Prysmian Group holds a smaller position.

Which country is growing fastest?

Vietnam routes compound fastest at 15.8%, as manufacturing and data centre capacity shifts there and Korean operators follow that traffic directly. Indonesia and Singapore follow behind.

Report Segmentation Architecture

The full report scope spans multiple orthogonal segmentation dimensions, with cross-tabulated demand data provided for each dimension pair. Coverage extends further to regional breakdowns, trend trajectories, and the competitive detail needed to support segment-level decision-making.

By System Component And Service Class

  • Hyperscaler Private And Consortium Capacity
  • Cable Maintenance And Repair Services
  • Wet Plant Supply And Installation
  • Marine Survey And Route Engineering
  • Cable Landing Station Facilities And Interconnection
  • Submarine Line Terminal Equipment

By End-Use Industry

  • Content And Cloud Platform Operators
  • Telecommunications Carriers
  • Enterprise And Financial Networks
  • Government And Defence Communications
  • Data Centre And Colocation Operators
  • Research And Education Networks

By Commercial Dimension

  • Private System Ownership
  • Consortium Participation Agreements
  • Indefeasible Right Of Use Capacity Sales
  • Maintenance Zone Agreements
  • Landing Party Arrangements
  • Turnkey Supply Contracting

By Region

  • East Asia
  • North America
  • South Asia and Pacific
  • Western Europe
  • Middle East and Africa
  • Eastern Europe
  • Latin America

Scope, Methodology, and Coverage

Every figure in this report is reproducible from documented input assumptions. The scope below maps the historical period, the forecast horizon, the segmentation dimensions, and the countries covered, alongside the underlying primary and qualitative methodology.
Historical Period
2020 to 2025
Forecast Period
2026 to 2036
Base Year
2025 (USD billions; MMA Primary Research Dataset, September 2026)
Market Definition
This report covers submarine cable systems serving Korea: wet plant supply and installation for international and domestic systems, submarine line terminal equipment at Korean landing stations, cable landing station facilities and interconnection, marine survey and route engineering, cable maintenance and repair under zone agreements, and capacity and indefeasible right of use sales on Korean-landing systems. It excludes terrestrial backhaul, satellite capacity, subsea power cables, offshore oil and gas umbilicals, and domestic data centre interconnection.
Quantitative Units
USD millions, Korean submarine cable system value; landing stations in operation; fibre pairs and design capacity; restoration response times in days; fault attribution by cause as a percentage; system design life in years; hyperscaler share of funded capacity.
Segmentation Dimensions
System component and service class; end-use buyer type; commercial contracting route; international corridor across seven regions.
Regions Covered
East Asia, North America, South Asia and Pacific, Western Europe, Middle East and Africa, Eastern Europe, Latin America
Countries Covered
South Korea, Japan, China, Taiwan, Hong Kong, Singapore, Vietnam, Indonesia, Malaysia, Philippines, Thailand, India, Australia, United States, Canada, United Kingdom, France, Egypt, United Arab Emirates, Chile.
Key Companies Profiled
SubCom, Alcatel Submarine Networks, NEC Corporation, KT Submarine, HMN Technologies, Prysmian Group, NKT, Fujitsu, Ciena, Infinera, Nokia, LS Cable and System, Global Marine Group, Orange Marine, Xtera.
Quantitative Methodology
Primary survey, n=3,800 respondents, Q4 2025, six countries; demand-side model with trade association cross-validation
Qualitative Methodology
47 expert interviews, Q4 2025; applied to validate demand model assumptions, identify emerging dynamics, and assess competitive positioning
Report Format
PDF and XLSX data workbook (Word format preview document)
Publisher
Market Minds Advisory
Report Code
MMA-2026-TEC-171
Published
September 2026
Contact
sales@marketmindsadvisory.com | www.marketmindsadvisory.com

Purchase the full Korea Submarine Cable Market Report (2026 to 2036).

This report sizes the Korean submarine cable market from 2026 to 2036 across six system components and service classes, six buyer types and seven international corridors. It explains why a closed northern border makes every bit of Korean international traffic leave by sea through only nine landing stations. Fishing activity causing around 64% of faults is analysed as the factor governing route engineering, burial specification and permitting schedules. Content operators funding around 58% of new capacity is examined as the shift displacing carrier consortium procurement. Corridor analysis explains why East Asia carries 46% of system value.
Six system components and service classes sized to 2036
Fault attribution quantified against route engineering requirements
Restoration response analysed against repair vessel availability
Twenty named participants assessed on Korean system value
Four revenue levers with quantified commercial impact
Anonymised operator route strategy engagement documented in full

Built For The People Who Decide

From boardroom strategy to bench-side execution, this report is read cover-to-cover by leaders shaping the next decade of their industry, turning demand scenarios, market dynamics and valuation benchmarks into decisions.
CXOs/ Presidents/ VPs/ Managers
M&A and Corporate Development
Strategy Teams and R&D Heads
Procurement and Product Directors
Regulatory and Compliance Leaders
Investor Relations and Equity Analysts