Market Minds Advisory
Styrenics Market

Styrenics Market: monomer exposure, compounding value and recycled content capability

One monomer sets nearly sixty percent of the cost across every product in this family, which means most producers are running a repriced petrochemical business while describing themselves as polymer companies.

Lead Analyst

Bilal Shaikh

Published

September 2026

Make Smarter Decisions with Customized Research Insights

Request a free sample report and evaluate market opportunities, growth trends, and competitive dynamics relevant to your business needs.

2025 MARKET VALUE$86.0BMarket Size 2025
2036 FORECAST VALUE$141.1BBase Case , 2026 to 2036
CAGR 2026 TO 20364.6 %Bull 5.9% / Bear 3.3%
INCREMENTAL OPPORTUNITY$51.1BNet 10- year value creation
EXPANSION MULTIPLE1.57x2036 value over 2026 base
Strategic Levers
M&A Pipeline
Regional Outlook
Country Rankings
Competitive Intelligence
Segmental Deep-dive
Call-Us : 91 93563 13602

Executive Snapshot and Market Trajectory

Styrenics is one monomer wearing six different product names. Styrene accounts for roughly 58% of delivered cost across the whole family, which means most producers are running a repriced petrochemical position while presenting themselves as polymer specialists to customers who long ago worked out exactly what the difference is worth.
Growth concentrates in styrenic block copolymers, expanding at 6.9%, where elastomeric behaviour without vulcanisation serves adhesives, medical tubing, footwear and asphalt modification in ways that no other styrenic product reaches. East Asia holds 37% of value, well above what any single region normally takes, because Chinese capacity dominates installed global supply and because the appliance and electronics manufacture consuming that output sits directly alongside it rather than importing.
The supplier base is fragmented for a capital-intensive industry, with the top five holding 26% of production capacity, and it divides between integrated petrochemical producers, independent styrenics specialists, Asian volume manufacturers and a long tail of regional compounders. Competition here runs on monomer position and compounding capability rather than on polymer technology of any kind. Recycled content requirements are the regulatory force now reaching styrenic packaging applications directly for the first time.
Market Definition
Styrenics comprises polymers built on the styrene monomer, spanning general purpose polystyrene, high impact polystyrene, expandable polystyrene, acrylonitrile butadiene styrene, styrenic block copolymers, and styrene acrylonitrile and specialty copolymers. Sizing covers polymer sold to converters and compounders at realised delivered price, including compounded and coloured grades and recycled material meeting equivalent specifications. Styrene monomer sold as a chemical, unsaturated polyester and styrene-butadiene latex, styrene-butadiene rubber for tyres, converted articles and foam products, and compounding performed on customer-owned resin all fall outside scope.
Base Year Value
$86.0B in 2025 (MMA Primary Research Dataset, August 2026)
Forecast Period
2026 to 2036, eleven discrete annual values
CAGR
4.6% base case. Bull 5.9%. Bear 3.3%.
Fastest Growth Segment
Styrenic Block Copolymers: 6.9% CAGR
Fastest Growth Country
India: 7.4% CAGR
Fastest Growth Region
South Asia and Pacific: 6.9% CAGR
Largest Region
East Asia: 37% of 2025 global value
Market Leaders
INEOS Styrolution, Chi Mei, LG Chem, Trinseo and SABIC lead on styrenics production capacity across polystyrene, copolymer and elastomer classes. Source: MMA Primary Research Dataset, July 2026.
Primary Survey
n=3,800 procurement and R&D decision-makers, Q4 2025, six countries
Methodology
Demand-side build-up, cross-validated against public data, 47 expert interviews

Styrenics Market Forecast Scenarios

styrenics-market-trends-size-forecast-scenario-1787310868589
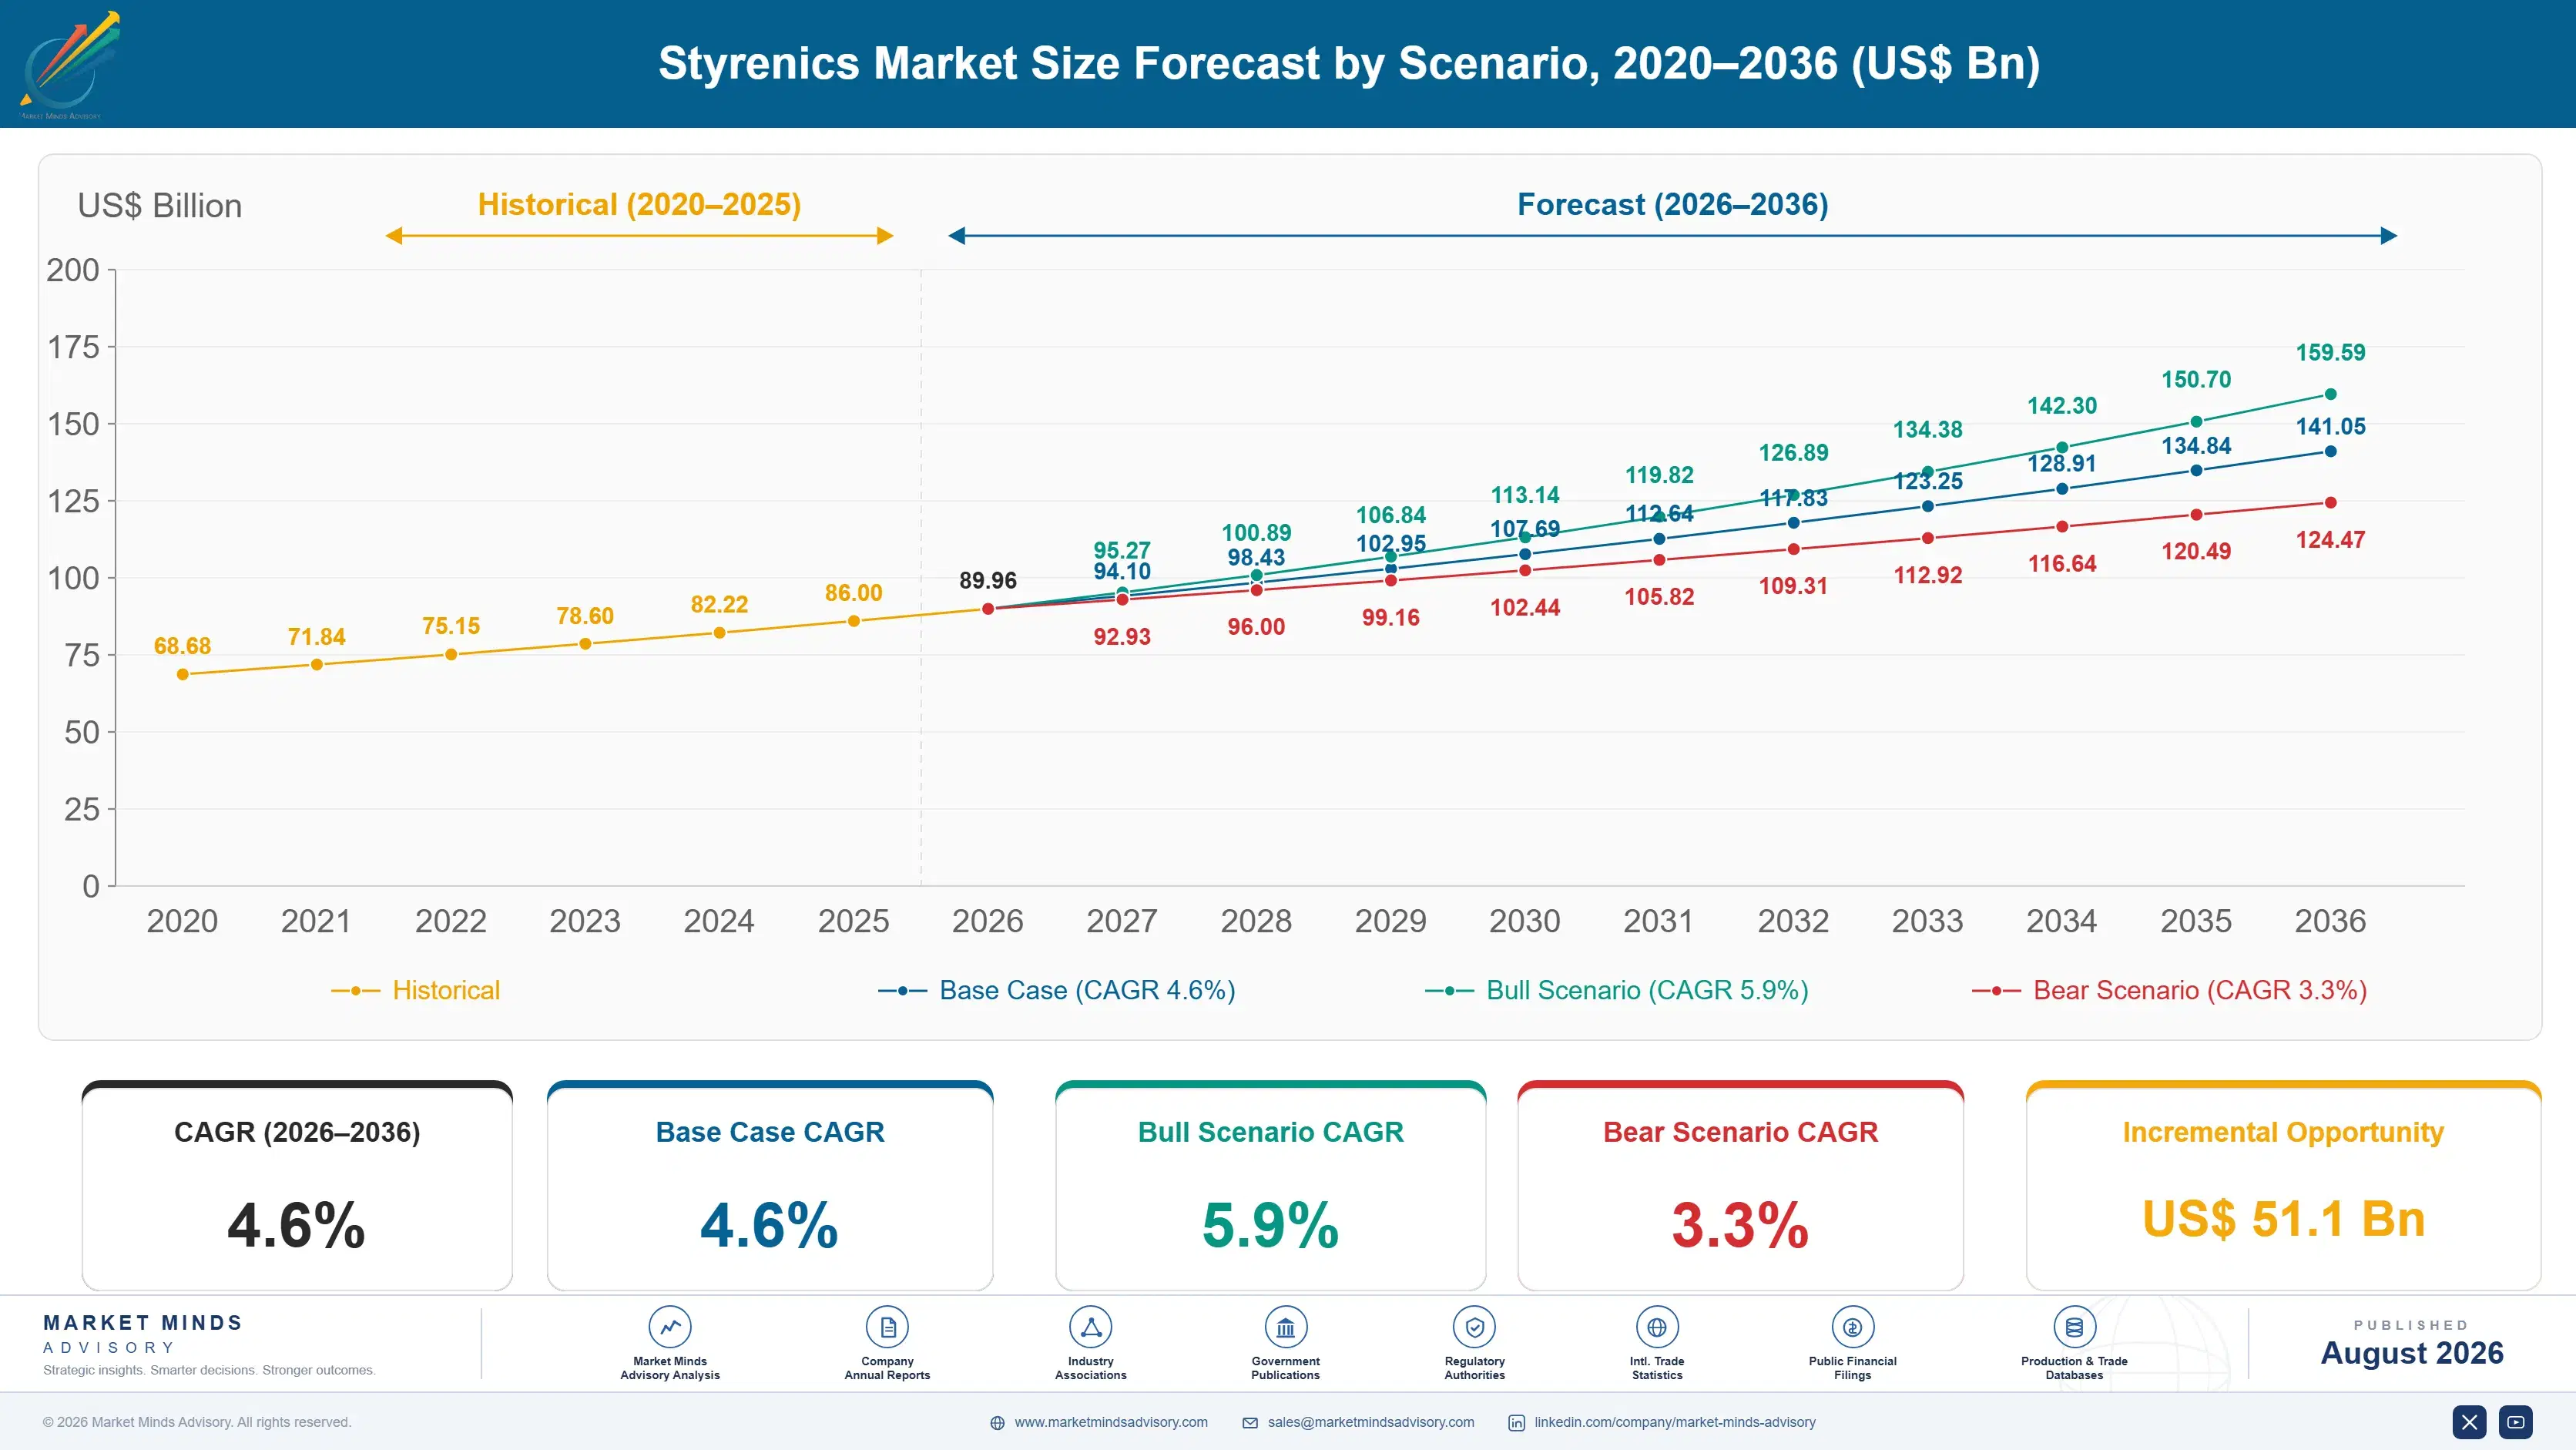
Growth of 3.4% across 2020 to 2025 was weaker than the applications alone would suggest. Packaging and appliance demand surged through 2020 and 2021 and then unwound as households stopped replacing goods, while European producers faced energy and monomer costs that closed several plants permanently rather than temporarily. Chinese capacity commissioned through the same window arrived into a softer market and pushed regional operating rates down further.
The base case at 4.6% rests on three mechanisms. Appliance and consumer electronics manufacture keeps expanding across South and Southeast Asia, and acrylonitrile butadiene styrene remains the default housing material on surface finish and impact behaviour together. Styrenic block copolymers keep taking share in adhesives, medical tubing and asphalt modification where no substitute performs comparably. And packaging demand grows with formal retail penetration across emerging markets rather than in developed ones.
The bull case at 5.9% turns on recycled styrenic capacity reaching commercial scale faster than currently modelled, since food contact approved recycled polystyrene would reopen packaging applications that regulation has been steadily closing. The bear case at 3.3% turns on substitution. Single-use restriction, polypropylene displacement in packaging and paper alternatives in food service each remove styrenic volume permanently rather than repricing it.

Styrenics: monomer exposure against compounding value

Everything in this market resolves to one question that most producers would rather not answer directly: what did the styrene cost. Monomer carries roughly 58% of delivered polymer cost across every product in the family, which makes an integrated position worth more than any amount of polymer technology and explains why merchant buyers become pure price takers in every tight quarter without a single exception.
TOP FIVE CONCENTRATION26%Share of global styrenics production capacity held collectively
STYRENE MONOMER COST SHARE58% of COGSPortion of delivered cost tied to the monomer
APPLIANCE AND ELECTRONICS SHARE34% of volumeLargest single application by consumed polymer tonnage globally
SINGLE COUNTRY CAPACITY SHARE46%Share of installed global capacity in one country
GLOBAL OPERATING RATE76%Average utilisation across installed styrenics capacity worldwide today
RECYCLED CONTENT REQUIREMENT25% by 2030Packaging mandate now reaching styrenic food service applications
The second number is operating rate. Global utilisation sits near 76%, which is low enough that the marginal producer sets price most of the time and earns nothing above cash cost while doing it. Capacity commissioned in China through the last decade arrived into softer demand than the sanctioning cases assumed, and European closures have removed supply without restoring anything resembling balance.
Value separates according to whether the customer is buying resin or a solved problem. Natural resin sold against a datasheet earns whatever the marginal producer allows. Compounded, coloured and specification-qualified grades for appliance housings, automotive interiors and medical applications earn considerably more, because the customer is buying colour matching, impact retention and regulatory documentation rather than simply a polymer.
"Producers in this industry keep presenting themselves as polymer companies while nearly sixty percent of their cost sits in a monomer somebody else prices. The ones actually earning anything either own the monomer or have moved far enough downstream that the customer is buying something other than resin."
Director, Polymers and Petrochemicals Practice · MMA Chemicals and Materials / P

Market Trends

Recycled content requirements reaching styrenic packaging applications directly

Packaging recycled content mandates rising toward 25% by 2030 now reach styrenic food service and rigid packaging, where collection rates have historically been poor and food contact approval for recycled material remains genuinely difficult. Chemical recycling back to styrene monomer is the technically credible route, since depolymerisation returns a monomer that can be purified to virgin specification rather than a degraded polymer. Several demonstration plants are operating and none is yet at commercial scale. Producers holding depolymerisation capability or secured offtake are positioning for applications that regulation would otherwise close entirely.
Market Impact: Consumes 34% of global volume
Styrenic block copolymers displacing vulcanised rubber across applications

Styrenic block copolymers behave elastomerically without vulcanisation, which means they can be melt processed, reworked and recycled in ways that thermoset rubber never permitted. Adhesives, medical tubing, footwear soling and asphalt modification are between them the principal applications, and each selects the material on processing behaviour rather than on cost per kilogram. Asphalt modification in particular grows with road construction budgets and with specifications requiring longer pavement life. Realised pricing here runs well above commodity styrenics levels, and the qualified producer field is considerably narrower than it is anywhere in polystyrene.
Market Impact: Contributes to 6.9% copolymer growt

Market Opportunities and Growth Drivers

Appliance and electronics manufacture expanding across South and Southeast Asia

Acrylonitrile butadiene styrene remains the default material for appliance housings, consumer electronics enclosures and sanitary ware, because it combines surface finish, impact behaviour and dimensional stability in a way that alternatives match only individually. Manufacturing for those goods keeps shifting toward India, Vietnam, Thailand and Indonesia as production relocates and as domestic ownership rates climb from a low base. Each new assembly plant specifies particular grades and matched colours rather than simply buying generic tonnage. Appliance and electronics applications already account for fully 34% of global styrenics volume measured worldwide.
Market Impact: Holds operating rates near 76%

Asphalt modification demand rising with pavement durability specifications

Road authorities have moved toward specifying pavement service life rather than material composition, and polymer modified binder using styrenic block copolymer delivers rutting and cracking resistance that unmodified bitumen cannot. The cost premium is repaid several times over in resurfacing intervals, which passes any highway authority assessment once whole-life costing replaces the initial tender price. Adoption is furthest advanced across Europe and North America and is now spreading steadily through Asian highway programmes. This one application alone drives a meaningful share of the 6.9% growth recorded across styrenic block copolymers.
Market Impact: Removes 2 million tonnes of demand

Market Restraints and Challenges

Persistent overcapacity holding operating rates below economic levels

Global styrenics utilisation sits near 76%, low enough that the marginal producer sets price in most quarters and earns nothing above cash cost. The root cause is capital cycle timing: Chinese capacity sanctioned during a strong period arrived into softer demand, and European closures have removed high-cost supply without restoring anything much resembling balance. Commercially this caps returns for every producer in the industry rather than only for the newest entrants. Participants are responding by closing uncompetitive European and Japanese assets permanently, shifting mix toward compounded grades and slowing further greenfield commitments.
Market Impact: Mandates 25% recycled content by 20

Packaging restriction removing established styrenic demand pools permanently

Expanded polystyrene food service and rigid polystyrene packaging face restriction across an expanding list of jurisdictions, driven by litter visibility and by recycling rates that have never been good. The root cause is collection economics rather than any property of the polymer, since low density makes kerbside collection uneconomic in ways that heavier plastics avoid. Commercially the affected volumes are modest so far, but the direction of travel is entirely consistent. Producers are responding with chemical recycling investment, mono-material designs improving recyclability, and reformulation toward applications regulation is unlikely to reach.
Market Impact: Grows 6.9% annually through 2036
2 additional market trends, 4 additional growth drivers, and 3 additional restraints and challenges are covered in the full report. Contact sales@marketmindsadvisory.com to access the complete intelligence.

Segment CAGR and Growth Architecture

Segmentation follows the polymer class, because each combination of styrene with a comonomer or blowing agent produces a distinct property set, application field, capital intensity and regulatory position. Six classes cover the whole market, running from the polystyrene grades that dominate volume through the engineering copolymers to the block copolymers growing fastest of all.
styrenics-market-trends-market-share-analysis-1787310869416

Styrenic Block Copolymers

Expanding at 6.9% annually, a full 1.50 times the market rate, on copolymers that behave elastomerically without any vulcanisation step, which means they can be melt processed, reworked and recycled in ways that thermoset rubber never once permitted. Adhesives, medical tubing, footwear soling and polymer modified asphalt binder are the principal applications, and each selects on processing behaviour rather than cost per kilogram. Asphalt modification in particular grows as road authorities move toward specifying pavement service life instead of material composition, which whole-life costing consistently favours. Realised pricing runs well above commodity styrenics, and the qualified producer field here is considerably narrower than anywhere else in this whole polymer family.
CAGR 6.9%

Styrene Acrylonitrile and Specialty Copolymers

Growing at 6.0% annually on copolymers where transparency, chemical resistance and dimensional stability together govern the specification rather than impact strength, which is a quite different requirement set from the acrylonitrile butadiene styrene grades they usually sit alongside. Household appliance components, cosmetic packaging, medical devices and instrument housings between them consume most of the volume, and each of them specifies a particular grade rather than buying against generic tonnage. Asian producers between them hold most of the installed capacity worldwide, with Taiwanese and Korean positions built on several decades of appliance and electronics qualification work. Demand here tracks durable goods and medical device manufacture rather than any packaging cycle whatsoever.
CAGR 6.0%
Full segment breakdown across 6 segments available in the complete report.

Regional Architecture and Country Demand Map

Styrenics capacity and consumption both tend to concentrate wherever the appliance, electronics and packaging conversion work is actually being done, and that conversion activity has moved decisively eastward across the last two decades, taking most of the installed production base along with it as it moved.

East Asia

Thirty-seven percent of global value here, comfortably the largest regional share of all, because Chinese capacity now dominates installed global supply while the appliance, electronics and packaging conversion consuming that output sits directly alongside it rather than importing from anywhere. Note: this exceeds the standard regional band because roughly 46% of installed global capacity sits in China alone, a concentration that no consumption-side measure would ever capture. Taiwanese and Korean producers hold grade and colour technology positions in acrylonitrile butadiene styrene built up over several decades of appliance qualification work. Growth of 5.5% here runs above the global rate, supported by continued electronics manufacture and by rising copolymer demand together.
Share: 37% | CAGR: 5.5% (2026 to 2036)

North America

Twenty-two percent of global value here, weighted heavily toward the packaging, appliance manufacture, construction insulation board, and a substantial styrenic block copolymer position that serves both the adhesives and the asphalt modification markets directly. Gulf Coast integration gives producers here reasonably good monomer positions relative to their European competitors, though nothing at all comparable to the advantaged ethane economics available across polyolefins. Highway resurfacing programmes now specifying pavement service life rather than binder composition drive block copolymer demand steadily upward right across the region. Growth of 4.0% here reflects a mature packaging demand base alongside the asphalt modification and adhesive applications that keep expanding right across the region each year.
Share: 22% | CAGR: 4.0% (2026 to 2036)
Regional intelligence for 5 additional markets available in the complete report: Western Europe, South Asia and Pacific, Latin America, Middle East and Africa, Eastern Europe. Contact sales@marketmindsadvisory.com.
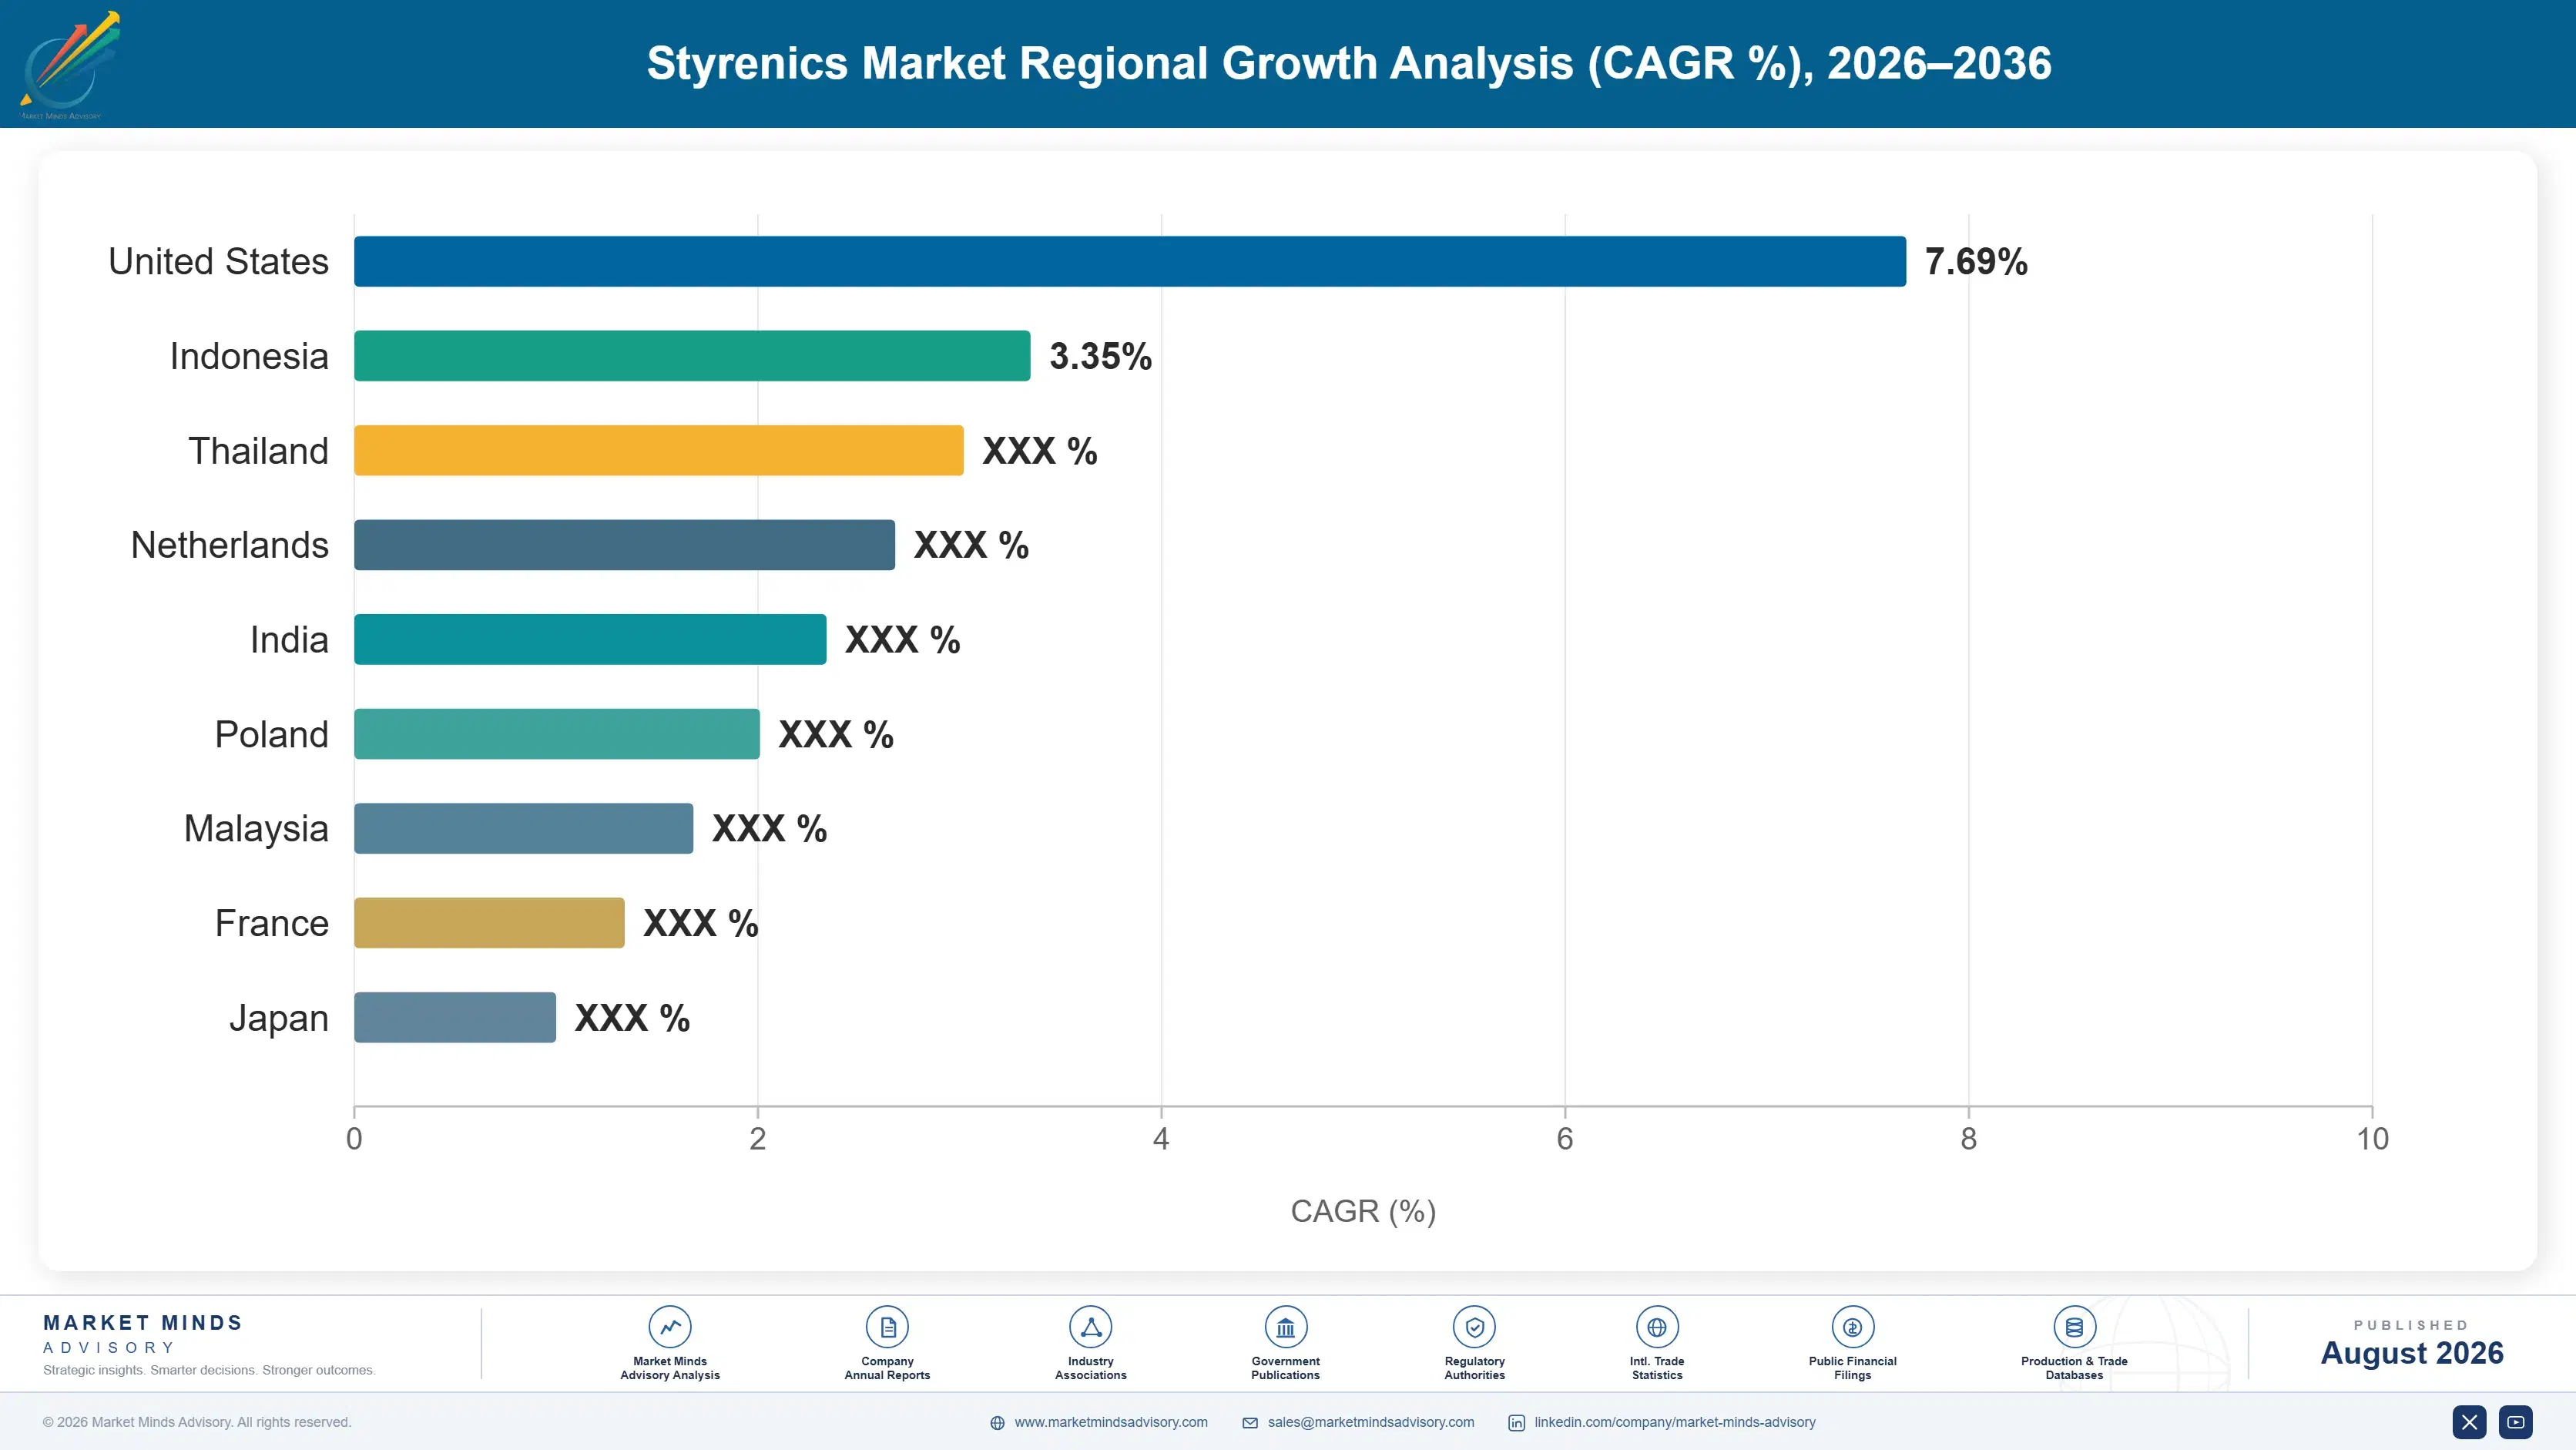
styrenics-market-trends-country-cagr-analysis-1787310870198

Where styrenics margin actually survives

Four commercial positions separate producers earning something above cash cost from those clearing tonnes into a market the marginal plant already prices. Each one of them rests on something that capacity alone cannot deliver: compounding capability, a qualified customer specification, an integrated monomer position, or else recycled capability built well before regulation demanded any of it.

Sell compounded and coloured grades instead of natural resin

Natural resin sold against a datasheet earns whatever the marginal producer allows in that quarter, while a compounded, coloured and impact-modified grade matched to a customer's moulding process earns considerably more, because the customer is buying a solved problem. Producers integrating into compounding lift realised margin by roughly 14 percentage points on the converted volume, against capital that is a small fraction of a polymerisation line. The barrier is commercial rather than technical, since it requires selling to application engineers rather than to the resin buyers that everybody in this industry already knows.
Market Impact: Lifts realised margin by roughly 14

Qualify into appliance and automotive specifications early

Appliance and automotive programmes qualify a grade on colour matching, impact retention after ageing and regulatory documentation, and that qualification then supplies the platform for its whole production life. Producers achieving design-in capture roughly 5 times the lifetime volume of those bidding against annual purchasing reviews, because requalification costs a customer far more than any price difference saves. Engagement must begin with the design and materials engineers rather than with procurement. Most styrenics producers still sell only to resin buyers and never reach the people who actually make the decision.
Market Impact: Captures roughly 5 times the lifeti

Secure integrated styrene monomer supply before adding capacity

Styrene carries roughly 58% of delivered polymer cost, which means an integrated monomer position is worth considerably more than any polymer technology advantage available in this industry. Integrated producers run roughly 23% below merchant monomer buyers on delivered cost, and that gap widens sharply in every tight quarter, which is precisely when the polymer is worth most. Adding polymerisation capacity without first securing the monomer position has been the recurring error right across this industry. Merchant buyers become pure price takers at exactly the point when they can least afford to be.
Market Impact: Runs roughly 23% below merchant mon

Build depolymerisation capability ahead of recycled mandates

Recycled content requirements rising toward 25% by 2030 now reach styrenic packaging, and chemical recycling back to styrene monomer is the only route returning material that can be purified to virgin specification for food contact. Producers holding depolymerisation capability or secured offtake command roughly 30% above virgin pricing on compliant grades, because supply is scarce and the obligation is not optional. Several demonstration plants are operating and none of them is yet at genuine commercial scale. The feedstock collection relationships matter more than the technology and are being contracted now.
Market Impact: Commands roughly 30% above virgin r

Who Controls the Margin Pool

Concentration is low for an industry this capital-intensive, with the top five holding 26% of styrenics production capacity, the basis on which every participant here is assessed. INEOS Styrolution and Chi Mei lead through scale combined with grade breadth rather than through technology, while the remaining field spans integrated petrochemical producers, Asian volume manufacturers, block copolymer specialists and independent compounders serving particular application niches.
Competition currently runs on monomer cost position, compounding capability and qualified customer specifications rather than on polymer technology, which has been broadly available for decades. Integrated producers compete against merchant buyers on a cost gap that widens whenever styrene tightens. Compounding and colour capability has become a genuine differentiator as customers have moved steadily from buying resin toward buying finished grades.

Emerging pressure comes from two directions at once. Chinese capacity continues rising, while self-sufficiency there removes the export destination that supported capacity elsewhere. And recycled content obligations increasingly reward producers holding depolymerisation capability rather than those with the largest polymerisation trains, which means rankings in European and North American packaging grades may shift toward companies holding secured recycled feedstock positions.
styrenics-market-trends-company-positioning-matrix-1787310870715

Competitive Moat and Risk Dimensions

INEOS STYROLUTION

Moat: Grade breadth and monomer integration

Breadth across polystyrene, acrylonitrile butadiene styrene and specialty copolymers combined with monomer integration at several sites lets INEOS Styrolution serve a customer's whole styrenics requirement while holding a cost position merchant buyers cannot approach. In a family where one monomer carries most of the cost, that integration is worth considerably more than any polymer technology advantage.
INEOS STYROLUTION

Risk: European asset base exposure

A substantial European asset base carries energy and monomer costs that repriced permanently through 2022, and packaging restriction reaches styrenic applications there sooner than anywhere else. The combination compresses both the cost position and the addressable market simultaneously, and closing capacity recovers cash without recovering the customer relationships those plants supported.
CHI MEI

Moat: Appliance grade qualification depth

Decades of appliance and electronics qualification give Chi Mei colour matching, impact retention and specification documentation positions across a very large installed customer base in exactly the applications that consume most acrylonitrile butadiene styrene. Those qualifications supply platform lifetimes rather than annual tenders, which produces revenue predictability that commodity polystyrene producers simply never achieve.
CHI MEI

Risk: Merchant monomer cost exposure

Buying a substantial share of styrene monomer merchant leaves Chi Mei exposed in every tight quarter, when integrated competitors hold a cost advantage near a quarter of delivered polymer cost. Qualification positions protect premium appliance grades where specifications govern, but they offer far less protection in the commodity polystyrene volumes that keep polymerisation lines loaded.

Players Tracked

Prominent Players

INEOS Styrolution
Chi Mei
LG Chem
Trinseo
SABIC

Other Key Players

Kumho Petrochemical
Formosa Chemicals and Fibre
Kraton
Dynasol
TSRC
Versalis
Synthos
Denka
Techno-UMG
Asahi Kasei
Zhejiang Petroleum and Chemical
Shanghai Highpolymer
Supreme Petrochem
TotalEnergies
Elix Polymers

Recent Developments

FEBRUARY 2025

European producer closes styrenics capacity permanently

A European styrenics producer confirmed the permanent closure of its polymerisation capacity at one site, citing energy and monomer costs that had repriced against Asian and Gulf competitors and regional demand that packaging restriction had permanently reduced rather than merely postponed for a period or two.
Signal: European styrenics capacity is now leaving
JUNE 2025

Depolymerisation plant reaches sustained commercial operation

A chemical recycling facility depolymerising post-consumer polystyrene back to styrene monomer reached sustained commercial operation through the whole year, producing recovered monomer purified to virgin specification and therefore suitable for the food contact applications that mechanically recycled material has never once been able to serve.
Signal: Chemical recycling back to monomer is now
OCTOBER 2025

Highway authority specifies pavement life over binder composition

A national highway authority moved toward specifying pavement service life rather than binder composition right across the whole of its national resurfacing programme, a change which whole-life costing then consistently resolves in favour of polymer modified binder using styrenic block copolymer over any unmodified bitumen alternative.
Signal: Whole-life specification is now pulling st

Styrene monomer and comonomer exposure

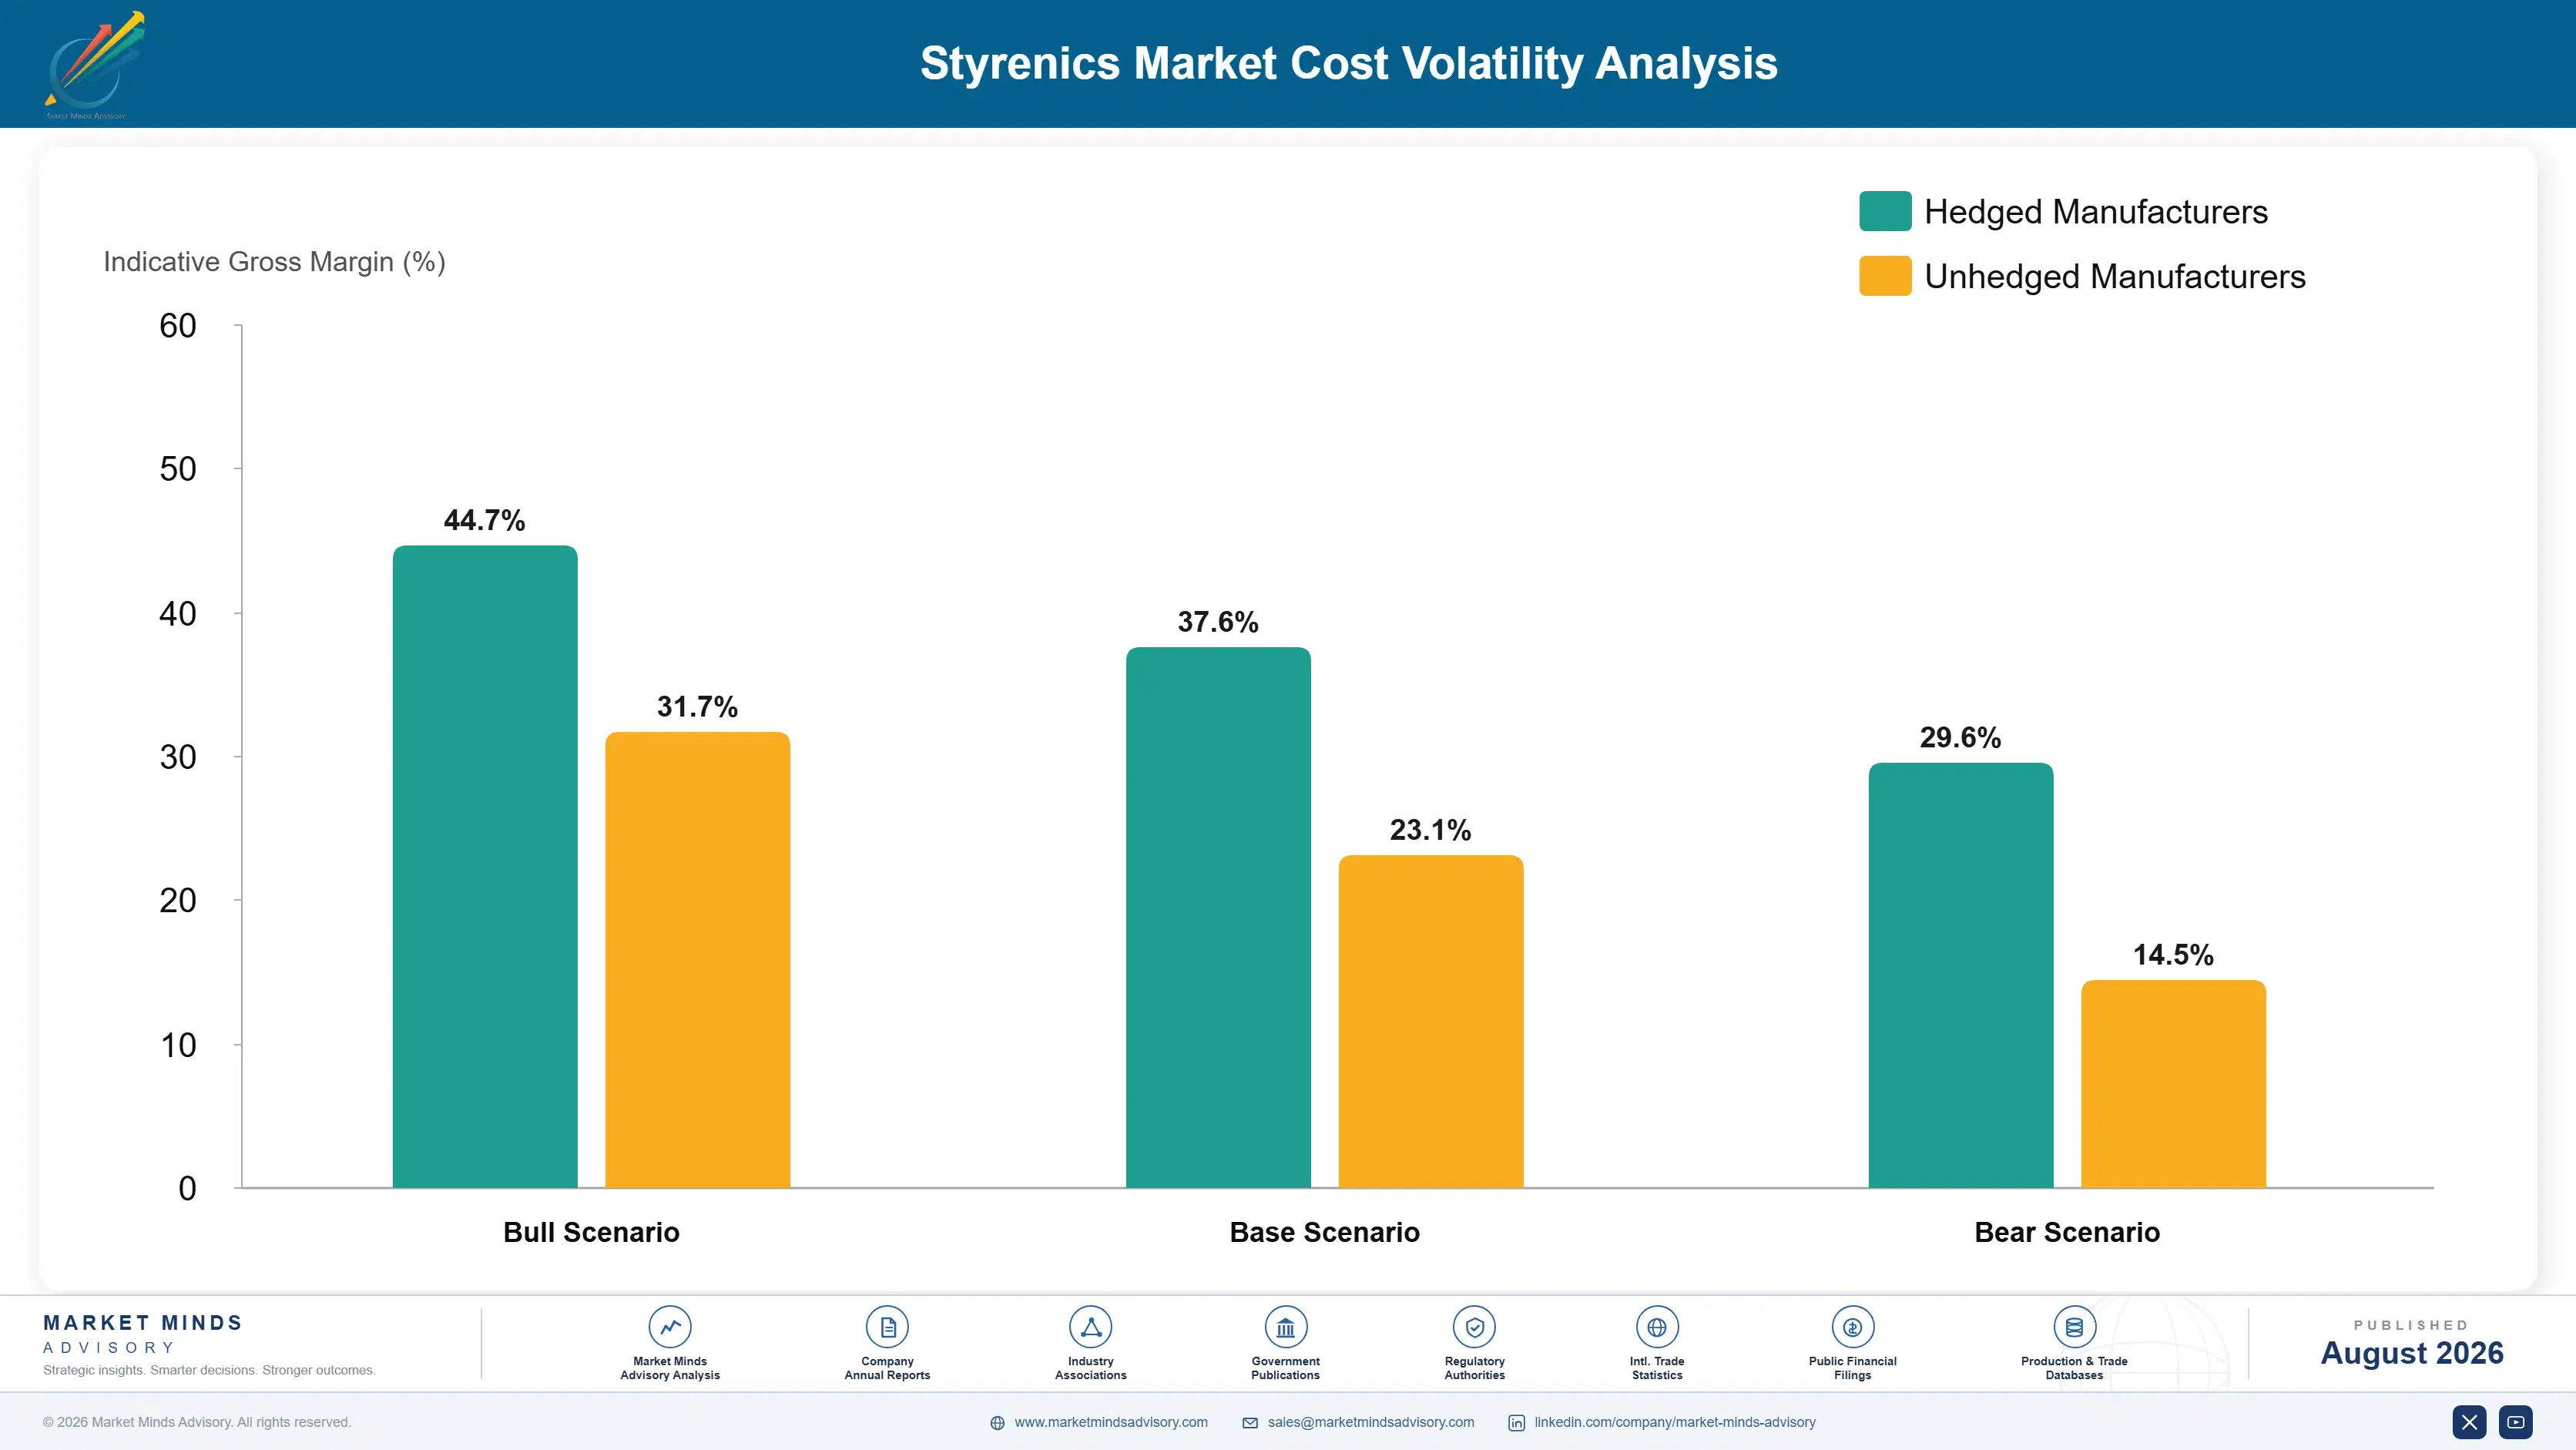
Styrene monomer accounts for roughly 58% of delivered styrenics cost, produced from benzene and ethylene by integrated petrochemical producers and traded merchant into everybody else. Comonomers contribute about 12%, principally acrylonitrile and butadiene for the copolymer grades, polymerisation and finishing energy around 9%, additives and colourants 6%, conversion labour and maintenance 7%, with packaging, freight and working capital carrying the remaining 8%.
Monomer and energy moved violently through the forecast history and reset the regional cost map permanently. European industrial gas and power prices through 2022 reached levels the IEA documented as unprecedented for the sector, and benzene volatility compounded the effect for styrene producers. Trinseo Annual Report 2023 recorded the resulting European margin compression across its styrenics operations directly, and LG Chem Annual Report 2022 noted raw material cost recovery lagging contractual pricing.

The competitive disadvantage mechanism runs entirely through monomer position. Merchant buyers pay whatever integrated producers charge and become pure price takers whenever styrene tightens, which is precisely when polymer pricing rises. Producers without compounding capability additionally sell natural resin into the most competitive tier available. European producers frequently carry both disadvantages alongside an energy handicap, which is why capacity has closed there while additions concentrated elsewhere.
styrenics-market-trends-cost-volatility-analysis-1787310870910

Contract styrene monomer supply before committing polymerisation capacity

Monomer carries nearly sixty percent of delivered cost, and a polymerisation line without a secured monomer position is simply a price taker with fixed assets attached. Negotiating multi-year supply before the capacity commitment costs nothing beyond commercial discipline and it determines whether the investment ever earns a return at any point across the cycle.

Move mix toward compounded grades on existing assets

Compounding capital is a small fraction of a polymerisation train and lifts realised margin substantially on the same underlying resin, which makes it the cheapest improvement available to any producer already carrying the monomer exposure. The constraint is commercial organisation rather than capital, since it means selling to application engineers instead of resin buyers.

Secure post-consumer feedstock for depolymerisation capacity

Chemical recycling capacity without secured post-consumer polystyrene feedstock repeats the monomer mistake one step further upstream, since collection systems will simply contract with whoever happens to move first on them. Those relationships take years to build and are being negotiated now, well ahead of the recycled content obligations that will eventually make holding them absolutely decisive.

Portfolio Architecture for Margin Defence

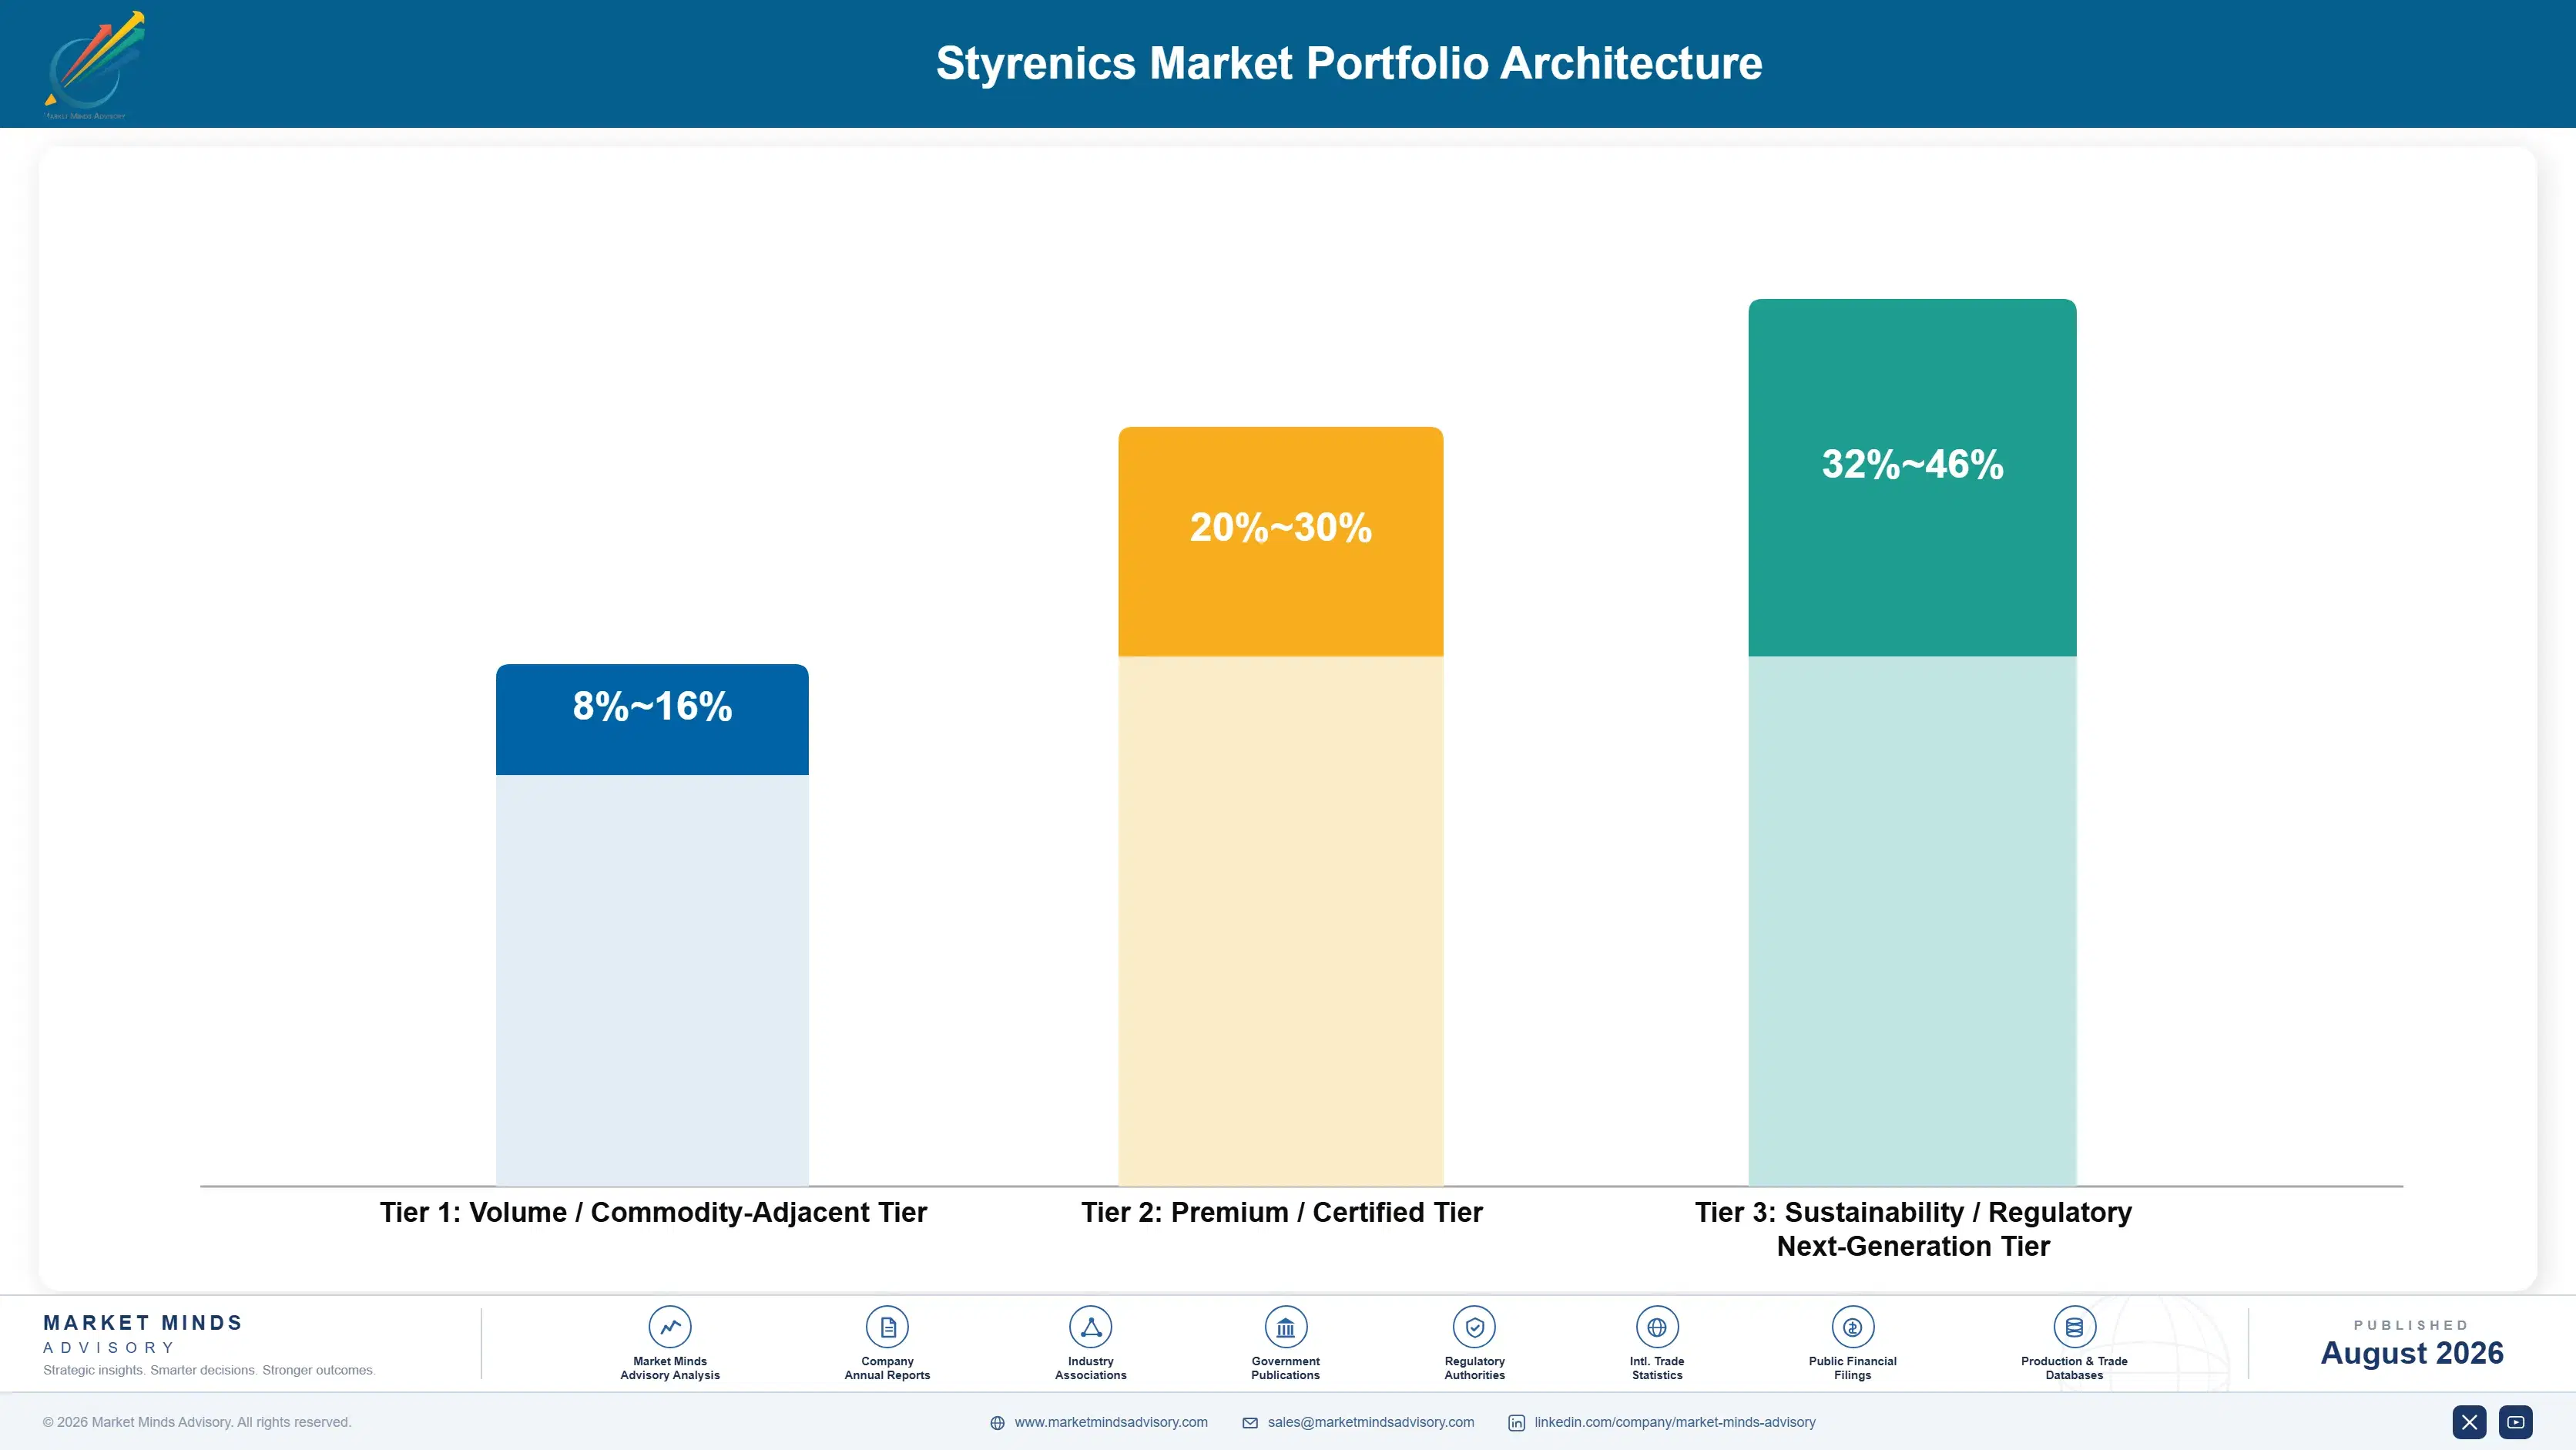
Margin architecture separates by how far downstream the producer has moved rather than by polymer class, which is not at all what most internal reporting in this industry currently assumes. Natural polystyrene and standard copolymer resin sold against datasheets earns whatever the marginal producer permits, because the polymer is identical between suppliers and absolutely nothing else is being purchased there.
Value climbs where compounding, colour and qualification limit the field. Compounded and coloured appliance grades defend real premiums through colour matching and impact retention that a converter cannot achieve by buying natural resin and masterbatch separately. Medical and specialty copolymer grades sit higher again, since regulatory documentation and lot-to-lot consistency both take years to establish properly.

The highest value pools now concentrate in styrenic block copolymers and in recycled grades meeting food contact requirements, since both of them face demand growing considerably faster than the qualified supply available. Those pools are modest in tonnage and quite disproportionate in realised margin. The commercial tension is that commodity polystyrene volume keeps polymerisation lines loaded, which the monomer economics genuinely require, while funding almost none of the capability above it.

Volume / Commodity-Adjacent Tier

Natural general purpose and high impact polystyrene and standard copolymer resin sold against published datasheets into open market conversion, where the marginal producer sets price and nobody holds any defensible commercial position.
Gross Margin: 8-16%

Premium / Certified Tier

Compounded, coloured and impact-modified grades qualified into appliance, automotive interior and electronics applications. Colour matching and specification qualification defend pricing here. The ten-point range reflects catalogue compounds against qualified platform positions.
Gross Margin: 20-30%

Sustainability / Regulatory / Next-Generation Tier

Styrenic block copolymers, medical grades and food contact approved recycled material from depolymerisation. Scarce supply and compliance obligations defend pricing strongly. The fourteen-point range reflects established block copolymers against emerging recycled monomer economics.
Gross Margin: 32-46%
styrenics-market-trends-portfolio-architecture-1787310871409

High-value Sub-segments and Strategic Watch-out

Styrenic block copolymers for demanding applications

High value and genuinely high growth together here, because elastomeric behaviour without vulcanisation has no close substitute in adhesives, in medical tubing or in polymer modified asphalt binder, and because the qualified producer field here stays remarkably narrow. Realised margin reflects that scarcity very directly indeed.
Gross Margin: 32-46%

Food contact approved recycled styrenic grades

Strong realised value on the fastest emerging growth found anywhere here, because depolymerisation returns monomer that is purifiable to virgin specification while mechanical recycling simply cannot, and because the recycled content obligations involved are simply not optional for any converter that is subject to them.
Gross Margin: 30-44%

Natural polystyrene and standard copolymer resin

The volume core of this entire market, keeping the polymerisation lines properly loaded while earning whatever the marginal producer permits on polymer that is entirely identical between suppliers everywhere. Necessary for basic monomer economics, but this tier funds nothing whatsoever above itself and never will.
Gross Margin: 8-16%

Merchant monomer exposure across the portfolio

The strategic watch-out running right across this whole business here, given that the styrene monomer alone carries fully 58% of delivered cost and that merchant buyers therefore become pure price takers in exactly the quarters when the finished polymer happens to be worth the most.
Gross Margin: 4-30%

How styrenics demand actually behaves

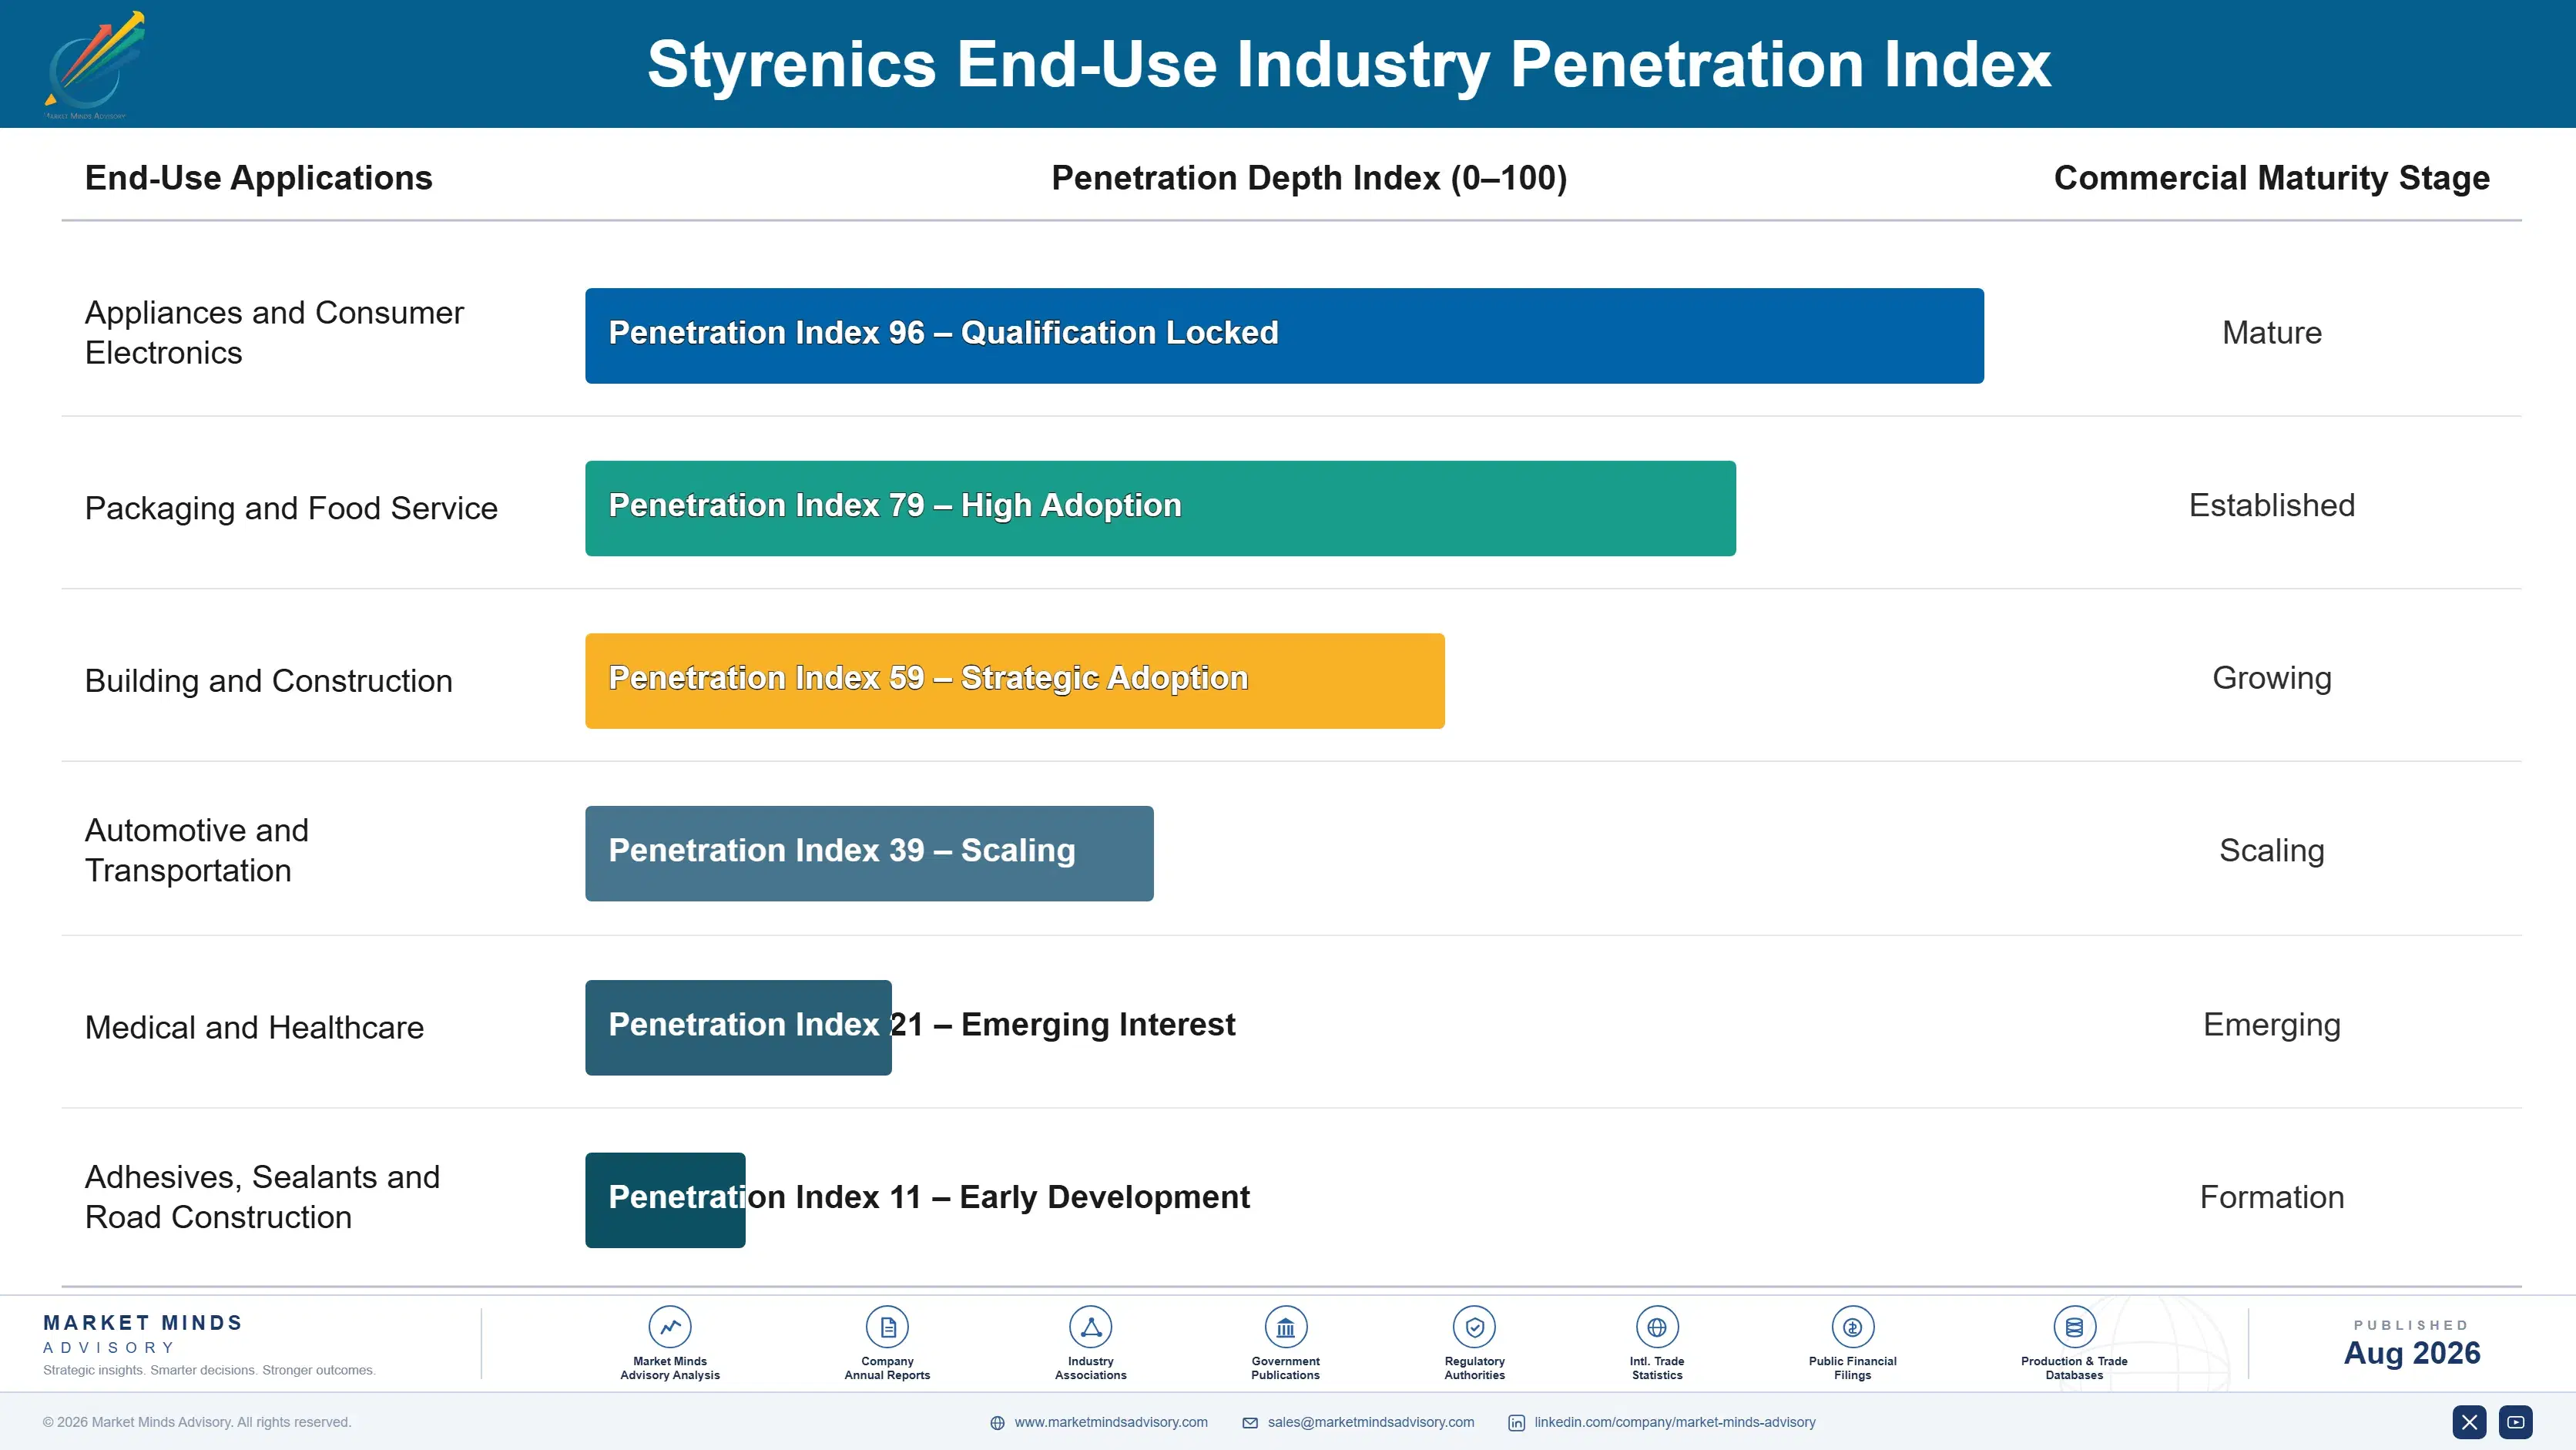
Demand splits into two separate commercial worlds that happen to share a monomer. Commodity polystyrene and standard copolymer resin is bought monthly on formula pricing by converters who switch on delivered cost with almost no friction, because the polymer performs identically between suppliers. Qualified compounded grades behave nothing like that, since an appliance manufacturer who has matched a colour and validated impact retention will not switch to save a few cents per kilogram.
Stickiness therefore tracks qualification rather than polymer class. Natural resin is loosest, substituted on a single purchase order with no consequence at all. Compounded appliance and automotive grades sit far tighter, because colour matching and ageing validation cost time nobody wants to spend twice. Medical and food contact grades are stickiest of all, since changing material touches a regulatory submission or validated process customers refuse to reopen casually.

The buyer profile splits by converter scale in ways defeating any single commercial model. Large converters and appliance manufacturers run central materials engineering, evaluating grades on processing and ageing behaviour long before procurement negotiates. Smaller converters buy natural resin through distribution on delivered price and availability, which is why distribution margins here survive conditions that eliminate producer margins entirely.
styrenics-market-trends-end-use-penetration-index-1787310871895

What we would actually do here

These are among the four positions where our research anticipates prominent divergence between winners and laggards over the coming forecast period. Each is grounded in the demand model, the regulatory perimeter, and the announced capacity pipeline.
01 / COMPOUNDED GRADE MIX

Stop selling resin and start selling finished grades

Natural resin sold against a datasheet earns whatever the marginal producer allows that quarter, while a compounded, coloured and impact-modified grade matched to a customer's moulding process earns considerably more. Producers integrating into compounding lift realised margin by roughly 14 percentage points on converted volume, against capital that is a small fraction of a polymerisation train. The barrier is commercial rather than technical, since it means selling to application engineers instead of to the resin buyers that everybody already knows.
02 / APPLIANCE SPECIFICATION DESIGN-IN

Reach the materials engineers, not the resin buyer

Appliance and automotive programmes qualify a grade on colour matching, impact retention after ageing and regulatory documentation, and that qualification then supplies the platform for its entire production life. Producers achieving design-in capture roughly 5 times the lifetime volume of those bidding against annual purchasing reviews, because requalification costs the customer far more than any price difference could ever save them. Most styrenics producers still sell only to resin buyers and never reach the people who are actually making the decision.
03 / MONOMER INTEGRATION POSITION

Own the styrene or accept being a price taker

Styrene monomer carries roughly 58% of delivered polymer cost, which makes an integrated position worth considerably more than any polymer technology advantage available anywhere in this entire industry. Integrated producers run roughly 23% below merchant monomer buyers, and that gap widens very sharply in every tight quarter, which is exactly the point at which the polymer itself commands the most. Adding polymerisation capacity without first securing monomer supply has been the recurring and genuinely expensive error right across this whole business.
04 / RECYCLED STYRENICS CAPABILITY

Contract the feedstock before the obligation arrives

Recycled content requirements rising toward 25% by 2030 now reach styrenic packaging, and depolymerisation back to the monomer is the only route returning material that is purifiable to virgin food contact specification. Producers holding that capability or secured offtake command roughly 30% above virgin pricing on compliant grades, because qualified supply is scarce and the obligation itself is not optional for anybody. The feedstock collection relationships matter considerably more than the technology itself, and they are being quietly contracted right now.

Engagement Snapshot From the Field

A live engagement with an industry participant carrying material or product regulatory and market exposure ahead of a defining policy shift, showing how our research translates into a defensible multi-year portfolio strategy.
MARKET MINDS ADVISORY · CLIENT ENGAGEMENT SUMMARY
Styrenics Producer Strategic Portfolio Review and Transition Roadmap 2026·Investment Scenario on Styrenics Exposure Evaluation 2025-26
CLIENT PROFILE
A styrenics producer operating polymerisation capacity at three sites across Europe and Southeast Asia, supplying packaging converters, appliance manufacturers and construction insulation customers alongside a small compounding operation. Styrenics revenue approached EUR 640 million annually (client-reported, unverified by MMA), roughly seventy-five percent of it natural polystyrene and standard copolymer resin sold on formula pricing against published datasheets.
STRATEGIC CHALLENGE
Margins had been below cost of capital for four consecutive years and management attributed the shortfall to Asian imports, proposing a debottlenecking project at the larger European site. Compounded and appliance grade opportunities were being lost without anybody establishing why. Merchant monomer exposure had never been quantified against integrated competitor cost positions.
MMA APPROACH
We rebuilt cost positions against integrated competitors across a full cycle rather than at spot conditions, assessed the portfolio by downstream position rather than by polymer class, and reconstructed fifteen lost appliance grade opportunities through interviews with customer materials engineering rather than the purchasing contacts the client normally dealt with. Colour matching and ageing performance were benchmarked independently against four competitor compounds.
KEY FINDINGS
  1. Margin shortfall traced principally to merchant monomer exposure and to product mix, not to Asian import pricing, which had moved less than management assumed.
  2. Twelve of fifteen lost appliance opportunities failed on colour matching consistency and ageing data rather than on delivered price or lead time in any respect.
  3. The compounding operation ran at under half its capacity while the business continued selling natural resin into the most competitive tier available anywhere.
  4. The proposed debottlenecking would have added natural resin capacity in exactly the tier where the marginal producer already set price every single quarter.
CLIENT PROFILE
A styrenics producer operating polymerisation capacity at three sites across Europe and Southeast Asia, supplying packaging converters, appliance manufacturers and construction insulation customers alongside a small compounding operation. Styrenics revenue approached EUR 640 million annually (client-reported, unverified by MMA), roughly seventy-five percent of it natural polystyrene and standard copolymer resin sold on formula pricing against published datasheets.
STRATEGIC CHALLENGE
Margins had been below cost of capital for four consecutive years and management attributed the shortfall to Asian imports, proposing a debottlenecking project at the larger European site. Compounded and appliance grade opportunities were being lost without anybody establishing why. Merchant monomer exposure had never been quantified against integrated competitor cost positions.
MMA APPROACH
We rebuilt cost positions against integrated competitors across a full cycle rather than at spot conditions, assessed the portfolio by downstream position rather than by polymer class, and reconstructed fifteen lost appliance grade opportunities through interviews with customer materials engineering rather than the purchasing contacts the client normally dealt with. Colour matching and ageing performance were benchmarked independently against four competitor compounds.
KEY FINDINGS
  1. Margin shortfall traced principally to merchant monomer exposure and to product mix, not to Asian import pricing, which had moved less than management assumed.
  2. Twelve of fifteen lost appliance opportunities failed on colour matching consistency and ageing data rather than on delivered price or lead time in any respect.
  3. The compounding operation ran at under half its capacity while the business continued selling natural resin into the most competitive tier available anywhere.
  4. The proposed debottlenecking would have added natural resin capacity in exactly the tier where the marginal producer already set price every single quarter.
RECOMMENDED STRATEGY
Phase 1: Phase one: negotiate multi-year styrene monomer supply against committed volumes and abandon the proposed European debottlenecking project immediately and completely. Phase 2: Phase two: load the compounding operation properly by converting the six largest appliance prospects from natural resin to qualified coloured grades. Phase 3: Phase three: secure post-consumer polystyrene collection relationships ahead of depolymerisation capability, well before the recycled content obligations actually take effect anywhere.
OUTCOME
The client abandoned the debottlenecking and redirected commercial effort toward compounded appliance grades. Compounding capacity utilisation rose above three quarters within eleven months, and realised margin on compounded volume improved by 18% (client-reported, unverified by MMA) against the prior year on broadly comparable tonnage shipped.

Frequently Asked Questions

Foundational context covering the market sizes, CAGR, scope, country, region and competition that inform every finding below. This section is provided to cover basics and most often pre-purchase conversations, answered from the MMA Primary Research Dataset.

What is the current size of the Styrenics Market?

The market is valued at USD 86.0 billion in 2025, rising to USD 89.96 billion in 2026. Sizing covers styrenic polymer sold to converters and compounders at realised delivered price.

How large will the Styrenics Market be by 2036?

The market reaches USD 141.05 billion by 2036, an increase of USD 51.09 billion across the forecast period. That represents an expansion multiple of 1.57 times the 2026 base.

What is the CAGR for the Styrenics Market 2026 to 2036?

The base case CAGR is 4.6% across 2026 to 2036. The bull case reaches 5.9% on faster recycled capacity, while the bear case sits at 3.3% under wider packaging restriction.

Which segment is growing fastest?

Styrenic block copolymers grow fastest at 6.9%, a full 1.50 times the market rate. They behave elastomerically without vulcanisation, which no other material in the family manages.

Who are the major companies in the Styrenics Market?

INEOS Styrolution, Chi Mei, LG Chem, Trinseo and SABIC lead on production capacity, holding just 26% collectively. The remaining field spans integrated producers and independent compounders.

Which country is growing fastest?

India grows fastest at 7.4%, driven by appliance and electronics manufacture expanding faster than anywhere else alongside packaging demand rising steadily with formal retail penetration across the country.

Report Segmentation Architecture

The full report scope spans multiple orthogonal segmentation dimensions, with cross-tabulated demand data provided for each dimension pair. Coverage extends further to regional breakdowns, trend trajectories, and the competitive detail needed to support segment-level decision-making.

By Polymer Class

  • General Purpose Polystyrene
  • High Impact Polystyrene
  • Expandable Polystyrene
  • Acrylonitrile Butadiene Styrene
  • Styrenic Block Copolymers
  • Styrene Acrylonitrile and Specialty Copolymers

By End-Use Industry

  • Appliances and Consumer Electronics
  • Packaging and Food Service
  • Building and Construction
  • Automotive and Transportation
  • Medical and Healthcare
  • Adhesives, Sealants and Road Construction

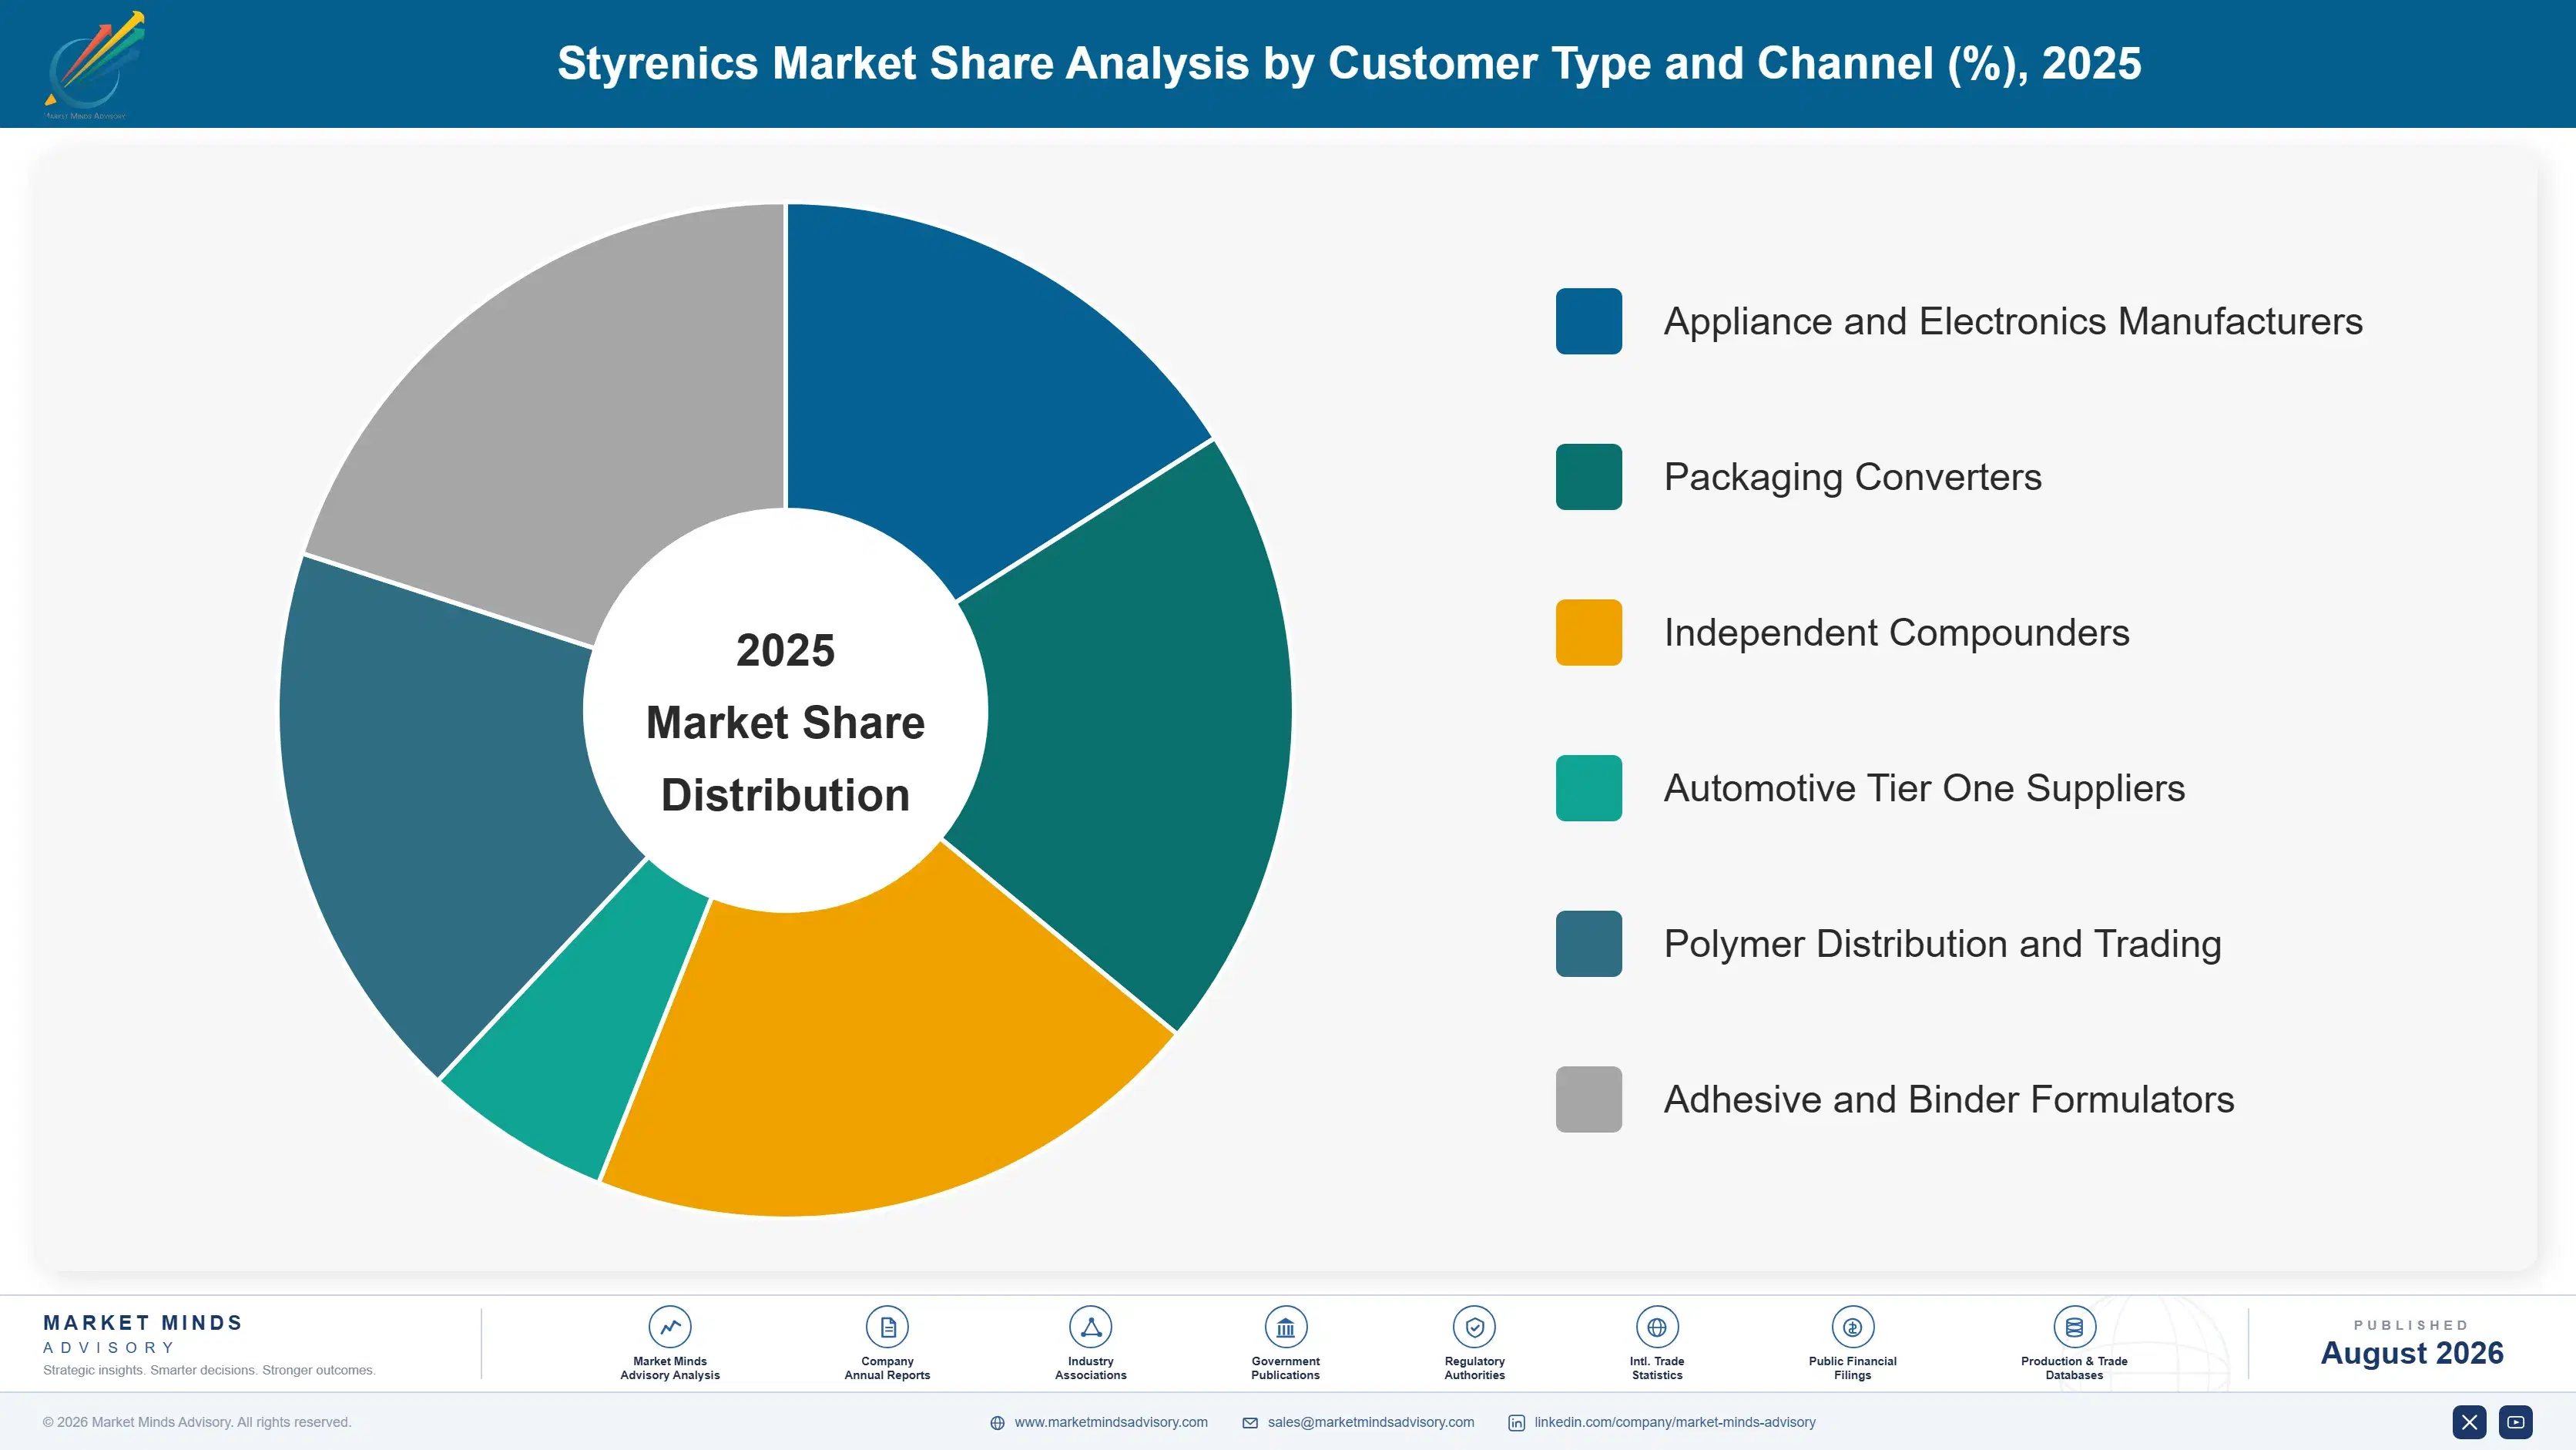
By Customer Type and Channel

  • Appliance and Electronics Manufacturers
  • Packaging Converters
  • Independent Compounders
  • Automotive Tier One Suppliers
  • Polymer Distribution and Trading
  • Adhesive and Binder Formulators

By Region

  • North America
  • Western Europe
  • East Asia
  • South Asia and Pacific
  • Latin America
  • Middle East and Africa
  • Eastern Europe

Scope, Methodology, and Coverage

Every figure in this report is reproducible from documented input assumptions. The scope below maps the historical period, the forecast horizon, the segmentation dimensions, and the countries covered, alongside the underlying primary and qualitative methodology.
Historical Period
2020 to 2025
Forecast Period
2026 to 2036
Base Year
2025 (USD billions; MMA Primary Research Dataset, August 2026)
Market Definition
The market comprises polymers built on the styrene monomer, spanning general purpose polystyrene, high impact polystyrene, expandable polystyrene, acrylonitrile butadiene styrene, styrenic block copolymers, and styrene acrylonitrile and specialty copolymers. Sizing captures polymer revenue at realised delivered price across appliances and consumer electronics, packaging and food service, building and construction, automotive and transportation, medical and healthcare, and adhesives, sealants and road construction applications, including compounded and coloured grades and recycled material meeting equivalent specifications. Styrene monomer sold as a chemical, unsaturated polyester resin and styrene-butadiene latex, styrene-butadiene rubber for tyres, converted articles and finished foam products, and toll compounding performed on customer-owned resin all fall outside scope.
Quantitative Units
USD billions (current prices); styrenic polymer shipped annually in millions of tonnes; USD per tonne at realised delivered price
Segmentation Dimensions
By Polymer Class; By End-Use Industry; By Customer Type and Channel; By Region
Regions Covered
North America, Western Europe, East Asia, South Asia and Pacific, Latin America, Middle East and Africa, Eastern Europe
Countries Covered
USA, Canada, Mexico, UK, Germany, France, Italy, Spain, Netherlands, Belgium, Poland, Czech Republic, Romania, Hungary, Turkey, China, Japan, South Korea, Taiwan, India, Singapore, Malaysia, Thailand, Vietnam, Indonesia, Australia, Brazil, Argentina, Colombia, Saudi Arabia, UAE, Egypt, Nigeria, South Africa, and additional markets relevant to this sector
Key Companies Profiled
INEOS Styrolution, Chi Mei, LG Chem, Trinseo, SABIC, Kumho Petrochemical, Formosa Chemicals and Fibre, Kraton, Dynasol, TSRC, Versalis, Synthos, Denka, Techno-UMG, Asahi Kasei, Zhejiang Petroleum and Chemical, Shanghai Highpolymer, Supreme Petrochem, TotalEnergies, Elix Polymers.
Quantitative Methodology
Primary survey, n=3,800 respondents, Q4 2025, six countries; demand-side model with trade association cross-validation
Qualitative Methodology
47 expert interviews, Q4 2025; applied to validate demand model assumptions, identify emerging dynamics, and assess competitive positioning
Report Format
PDF and XLSX data workbook (Word format preview document)
Publisher
Market Minds Advisory
Report Code
MMA-2026-CHM-613
Published
August 2026
Contact
sales@marketmindsadvisory.com | www.marketmindsadvisory.com

Purchase the full Styrenics Market Report (2026 to 2036).

The full report sizes the styrenics market across six polymer classes, six end-use industries, six customer channels and seven regions, with annual forecasts to 2036 in revenue and tonnage shipped. It rebuilds cost positions for integrated and merchant monomer producers across a full cycle rather than at spot conditions, which is the analysis that establishes who actually earns anything through a trough. Twenty participants are assessed on a consistent production capacity basis, with compounding and downstream capability mapped separately from polymerisation scale. Depolymerisation and recycled feedstock positions are quantified producer by producer.
Six polymer classes sized and forecast annually to 2036
Integrated and merchant cost positions rebuilt across cycles
Twenty participants assessed on consistent production capacity basis
Compounding capability mapped separately from polymerisation scale throughout
Depolymerisation and recycled feedstock positions quantified producer by producer
Packaging restriction exposure quantified application by application

Built For The People Who Decide

From boardroom strategy to bench-side execution, this report is read cover-to-cover by leaders shaping the next decade of their industry, turning demand scenarios, market dynamics and valuation benchmarks into decisions.
CXOs/ Presidents/ VPs/ Managers
M&A and Corporate Development
Strategy Teams and R&D Heads
Procurement and Product Directors
Regulatory and Compliance Leaders
Investor Relations and Equity Analysts