Market Minds Advisory
Stud Welding Equipment Market

Stud Welding Equipment Market: Stud Welding Equipment Market: Consumable Economics, Unverifiable Welds and Surface Preparation Blamed On Machines, 2026 to 2036

The gun lasts eleven years and the studs pass through it every single working day, so anybody selling only equipment has handed two thirds of this business to somebody else.

Lead Analyst

Published

September 2026

Make Smarter Decisions with Customized Research Insights

Request a free sample report and evaluate market opportunities, growth trends, and competitive dynamics relevant to your business needs.

2025 MARKET VALUE$1.4BMarket Size 2025
2036 FORECAST VALUE$2.6BBase Case , 2026 to 2036
CAGR 2026 TO 20365.6 %Bull 6.8% / Bear 4.4%
INCREMENTAL OPPORTUNITY$1.1BNet 10- year value creation
EXPANSION MULTIPLE1.73x2036 value over 2026 base
Strategic Levers
M&A Pipeline
Regional Outlook
Country Rankings
Competitive Intelligence
Segmental Deep-dive
Call-Us : 91 93563 13602

Executive Snapshot and Market Trajectory.

Studs and ceramic ferrules account for 68% of category value while the welding power source lasts about eleven years. Manufacturers selling equipment and losing the consumable stream earn a fraction of what the installed base is worth. A meaningful number still report success in units shipped.
Short cycle stud welding grows at 8.4%, half again the market rate of 5.6%, because it welds smaller diameters onto thinner sections without burn-through, which is precisely what battery enclosures and solar mounting structures require. Capacitor discharge follows at 7.3%. Drawn arc, which carries the heaviest sections, grows at barely a third of the leading rate. Gas arc and resistance processes decline steadily underneath both. Application mix rewrote everything here.
Weld quality is the uncomfortable part. The only reliable verification bends or torques a stud to destruction, so roughly 4% of production welds are ever properly tested. Everything else is visual inspection of the fillet, which passes cold welds that look entirely correct and fail under load later. About 57% of field defects trace to plate condition rather than to any machine fault. The machine collects the blame anyway, which shapes how equipment gets judged.
Market Definition
This market covers stud welding equipment and its consumables, including short cycle stud welding, capacitor discharge stud welding, friction stud welding, drawn arc stud welding, gas arc shielded stud welding, and resistance stud welding systems. Welding studs, ceramic ferrules, and process consumables are counted within the process they serve. It excludes general arc welding equipment, spot and resistance sheet welding, laser welding systems, mechanical fasteners requiring no weld, and consumables for non-stud welding processes.
Base Year Value
$1.4B in 2025 (MMA Primary Research Dataset, September 2026)
Forecast Period
2026 to 2036, eleven discrete annual values
CAGR
5.6% base case. Bull 6.8%. Bear 4.4%.
Fastest Growth Segment
Short Cycle Stud Welding: 8.4% CAGR
Fastest Growth Country
China: 9.4% CAGR
Fastest Growth Region
South Asia and Pacific: 7.6% CAGR
Largest Region
East Asia: 35% of 2025 global value
Market Leaders
Nelson Stud Welding, Stanley Engineered Fastening, HBS Bolzenschweiss-Systeme, Heinz Soyer Bolzenschweisstechnik, and Koester and Co lead the field. Source: MMA Primary Research Dataset, July 2026.
Primary Survey
n=3,800 procurement and R&D decision-makers, Q4 2025, six countries
Methodology
Demand-side build-up, cross-validated against public data, 47 expert interviews

Stud Welding Equipment Market Forecast Scenarios

stud-welding-equipment-market-size-forecast-scenario-1790015690682
Between 2020 and 2025 the category grew at 4.5% on shipbuilding, structural steel fabrication, and an emerging demand from battery enclosure and solar mounting assembly that barely existed at the start of the period. Equipment volumes were flat throughout while consumable tonnage rose, which is the pattern this industry generally reports without drawing the obvious commercial conclusion from it.
The base case at 5.6% rests on three mechanisms. Chinese shipbuilding and solar structure fabrication consume stud volume at a scale no other market approaches. Short cycle and capacitor discharge processes take share as thinner sections and smaller diameters become the dominant application. And automated cells spread across manufacturers who need weld records rather than visual inspection to satisfy their own customers. None of the three requires equipment volumes to grow at all.
The bull case at 6.8% depends on per-weld monitoring becoming a specification requirement, since a documented weld is worth considerably more than an undocumented one to anybody building load-bearing assemblies. The bear case at 4.4% is consumable substitution: third-party studs fit most guns, cost materially less, and equipment manufacturers have no mechanism to prevent their installed base being supplied by somebody else.

Where The Money Actually Is

A stud welding power source is bought once and works for about eleven years. The studs and ceramic ferrules pass through it continuously, and they represent 68% of category value. Manufacturers who sell a gun and then watch a third-party supplier fill it for a decade have given away most of the business, and many still measure success in units of equipment shipped.
TOP FIVE CONCENTRATION47%Share of category revenue held by the leading manufacturers
CONSUMABLE REVENUE SHARE68%Category value from studs and ferrules rather than equipment
DESTRUCTIVE TEST RATE4%Production welds verified by the only reliable inspection method
SURFACE PREPARATION FAILURES57%Weld defects traced to base metal condition rather than equipment
EQUIPMENT SERVICE LIFE11 yearsWorking life of a welding power source before replacement
FEED RELIABILITY CYCLE RATE3.2 secondsAchievable cycle time before stud feeding becomes the constraint
Weld verification is where this industry is quietly uncomfortable. A stud weld either fused across the full section or it did not, and the only reliable way to know is to bend or torque it until something breaks. Around 4% of production welds are tested that way. The rest are inspected visually, and a cold weld with a convincing fillet passes that inspection and fails under load months afterwards.
Surface condition decides more outcomes than the equipment does. Mill scale, rust, paint, galvanising, and oil all disrupt the arc or the fusion, and capacitor discharge welding in particular needs clean bright metal to work at all. About 57% of field defects trace to base metal preparation rather than to any machine fault, and the machine gets blamed for a large share of them regardless.
"Every complaint that reaches us is about the equipment and most of them are about the plate. Somebody welded onto mill scale, got a cold weld with a beautiful fillet, and nobody found out until the assembly moved. Four per cent of welds get tested properly, and that is being generous."
Practice Director, Joining Technology and Industrial Fastening · MMA Construction and Industrial Equipment Practice · September 2026

Market Trends

Thin Section Applications Reshape Process Mix

Short cycle stud welding grows at 8.4%, the fastest rate here, because battery enclosures, solar mounting structures, and lightweight vehicle assemblies all require small diameters welded onto thin material without burning through the reverse face. Drawn arc handles heavy sections and cannot serve those applications at all. Capacitor discharge follows at 7.3% for similar reasons. The process mix in this market is being rewritten by what is being assembled rather than by any welding advance. Drawn arc retains the heavy structural work where its heat input is an advantage rather than a limitation.
Market Impact: Country grows at 9.4%

Weld Monitoring Substitutes For Destructive Testing

Roughly 4% of production welds are verified destructively, and monitoring systems that record arc voltage, current, and plunge depth for every weld are the only practical alternative available. A recorded weld within specified parameters is not proof of fusion, and it is considerably better evidence than a visual glance at a fillet. Manufacturers building assemblies their own customers audit increasingly specify monitoring, which pulls automated cells into applications that had been entirely manual. Manufacturers building assemblies their own customers audit now specify monitoring routinely, which pulls automated cells into applications that operated entirely manually for decades.
Market Impact: Cycle times reach 3.2 seconds

Market Opportunities and Growth Drivers

Chinese Shipbuilding And Solar Structure Fabrication

Chinese growth of 9.4% leads every country covered, driven by shipbuilding volumes no other country approaches alongside solar mounting structure fabrication that consumes studs in enormous quantity per installed megawatt. Both applications are stud-intensive rather than equipment-intensive, which reinforces the consumable weighting across the whole category. Domestic equipment manufacturers now supply most of that demand and increasingly export into Western markets on price. Japanese and Korean fabrication specifies weld monitoring more consistently than anywhere, driven by automotive and shipbuilding customer audits rather than by any regulation. Regulation plays almost no part in it.
Market Impact: Covers 68% of value

Battery Enclosure Assembly Demands Documented Welds

Vehicle battery enclosures carry structural and safety obligations that make an undocumented weld genuinely unacceptable to the manufacturers assembling them. That requirement pulls monitoring systems and automated cells into a fastening process that had operated on visual inspection for decades. The volumes involved are substantial and growing, and the specification standards those customers impose are considerably above anything general fabrication has ever demanded from this industry. Specification standards those customers impose sit considerably above anything general steel fabrication has ever asked of this industry, and they arrive with volumes worth serving properly.
Market Impact: Causes 57% of defects

Market Restraints and Challenges

Third Party Studs Supply Somebody Else's Installed Base

Studs and ferrules represent 68% of category value and most third-party consumables fit most guns, and the root cause is that stud geometry is largely standardised while equipment is not. Commercially it means an equipment manufacturer can supply a machine for eleven years and capture none of the value flowing through it. Manufacturers respond with consumable-matched warranty terms, with proprietary ferrule geometries, and with supply agreements attached to equipment sales. None of that prevents a fabricator ordering elsewhere once the machine is installed and working. Geometry is largely standardised across the industry.
Market Impact: Segment grows at 8.4%

Base Metal Condition Gets Blamed On Machines

About 57% of field weld defects trace to mill scale, rust, paint, galvanising, or oil rather than to any equipment fault, and the root cause is that surface preparation is a site discipline nobody supervises closely. Commercially it damages equipment reputation for failures the machine did not cause. Manufacturers respond with preparation training, with monitoring that flags anomalous welds at the moment they occur, and with process parameter guidance by substrate. Preparation is a site discipline nobody supervises closely, and the equipment manufacturer has no visibility of it at all.
Market Impact: Verifies only 4% destructively
4 additional market trends, 3 additional growth drivers, and 2 additional restraints and challenges are covered in the full report. Contact sales@marketmindsadvisory.com to access the complete intelligence.

Segment CAGR and Growth Architecture

Segmentation follows welding process across six categories: short cycle stud welding, capacitor discharge stud welding, friction stud welding, drawn arc stud welding, gas arc shielded stud welding, and resistance stud welding. Studs, ferrules, and consumables are counted within the process they serve. Automation level, application, and channel are separate dimensions. Automation level is treated separately.
stud-welding-equipment-market-market-share-analysis-1790015691245

Short Cycle Stud Welding

Short cycle welding grows at 8.4%, half again the market rate of 5.6%, because the applications driving demand have moved to thinner material. Weld times measured in milliseconds put far less heat into the base metal than drawn arc, which means small diameter studs attach to thin sheet without marking or burning through the reverse face. Battery enclosures, solar mounting structures, and lightweight vehicle assemblies all require exactly that. Surface preparation tolerance is better than capacitor discharge and worse than drawn arc, which puts it in a practical middle position that suits fabrication conditions well. Application mix rather than welding advance is driving the shift. Heat input is the whole distinction between these processes.
CAGR 8.4%

Capacitor Discharge Stud Welding

Capacitor discharge grows at 7.3% on the shortest weld times available and correspondingly the least heat input, which allows studs on very thin sheet with no visible distortion on the show face. That capability suits appliance panels, enclosures, and architectural cladding where appearance on the reverse side matters commercially. The constraint is preparation: the process needs clean bright metal and fails on mill scale, paint, or galvanising in ways that drawn arc tolerates. A substantial share of defects blamed on capacitor discharge equipment originate entirely in the plate it was asked to weld. Preparation discipline decides whether this process works at all. Appearance on the show face is what the customer buys.
CAGR 7.3%
Full segment breakdown across 6 segments available in the complete report.

Regional Architecture and Country Demand Map

Regional shares here reflect where stud welding equipment and its consumables are actually being used in fabrication rather than where any of that equipment is manufactured. Three regions sit outside the standard bands, for reasons named in their own paragraphs and summarised for operator review.

East Asia

At 35% this sits above the standard band, and the justification is that Chinese shipbuilding, structural steel fabrication, and solar mounting structure assembly consume stud volume at a scale no other region matches. Chinese growth of 9.4% leads every country covered. Domestic equipment manufacturers now supply most regional demand and export into Western markets on price. Japanese and Korean fabrication specifies weld monitoring more consistently than anywhere else, driven by automotive and shipbuilding customer audits. Both applications are stud-intensive rather than equipment-intensive, which reinforces the consumable weighting across the entire regional market considerably. Domestic equipment now exports on price into Western markets. Monitoring specification is unusually consistent there. Audits rather than regulation drive it.
Share: 35% | CAGR: 6.6% (2026 to 2036)

Western Europe

German manufacturers defined much of this technology and still hold the premium equipment positions, particularly in automated cells and monitoring systems that record every weld. Growth of 4.1% is the slowest of the seven regions, reflecting mature fabrication and construction volumes. Battery enclosure assembly is the one genuinely expanding application, and it imposes documentation requirements considerably above anything general steel fabrication has ever asked of this industry. German manufacturers hold the premium equipment positions in automated cells and monitoring systems, and those positions rest on capability rather than on price at any point. Battery enclosure assembly is the one genuinely expanding application in the region. Documentation requirements arrive with it.
Share: 24% | CAGR: 4.1% (2026 to 2036)
Regional intelligence for 5 additional markets available in the complete report: North America, South Asia and Pacific, Latin America, Middle East and Africa, Eastern Europe. Contact sales@marketmindsadvisory.com.
stud-welding-equipment-market-country-cagr-analysis-1790015691791

Where Manufacturers Capture Real Value

Four commercial moves separate manufacturers earning from an installed base from those shipping equipment and watching somebody else supply it for a decade. Each addresses something this industry knows: where the value sits, that welds are unverified, that plate condition causes failures, and that feeding limits automation. Only one of the four concerns the welding itself.

Attach Consumable Supply To Every Equipment Sale

Studs and ferrules represent 68% of category value while a power source lasts about eleven years, and most third-party consumables fit most guns without difficulty. Manufacturers attaching consumable supply agreements to equipment sales report lifetime account values 3.6 times greater than those selling machines alone. The equipment is the entry point rather than the business, and a substantial number of participants still report success in units of equipment shipped. Once a fabricator has moved to independent studs there is no practical route back. The equipment is an entry point rather than the business itself.
Market Impact: Raises lifetime account values to 3.6 times higher

Record Every Weld Rather Than Sampling

Around 4% of production welds are verified destructively, and monitoring that captures arc voltage, current, and plunge depth for every weld provides the only practical alternative. Manufacturers supplying per-weld records report specification wins 2.7 times higher among customers whose own output gets audited. A recorded weld is not proof of fusion and it is considerably better evidence than a visual inspection that passes cold welds routinely. Visual inspection passes cold welds with convincing fillets routinely. A recorded weld within parameters is not proof of fusion and remains far better evidence than anything else available.
Market Impact: Raises specification win rates to 2.7 times higher

Sell Surface Preparation With The Machine

About 57% of field defects trace to mill scale, rust, paint, or galvanising rather than to any equipment fault, and the machine takes the blame for most of them anyway. Manufacturers providing substrate-specific parameter guidance and preparation training report warranty claims 3.1 times lower. It costs training material and a site visit, and it protects a reputation that field conditions would otherwise damage on failures nobody caused. Site preparation is a discipline the manufacturer cannot see or control. It costs training material and a site visit and protects a reputation.
Market Impact: Cuts warranty claim rates to 3.1 times lower

Engineer Feeding Before Adding Robot Speed

Automated cells reach around 3.2 seconds per weld before stud feeding rather than welding becomes the limiting constraint, and adding robot speed beyond that achieves nothing at all. Manufacturers investing in feed reliability report cell throughput 24% to 37% above competitors matching robot specifications alone. The welding is the easy part of an automated stud cell, and almost every specification conversation concentrates on the wrong half of the machine. The welding is the easy half of an automated stud cell. Almost every specification conversation concentrates on the wrong half. Robot speed beyond that achieves nothing.
Market Impact: Raises cell throughput by 24 to 37% higher

Who Controls the Margin Pool

Concentration is moderate. Five manufacturers hold 47% of category revenue, measured consistently on that basis across all participants, and the remainder spreads across regional equipment builders, independent stud producers supplying somebody else's installed base, and Chinese manufacturers competing on equipment price across export markets. Barriers to entry in equipment are moderate and in consumable supply relationships considerably lower, which is exactly the wrong way round commercially.
Competition currently turns on three dimensions: consumable attachment, which decides whether an installed base generates revenue for a decade or for a single transaction; weld monitoring capability, increasingly a specification condition rather than an option; and feed engineering in automated cells, where throughput is genuinely determined. Documentation capability has become a fourth dimension, and it separates suppliers serving audited manufacturers from those serving general fabrication shops.

Pressure builds from two directions. Independent stud producers supply installed bases at prices equipment manufacturers cannot match. Meanwhile Chinese equipment undercuts Western machines on comparable capability. Rankings will shift toward manufacturers capturing consumables, since equipment alone is a third of the available value. Ferrule proprietisation is the clearest unclaimed defence available to anybody here.
stud-welding-equipment-market-company-positioning-matrix-1790015692377

Competitive Moat and Risk Dimensions

NELSON STUD WELDING

Moat: Shear Stud Construction Position

Established position in shear stud welding for composite floor construction produces consumable volume that dwarfs equipment revenue and recurs on every steel-framed building project. Specification by structural engineers who name the process rather than the supplier still favours the business that effectively defined it in construction practice.
NELSON STUD WELDING

Risk: Independent Stud Supply Pressure

Shear studs are dimensionally standardised and independent producers supply them at prices the equipment manufacturer cannot match while carrying its own development and service costs. Defending consumable share depends on quality argument and warranty linkage rather than on anything the fabricator can see at the point of purchase.
HBS BOLZENSCHWEISS-SYSTEME

Moat: Monitoring And Automation Depth

Depth in weld monitoring and automated cell integration positions the business precisely where documentation requirements are arriving from battery enclosure and demanding fabrication customers. That capability is difficult to assemble quickly and it addresses a verification gap the whole industry has otherwise lived with for decades.
HBS BOLZENSCHWEISS-SYSTEME

Risk: Premium Position Against Chinese Equipment

Chinese manufacturers now offer comparable welding capability at substantially lower equipment prices, and a fabricator without documentation requirements sees very little difference at the point of purchase. Defending premium pricing depends on customers who are themselves audited, which is a narrower base than general fabrication.

Players Tracked

Prominent Players

Nelson Stud Welding
Stanley Engineered Fastening
HBS Bolzenschweiss-Systeme
Heinz Soyer Bolzenschweisstechnik
Koester and Co

Other Key Players

Taylor Studwelding Systems
Image Industries
Sunbelt Stud Welding
Cutlass Industries
Midwest Fasteners
BTH Stud Welding
nVent Electric
Tru-Weld Equipment
Bolte
KUKA
Fanuc
ABB
Fronius International
Kemppi
Lincoln Electric

Recent Developments

JANUARY 2026

Nelson Launches Per-Weld Monitoring With Retained Records

Nelson Stud Welding released a monitoring system capturing arc voltage, current, and plunge depth for every weld with retained records, addressing verification in a process where destructive testing is the only reliable alternative available. Records are retained and exportable rather than merely displayed. Audited customers need exportable evidence.
Signal: Documentation moves from customer request toward standard equipment specification. Competitors must now offer records or lose audited customers.
SEPTEMBER 2025

HBS Expands Welding Stud Production Capacity In Europe

HBS Bolzenschweiss-Systeme completed an organic capacity expansion for welding stud manufacture, funded internally with no partner involved, after consumable demand across battery enclosure and solar structure customers outran available heading and threading throughput. Consumable revenue had overtaken equipment revenue two years earlier. Equipment output was unchanged.
Signal: Equipment builders are investing in consumables rather than in machines. The industry is finally investing where the value sits.
MAY 2025

Stanley Engineered Fastening Acquires Welding Stud Manufacturer

Stanley Engineered Fastening completed an acquisition of an independent welding stud manufacturer, capturing consumable supply into installed bases the business had equipped but not supplied across several European and North American markets. Organic attachment had failed across most of the same installed base over the preceding decade.
Signal: Consumable capture is being bought where organic attachment failed. Buying back a lost consumable stream costs considerably more.

What Stud Welding Costs

Three input groups dominate cost. Steel wire rod and stud material runs 34% to 42% of cost of goods sold across consumables, and the eight-point range separates commodity carbon steel from stainless and coated grades. Power electronics and welding controls take 26% to 34% on equipment. Ceramic ferrules, assembly, and finishing add 22% to 30%, with ferrule production a genuinely specialised operation.
Steel wire rod pricing moved through 2024 and 2025 as regional trade measures and energy costs shifted mill economics in different directions across markets, and United States Census Bureau and Eurostat trade data documented the movements. Several manufacturers described the resulting margin pressure in their annual reports. Power semiconductor pricing followed automotive and industrial demand on an entirely separate path throughout. Ceramic ferrule inputs followed a third path again.

The competitive disadvantage mechanism runs through consumable capture rather than through manufacturing cost. A producer supplying only equipment competes for a purchase occurring once in eleven years, while one supplying the studs competes for a recurring order and holds the relationship between them. Exposure therefore varies by commercial model rather than by manufacturing efficiency, and the gap compounds across an installed base.
stud-welding-equipment-market-cost-volatility-analysis-1790015692573

Build Consumable Capacity Alongside Equipment

Studs and ferrules carry 68% of category value and an equipment manufacturer without consumable production competes for a purchase that recurs once a decade. Heading and threading capacity is inexpensive relative to the revenue it captures, and it converts an installed base from a completed sale into a recurring commercial relationship. Heading capacity is inexpensive against the revenue captured.

Contract Wire Rod Against Regional Trade Measures

Steel wire rod pricing responds to regional trade measures and mill energy costs on cycles entirely unrelated to fastening demand, and this category exerts no influence over either. Contracting across those cycles rather than reacting to them removes most of the exposure and secures supply when regional measures tighten unexpectedly. Regional measures shift without warning to anybody.

Treat Ferrule Production As Specialised Capability

Ceramic ferrules are a genuinely specialised product with a narrow supply base, and they are also proprietary enough to anchor consumable attachment where the stud itself is standardised. Producing them in house both secures supply and creates the one component in this system that a third party cannot simply substitute. It is the one component nobody can readily substitute.

Portfolio Architecture for Margin Defence

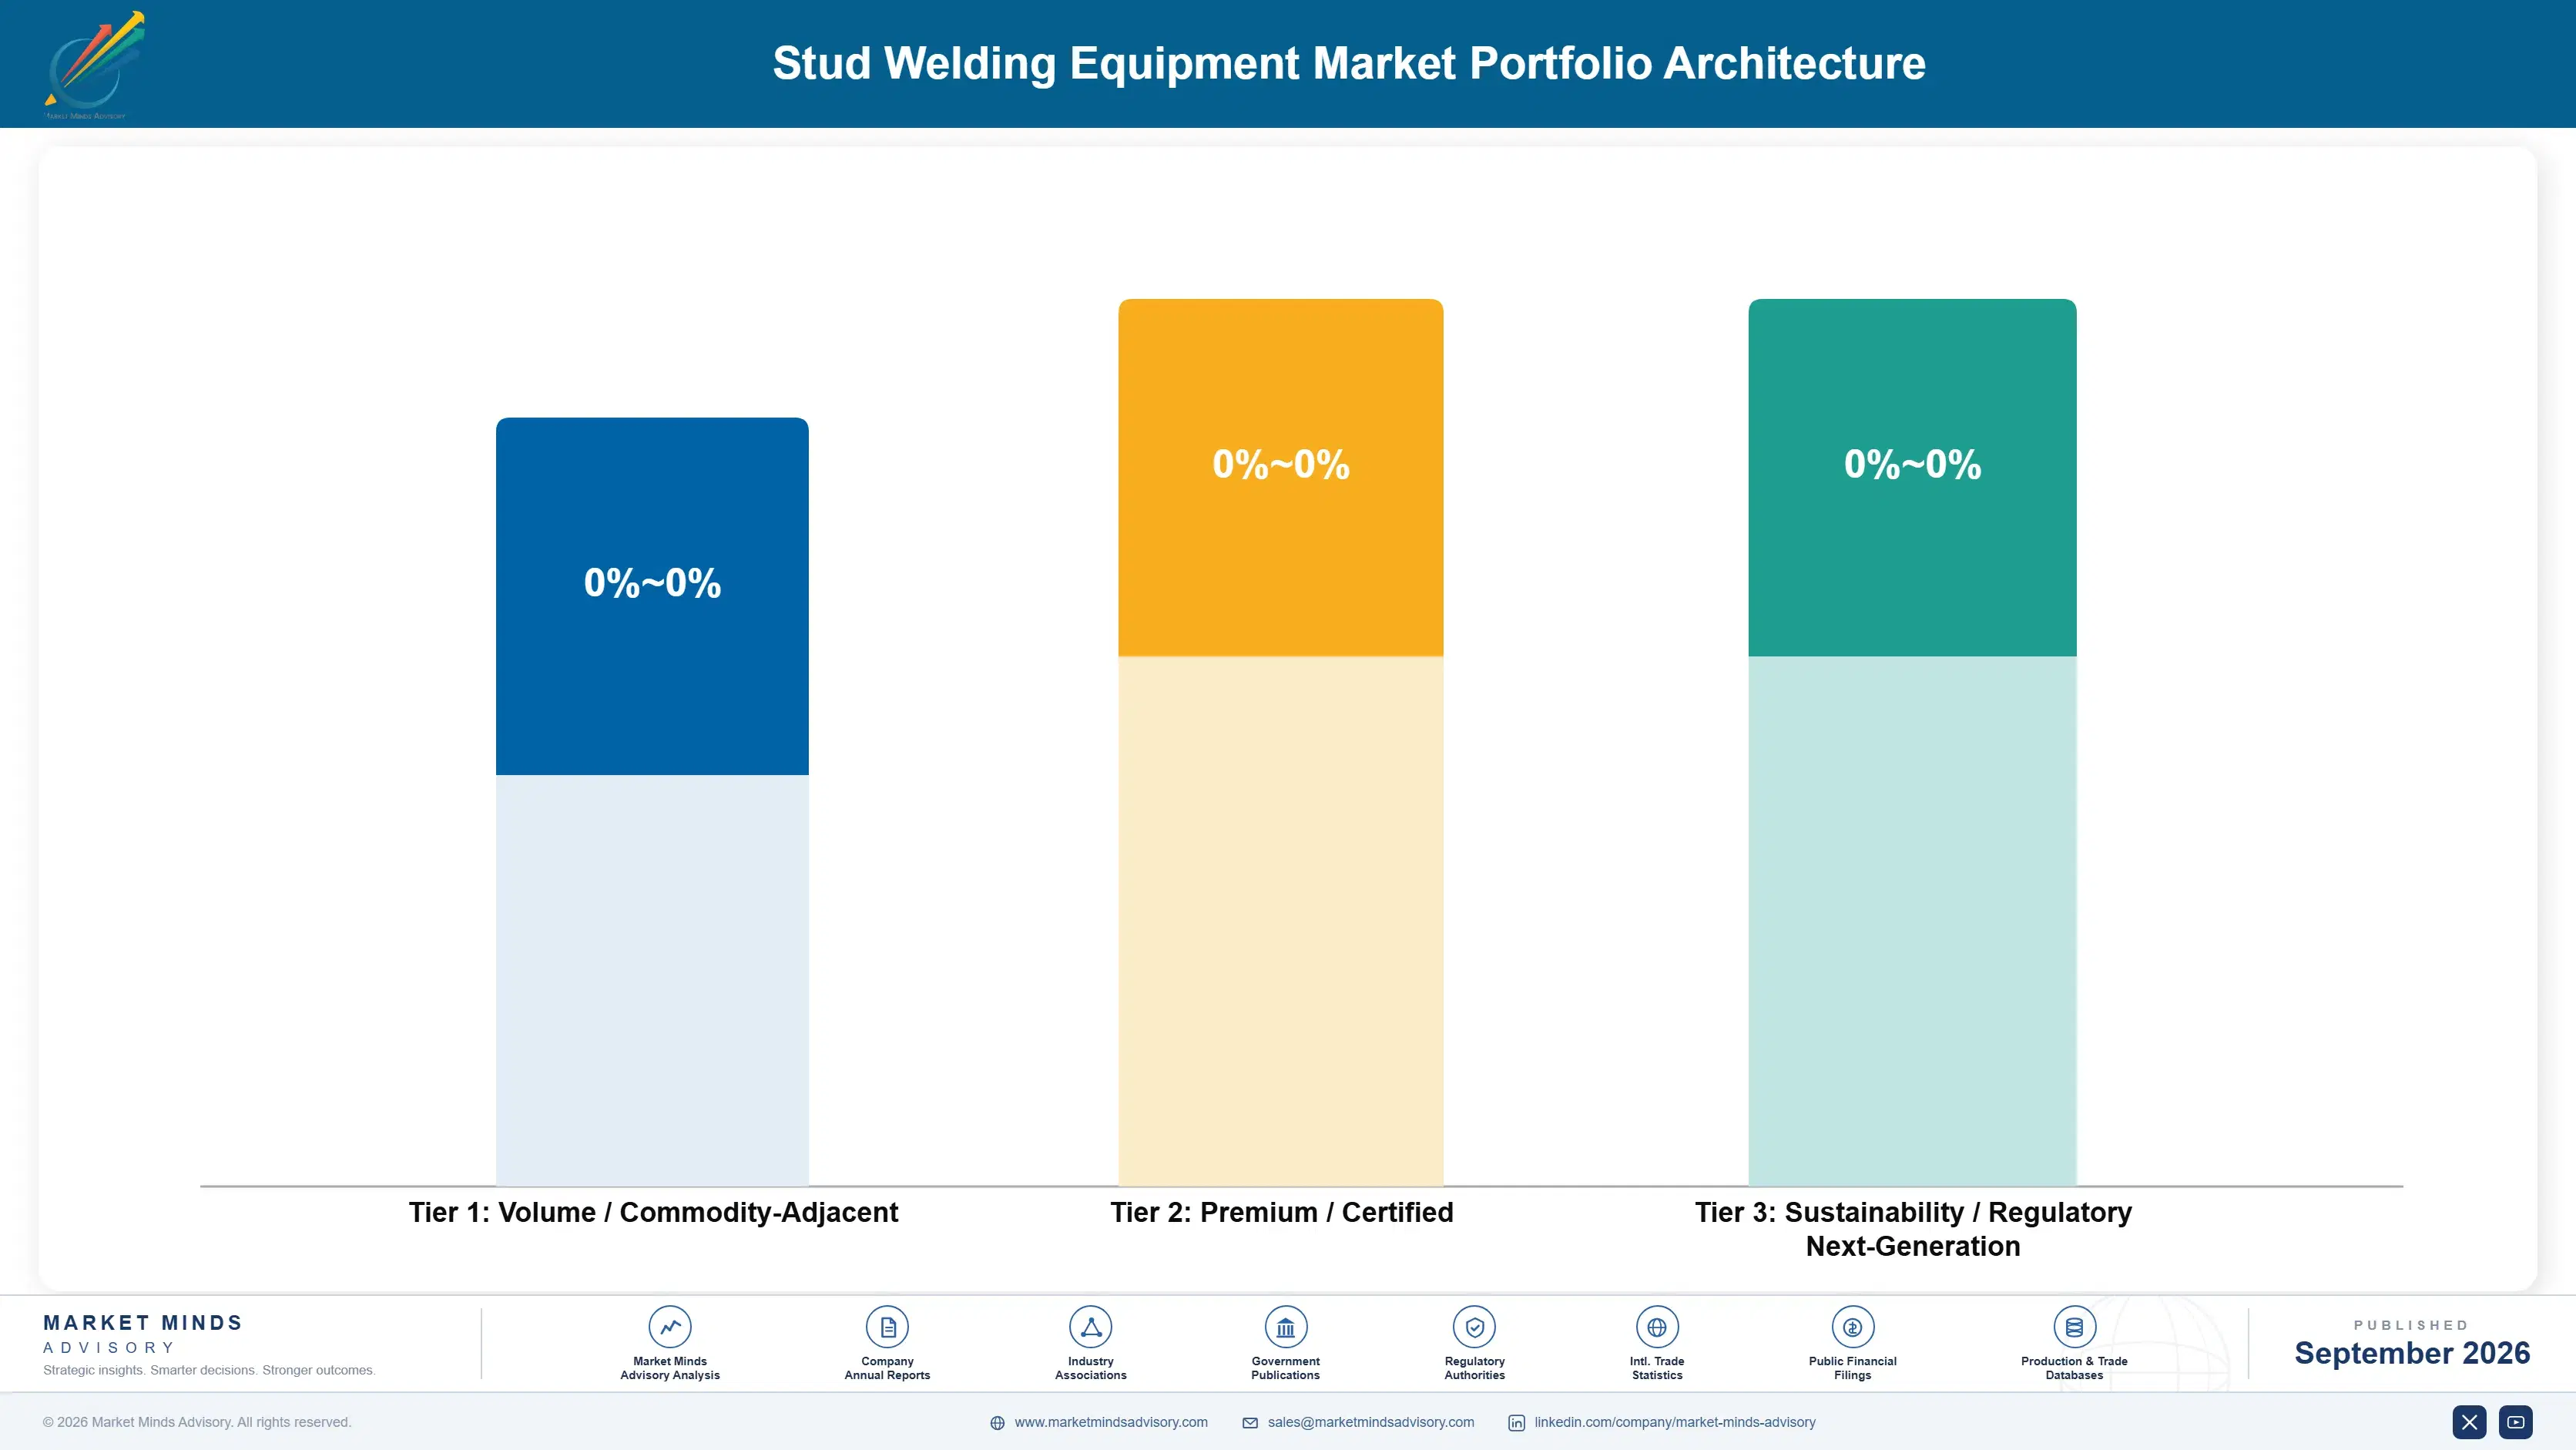
Margin follows recurrence rather than technology. Standard carbon steel studs compete close to commodity terms against independent producers supplying the same installed bases. Manual welding guns earn moderately and sell rarely. Monitoring-equipped systems earn better on documentation requirements, and proprietary ferrules with attached consumable agreements earn most, because they are the only component a third party cannot readily substitute. The margin spread across those four groups is wide for an industrial category.
The tension between volume and premium runs through whether the customer is audited. A general fabricator welding brackets buys the cheapest adequate machine and the cheapest studs that fit it. A manufacturer whose own output is audited by its customer needs weld records, buys documented systems, and pays several times more for equipment that produces evidence rather than just welds.

High-value pools concentrate where the weld carries consequence: battery enclosures with structural and safety obligations, shipbuilding and offshore fabrication with class society oversight, and any assembly where a failed weld becomes visible late and expensively. Where the requirement is a stud on a bracket in a workshop, price decides and any working machine will serve. That divide follows consequence rather than volume.

Volume / Commodity-Adjacent

Standard carbon steel studs and basic manual welding guns sold against independent producers supplying the same installed bases. The ten-point range reflects wire rod purchasing and heading scale rather than any property a fabricator could distinguish in use.
Gross Margin: 20% to 30%

Premium / Certified

Stainless and coated studs, proprietary ferrules, and portable systems supplied with substrate parameter guidance and training. The twelve-point range separates manufacturers producing their own ferrules from those buying a standardised component in.
Gross Margin: 34% to 46%

Sustainability / Regulatory / Next-Generation

Automated cells with per-weld monitoring, retained records, and engineered feeding for documented fabrication. The fourteen-point range reflects feed reliability and monitoring depth, which together determine throughput and whether records satisfy an audit.
Gross Margin: 48% to 62%
stud-welding-equipment-market-portfolio-architecture-1790015693082

High-value Sub-segments and Strategic Watch-out

Monitored Automated Welding Cells

Highest value in the category, supplying weld records where destructive testing reaches roughly four per cent of production. The fourteen-point range reflects feed engineering, since throughput stops at feeding rather than at welding capability. Audited customers specify these systems, and general fabricators do not. Feeding decides throughput.
Gross Margin: 50% to 64%

Proprietary Ferrules And Consumables

High value anchoring consumable attachment on the one component third parties cannot readily substitute for a standardised stud. The twelve-point range reflects whether ferrule production is held in house or a standard part is simply bought in. Standardised studs cannot anchor anything at all. Ferrules are the anchor.
Gross Margin: 42% to 54%

Stainless And Coated Stud Supply

Volume core where material specification and coating quality genuinely differ between suppliers unlike plain carbon studs. The ten-point range reflects material sourcing and finishing capability rather than any welding technology at all. Material specification genuinely differs between suppliers here. Coating quality varies considerably between producers.
Gross Margin: 34% to 44%

Standard Carbon Steel Studs

The strategic watch-out. Dimensionally standardised, produced by independents at lower cost, and fitting every gun in the installed base without difficulty. The ten-point range reflects wire rod purchasing and heading scale alone. Independents fit every gun in the installed base. Nothing at all defends the position here.
Gross Margin: 18% to 28%

How This Demand Recurs

The two halves of this market recur on completely different clocks. A welding power source is purchased roughly once every eleven years and generates nothing between those events. Studs and ferrules are consumed on every shift and represent 68% of category value. A manufacturer measuring itself on equipment shipments is watching the smaller and slower of the two revenue streams while somebody else collects the other.
Attachment depth follows whether the consumable was secured at the point of equipment sale. Customers who signed a supply agreement alongside the machine continue buying studs from the manufacturer for the life of the equipment. Those who did not switch to independent suppliers within a year or two, since the studs fit and cost materially less, and there is no practical mechanism to bring them back afterwards.

The buyer profile is splitting between general fabricators and audited manufacturers, and the two want entirely different things. A fabricator wants a machine that works and studs that are cheap. A battery enclosure or shipyard customer wants evidence, records, and repeatability, and will pay for equipment that produces documentation. Serving both from one product range is becoming genuinely difficult.
stud-welding-equipment-market-end-use-penetration-index-1790015693577

Where This Market Rewards

These are among the four positions where our research anticipates prominent divergence between winners and laggards over the coming forecast period. Each is grounded in the demand model, the regulatory perimeter, and the announced capacity pipeline.
01 / CONSUMABLE ATTACHMENT DISCIPLINE

The machine is not the business

Studs and ceramic ferrules represent 68% of category value while a welding power source lasts around eleven years between purchases. Manufacturers attaching consumable supply agreements at the point of equipment sale report lifetime account values 3.6 times greater than competitors who sell the machines alone. A substantial number of participants in this industry still measure their success in units of equipment shipped rather than consumables supplied, and once a fabricator has moved to independent studs there is no route back.
02 / PER WELD DOCUMENTATION

Four per cent get properly tested

Destructive testing is the only genuinely reliable verification of a stud weld, and roughly 4% of production welds ever receive it in practice. Manufacturers supplying per-weld monitoring records report specification wins 2.7 times higher among the customers whose own output is itself audited by somebody else. A recorded weld within parameters is not proof of fusion and remains far better evidence than a visual glance at a fillet, which passes convincing cold welds that fail under load months afterwards instead.
03 / SURFACE PREPARATION SUPPORT

The plate causes it, the machine gets blamed

Around 57% of all field weld defects trace back to mill scale, rust, paint, or galvanising rather than to any fault at all in the equipment doing the welding. Manufacturers providing substrate-specific parameter guidance alongside preparation training report warranty claims 3.1 times lower than competitors supplying the equipment alone. It costs training material and a site visit, and it protects a reputation from failures the machine never caused, which is a discipline the equipment manufacturer can neither see nor supervise.
04 / FEED SYSTEM ENGINEERING

Welding was never the bottleneck

Automated stud cells reach around 3.2 seconds per weld before the stud feeding rather than the welding process itself becomes the binding constraint on throughput. Manufacturers who invest seriously in feed reliability now report cell throughput 24% to 37% above competitors matching robot specifications alone on paper. Almost every specification conversation in automated stud welding concentrates on the half of the machine that was never the limitation, which is the half of the machine that was never actually the limitation.

Engagement Snapshot From the Field

A live engagement with an industry participant carrying material or product regulatory and market exposure ahead of a defining policy shift, showing how our research translates into a defensible multi-year portfolio strategy.
MARKET MINDS ADVISORY · CLIENT ENGAGEMENT SUMMARY
Stud Welding Equipment Producer Strategic Portfolio Review and Transition Roadmap 2026·Investment Scenario on Stud Welding Equipment Exposure Evaluation 2025-26
CLIENT PROFILE
A European stud welding equipment manufacturer with annual revenue near EUR 88 million (client-reported, unverified by MMA), selling drawn arc and capacitor discharge systems across seventeen markets. Equipment volumes had grown steadily for five years while total revenue barely moved, and management could not reconcile the two figures. The board wanted the discrepancy explained before further investment.
STRATEGIC CHALLENGE
Sales leadership read the flat revenue as pricing pressure and had proposed a premium equipment range. Nobody had traced what happened to consumable purchasing after an equipment sale, or established how much of the installed base was being supplied by independent stud producers instead. Pricing pressure and consumable leakage imply entirely different remedies.
MMA APPROACH
MMA traced consumable purchasing across the installed base by customer and year, compared attachment rates where a supply agreement had accompanied the equipment against where it had not, benchmarked independent stud pricing, and modelled outcomes under premium equipment, consumable capture, and ferrule proprietisation. Ferrule geometry was assessed separately, since the stud is standardised and the ferrule need not be.
KEY FINDINGS
  1. Around 74% of the installed base bought no consumables from the client after the second year, having moved to independent stud producers at materially lower prices.
  2. Customers with a supply agreement signed alongside the equipment retained consumable purchasing at rates several times higher throughout the equipment life. Nobody had tracked that difference before.
  3. Consumables represented a substantially larger revenue opportunity across the installed base than every equipment sale the business had made in the same period.
  4. A premium equipment range would have addressed the smaller and slower of the two revenue streams while leaving the larger one flowing to competitors.
CLIENT PROFILE
A European stud welding equipment manufacturer with annual revenue near EUR 88 million (client-reported, unverified by MMA), selling drawn arc and capacitor discharge systems across seventeen markets. Equipment volumes had grown steadily for five years while total revenue barely moved, and management could not reconcile the two figures. The board wanted the discrepancy explained before further investment.
STRATEGIC CHALLENGE
Sales leadership read the flat revenue as pricing pressure and had proposed a premium equipment range. Nobody had traced what happened to consumable purchasing after an equipment sale, or established how much of the installed base was being supplied by independent stud producers instead. Pricing pressure and consumable leakage imply entirely different remedies.
MMA APPROACH
MMA traced consumable purchasing across the installed base by customer and year, compared attachment rates where a supply agreement had accompanied the equipment against where it had not, benchmarked independent stud pricing, and modelled outcomes under premium equipment, consumable capture, and ferrule proprietisation. Ferrule geometry was assessed separately, since the stud is standardised and the ferrule need not be.
KEY FINDINGS
  1. Around 74% of the installed base bought no consumables from the client after the second year, having moved to independent stud producers at materially lower prices.
  2. Customers with a supply agreement signed alongside the equipment retained consumable purchasing at rates several times higher throughout the equipment life. Nobody had tracked that difference before.
  3. Consumables represented a substantially larger revenue opportunity across the installed base than every equipment sale the business had made in the same period.
  4. A premium equipment range would have addressed the smaller and slower of the two revenue streams while leaving the larger one flowing to competitors.
RECOMMENDED STRATEGY
Phase 1: Phase one: halt the premium range and attach a consumable supply agreement to every equipment sale as a standing commercial condition. Phase 2: Phase two: develop proprietary ferrule geometry, since the stud is standardised and the ferrule genuinely need not be. Ferrules anchor what studs cannot. Phase 3: Phase three: build heading and threading capacity to supply the installed base directly rather than through third parties. Third parties currently collect that revenue.
OUTCOME
Consumable revenue rose 41% within six quarters as supply agreements accompanied new equipment sales (client-reported, unverified by MMA). Attachment on new installations exceeded three quarters. The premium equipment programme was cancelled before development began. Ferrule geometry development entered the following year's engineering programme. Attachment is now a standing commercial condition.

Frequently Asked Questions

Foundational context covering the market sizes, CAGR, scope, country, region and competition that inform every finding below. This section is provided to cover basics and most often pre-purchase conversations, answered from the MMA Primary Research Dataset.

What is the current size of the Stud Welding Equipment Market?

The market was worth USD 1.4 billion in 2025 and reaches USD 1.5 billion in 2026. Value covers stud welding equipment together with the studs and ferrules consumed.

How large will the Stud Welding Equipment Market be by 2036?

MMA forecasts USD 2.6 billion by 2036, an increase of USD 1.1 billion across the forecast period. That represents 1.73 times the 2026 base of USD 1.5 billion.

What is the CAGR for the Stud Welding Equipment Market 2026 to 2036?

The base case compound annual growth rate is 5.6%, with a bull case at 6.8% and a bear case at 4.4%. Historical growth from 2020 to 2025 ran at 4.5%.

Which segment is growing fastest?

Short cycle stud welding grows at 8.4%, half again the market rate of 5.6%. Thin section applications in battery enclosures and solar structures require exactly that capability.

Who are the major companies in the Stud Welding Equipment Market?

Nelson Stud Welding, Stanley Engineered Fastening, HBS Bolzenschweiss-Systeme, Heinz Soyer Bolzenschweisstechnik, and Koester and Co lead. Together they hold 47% of revenue, with independent stud producers supplying installed bases.

Which country is growing fastest?

China grows at 9.4%, the fastest of any country covered here. Shipbuilding volumes no other country approaches run alongside solar mounting structure fabrication that consumes studs in enormous quantity.

Report Segmentation Architecture

The full report scope spans multiple orthogonal segmentation dimensions, with cross-tabulated demand data provided for each dimension pair. Coverage extends further to regional breakdowns, trend trajectories, and the competitive detail needed to support segment-level decision-making.

By Welding Process

  • Short Cycle Stud Welding
  • Capacitor Discharge Stud Welding
  • Friction Stud Welding
  • Drawn Arc Stud Welding
  • Gas Arc Shielded Stud Welding
  • Resistance Stud Welding

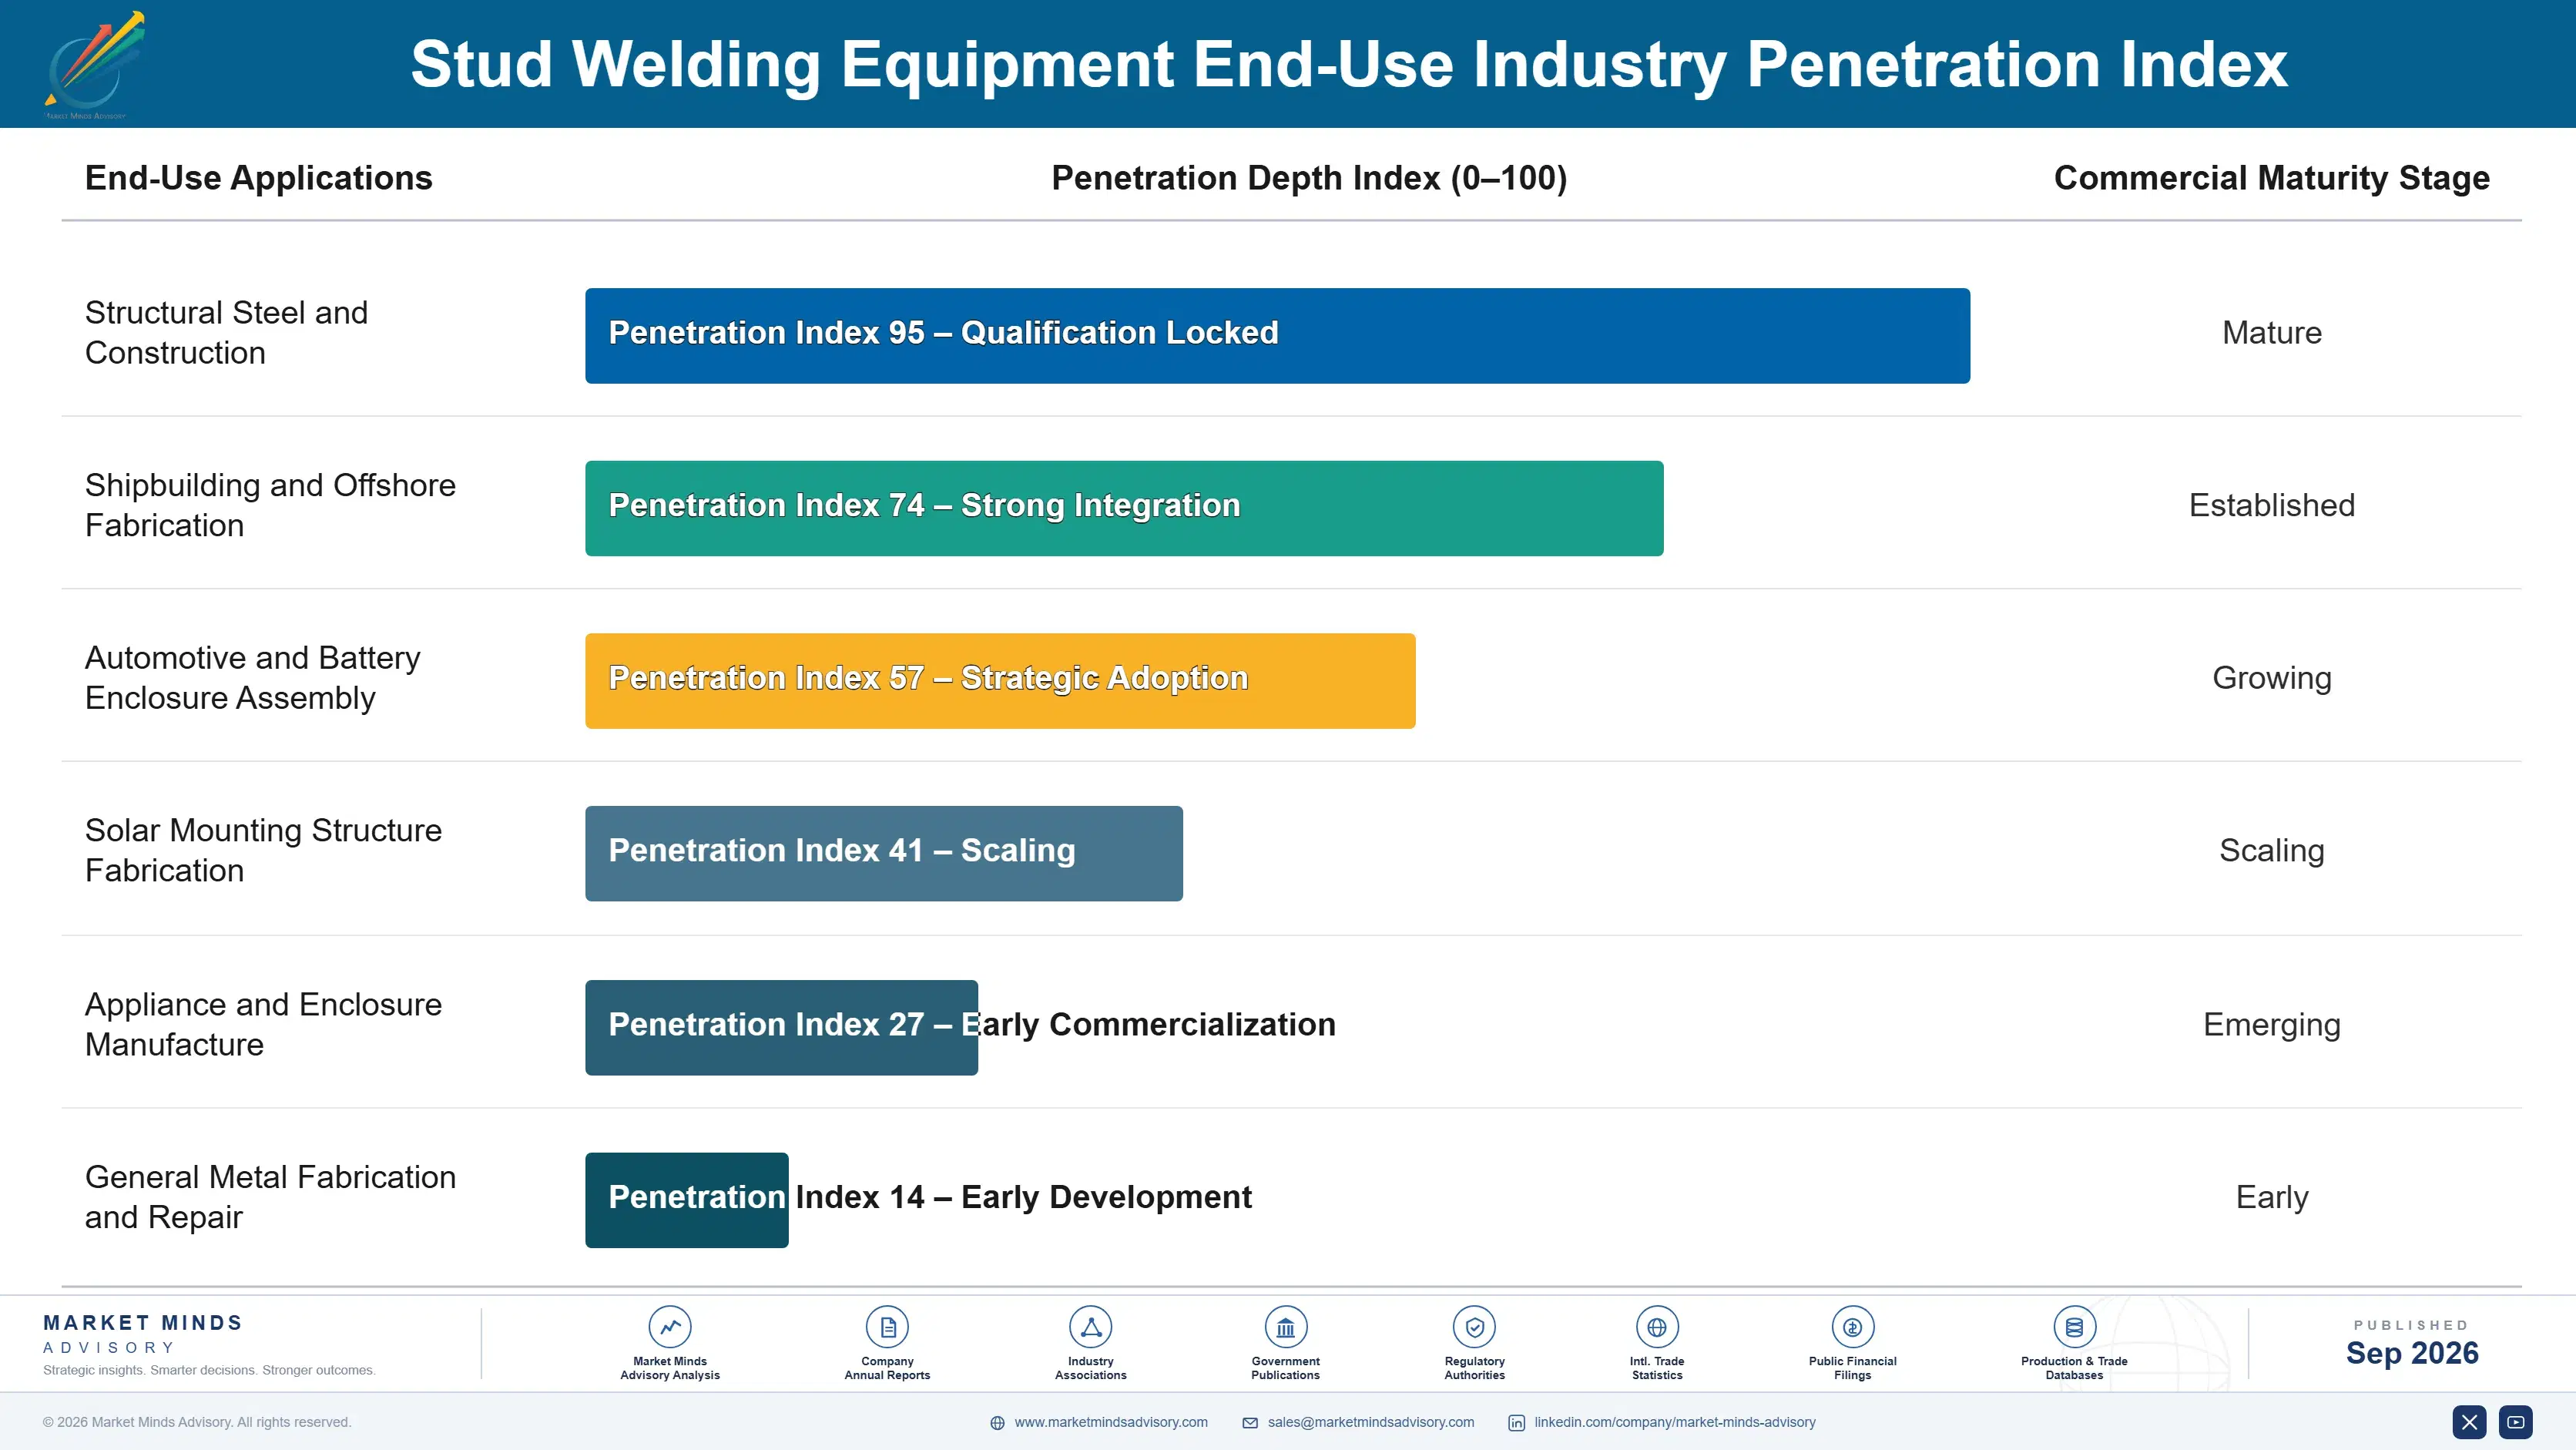
By End-Use Industry

  • Structural Steel and Construction
  • Shipbuilding and Offshore Fabrication
  • Automotive and Battery Enclosure Assembly
  • Solar Mounting Structure Fabrication
  • Appliance and Enclosure Manufacture
  • General Metal Fabrication and Repair

By Commercial Dimension

  • Direct Equipment Sales
  • Consumable Supply Agreements
  • Industrial Distributor Networks
  • Automated Cell Integration Contracts
  • Rental and Site Hire
  • Training and Technical Support Services

By Region

  • East Asia
  • Western Europe
  • North America
  • South Asia and Pacific
  • Latin America
  • Middle East and Africa
  • Eastern Europe

Scope, Methodology, and Coverage

Every figure in this report is reproducible from documented input assumptions. The scope below maps the historical period, the forecast horizon, the segmentation dimensions, and the countries covered, alongside the underlying primary and qualitative methodology.
Historical Period
2020 to 2025
Forecast Period
2026 to 2036
Base Year
2025 (USD billions; MMA Primary Research Dataset, September 2026)
Market Definition
This market covers stud welding equipment and its consumables, across short cycle, capacitor discharge, friction, drawn arc, gas arc shielded, and resistance stud welding systems. Welding studs, ceramic ferrules, and process consumables are counted within the process they serve. It excludes general arc welding equipment, spot and resistance sheet welding, laser welding systems, mechanical fasteners requiring no weld, and consumables for non-stud welding processes.
Quantitative Units
USD billions, revenue at manufacturer selling price
Segmentation Dimensions
Welding process, end-use industry, commercial dimension, region
Regions Covered
East Asia, Western Europe, North America, South Asia and Pacific, Latin America, Middle East and Africa, Eastern Europe
Countries Covered
China, Japan, South Korea, Taiwan, Germany, Italy, France, United Kingdom, Netherlands, Spain, Sweden, Poland, Czechia, United States, Canada, Mexico, India, Australia, Vietnam, Indonesia, Thailand, Brazil, Chile, Colombia, Argentina, Saudi Arabia, United Arab Emirates, Qatar, Egypt, South Africa
Key Companies Profiled
Nelson Stud Welding, Stanley Engineered Fastening, HBS Bolzenschweiss-Systeme, Heinz Soyer Bolzenschweisstechnik, Koester and Co, Taylor Studwelding Systems, Image Industries, Sunbelt Stud Welding, Cutlass Industries, Midwest Fasteners, BTH Stud Welding, nVent Electric, Tru-Weld Equipment, Bolte, KUKA, Fanuc, ABB, Fronius International, Kemppi, Lincoln Electric
Quantitative Methodology
Primary survey, n=3,800 respondents, Q4 2025, six countries; demand-side model with trade association cross-validation
Qualitative Methodology
47 expert interviews, Q4 2025; applied to validate demand model assumptions, identify emerging dynamics, and assess competitive positioning
Report Format
PDF and XLSX data workbook (Word format preview document)
Publisher
Market Minds Advisory
Report Code
MMA-2026-CON-421
Published
September 2026
Contact
sales@marketmindsadvisory.com | www.marketmindsadvisory.com

Purchase the full Stud Welding Equipment Market Report (2026 to 2036).

The full report sizes the stud welding market across six welding processes, seven regions, and thirty countries, with forecasts to 2036 under base, bull, and bear cases. It quantifies how much of category value sits in consumables rather than equipment, measures how rarely welds are verified by the only reliable method, and attributes field defects between base metal condition and machine performance. Competitive analysis covers twenty participants evaluated consistently on category revenue, with detailed treatment of consumable attachment and independent stud supply. Cost structure, feed engineering constraints, and documentation requirements are analysed throughout. Primary research includes 3,800 survey responses and 47 expert interviews.
Six welding processes sized and forecast separately
Twenty participants evaluated on category revenue consistently
Consumable and equipment revenue split analysed across installed bases
Weld verification practice measured against destructive testing rates
Field defect causes attributed between substrate and equipment
Automated cell throughput constraints traced to feed engineering

Built For The People Who Decide

From boardroom strategy to bench-side execution, this report is read cover-to-cover by leaders shaping the next decade of their industry, turning demand scenarios, market dynamics and valuation benchmarks into decisions.
CXOs/ Presidents/ VPs/ Managers
M&A and Corporate Development
Strategy Teams and R&D Heads
Procurement and Product Directors
Regulatory and Compliance Leaders
Investor Relations and Equity Analysts