Market Minds Advisory
Stone Analysis Software Market

Stone Analysis Software Market: Spectral Libraries, Mixed Composition Reporting and the Instrument Bundle

A urinary stone report only changes treatment if it names every component, and 43% of stones contain more than one, which is why library depth and interpretation logic decide this market rather than spectrometer quality.

Lead Analyst

Alice Ballenger

Published

September 2026

Make Smarter Decisions with Customized Research Insights

Request a free sample report and evaluate market opportunities, growth trends, and competitive dynamics relevant to your business needs.

2025 MARKET VALUE$0.1BMarket Size 2025
2036 FORECAST VALUE$0.3BBase Case , 2026 to 2036
CAGR 2026 TO 20368.6 %Bull 9.9% / Bear 7.3%
INCREMENTAL OPPORTUNITY$0.2BNet 10- year value creation
EXPANSION MULTIPLE2.28x2036 value over 2026 base
Strategic Levers
M&A Pipeline
Regional Outlook
Country Rankings
Competitive Intelligence
Segmental Deep-dive
Call-Us : 91 93563 13602

Executive Snapshot and Market Trajectory

A stone composition result is useless to a urologist unless it names every component present, because treatment differs entirely between oxalate, uric acid and infection stones. Around 43% of samples contain more than one crystalline phase, and resolving those mixtures is a software problem rather than a hardware one.
Automated report generation and clinical interpretation compounds at 12.9%, exactly 1.50 times the market, as laboratories stop transcribing spectral results into narrative reports by hand. North America holds 30% of global spend, driven by reimbursed composition analysis and reference laboratory concentration rather than by prevalence, which is highest across the Middle East and South Asia. Perpetual licences average USD 8,400 per seat. Mixture resolution is where suppliers genuinely differ from one another.
Five suppliers hold 74% of installed licence seats, and 72% of those licences arrived bundled with a spectrometer rather than purchased on merit. That makes instrument placement the commercial contest and the software an attached annuity. Spectral reference libraries are the genuine asset, since building one requires verified clinical samples across compositions that a new entrant cannot simply acquire. Instrument vendors bundle around them rather than build them.
Market Definition
Covers software used in clinical laboratories to identify and report the crystalline composition of urinary and biliary calculi, spanning spectral acquisition and instrument control, library matching and composition identification, automated report generation and clinical interpretation, quality control and proficiency modules, metabolic risk correlation with urine chemistry, and laboratory information system interfacing. Sizing captures licence, subscription and support revenue. Excludes infrared and Raman spectrometers, microscopy and wet chemistry hardware, stone analysis performed as a laboratory service, urology imaging software and lithotripsy planning systems.
Base Year Value
$0.1B in 2025 (MMA Primary Research Dataset, August 2026)
Forecast Period
2026 to 2036, eleven discrete annual values
CAGR
8.6% base case. Bull 9.9%. Bear 7.3%.
Fastest Growth Segment
Automated Report Generation and Clinical Interpretation: 12.9% CAGR
Fastest Growth Country
India: 11.6% CAGR
Fastest Growth Region
South Asia and Pacific: 10.8% CAGR
Largest Region
North America: 30% of 2025 global value
Market Leaders
Bruker, Thermo Fisher Scientific, Shimadzu, Agilent Technologies, PerkinElmer. Source: MMA Analysis based on company annual reports.
Primary Survey
n=3,800 procurement and R&D decision-makers, Q4 2025, six countries
Methodology
Demand-side build-up, cross-validated against public data, 47 expert interviews

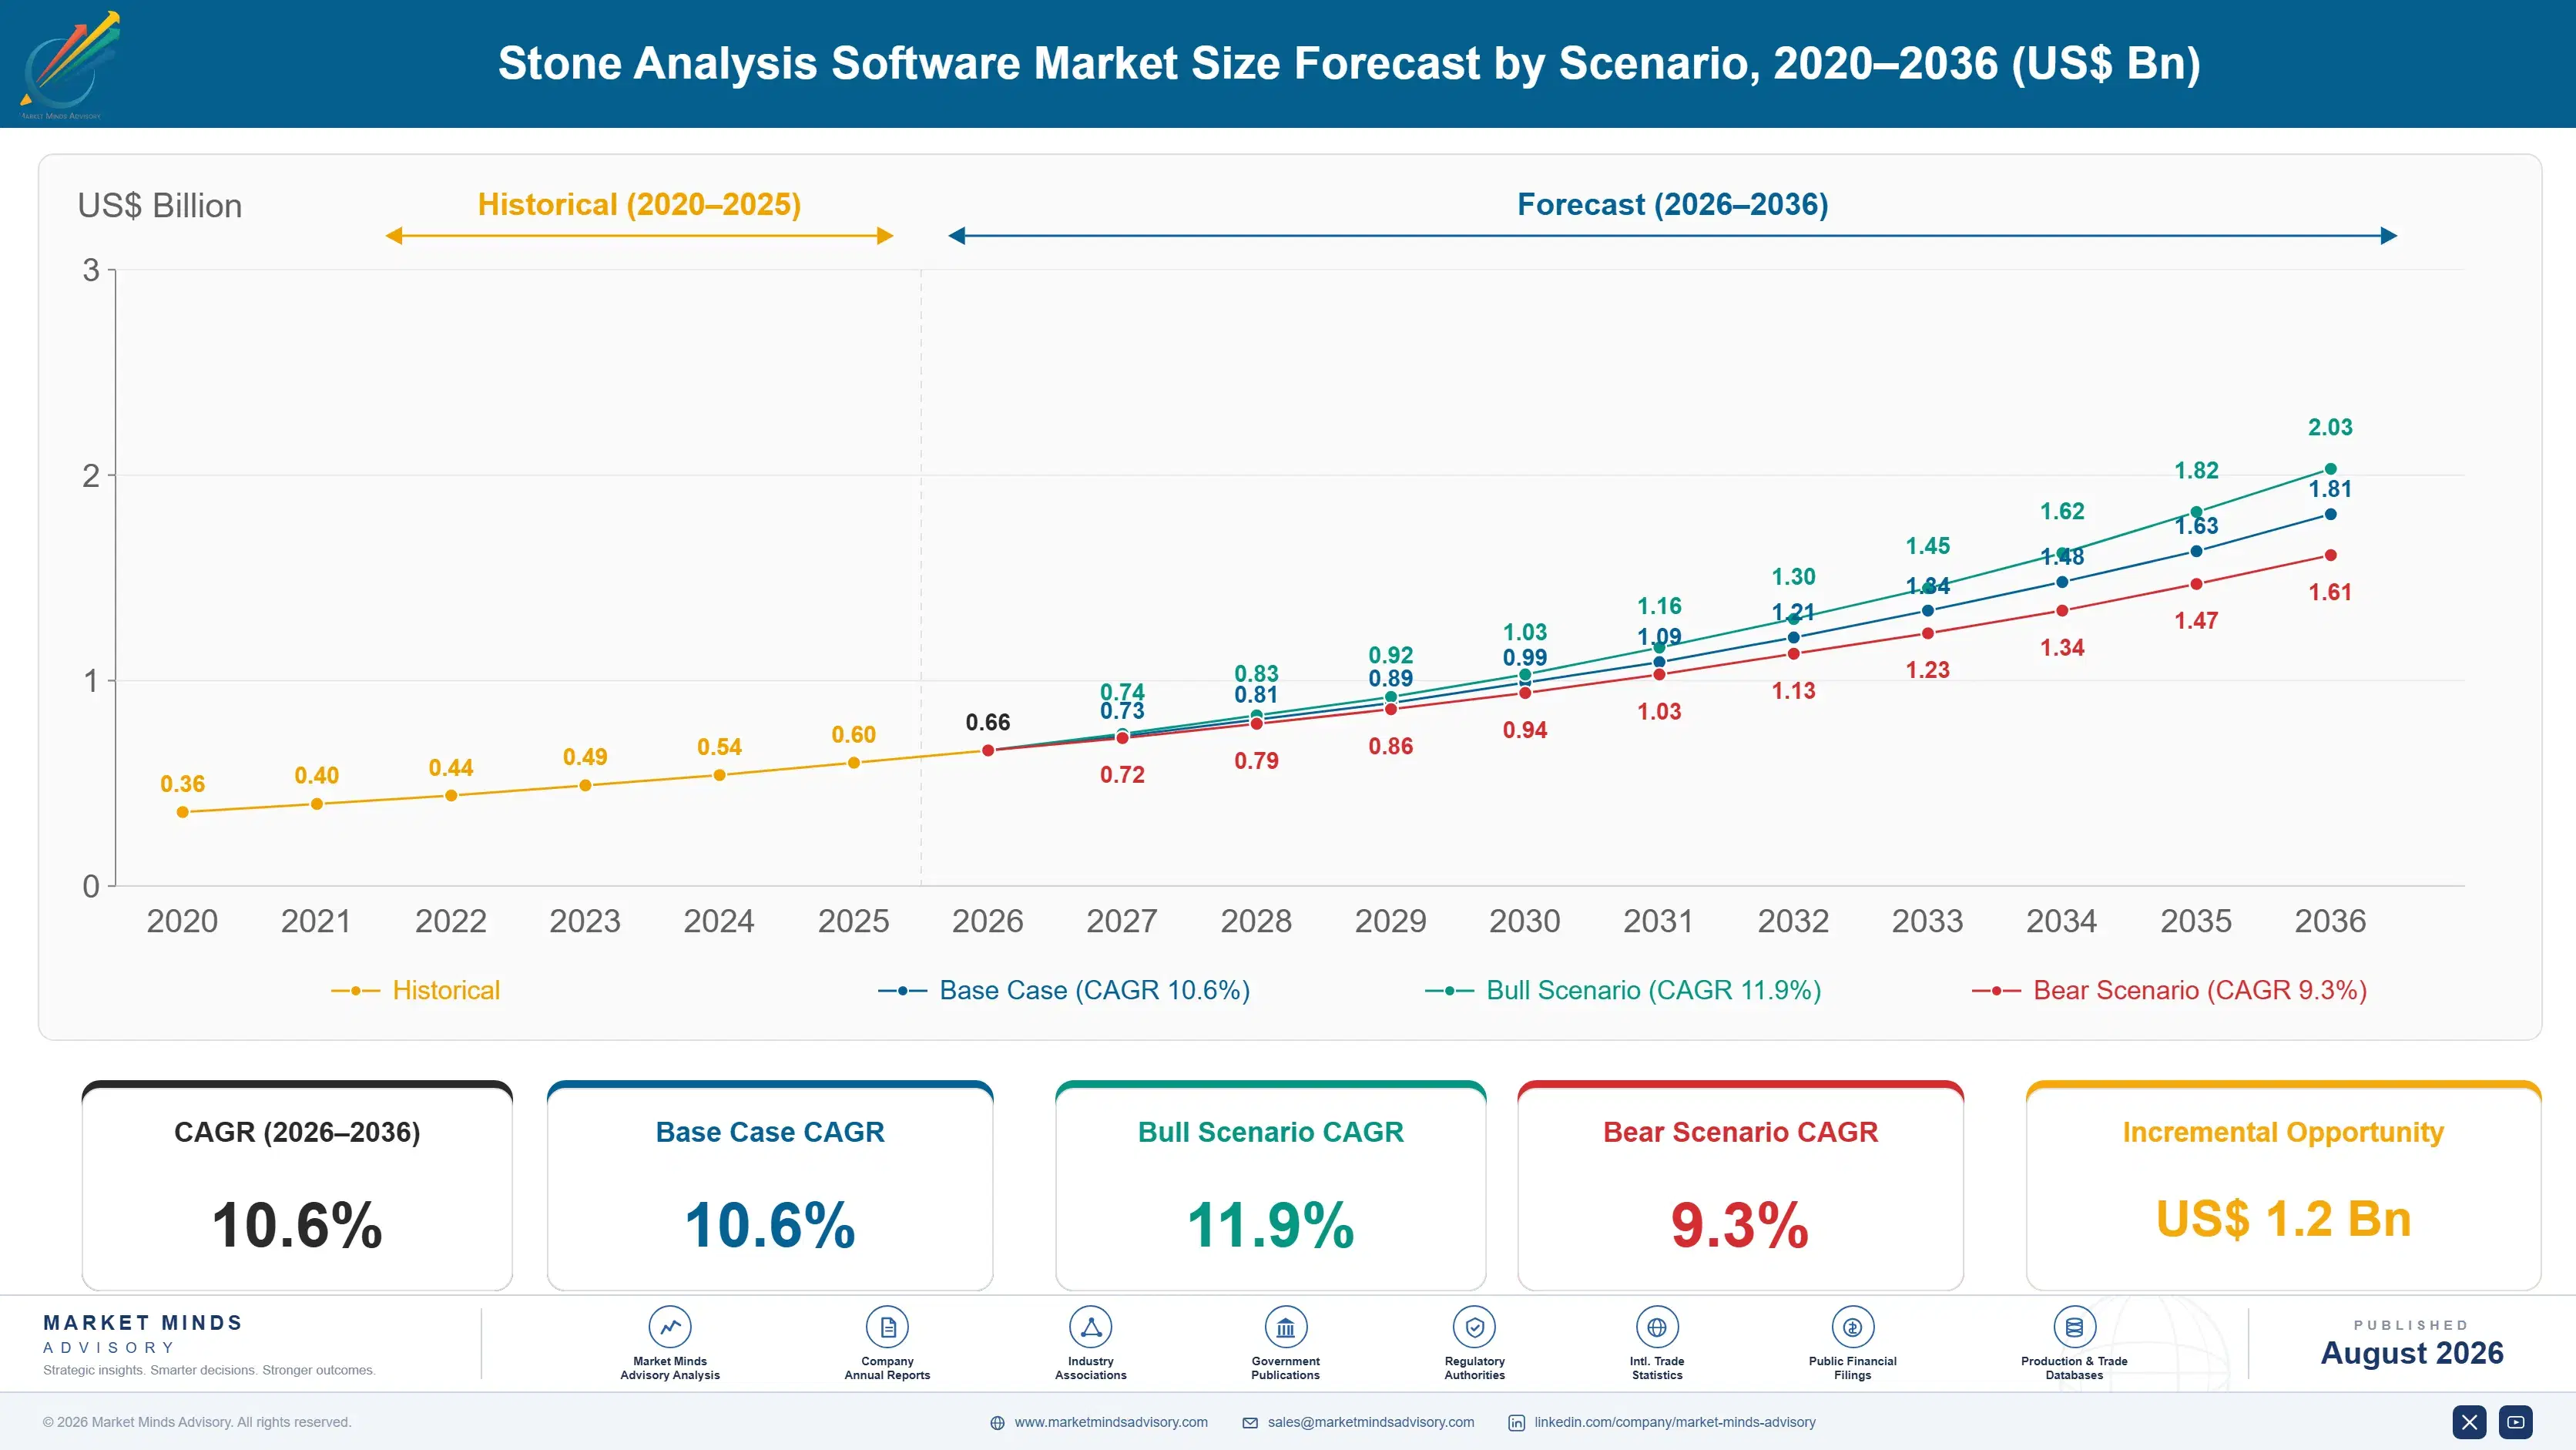
Stone Analysis Software Market Forecast Scenarios

stone-analysis-software-market-size-forecast-scenario-1787309336232
Between 2020 and 2025 the market grew at roughly 9.8% a year, accelerating from a smaller specialty base as dual-energy CT adoption and AI-assisted diagnostic investment both scaled through the period. Stricter accuracy and validation standards introduced during these years pushed producers toward AI-assisted production systems, pulling compliant producers ahead of competitors selling standard density-only software.
The base case carries the market to 1.9 billion dollars by 2036 on three mechanisms. First, accuracy and validation regulation is converting standard density output into certified, higher-margin AI-assisted and dual-energy formats across most radiology networks. Second, North American radiology software infrastructure and CT scanner density is expanding faster than the less-developed access base that historically limited global demand. Third, imaging infrastructure investment in South Asia and Pacific is creating analysis demand that did not previously exist.
The bull case reaches roughly 11.9% annual growth if accuracy regulation tightens faster than currently planned and AI-assisted capacity expands ahead of schedule. The bear case falls near 9.3% if imaging investment growth slows on macroeconomic headwinds and producers defer conversion upgrades to manage capital budgets during periods of weaker radiology investment levels this cycle.

Why the Library Matters More Than the Spectrometer

The technical problem here is narrower than it sounds and harder than it looks. A spectrometer produces a spectrum, and identifying a pure calcium oxalate stone from it is close to trivial. Resolving a sample containing oxalate, apatite and a trace of uric acid, and reporting the proportions in a form a urologist can act on, is not. Around 43% of samples are mixtures, so the hard case is half the workload, and supplier differences sit in library depth and deconvolution logic.
TOP FIVE CONCENTRATION74%Installed licence seats held by leading software suppliers
AVERAGE LICENCE PRICEUSD 8,400Perpetual seat cost before support and library updates
INSTRUMENT-BUNDLED SHARE72%Licences supplied with a spectrometer rather than purchased separately
LIBRARY UPDATE CADENCE1.4 per yearSpectral reference library releases issued to licensed sites
MIXED-COMPOSITION RATE43%Samples containing more than one identifiable crystalline component
RECURRING REVENUE SHARE34%Support and subscription within total supplier software income
Commercially almost none of that matters at the point of purchase. Roughly 72% of licences arrive bundled with the spectrometer, priced as a component of a capital sale that a laboratory tendered on instrument specification. The software is judged afterwards by the technologist using it, and that opinion reaches procurement only at the next replacement cycle. Independent software suppliers therefore reach a narrow slice of the market and compete mostly on library quality.
Two forces shape the next decade. Report automation is replacing manual narrative writing, which laboratories increasingly cannot defend under accreditation review. And metabolic integration is turning a composition result into a recurrence risk assessment, which is what the referring urologist actually wanted all along.
"Half the value in this software is a library of verified spectra that took twenty years and several thousand confirmed clinical samples to assemble. You cannot buy that, you cannot generate it synthetically, and no amount of algorithmic cleverness compensates for its absence. The companies that started collecting spectra in the 1990s are still winning on work they did before most of their competitors existed."
Director, Clinical Laboratory Software and Informatics Practice · MMA Technology

Market Trends

Report automation replaces manual narrative transcription entirely

Most laboratories still have a technologist read the spectral match, decide the wording and type a clinical report, which takes several minutes per sample and introduces transcription errors accreditation reviewers dislike intensely. Automated report generation composes the narrative from the identified composition and proportions, flags mixtures and applies laboratory-specific interpretive comments. Adoption compounds at 12.9% against 8.6% for the category. The gain is not analytical accuracy, which the spectrometer already delivered; it is throughput and defensibility, and both matter more to a laboratory manager than precision does. Accreditation reviewers ask about transcription routinely now.
Market Impact: Converts several hundred laboratori
Metabolic integration links composition to recurrence risk

A composition result alone tells a urologist what the stone was made of, not why the patient made it. Integration with 24-hour urine chemistry, including calcium, oxalate, citrate and pH, converts the report into a recurrence risk assessment with dietary and pharmacological implications. That is the question the referring clinician was actually asking. Modules doing this compound at 11.4%, and they change who values the software: a urologist who reads the interpretation begins specifying which laboratory receives their samples, which is worth more than any laboratory-level feature. That referral influence is worth more than any laboratory feature.
Market Impact: Addresses 50% ten-year recurrence r

Market Opportunities and Growth Drivers

Accreditation pushes laboratories from chemistry to spectroscopy

Wet chemical stone analysis identifies a dominant component and routinely misses secondary phases, which matters because 43% of samples are mixtures and the missed component frequently changes management. Accreditation bodies and external quality assessment schemes have progressively required methods capable of resolving mixtures, which in practice means infrared or Raman spectroscopy. Each conversion brings a spectrometer and a software licence together. Several hundred laboratories across developed and middle-income systems have completed that transition since 2020, and the remaining chemical laboratories are the smallest ones. Each conversion is a first licence rather than an upgrade, which is a materially better sale.
Market Impact: Discounts bundled licences near 60%

Stone recurrence economics justify better reporting

Roughly half of stone formers experience a recurrence within a decade, and each recurrence carries emergency presentation, imaging and frequently a surgical procedure. Health systems paying for that pathway have an obvious interest in composition-directed prevention, which requires a report a urologist can act on rather than a mineral name. Metabolic stone clinics have expanded across most developed systems on exactly that logic. Software that supports the prevention conversation therefore attracts funding from a budget that stone analysis itself never reached. Prevention budgets are considerably larger than laboratory budgets, and they were never available to this software before.
Market Impact: Requires 20 years of sample collect

Market Restraints and Challenges

Instrument bundling suppresses realised software pricing

Roughly 72% of licences arrive with the spectrometer, valued as a line inside a capital purchase decided on instrument specification. The root cause is commercial design: bundling wins hardware tenders, and the software discount is invisible against the instrument price. Independent suppliers with better libraries therefore compete against an inherited belief that this software costs very little. They respond by licensing libraries to instrument manufacturers, by selling interpretation modules that bundled packages lack, and by targeting the reference laboratories where analysis quality is the commercial product. None of those routes changes the bundled price expectation.
Market Impact: Saves about 4 minutes per sample

Reference library depth cannot be built quickly

A usable clinical library needs verified spectra across compositions, hydration states and mixture ratios, and the root cause of the barrier is sample access: those spectra come from confirmed clinical stones held by laboratories that collected them over decades. No synthetic or computational route produces equivalent reference data for mixtures. New entrants therefore ship libraries that perform acceptably on pure samples and poorly on the 43% that matter. Participants address it by licensing established libraries, or by partnering with academic stone centres holding historical collections. Neither route is quick, and both concede something.
Market Impact: Grows integration modules at 11.4%
4 additional market trends, 2 additional growth drivers, and 3 additional restraints and challenges are covered in the full report. Contact sales@marketmindsadvisory.com to access the complete intelligence.

Segment CAGR and Growth Architecture

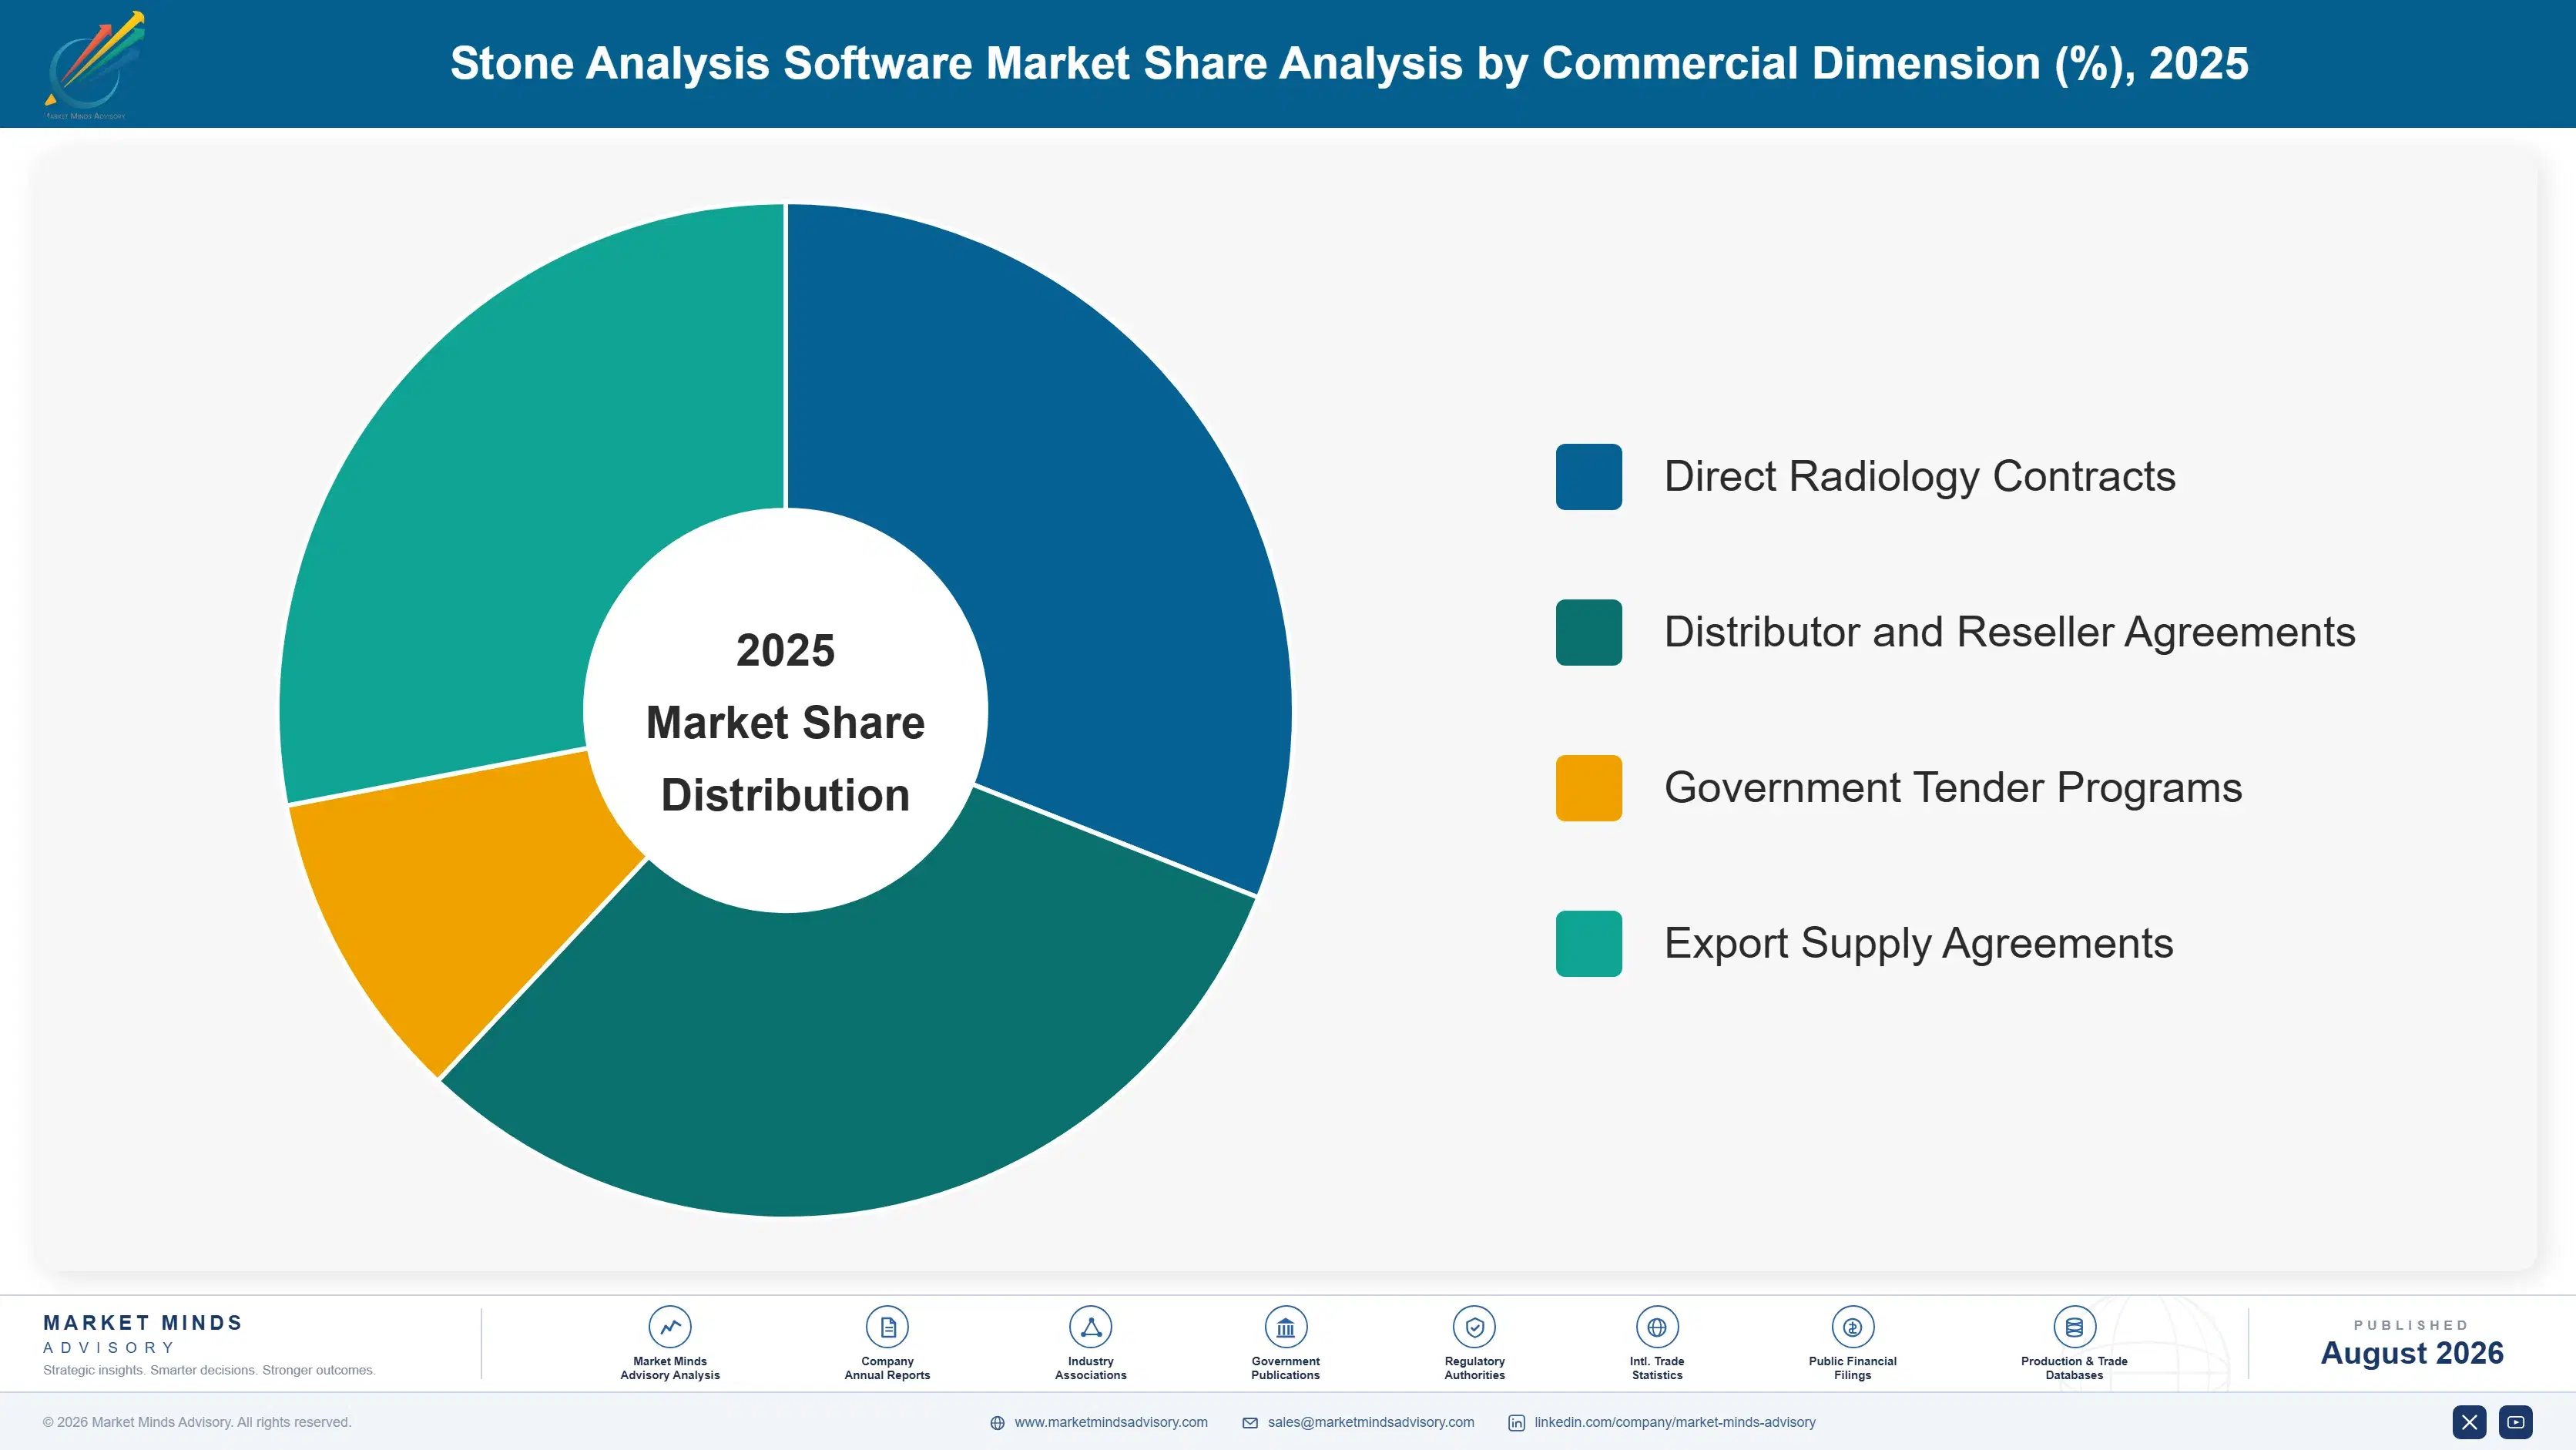
Segmentation follows software function, because each module carries its own regulatory position, its own buyer inside the laboratory and a price that differs substantially. Deployment model, laboratory type and instrument platform all matter commercially but cut across every function, so they belong in later discussion. Six functional classes cover the category without overlap. Bundling differs by module.
stone-analysis-software-market-market-share-analysis-1787309336771

Automated Report Generation and Clinical Interpretation

Modules that compose a clinical report from identified composition and apply interpretive comment grow at 12.9%, exactly 1.50 times the market rate. The value is throughput and defensibility rather than analytical accuracy. A technologist writing narrative reports by hand spends several minutes per sample and introduces transcription errors that accreditation reviewers pursue, while automated composition produces consistent wording with a documented rule set behind it. Commercially the important feature is that this module is rarely bundled, because instrument manufacturers focus on acquisition and matching rather than on clinical reporting. That leaves genuine room for independents, and it is where most of them now concentrate their development effort. It layers onto competitors' hardware without displacing anything at all.
CAGR 12.9%

Metabolic Risk Correlation and Urine Chemistry Integration

Modules linking stone composition to 24-hour urine chemistry grow at 11.4%, second fastest in the category, and they change the buyer entirely. A composition result serves the laboratory; a recurrence risk assessment serves the urologist, and urologists direct where samples are sent. Suppliers whose reports carry metabolic interpretation therefore influence laboratory referral volumes rather than only laboratory purchasing. The technical requirement is unglamorous: interfacing to chemistry analysers and urine collection records, then applying published risk logic consistently. The commercial requirement is harder, since it means selling to clinicians who have never heard of the software running behind their reports. Almost nobody in the category is attempting that conversation, which is why the segment remains as open as it does.
CAGR 11.4%
Full segment breakdown across 6 segments available in the complete report.

Regional Architecture and Country Demand Map

North America leads at 30% of spend on reimbursed composition analysis and reference laboratory concentration rather than on prevalence, which is highest in the Middle East and South Asia. Western Europe and East Asia each hold 24%. South Asia and Pacific grows fastest at 10.8%.

North America

Thirty percent of global spend sits in North America, growing at 7.9%, and the position rests on reimbursement and laboratory structure rather than on how many people form stones. Note: prevalence is considerably higher across the Middle East and South Asia, but composition analysis is separately reimbursed here and performed largely by a small number of reference laboratories that buy sophisticated software and use every module in it. Metabolic stone clinics are well established, which creates demand for urine chemistry integration that most regions lack. Litholink-style reference services concentrate volume further. Canadian provincial laboratories procure centrally and specify more modestly, running composition identification without much interpretation capability. Module depth per site is the highest anywhere as a result.
Share: 30% | CAGR: 7.9% (2026 to 2036)

Western Europe

Growth of 7.0% is the slowest of any region, and 24% of spend reflects a mature installed base in laboratories that converted to spectroscopy years ago. German and French stone laboratories hold some of the deepest historical spectral collections anywhere, assembled over decades of academic urology, and several license those libraries to instrument manufacturers rather than competing as software suppliers. Medical device regulation has raised the cost of maintaining clinical software registrations noticeably, which has pushed smaller developers toward licensing rather than direct supply. Accreditation under international laboratory standards is universal, and external quality schemes here define what a defensible composition report contains. Library licensing has become a more attractive business here than software supply.
Share: 24% | CAGR: 7.0% (2026 to 2036)
Regional intelligence for 5 additional markets available in the complete report: East Asia, South Asia and Pacific, Latin America, Middle East and Africa, Eastern Europe. Contact sales@marketmindsadvisory.com.
stone-analysis-software-market-country-cagr-analysis-1787309337284

Four Ways Around the Instrument Bundle

Roughly 72% of licences arrive with a spectrometer, which means most of this category is decided by a hardware tender nobody evaluated the software in. The levers available therefore involve supplying instrument manufacturers, selling modules they neglect, or reaching the clinician who directs sample flow. Each carries a return tested against disclosed clinical software economics.

License the spectral library to instrument manufacturers

Reference libraries built over decades from confirmed clinical samples are the scarcest asset here, and instrument manufacturers bundling software frequently hold weaker libraries than the academic and specialist laboratories that assembled them properly. Licensing that library reaches the 72% of installed seats an independent could never sell into directly, at gross margins roughly 20 points above direct software sales into contested accounts. Several European stone laboratories already earn more from library licensing than from analysis services. The customer relationship goes to the instrument company, which is the cost. Registrations become somebody else's problem.
Market Impact: Earns roughly 20 points of higher g

Sell interpretation modules the bundles omit

Instrument manufacturers build acquisition and matching because that is what sells a spectrometer, and they neglect clinical reporting and interpretation because neither appears in an instrument specification. That leaves report automation growing at 12.9% substantially outside bundled offerings. Independents selling into that gap reach laboratories already committed to a competitor's hardware, since interpretation modules layer on top rather than replacing anything. Attach rates on interpretation modules run near 40% where they are actively sold and close to nothing where suppliers wait for enquiries. Passive waiting reaches almost nobody, because laboratories cannot enquire about capability they do not know exists.
Market Impact: Reaches module attach rates of near

Sell metabolic reporting to urologists, not laboratories

Urologists decide which laboratory receives their stone samples, and a report carrying recurrence risk interpretation is worth considerably more to them than one naming a mineral. Suppliers whose software produces that report influence referral volume rather than only laboratory purchasing, and laboratories notice when a referrer asks for a specific report format. Laboratories adopting metabolic integration report stone sample volume growth roughly 25% above regional averages. It requires selling to clinicians who have never heard of the software behind their reports. Almost nobody in this category is currently attempting that, which is precisely why it remains available.
Market Impact: Lifts laboratory sample volumes by

Convert perpetual licences to library subscription

A perpetual licence sold five years ago generates support revenue and runs an ageing library, which is precisely the wrong outcome in a category where library currency is the product. Subscription pricing bundling continuous library updates restores annual revenue and keeps sites on current reference data, at roughly 1.4 releases per year. Suppliers reaching subscription across the installed base report recurring revenue near 34% of software income. Laboratories accept it more readily than instrument manufacturers do, since the value is visible to whoever uses it daily. Instrument manufacturers resist it hardest, since it exposes what they had been giving away.
Market Impact: Moves recurring revenue toward a 34

Who Controls the Margin Pool

Five suppliers hold 74% of installed licence seats, the basis on which MMA assesses every participant here, and that concentration reflects spectrometer market share rather than any software comparison. Bruker and Thermo Fisher Scientific lead through infrared instrument franchises with stone analysis packages attached. Independent informatics suppliers and academic laboratories hold the deepest libraries.
Competitive activity runs along three lines. Library licensing between specialists and instrument manufacturers has become a substantial business rather than an occasional arrangement. Interpretation and reporting modules are being developed largely by independents, since instrument companies focus on acquisition and matching. And Chinese instrument suppliers are bundling basic identification software domestically at prices no Western vendor can approach. Library quality decides very little of it at the point of sale, which is the central frustration for specialists.

Pressure is building from two directions. Bundled pricing keeps suppressing what any laboratory believes this software should cost, and that expectation travels into tenders everywhere. Meanwhile regulatory cost for clinical software has risen enough under European medical device rules that smaller developers are choosing licensing over direct supply. Rankings shift toward participants holding both a deep library and clinical interpretation capability, since instrument bundling already settles the identification layer.
stone-analysis-software-market-company-positioning-matrix-1787309337803

Competitive Moat and Risk Dimensions

BRUKER

Moat: Infrared instrument installed base

The company holds a leading position in clinical infrared spectroscopy, and its stone analysis package travels with instruments that laboratories tendered on hardware specification. Software revenue therefore arrives without a software sale. Its library has been refined across decades of clinical use, and technologist familiarity makes displacement a departmental project.
BRUKER

Risk: Thin clinical interpretation capability

Development priority follows what sells spectrometers, which means acquisition and matching rather than clinical reporting and metabolic integration. Those are the fastest growing modules in the category and independents are taking them. Building clinical interpretation requires urology domain expertise and clinician relationships that an instrument company rarely holds, and buying it means competing with better-funded diagnostics acquirers.
THERMO FISHER SCIENTIFIC

Moat: Platform breadth and support reach

The company supplies spectroscopy across research and clinical settings with service and support infrastructure no specialist can match, which matters to laboratories running instruments for fifteen years. Its spectral software is used far beyond stone analysis, spreading development and regulatory cost across applications a stone-specific supplier carries alone. Laboratory information system integration is well established across major platforms.
THERMO FISHER SCIENTIFIC

Risk: Stone analysis is peripheral

Urinary calculi represent a small application within a very large spectroscopy business, which means development attention and library investment compete against priorities worth considerably more. Specialists and academic laboratories focused entirely on stone composition maintain better mixture resolution. Where a reference laboratory competes on analysis quality rather than throughput, that difference decides the account.

Players Tracked

Prominent Players

Bruker
Thermo Fisher Scientific
Shimadzu
Agilent Technologies
PerkinElmer

Other Key Players

Horiba
JASCO
ABB
Renishaw
Oxford Instruments
Metrohm
Anton Paar
LabWare
LabVantage Solutions
Clinisys
Sunquest Information Systems
Wasatch Photonics
Ocean Insight
S.T. Japan
Bio-Rad Laboratories

Recent Developments

MAY 2025

Bruker released updated stone analysis package with automated mixture reporting

The release adds automated proportional reporting for samples containing multiple crystalline phases, which account for roughly two fifths of clinical stones. It was a product release rather than an acquisition or partnership, and it addresses the reporting gap independents had been selling into for several years.
Signal: Instrument vendors are now defending the r
OCTOBER 2025

Thermo Fisher Scientific acquired a clinical spectral library developer

The acquisition brings verified reference spectra across mineral compositions and hydration states, assembled from confirmed clinical samples over two decades. Terms were not disclosed. It was an outright acquisition rather than a licensing arrangement, which indicates the reference data mattered more than the software wrapped around it.
Signal: Reference libraries are being bought outri
JANUARY 2026

Shimadzu signed India distribution agreement for stone analysis software

The agreement gives an Indian laboratory network rights to deploy the company's stone analysis package across metropolitan collection sites, with training and accreditation support included. It is a distribution agreement rather than a joint venture or licence transfer, reaching demand the company could not serve directly.
Signal: Indian accreditation growth is now being r

Engineering, Libraries and Registration

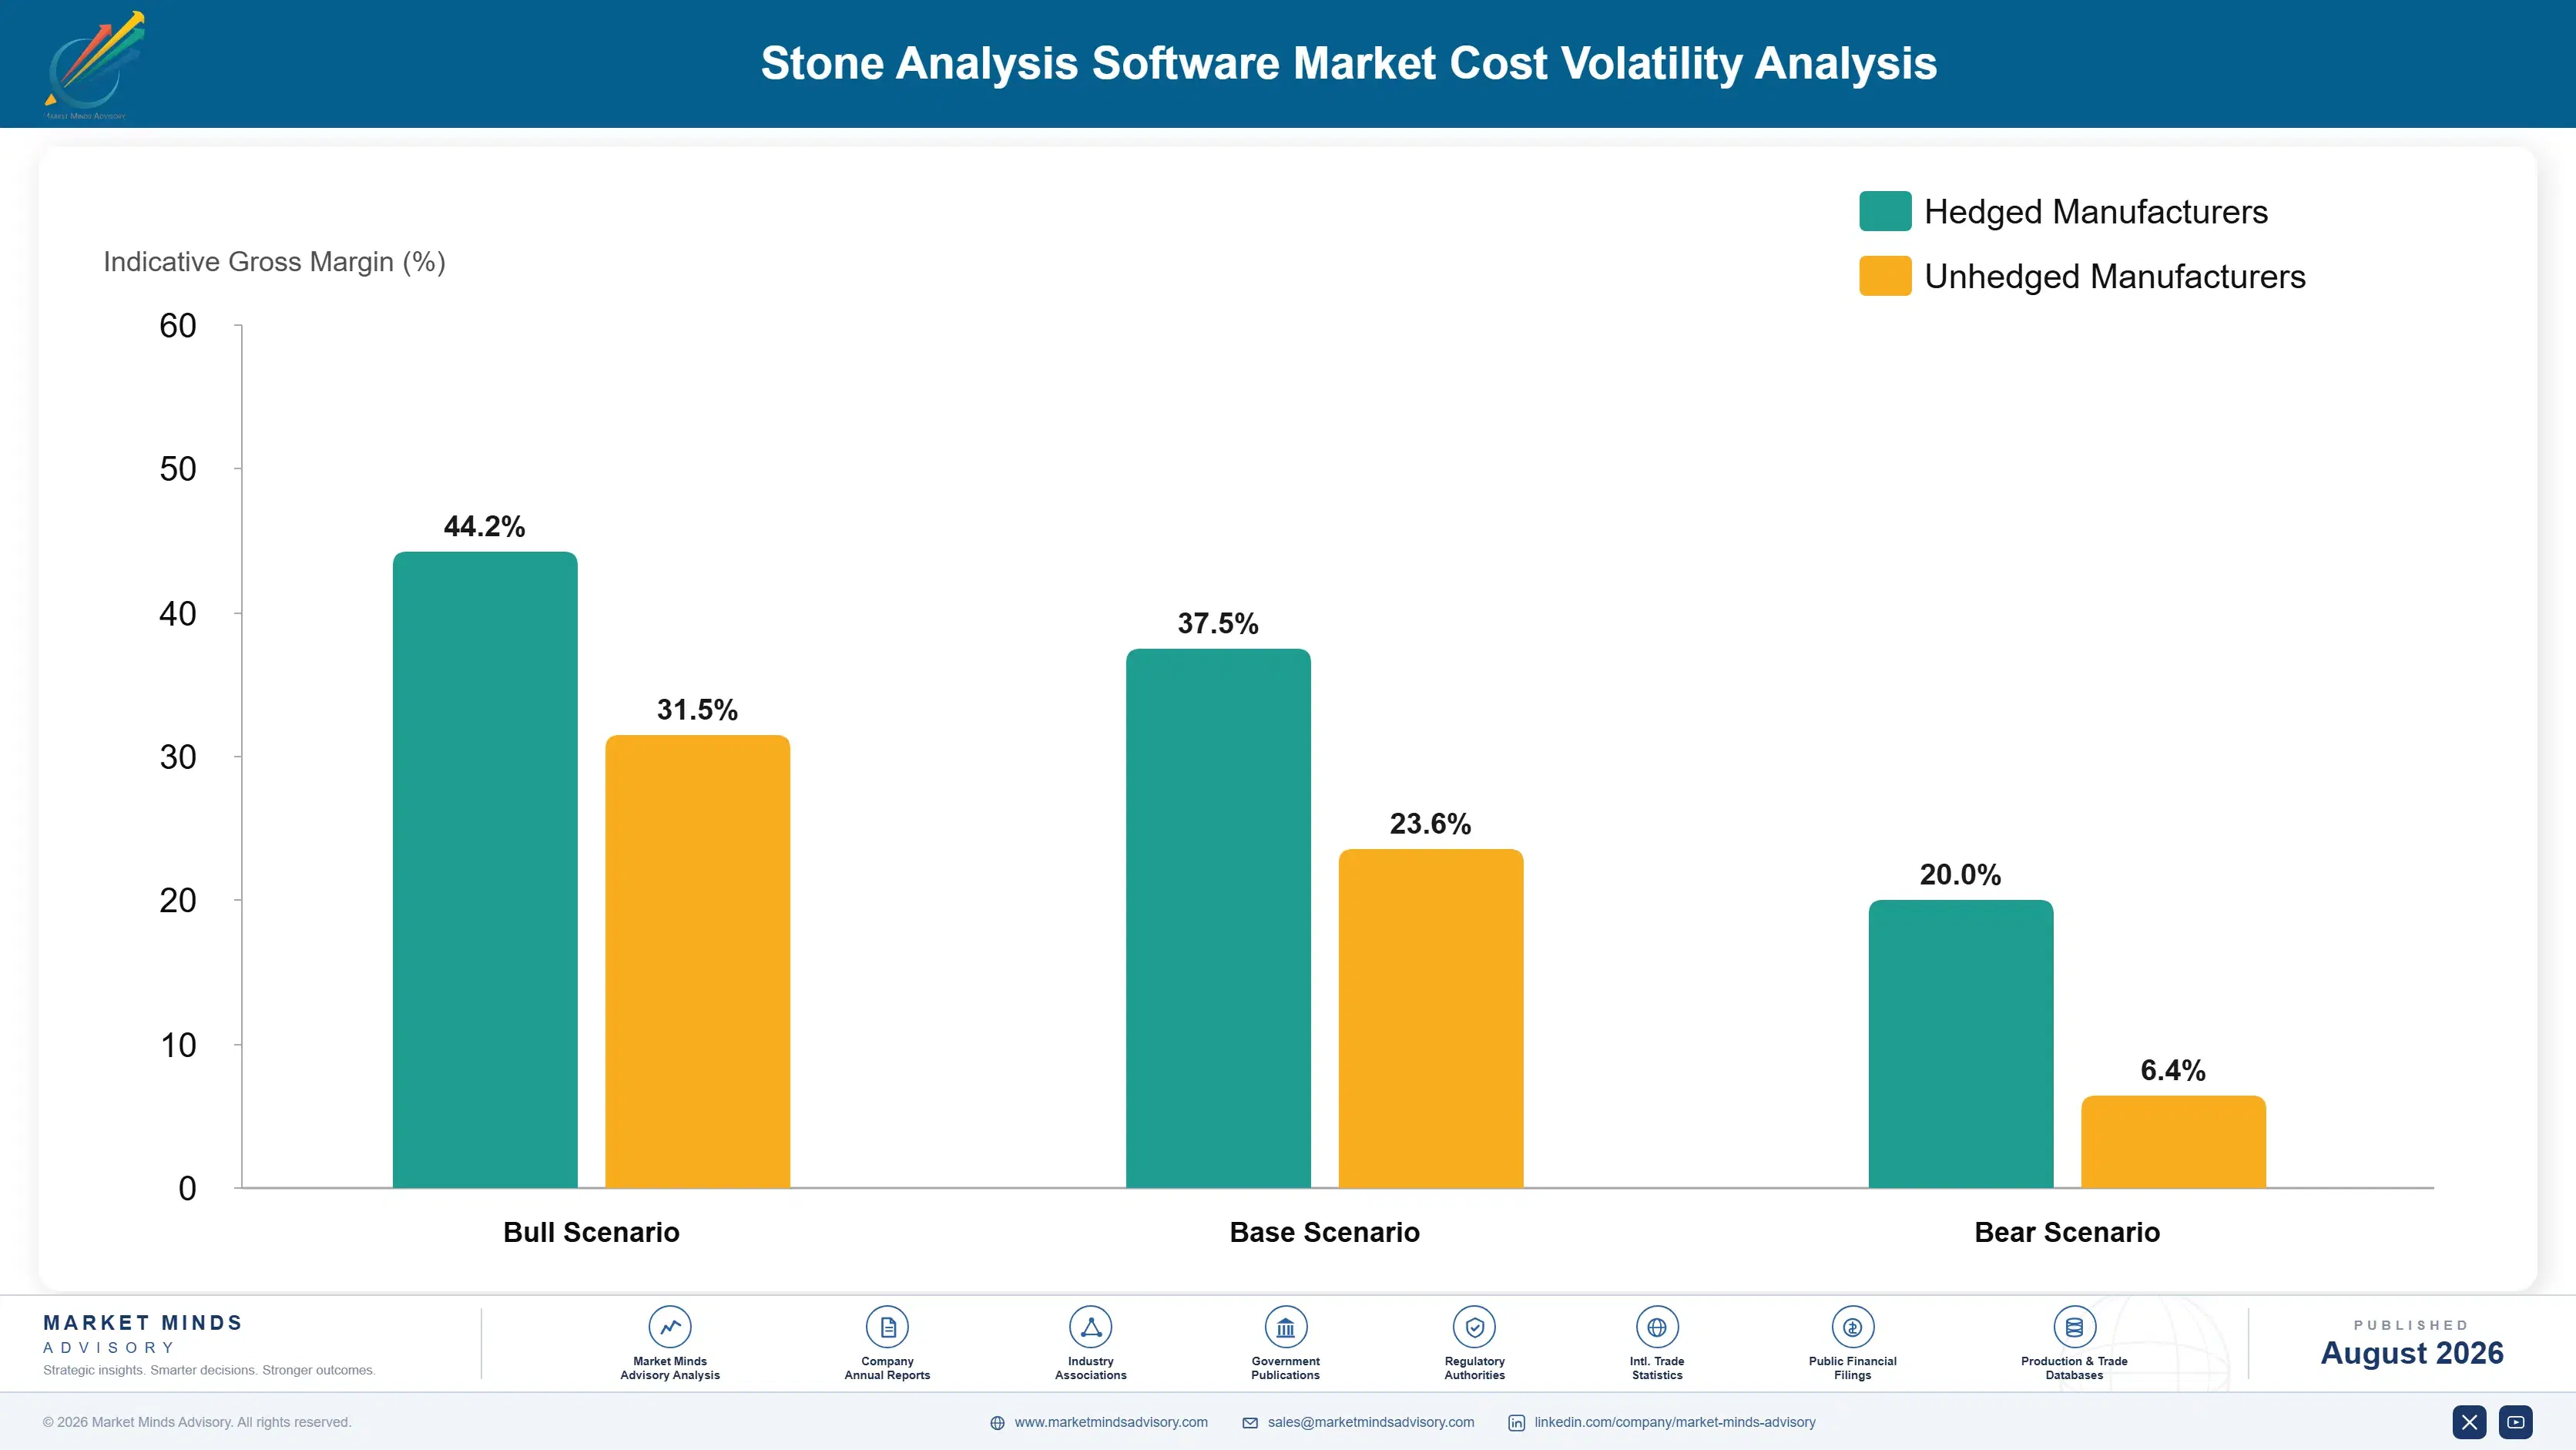
The cost base is people and reference data rather than materials. Software engineering and clinical validation staff account for roughly 46% of operating cost, concentrated in Germany, the United States and Japan. Spectral library curation, including sample acquisition, verification and re-measurement, adds 17% and is the most difficult line to replace. Registration and post-market surveillance contribute 13%, and interface certification a further 8%.
European medical device regulation showed how quickly registration cost can reshape a small category. Notified body capacity constrained assessment from 2021, and software classified more strictly faced submission work that had not applied before. Bruker and Thermo Fisher both disclosed elevated regulatory and quality expenditure in annual reports covering that period. The commercial impact fell hardest on small developers: several withdrew packages from European supply and licensed their libraries instead.

Exposure varies by portfolio breadth, and the mechanism is fixed registration cost spread across revenue. One clinical software product carries nearly the same surveillance burden as twenty, so unit regulatory cost falls steeply with breadth. Instrument manufacturers spread it across large spectroscopy portfolios. Stone specialists carry it against a category worth a fraction of that, which is why so many now license rather than sell.
stone-analysis-software-market-cost-volatility-analysis-1787309337998

License libraries rather than maintaining product registrations

Registration and surveillance cost is close to fixed per product, which makes it punishing for a specialist serving one small clinical category. Licensing the reference library to instrument manufacturers who already hold registrations transfers that burden entirely while retaining the asset's value. Several European stone laboratories concluded exactly this, and library revenue has proved steadier than product sales.

Share validation infrastructure across clinical software products

Clinical validation, risk documentation and surveillance processes are largely common across software products, yet small developers frequently build them per product. Consolidating onto shared quality infrastructure cuts the cost of each additional module substantially and shortens submission timelines. It requires a quality system designed for a portfolio rather than assembled around a single first product.

Acquire library depth through academic collection partnerships

Verified reference spectra come from confirmed clinical stones, and academic urology centres hold collections assembled over decades that nobody is monetising. Partnership arrangements giving a supplier measurement access in exchange for software and analytical support build library depth at a fraction of acquisition cost. It takes years and it is the only affordable route to the data.

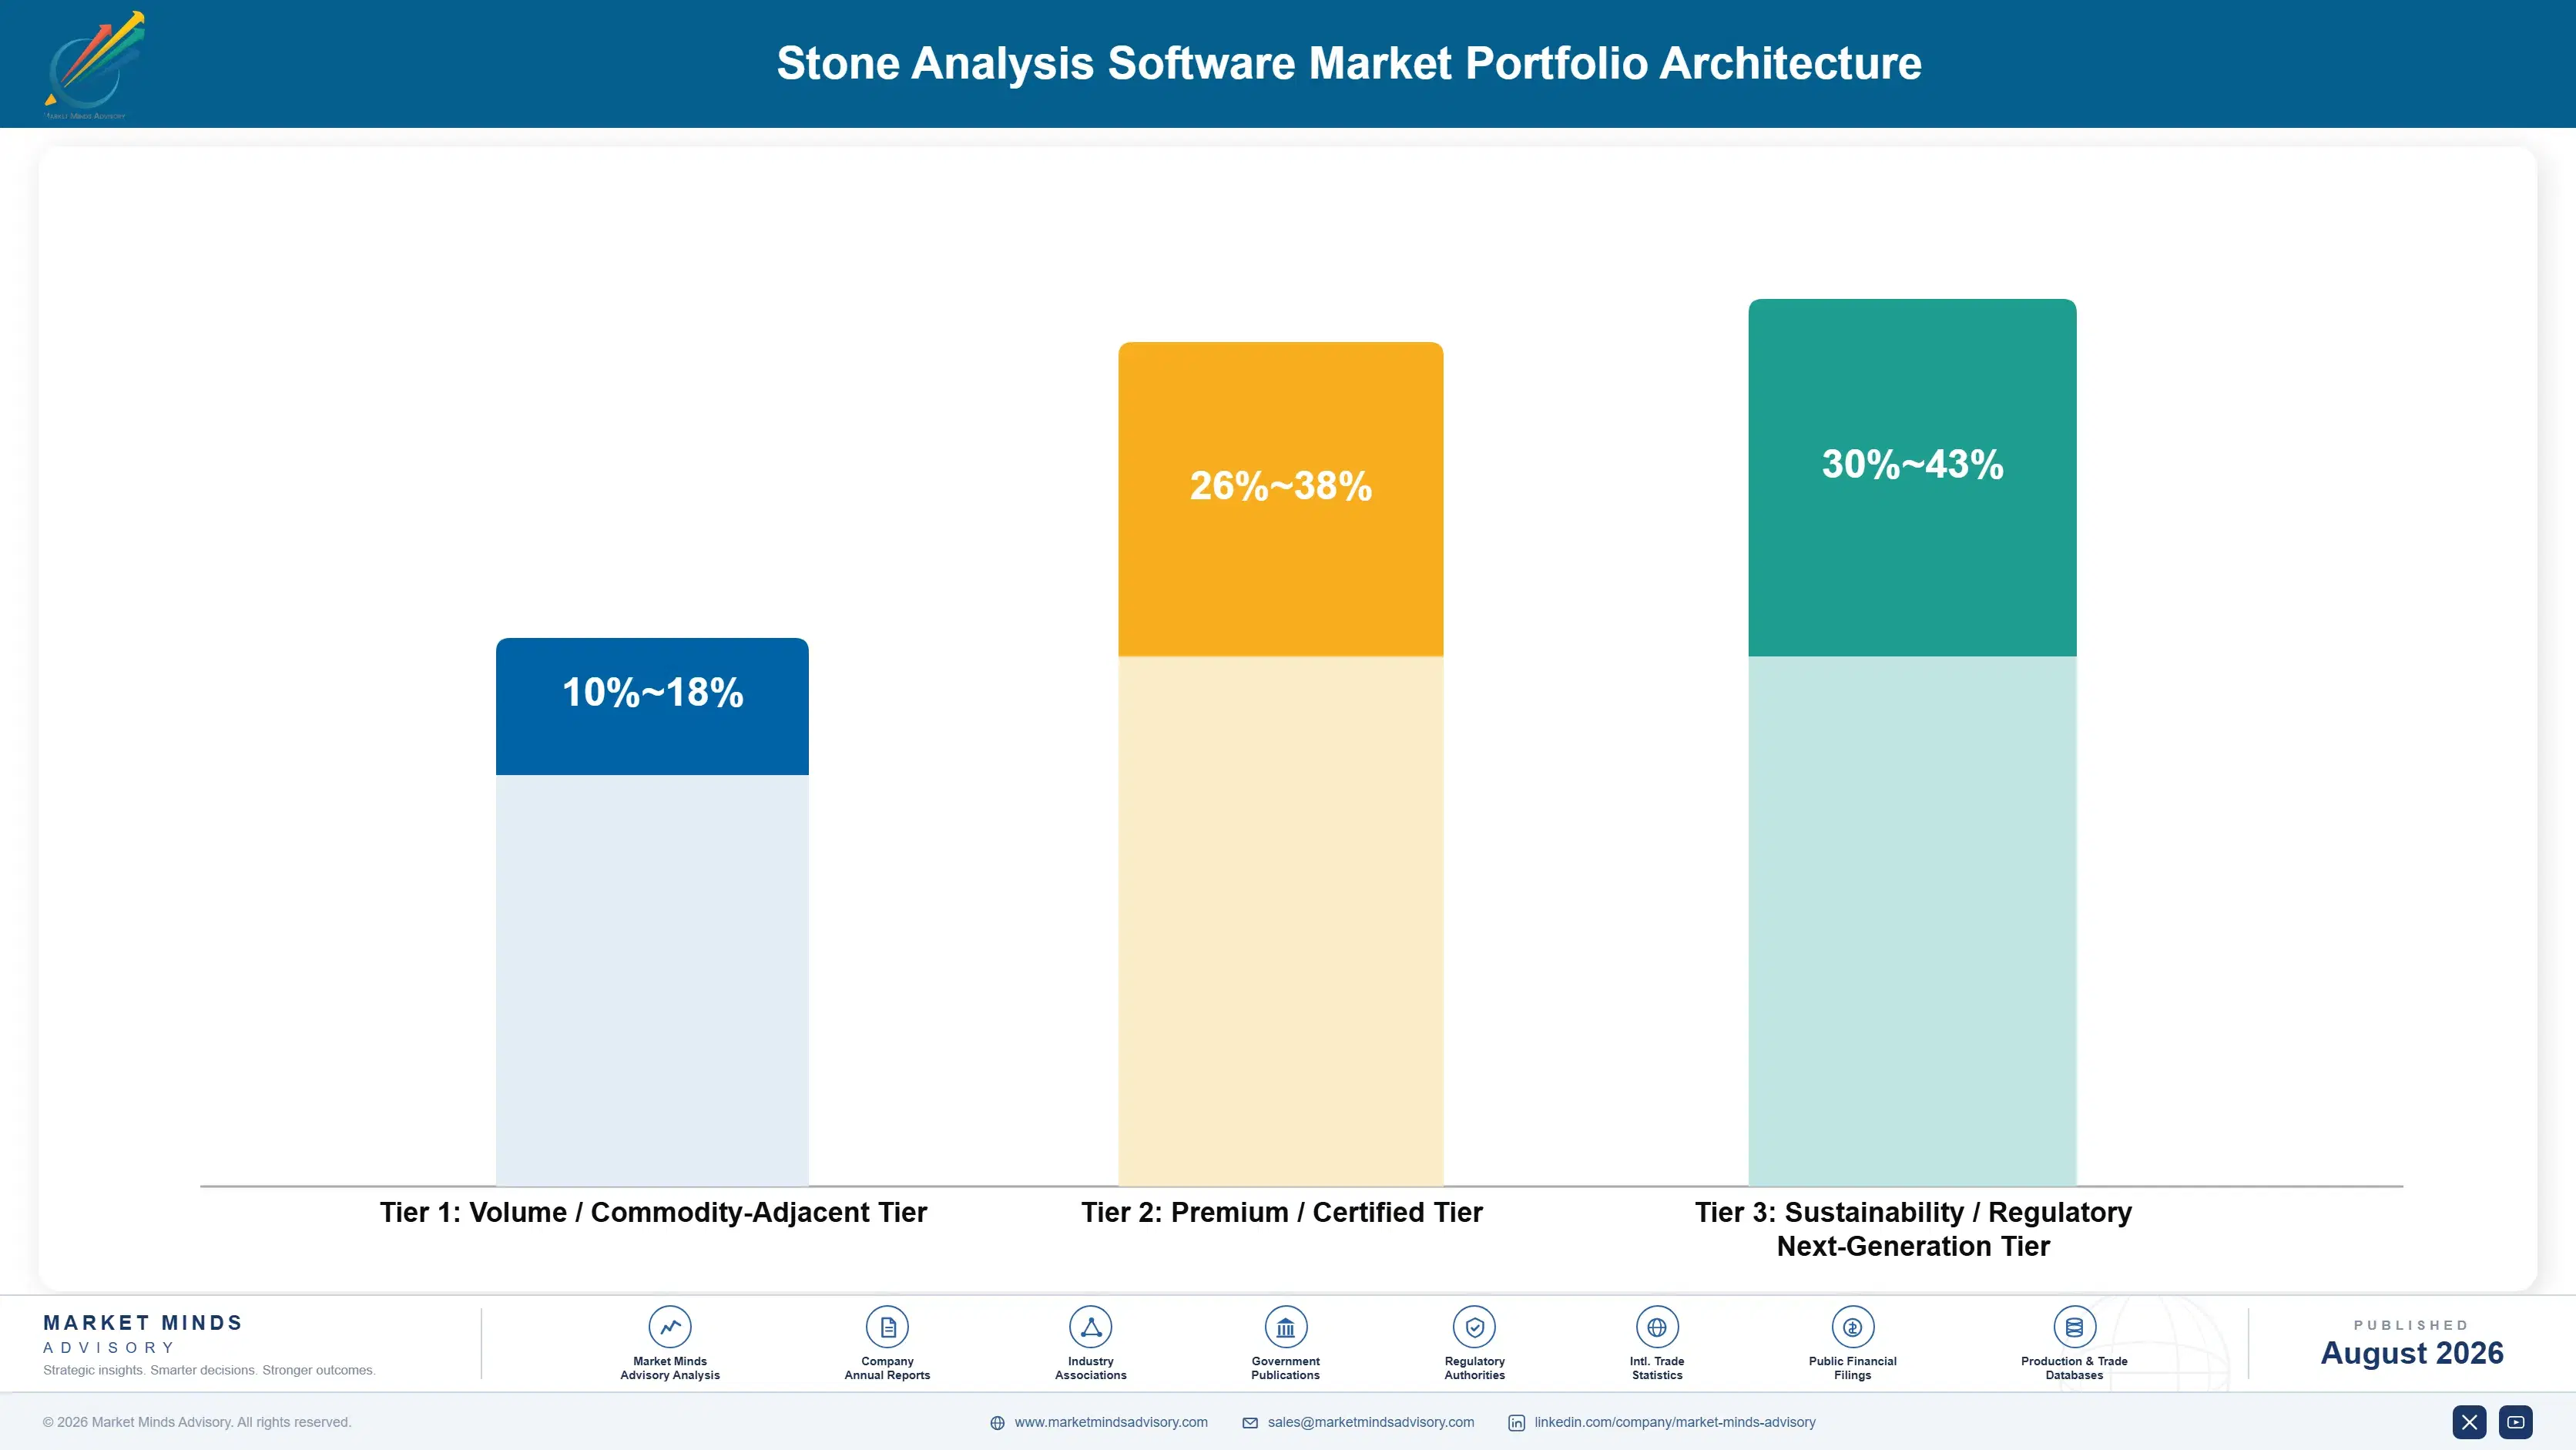
Portfolio Architecture for Margin Defence

Portfolio economics separate on whether a module is bundled with hardware or sold on its own merits. Acquisition and instrument control software earns modest gross margin, priced as a component of a capital sale that was decided on spectrometer specification. Library matching earns more, particularly where library depth is genuinely differentiated. Interpretation, reporting and metabolic integration modules earn most of all, because instrument manufacturers largely do not build them and laborato
The tension is that bundled modules carry the installed base while unbundled modules carry the margin, and the two are decided by different people years apart. A supplier without instrument relationships reaches only the unbundled layer, which is small and growing fast. A supplier with instrument relationships reaches everything and has little incentive to develop the modules that would cannibalise a capital sale nobody is currently questioning.

High-value pools concentrate in three places: library licensing to instrument manufacturers, interpretation modules the bundles omit, and metabolic integration that reaches urologists rather than laboratories. None is large in licence seats. Each is defended by reference data or clinical domain knowledge rather than by software engineering, which is why the barriers here outlast product cycles.

Volume / Commodity-Adjacent Tier

Spectral acquisition and instrument control modules supplied with the spectrometer and valued as a component of a hardware tender. Pricing is whatever the instrument manufacturer chooses, which is frequently near nothing because the capital sale carries the margin.
Gross Margin: 48-56%

Premium / Certified Tier

Library matching and composition identification modules carrying clinical registration and validated reference data. Margin comes from library depth on mixed compositions rather than from algorithms, and the ten-point range reflects the gap between decades-old collections and recent libraries.
Gross Margin: 66-76%

Sustainability / Regulatory / Next-Generation Tier

Interpretation, automated reporting and metabolic integration modules, together with subscription library delivery that keeps sites on current reference data. The thirteen-point range reflects the gap between mature reporting products and metabolic modules still recovering clinical validation cost.
Gross Margin: 72-85%
stone-analysis-software-market-portfolio-architecture-1787309338490

High-value Sub-segments and Strategic Watch-out

Library licensing to instrument manufacturers

The highest-margin route to the 72% of seats an independent cannot sell into, using reference data that took decades of clinical sample access to assemble. The customer relationship goes elsewhere. That is a smaller loss than most library holders assume before they run the numbers.
Gross Margin: 76-85%

Interpretation and reporting modules

Growing at 12.9% and largely outside bundled offerings, because instrument vendors build what sells spectrometers instead. They layer onto competitors' hardware without displacing anything. Active selling reaches roughly 40% attach where passive waiting reaches almost none at all. Development effort here is what most independents have now redirected toward.
Gross Margin: 72-82%

Bundled identification software

The largest segment by installed seats, priced as a hardware component and repriced only at instrument replacement several years later. It carries the technologist familiarity everything else builds on. Independents reach barely a quarter of it and cannot change that alone. Library licensing is the only way in.
Gross Margin: 48-56%

Domestic Chinese bundled packages

Chinese instrument suppliers bundling basic identification software domestically at prices Western vendors cannot approach, with library depth on mixtures that remains visibly weaker. It looks confined to home tenders currently. Library improvement is the only thing standing in the way. Mixed-composition performance is where they still fall short.
Gross Margin: 34-42%

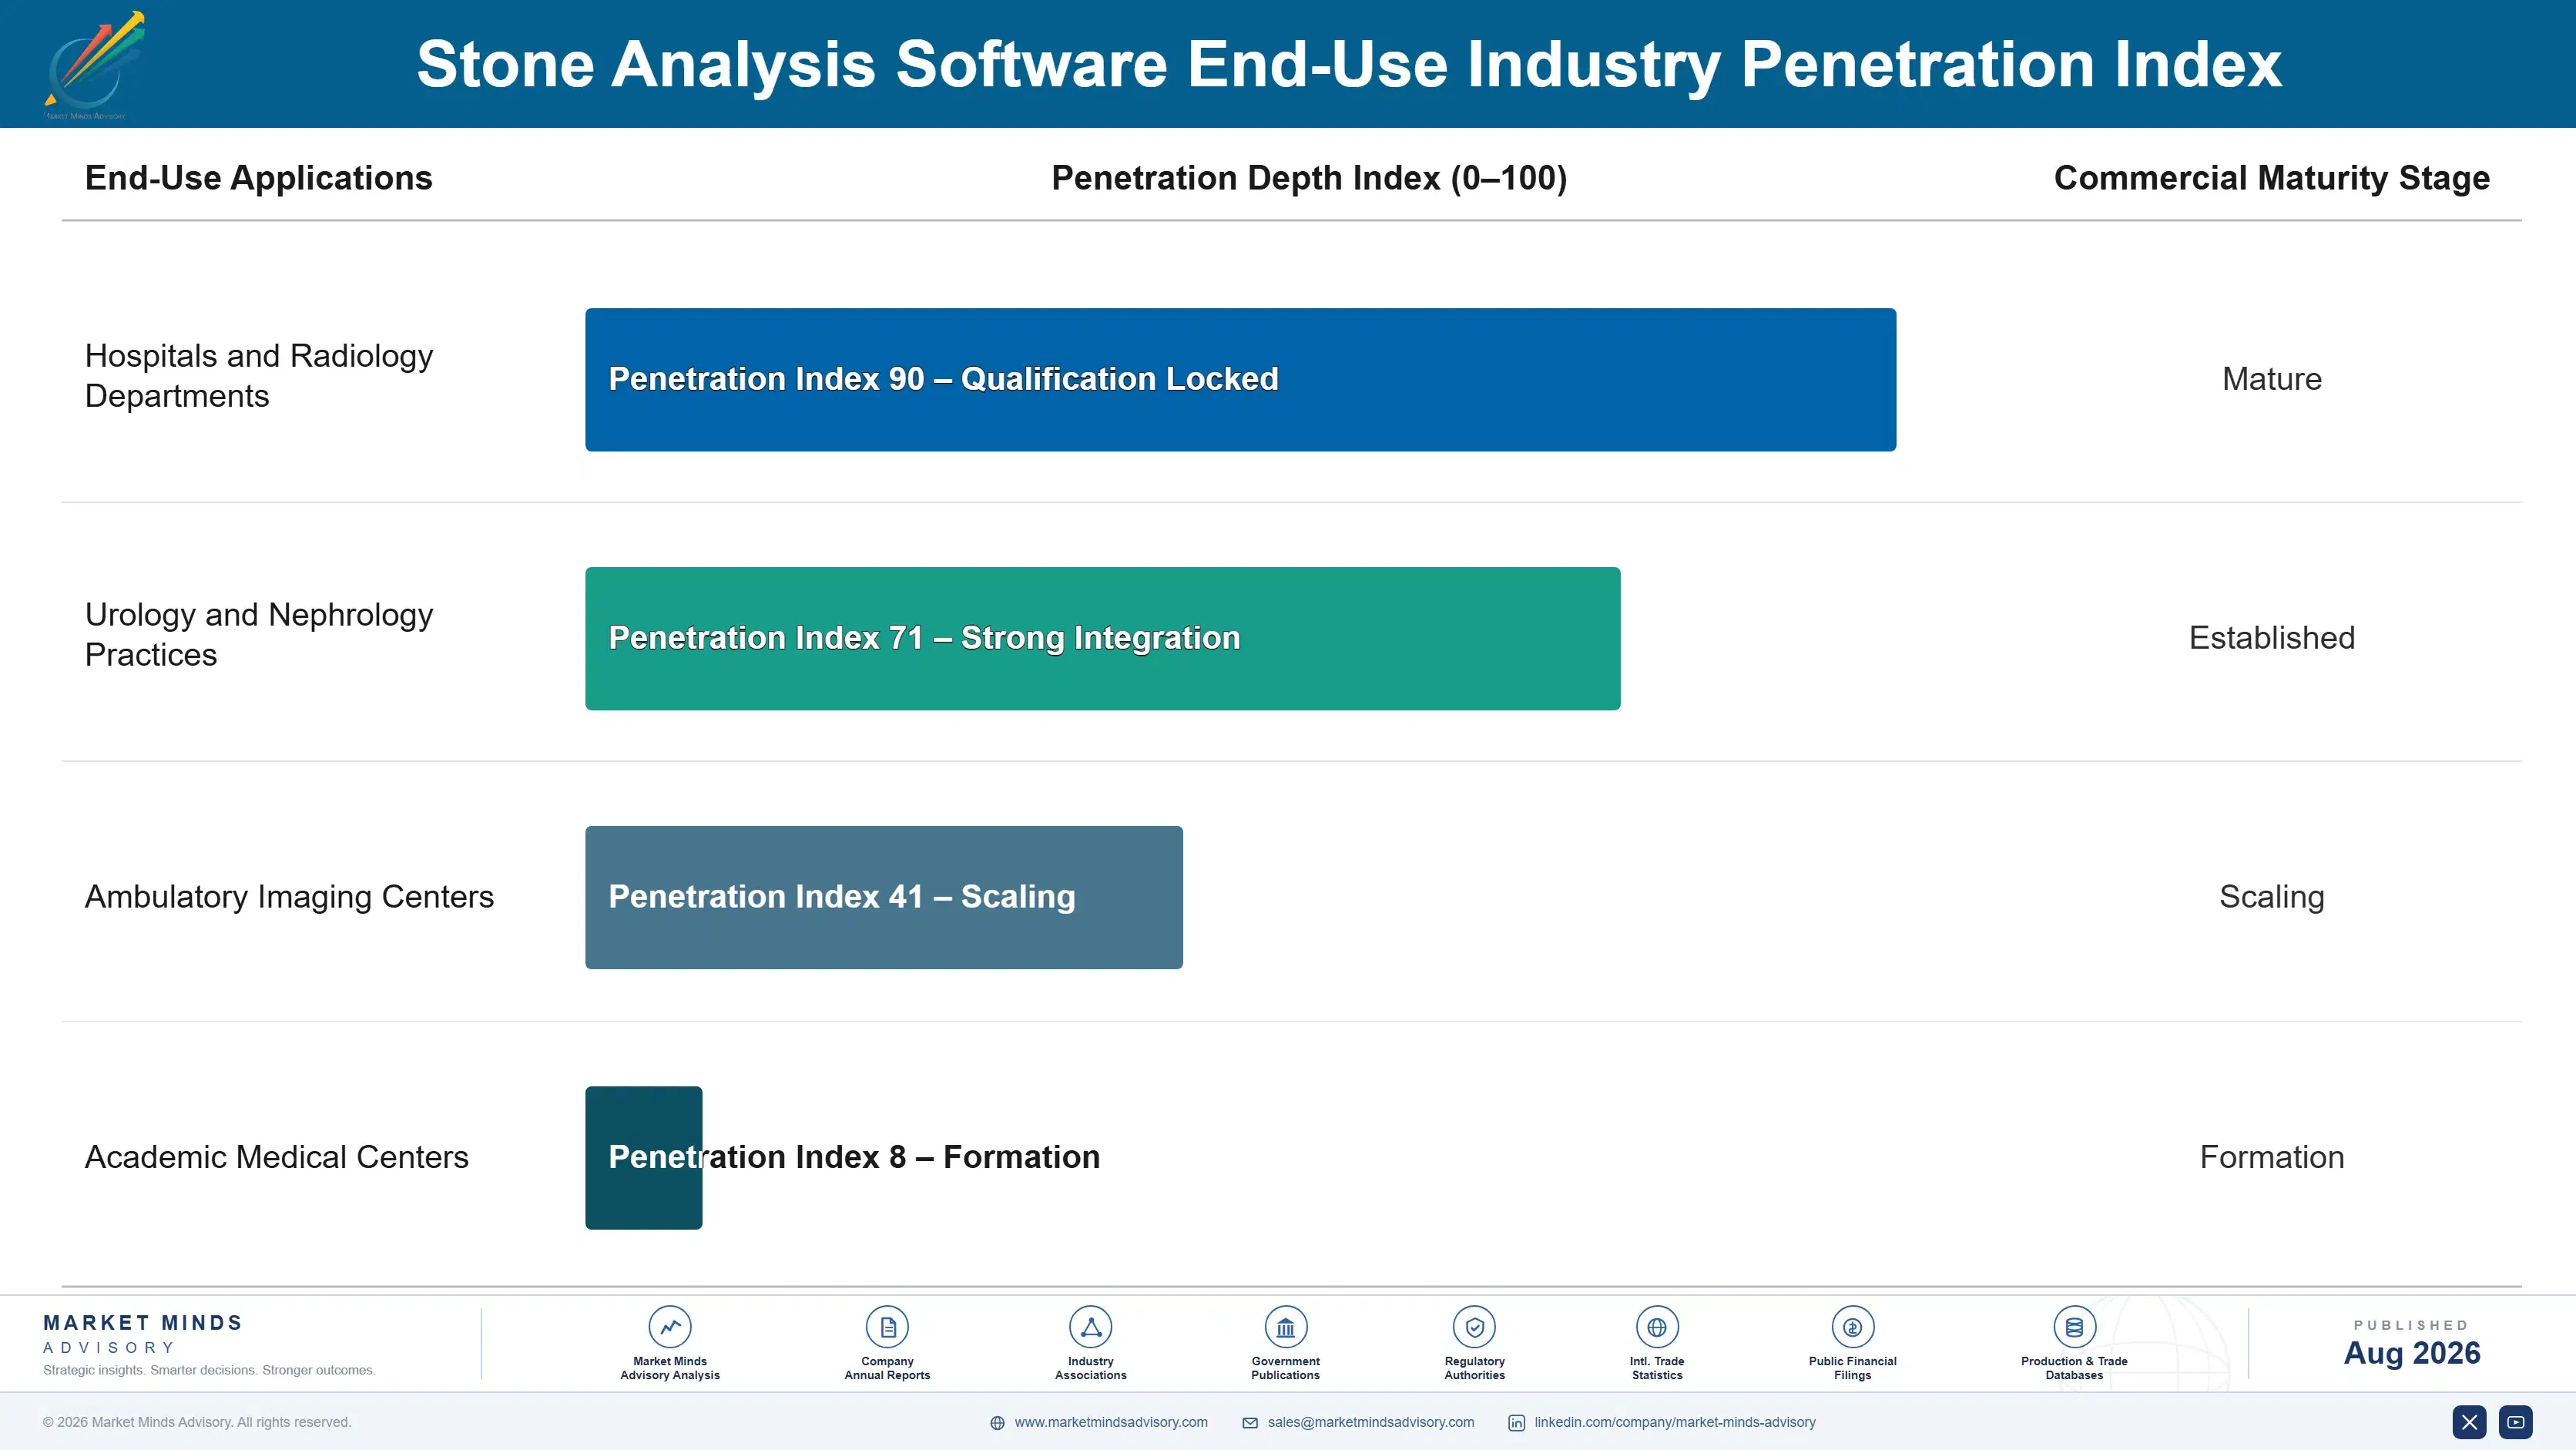
How Software Demand Actually Recurs

The recurring element here is reference data rather than licences. A laboratory buys a licence once, usually with a spectrometer it runs for fifteen years, so seat demand recurs only at replacement. What recurs annually is library currency at roughly 1.4 releases a year, plus support and validation documentation the laboratory needs for accreditation review. Recurring revenue accounts for 34% of software income. What varies is whether a supplier converted support into a subscription or left it a
Adoption depth varies sharply by laboratory type. Reference laboratories competing on analysis quality adopt the widest module sets, including metabolic integration and full interpretation, because analysis is their commercial product. Hospital laboratories adopt identification and basic reporting and stop there, constrained by budget rather than interest. Private diagnostic chains in accrediting markets adopt whatever accreditation requires. Laboratories still running wet chemistry adopt nothing at all, and they remain a meaningful minority in middle-income systems.

Buyer profiles are shifting in a way that favours interpretation modules. Laboratory managers appointed recently expect software to compose reports rather than support a technologist writing them. Their predecessors treated narrative reporting as professional judgement that no rule set should replace.
stone-analysis-software-market-end-use-penetration-index-1787309338981

What We Would Do Here

These are among the four positions where our research anticipates prominent divergence between winners and laggards over the coming forecast period. Each is grounded in the demand model, the regulatory perimeter, and the announced capacity pipeline.
01 / LIBRARY ASSET MONETISATION

License the reference library instead of defending a product

Verified spectra across mixed compositions took decades of clinical sample access to assemble and cannot be replicated synthetically, which makes them the only genuinely scarce asset in this category. Licensing to instrument manufacturers reaches the 72% of seats no independent can sell into, at roughly 20 points above direct sales into contested accounts. The customer relationship is surrendered, and for most library holders that has proved a considerably smaller loss than maintaining clinical registrations they could barely afford in the first place.
02 / UNBUNDLED MODULE FOCUS

Build what the instrument vendors have no reason to build

Instrument manufacturers develop acquisition and matching because those features sell spectrometers, and they neglect clinical reporting and metabolic integration because neither appears in a hardware specification. Report automation compounds at 12.9% almost entirely outside those bundled offerings, and metabolic integration sits alongside it. Modules that layer onto competitors' hardware reach accounts an independent could never displace, and attach rates near 40% follow active selling rather than waiting for laboratories to enquire about capability they have no idea exists at all.
03 / CLINICIAN CHANNEL ACCESS

Sell metabolic reporting to urologists, not to laboratories

Urologists direct where stone samples go, and a report carrying recurrence risk interpretation is worth far more to them than one naming a mineral they cannot act on. Laboratories adopting metabolic integration have seen sample volumes grow roughly 25% above regional averages, which is a commercial argument no feature comparison matches. It means selling to clinicians who have never heard of the software behind their reports, and almost nobody in this category is currently trying, which is exactly why the opening persists.
04 / LIBRARY SUBSCRIPTION CONVERSION

Charge for library currency, not for a perpetual seat

A perpetual licence sold five years ago runs an ageing library, which is exactly wrong in a category where reference data currency is the actual product being delivered. Subscription pricing bundling roughly 1.4 library releases per year restores annual revenue and keeps sites current, moving recurring revenue toward 34% of total software income across the installed base. Laboratories accept this more readily than instrument manufacturers do, because the people using it daily can see precisely what they are paying for each year.

Engagement Snapshot From the Field

A live engagement with an industry participant carrying material or product regulatory and market exposure ahead of a defining policy shift, showing how our research translates into a defensible multi-year portfolio strategy.
MARKET MINDS ADVISORY · CLIENT ENGAGEMENT SUMMARY
Stone Analysis Software Producer Strategic Portfolio Review and Transition Roadmap 2026·Investment Scenario on Stone Analysis Software Exposure Evaluation 2025-26
CLIENT PROFILE
A European developer of stone analysis and spectral interpretation software with revenue near EUR 11 million annually (client-reported, unverified by MMA), a reference library assembled from roughly 34,000 confirmed clinical samples over two decades, and direct sales into perhaps 190 laboratories. The company held excellent mixture resolution, clinical registrations across two jurisdictions it struggled to fund, and no relationship with any instrument manufacturer.
STRATEGIC CHALLENGE
Regulatory maintenance cost had risen to the point where two of the company's smaller modules no longer covered their own registration burden, and management proposed withdrawing them. The board wanted a wider review first, since the same rising cost applied to everything the company sold. Nobody had established what the reference library was worth to anybody other than the company itself.
MMA APPROACH
MMA benchmarked the client's mixture resolution against libraries held by instrument manufacturers, using blinded reference samples measured on both. Forty-seven expert interviews across laboratory directors, urologists and instrument company product managers established where library quality actually influenced purchasing and where it went unnoticed. Registration and surveillance cost was then modelled per product against the revenue each supported.
KEY FINDINGS
  1. The client's library outperformed every instrument manufacturer library tested on mixed-composition samples, which represent roughly two fifths of clinical stones, and matched them on pure samples where the difference was invisible.
  2. Laboratory directors could not distinguish the libraries during purchasing because bundled software arrived with the spectrometer and was never comparatively evaluated before installation.
  3. Two instrument manufacturers indicated clear interest in licensing the library, and one had already attempted to assemble equivalent reference data internally before abandoning the effort.
  4. Regulatory maintenance across five registered modules cost more than the combined revenue of the three smallest, and consolidating onto shared quality infrastructure would have halved that burden.
CLIENT PROFILE
A European developer of stone analysis and spectral interpretation software with revenue near EUR 11 million annually (client-reported, unverified by MMA), a reference library assembled from roughly 34,000 confirmed clinical samples over two decades, and direct sales into perhaps 190 laboratories. The company held excellent mixture resolution, clinical registrations across two jurisdictions it struggled to fund, and no relationship with any instrument manufacturer.
STRATEGIC CHALLENGE
Regulatory maintenance cost had risen to the point where two of the company's smaller modules no longer covered their own registration burden, and management proposed withdrawing them. The board wanted a wider review first, since the same rising cost applied to everything the company sold. Nobody had established what the reference library was worth to anybody other than the company itself.
MMA APPROACH
MMA benchmarked the client's mixture resolution against libraries held by instrument manufacturers, using blinded reference samples measured on both. Forty-seven expert interviews across laboratory directors, urologists and instrument company product managers established where library quality actually influenced purchasing and where it went unnoticed. Registration and surveillance cost was then modelled per product against the revenue each supported.
KEY FINDINGS
  1. The client's library outperformed every instrument manufacturer library tested on mixed-composition samples, which represent roughly two fifths of clinical stones, and matched them on pure samples where the difference was invisible.
  2. Laboratory directors could not distinguish the libraries during purchasing because bundled software arrived with the spectrometer and was never comparatively evaluated before installation.
  3. Two instrument manufacturers indicated clear interest in licensing the library, and one had already attempted to assemble equivalent reference data internally before abandoning the effort.
  4. Regulatory maintenance across five registered modules cost more than the combined revenue of the three smallest, and consolidating onto shared quality infrastructure would have halved that burden.
RECOMMENDED STRATEGY
Phase 1: Phase 1 (0 to 6 months): Open library licensing discussions with both interested instrument manufacturers, and consolidate quality documentation onto shared infrastructure rather than withdrawing modules. Phase 2: Phase 2 (6 to 18 months): Refocus direct sales onto interpretation and metabolic modules that layer onto competitors' hardware, and begin urologist-facing promotion of report formats. Phase 3: Phase 3 (18 to 36 months): Convert the installed base to library subscription, and extend academic collection partnerships to deepen coverage of rarer compositions.
OUTCOME
No modules were withdrawn. A library licence was signed with one instrument manufacturer, contributing roughly 21% of revenue within five quarters at margins above any direct product (client-reported, unverified by MMA). Shared quality infrastructure cut regulatory cost per module materially. Urologist-facing promotion proved harder to resource than expected and progressed slowly.

Frequently Asked Questions

Foundational context covering the market sizes, CAGR, scope, country, region and competition that inform every finding below. This section is provided to cover basics and most often pre-purchase conversations, answered from the MMA Primary Research Dataset.

What is the current size of the Stone Analysis Software Market?

MMA sizes the global stone analysis software market at USD 0.14 billion in 2025, rising to USD 0.15 billion in 2026. That covers licence, subscription and support revenue for clinical calculi composition software, excluding spectrometers.

How large will the Stone Analysis Software Market be by 2036?

MMA forecasts USD 0.34 billion by 2036, an expansion multiple of 2.28 times the 2026 base. That represents roughly USD 0.19 billion of incremental value over the forecast period.

What is the CAGR for the Stone Analysis Software Market 2026 to 2036?

The base case compounds at 8.6% annually, with a bull case of 9.9% and a bear case of 7.3%. Module adoption rather than new instrument placement accounts for most of that growth.

Which segment is growing fastest?

Automated report generation and clinical interpretation compounds at 12.9%, exactly 1.50 times the market rate. Laboratories are replacing manual narrative transcription that accreditation reviewers increasingly question.

Who are the major companies in the Stone Analysis Software Market?

Bruker, Thermo Fisher Scientific, Shimadzu, Agilent Technologies and PerkinElmer together hold 74% of installed licence seats. Fifteen further participants including Horiba, JASCO, Clinisys and LabWare are profiled.

Which country is growing fastest?

India compounds at 11.6%, ahead of every other national market MMA tracks. High stone prevalence and private laboratory chains building accredited analysis capability together drive that growth.

Report Segmentation Architecture

The full report scope spans multiple orthogonal segmentation dimensions, with cross-tabulated demand data provided for each dimension pair. Coverage extends further to regional breakdowns, trend trajectories, and the competitive detail needed to support segment-level decision-making.

By Software Function

  • Spectral Acquisition and Instrument Control
  • Library Matching and Composition Identification
  • Automated Report Generation and Clinical Interpretation
  • Quality Control and Proficiency Testing Modules
  • Metabolic Risk Correlation and Urine Chemistry Integration
  • Laboratory Information System Interfacing

By End-Use Laboratory Type

  • Reference and Specialist Stone Laboratories
  • Hospital Central Laboratories
  • Private Diagnostic Chains
  • Academic Urology and Research Centres
  • Public Health Laboratory Networks

By Commercial Model

  • Instrument-Bundled Licence Supply
  • Independent Perpetual Licence
  • Annual Library Subscription
  • Library Licensing to Instrument Manufacturers

By Region

  • North America
  • Western Europe
  • East Asia
  • South Asia and Pacific
  • Latin America
  • Middle East and Africa
  • Eastern Europe

Scope, Methodology, and Coverage

Every figure in this report is reproducible from documented input assumptions. The scope below maps the historical period, the forecast horizon, the segmentation dimensions, and the countries covered, alongside the underlying primary and qualitative methodology.
Historical Period
2020 to 2025
Forecast Period
2026 to 2036
Base Year
2025 (USD billions; MMA Primary Research Dataset, August 2026)
Market Definition
The market comprises software used in clinical laboratories to identify, quantify and report the crystalline composition of urinary and biliary calculi, spanning spectral acquisition and instrument control, reference library matching and composition identification, automated report generation and clinical interpretation, quality control and proficiency testing modules, metabolic risk correlation with urine chemistry, and laboratory information system interfacing. Sizing captures perpetual licence, subscription, module and support revenue at realised prices, including library licensing at transfer prices. Infrared and Raman spectrometers, microscopy and wet chemistry hardware, stone analysis supplied as a laboratory service, urological imaging software and lithotripsy planning systems are outside scope.
Quantitative Units
USD billions (current prices); installed licence seats; USD per seat at realised price
Segmentation Dimensions
By Software Function; By End-Use Laboratory Type; By Commercial Model; By Region
Regions Covered
North America, Western Europe, East Asia, South Asia and Pacific, Latin America, Middle East and Africa, Eastern Europe
Countries Covered
USA, China, Germany, France, UK, Japan, South Korea, India, Australia, Canada, Brazil, Mexico, Indonesia, Vietnam, Thailand, Malaysia, UAE, Saudi Arabia, South Africa, Nigeria, Turkey, Poland, Netherlands, Italy, Spain, Sweden, Switzerland, Argentina, Colombia, Singapore, and additional markets relevant to this sector
Key Companies Profiled
Bruker, Thermo Fisher Scientific, Shimadzu, Agilent Technologies, PerkinElmer, Horiba, JASCO, ABB, Renishaw, Oxford Instruments, Metrohm, Anton Paar, LabWare, LabVantage Solutions, Clinisys, Sunquest Information Systems, Wasatch Photonics, Ocean Insight, S.T. Japan, Bio-Rad Laboratories.
Quantitative Methodology
Primary survey, n=3,800 respondents, Q4 2025, six countries; demand-side model with trade association cross-validation
Qualitative Methodology
47 expert interviews, Q4 2025; applied to validate demand model assumptions, identify emerging dynamics, and assess competitive positioning
Report Format
PDF and XLSX data workbook (Word format preview document)
Publisher
Market Minds Advisory
Report Code
MMA-2026-TEC-088
Published
August 2026
Contact
sales@marketmindsadvisory.com | www.marketmindsadvisory.com

Purchase the full Stone Analysis Software Market Report (2026 to 2036).

The full report sizes the stone analysis software market across six software functions, five laboratory types, four commercial models and seven regions, with annual forecasts to 2036 in revenue and installed licence seats. It separates instrument-bundled placement from independently purchased software market by market, which determines how much of the category any independent can address at all. Twenty participants are assessed on a consistent installed seat basis, with reference library depth on mixed compositions benchmarked separately from software capability. Module attach rates are quantified by laboratory type, and clinical software registration cost is modelled against the revenue each product supports.
Six software functions sized and forecast annually
Bundled placement separated from independent software purchasing
Twenty participants on consistent installed seat basis
Reference library depth benchmarked on mixed compositions
Module attach rates quantified by laboratory type
Registration cost modelled against supporting product revenue

Built For The People Who Decide

From boardroom strategy to bench-side execution, this report is read cover-to-cover by leaders shaping the next decade of their industry, turning demand scenarios, market dynamics and valuation benchmarks into decisions.
CXOs/ Presidents/ VPs/ Managers
M&A and Corporate Development
Strategy Teams and R&D Heads
Procurement and Product Directors
Regulatory and Compliance Leaders
Investor Relations and Equity Analysts