Market Minds Advisory
Sterile Dosage Form Market

Sterile Dosage Form Market: Annex 1 Contamination Control, Prefilled Syringe Demand and Capacity That Takes Four Years to Build

A sterile injectable line takes four years and a hundred million dollars to qualify, which is why the biologics boom keeps colliding with fill-finish capacity that was committed before anybody knew it was coming.

Lead Analyst

Alice Ballenger

Published

August 2026

Make Smarter Decisions with Customized Research Insights

Request a free sample report and evaluate market opportunities, growth trends, and competitive dynamics relevant to your business needs.

2025 MARKET VALUE$62.5BMarket Size 2025
2036 FORECAST VALUE$151.8BBase Case , 2026 to 2036
CAGR 2026 TO 20368.4 %Bull 9.7% / Bear 7.1%
INCREMENTAL OPPORTUNITY$84.0BNet 10- year value creation
EXPANSION MULTIPLE2.24x2036 value over 2026 base
Strategic Levers
M&A Pipeline
Regional Outlook
Country Rankings
Competitive Intelligence
Segmental Deep-dive
Call-Us : 91 93563 13602

Executive Snapshot and Market Trajectory

Sterile manufacturing is where pharmaceutical ambition meets physical capacity. Every biologic, vaccine, peptide and cell therapy has to end up in a sterile container, and the lines that do that work take four years to build and qualify before a single commercial vial leaves them.
Prefilled syringes and autoinjector cartridges compound at 12.6%, exactly 1.50 times the market, as self-administered biologics and obesity medicines move volume out of vials entirely. East Asia holds 29% of capacity on Indian, Chinese and Korean expansion. Revised Annex 1 contamination control expectations have raised the qualification bar substantially. Barrier isolation and formal contamination control documentation are now the practical baseline for any new line, rather than an advanced specification anybody can choose to skip.
Five participants hold 44%. Positions rest on qualified capacity and regulatory track record rather than on price, because a sponsor with an approval date cannot wait for a line that has not passed inspection. Industry utilisation near 83% understates the tightness, because lines are qualified for particular containers and closures. Nominally idle capacity frequently cannot accept the product needing a slot. Qualified capacity is the only figure worth modelling.
Market Definition
The market covers manufacturing of sterile pharmaceutical dosage forms, spanning liquid vial filling, lyophilised vial filling, prefilled syringes and autoinjector cartridges, ampoules and blow-fill-seal containers, large volume parenteral and infusion bags, and sterile ophthalmic and otic preparations. Non-sterile oral solid and liquid dosage manufacture, active pharmaceutical ingredient synthesis, drug substance bioprocessing upstream of fill-finish, and the primary packaging components themselves are excluded.
Base Year Value
$62.5B in 2025 (MMA Primary Research Dataset, August 2026)
Forecast Period
2026 to 2036, eleven discrete annual values
CAGR
8.4% base case. Bull 9.7%. Bear 7.1%.
Fastest Growth Segment
Prefilled Syringes and Autoinjector Cartridges: 12.6% CAGR
Fastest Growth Country
India: 11.3% CAGR
Fastest Growth Region
South Asia and Pacific: 10.6% CAGR
Largest Region
East Asia: 29% of 2025 global value
Market Leaders
Catalent, Fresenius Kabi, Baxter International, Recipharm, Siegfried Holding. Source: MMA Analysis based on company annual reports.
Primary Survey
n=3,800 procurement and R&D decision-makers, Q4 2025, six countries
Methodology
Demand-side build-up, cross-validated against public data, 47 expert interviews

Sterile Dosage Form Market Forecast Scenarios

sterile-dosage-form-market-size-forecast-scenario-1787309330393
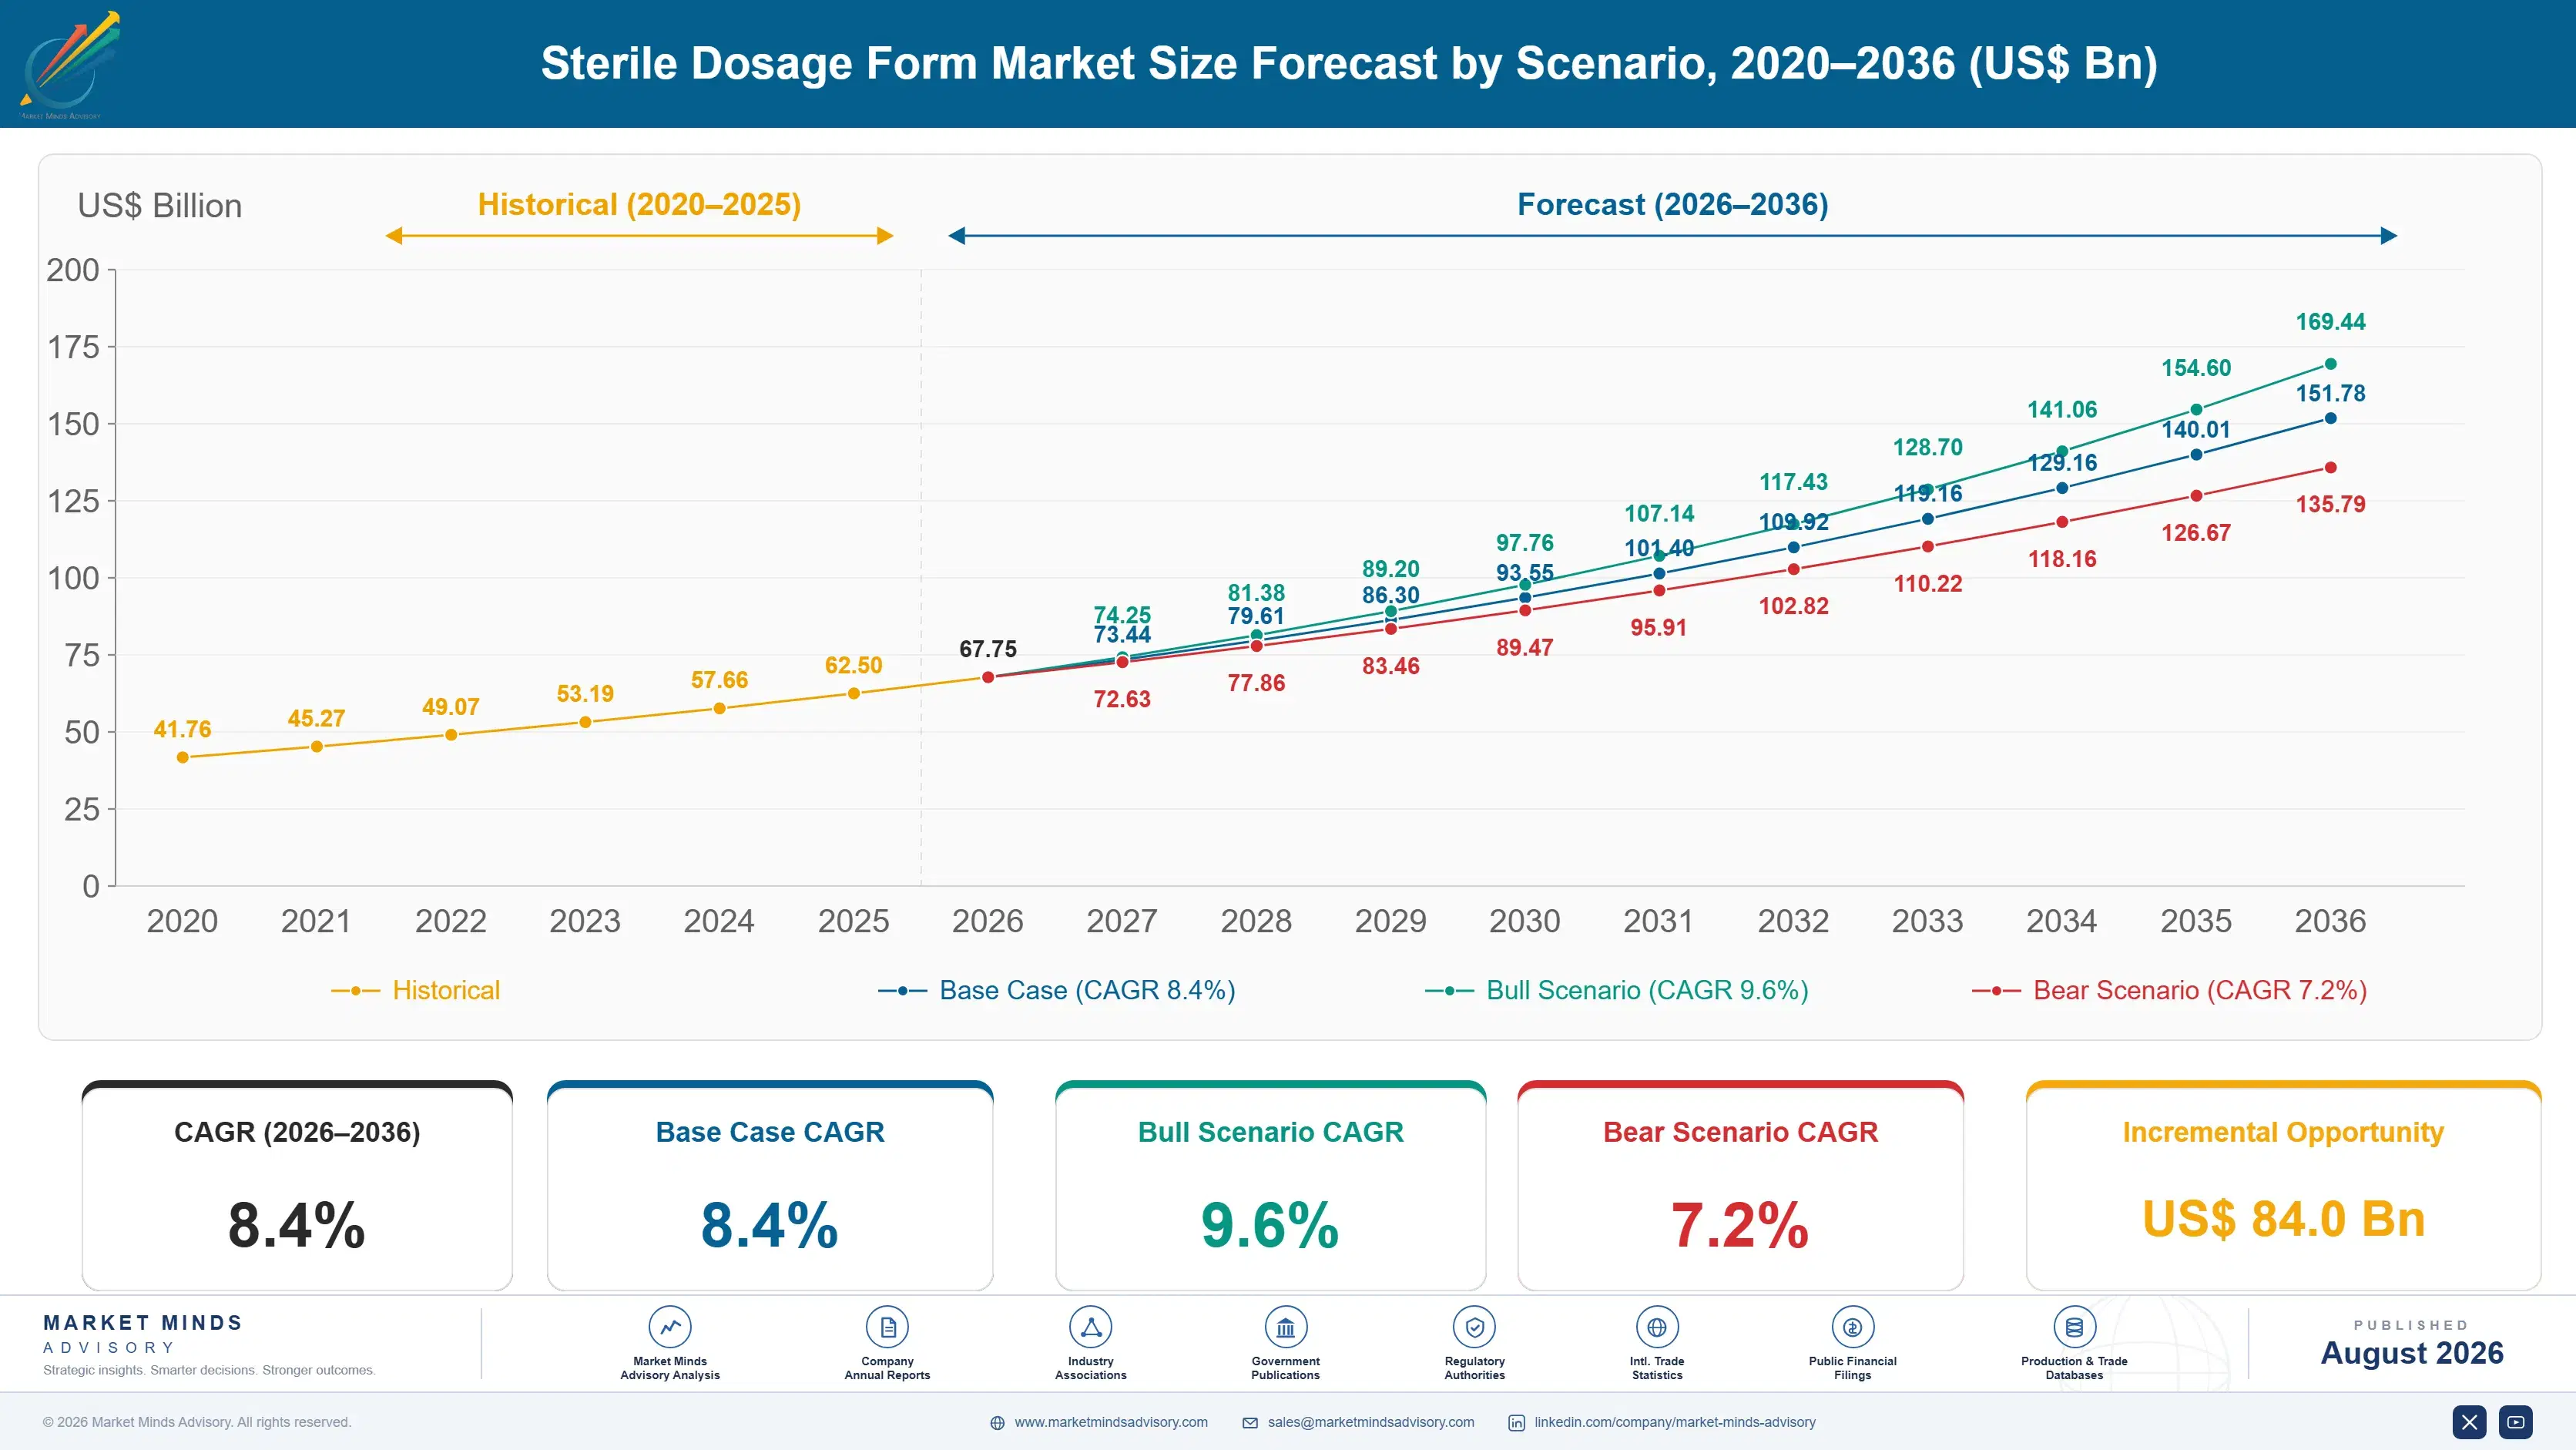
Growth of 7.1% across 2020 to 2025 was violently uneven and ended flatter than it started. Pandemic vaccine demand absorbed all available aseptic capacity through 2021, and several manufacturers built new lines against demand nobody expected to persist. It did not persist. The correction through 2023 and 2024 left overbuilt vial capacity alongside genuine shortage in prefilled syringe and cartridge formats that nobody had prioritised.
The base case of 8.4% rests on three mechanisms. Self-administered biologics keep converting from vials into syringes and cartridges, which consume more capacity per dose and command higher fill pricing. Antibody-drug conjugates and cell therapies require containment and handling that only a fraction of existing lines can provide. And regulatory expectation has moved toward isolator and robotic filling, which makes much installed conventional capacity commercially obsolete rather than merely dated.
The bull case of 9.6% assumes obesity and immunology volumes hold their trajectory, absorbing every cartridge line being built and several not yet planned. The bear case of 7.2% reflects two pressures arriving together: overbuilt vial capacity from the pandemic period competing on price for whatever conventional work remains, and sponsors bringing filling in house as volumes justify captive lines they previously outsourced entirely.

Four Years From Decision to First Commercial Vial

Sterile manufacturing is a capacity business dressed as a service business. A modern isolator-based aseptic filling line costs around USD 110 million and takes four years from investment decision to first commercial release, covering construction, commissioning, process qualification, media fills and regulatory inspection. None of that timeline compresses under commercial pressure, which is the fact that governs everything else here.
TOP FIVE CONCENTRATION44%Combined share held by the five largest sterile manufacturers globally
LINE QUALIFICATION DURATION4 yearsInterval from investment decision to first commercial release
ISOLATOR LINE CAPITALUSD 110 millionTypical investment for a modern high-speed aseptic filling line
CAPACITY UTILISATION83%Industry loading across qualified commercial aseptic filling capacity
PREFILLED SYRINGE SHARE34% of unitsProportion of sterile output filled into syringe presentations
BATCH REJECTION RATE1.4% of batchesLoss from sterility assurance and integrity failures across industry
Utilisation sits near 83% industry-wide, which sounds comfortable and is not. Aseptic lines are qualified for specific container formats and product types, so nominally available capacity frequently cannot take the product needing a slot. A sponsor with a biologic approval date and no qualified line has very few options, and that asymmetry is why capacity holders price the way they do. Qualified capacity is the only number that matters.
The revised Annex 1 contamination control expectations changed the economics of new capacity. Barrier isolation, contamination control strategy documentation and enhanced environmental monitoring are now the practical baseline rather than an advanced option, which raises capital cost and lengthens qualification. Older restricted access barrier lines remain compliant and are increasingly hard to justify for new investment. The installed base has effectively split in two.
"Everybody models sterile capacity as tonnes or units and then discovers their available line is qualified for a different stopper. The constraint is never total capacity. It is qualified capacity for that exact presentation."
Principal, Pharmaceutical Manufacturing and Aseptic Processing Practice · MMA Ph

Market Trends

Self-Administration Moves Volume From Vials Into Syringes

Biologics for chronic autoimmune disease, and now the metabolic medicines, are administered by patients at home rather than by clinicians in a facility, which requires a prefilled syringe or autoinjector cartridge rather than a vial. Syringe presentations already account for around 34% of sterile units and carry substantially higher value and complexity per unit, including siliconisation control, needle assembly and container closure integrity across a device. The segment compounds at 12.6% against a market at 8.4%. Qualified syringe capacity is the tightest position anywhere in the sector. A vial line cannot substitute, however idle it is.
Market Impact: Qualification requiring 4 years lea
Revised Contamination Control Expectations Raise the Capacity Bar

Barrier isolation, formal contamination control strategy documentation and enhanced environmental monitoring have become the practical baseline for new aseptic capacity rather than an advanced specification. That raises line capital toward USD 110 million and lengthens qualification, which slows how quickly the industry can respond to demand. It also widens the gap between operators who have already invested and those running older barrier technology, since retrofitting an operating line is considerably harder than building new. Older restricted access barrier lines remain compliant and are increasingly difficult to justify for new investment, which effectively splits the installed base in two.
Market Impact: Utilisation running at 83% industry

Market Opportunities and Growth Drivers

Biologic Approvals Convert Directly Into Sterile Fill Demand

Monoclonal antibodies, fusion proteins, peptides, cell and gene therapies and vaccines all require sterile parenteral presentation, and none has an oral alternative that reaches equivalent bioavailability. Every approval therefore converts into fill-finish demand at a predictable ratio, which makes this market unusually forecastable from regulatory pipelines. The constraint sits entirely on the supply side, since capacity takes four years to qualify and cannot be brought forward when an approval arrives sooner than planned. Regulatory pipelines therefore forecast this market better than any economic indicator does. Approvals arriving early cannot be served at all.
Market Impact: Decisions committed 4 years ahead

Format-Specific Qualification Creates Genuine Capacity Scarcity

An aseptic line is qualified for particular container formats, closure systems and product categories, so industry utilisation near 83% understates how tight the practical position is. A sponsor needing a specific syringe format may find no qualified slot anywhere despite nominal spare capacity existing. That scarcity is what lets capacity holders price on availability rather than on cost, and it is the single most important commercial fact in the sector for both buyers and sellers. A sponsor with an approval date and no qualified slot has almost no alternatives. Four years cannot be compressed.
Market Impact: Rejection destroying 1.4% of batche

Market Restraints and Challenges

Capacity Cannot Respond Inside a Demand Cycle

Four years from investment decision to commercial release means capacity decisions are made against demand forecasts that are frequently wrong by the time the line qualifies. The root cause is regulatory and physical rather than commercial: media fills, process qualification and inspection cannot be compressed. Operators mitigate by building modular and multi-format flexibility into new lines, by reserving capacity through take-or-pay agreements, and by qualifying additional formats on existing lines rather than only building new ones. The vaccine period demonstrated both failure modes within four years. Both failure modes appeared inside four years.
Market Impact: Syringes reaching 34% of units

Sterility Failures Destroy Batches and Regulatory Standing

Batch rejection from sterility assurance or container closure integrity failure runs near 1.4% industry-wide, and each loss carries the drug substance value, which for a biologic frequently exceeds the entire fill cost many times over. The root cause is that aseptic processing tolerates no recovery once contamination occurs. Operators mitigate with isolator technology, continuous environmental monitoring, automated inspection and rigorous media fill programmes, all of which raise cost and none of which eliminate the risk entirely. Sponsors weigh inspection history above price for exactly this reason. Lost drug substance dwarfs the fill cost.
Market Impact: Line capital reaching USD 110 milli
3 additional market trends, 4 additional growth drivers, and 2 additional restraints and challenges are covered in the full report. Contact sales@marketmindsadvisory.com to access the complete intelligence.

Segment CAGR and Growth Architecture

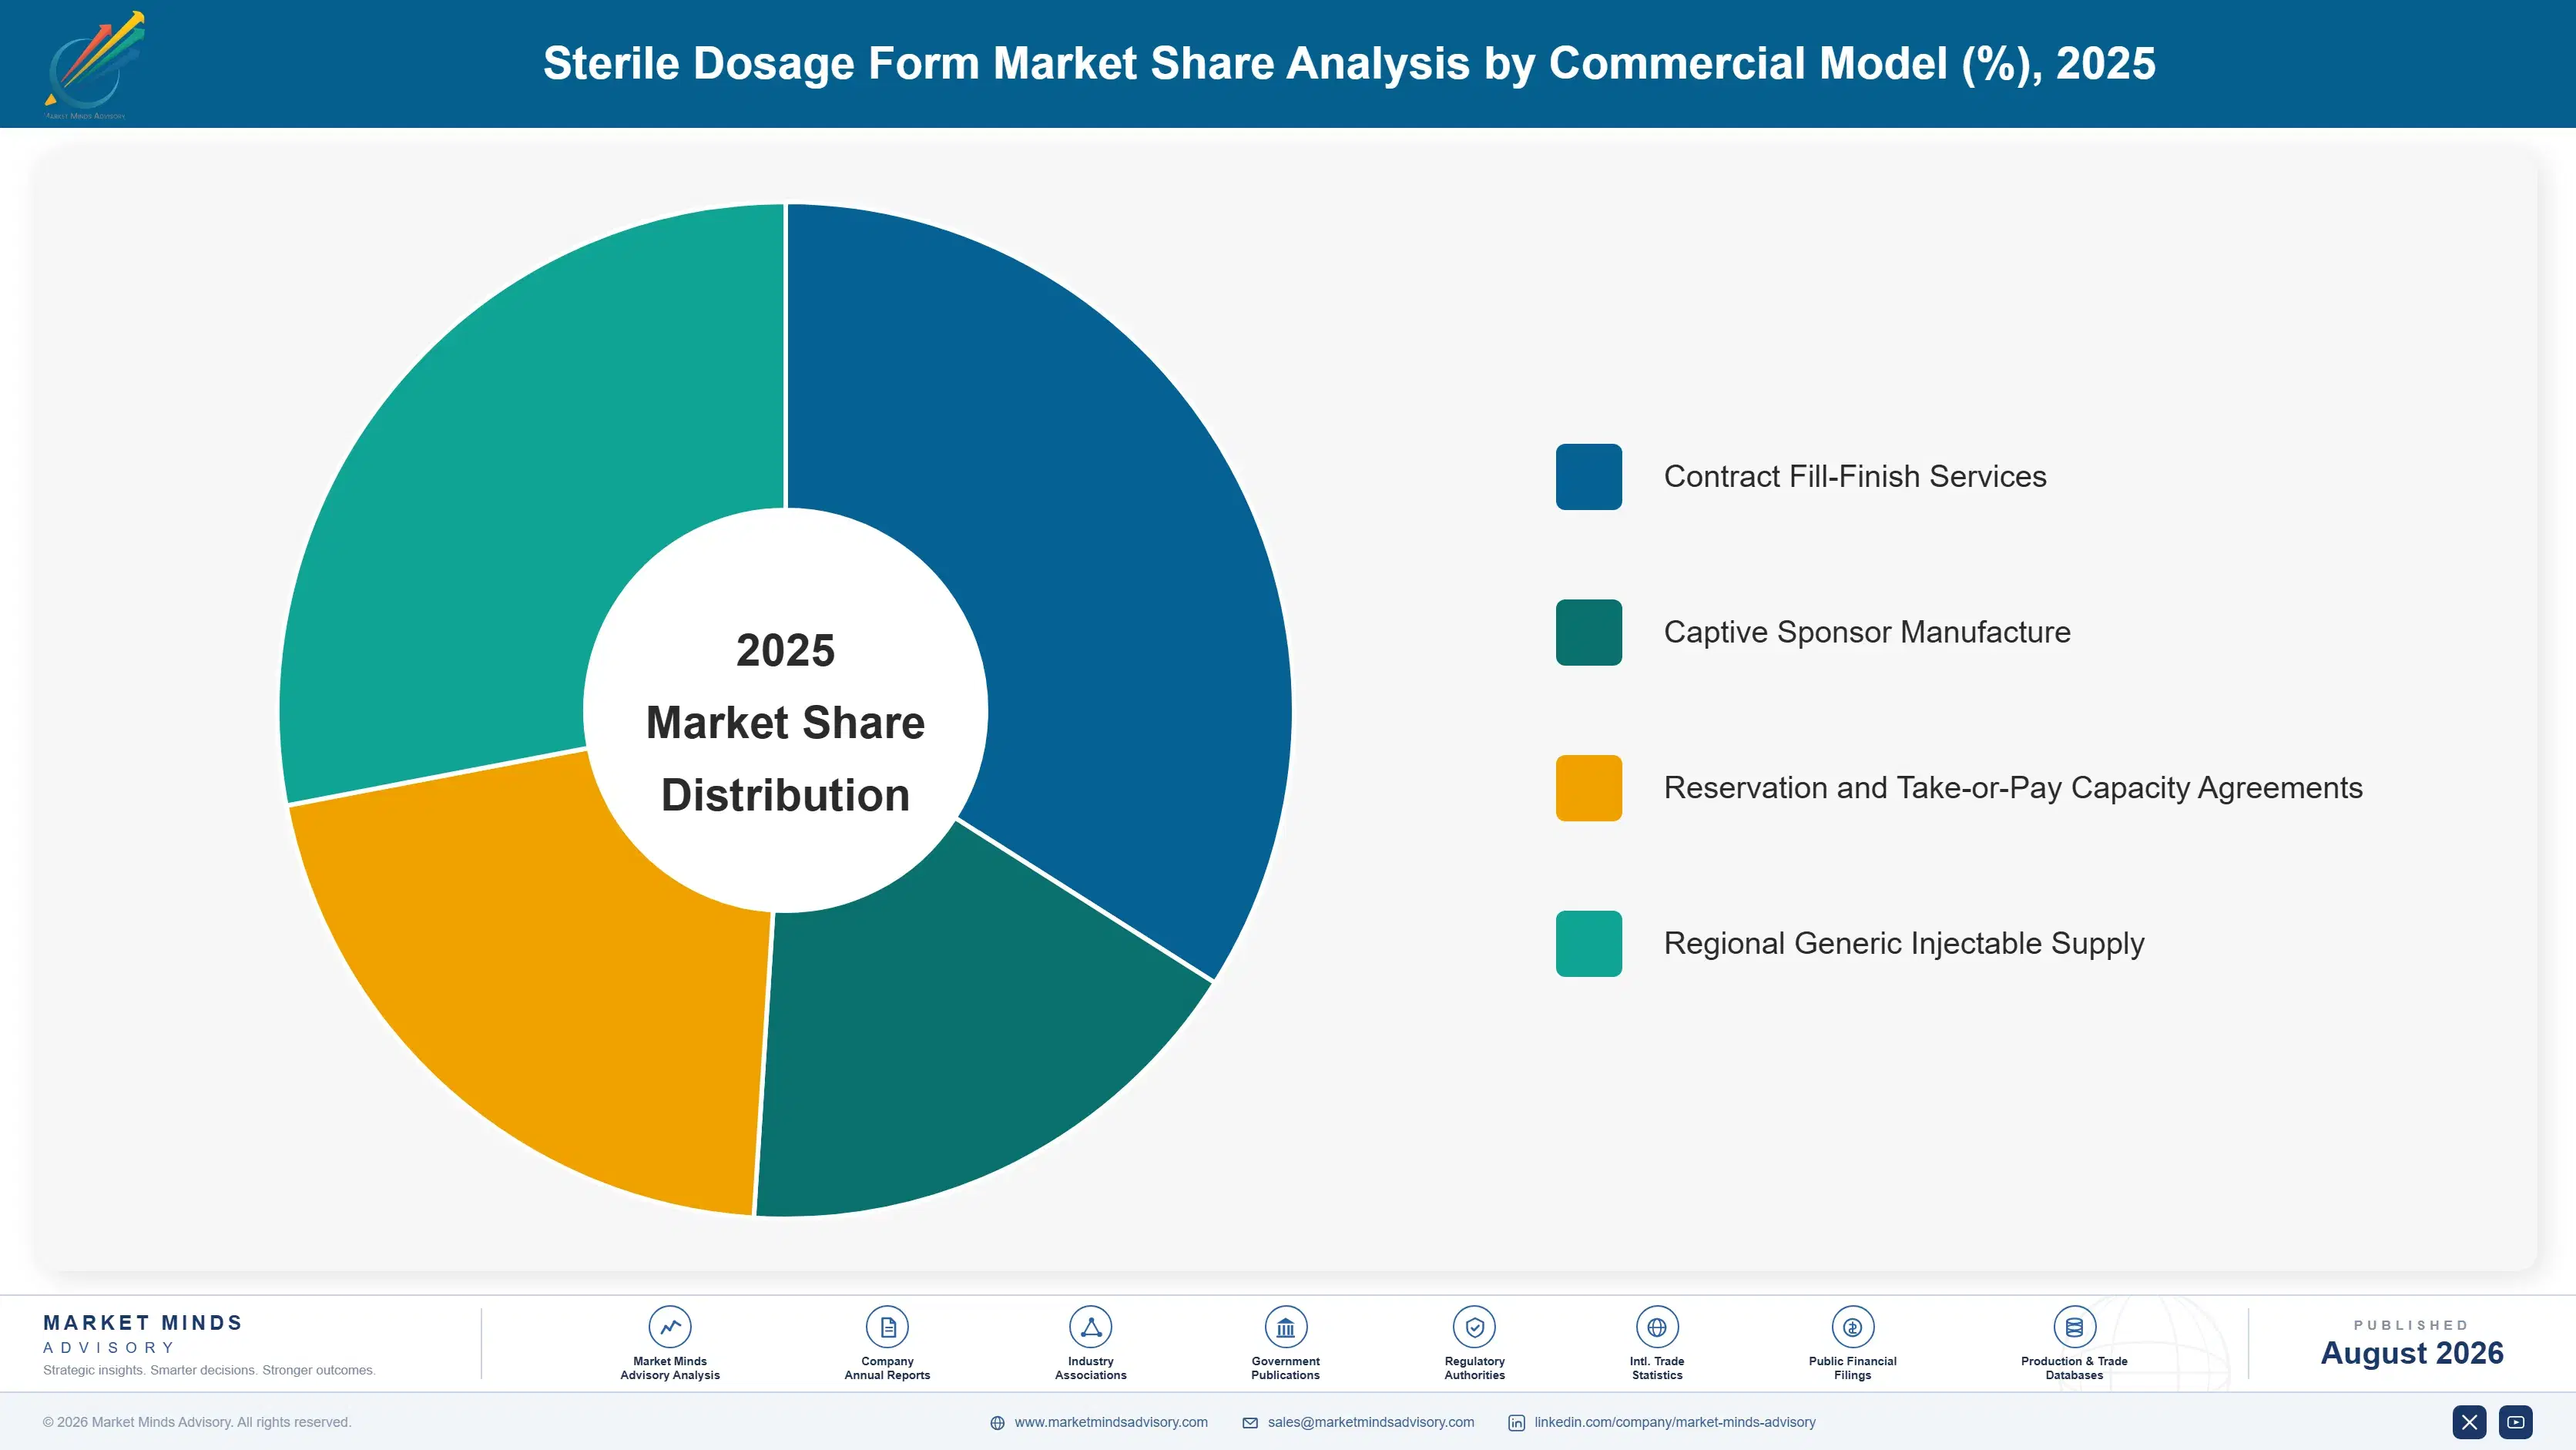
Segmentation follows container and presentation format, because each requires distinct line configuration, qualification and closure integrity approach. A sponsor moving a product from vial to prefilled syringe is not changing supplier preference; it is changing which qualified lines in the world can make the product at all. Six formats sit here, separated by container and closure.
sterile-dosage-form-market-market-share-analysis-1787309330922

Prefilled Syringes and Autoinjector Cartridges

Prefilled syringes and cartridges compound at 12.6%, exactly 1.50 times the market, on self-administered biologics and metabolic medicines moving volume out of clinician-administered vials. Syringe presentations already account for around 34% of sterile units and carry considerably more complexity: siliconisation control affects both protein stability and glide force, tungsten residue from needle forming can aggregate certain proteins, and container closure integrity must hold across a needle, a stopper and a device interface. Value per unit is several times a comparable vial. Qualified capacity for specific syringe formats is the tightest position in the whole sector, and a sponsor without a slot cannot substitute a vial line however much nominal capacity that line has available.
CAGR 12.6%

Lyophilised Vial Filling

Lyophilised filling grows at 9.9% because many biologics, peptides and cell-derived products are not stable enough in solution to survive a commercial shelf life. Freeze-drying adds a lengthy cycle inside the sterile envelope, which ties up line time far longer than liquid filling and makes lyophilisation capacity scarcer per unit of output than the raw line count suggests. Cycle development is genuinely specialised, since a poorly designed cycle produces collapsed cake, residual moisture or reconstitution problems that only appear on stability. Operators holding both lyophilisation capacity and cycle development capability serve products nobody else can take, and the qualification burden means very few new entrants attempt it at all. Cycle development rather than the dryer is the real barrier.
CAGR 9.9%
Full segment breakdown across 6 segments available in the complete report.

Regional Architecture and Country Demand Map

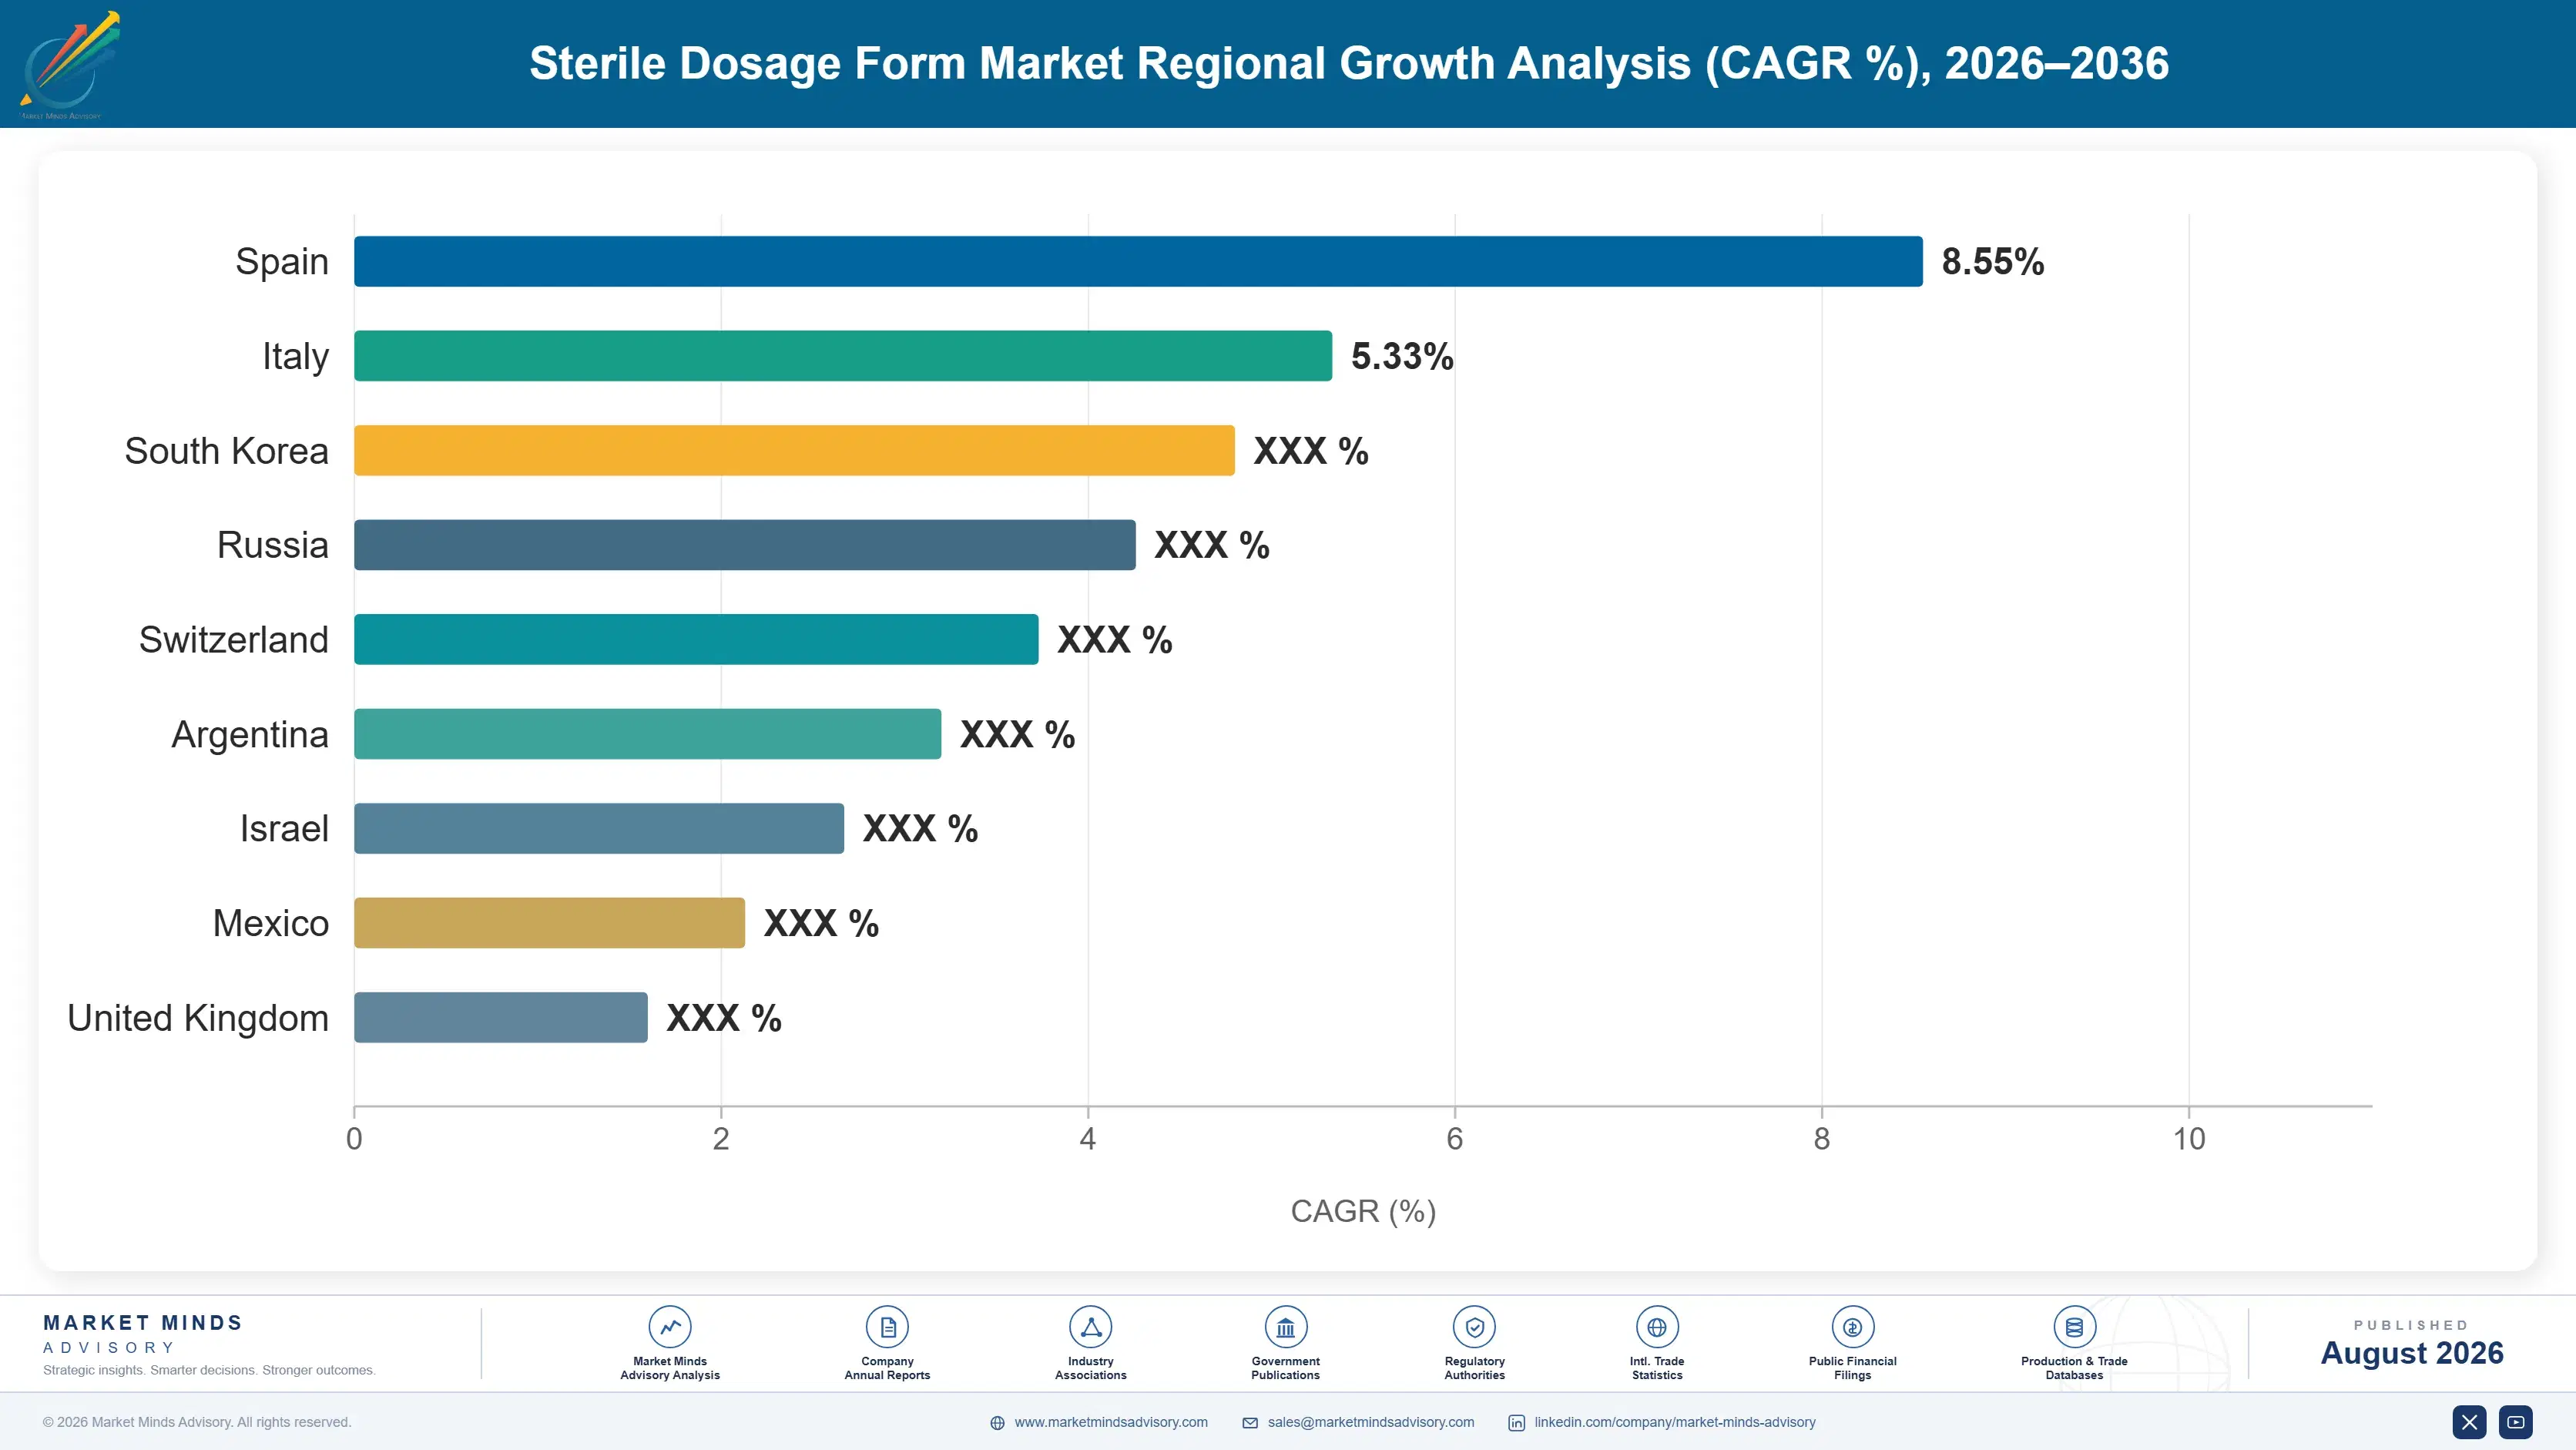
Demand follows qualified capacity rather than pharmaceutical consumption, since sterile fill happens where a line has passed inspection. Regulatory acceptance in destination markets then determines which capacity a sponsor can actually use. East Asia leads on capacity additions rather than on domestic pharmaceutical consumption. Inspection acceptance decides usability.

East Asia

East Asia holds 29% of qualified capacity, the largest regional share, growing at 9.4%. Chinese aseptic capacity has expanded substantially and increasingly meets international regulatory expectations, which converts domestic capacity into globally usable capacity. Korean contract manufacturers have built large-scale biologics fill-finish operations serving Western sponsors directly. Japanese capacity is technically excellent and oriented toward domestic supply, with conservative qualification practice. Regional expansion has been faster than anywhere else because construction timelines are shorter and capital cost per line lower, though the four year qualification requirement applies identically. Korean contract operators in particular now serve Western sponsors directly at scale, which was not true five years ago and represents the sharpest single change in global supply.
Share: 29% | CAGR: 9.4% (2026 to 2036)

North America

North America accounts for 27% of capacity and grows at 8.1%. The region hosts the largest concentration of complex and high-value fill-finish work, including cell and gene therapy, high-potency products and the clinical supply that accompanies domestic development activity. Contract capacity is tight and pricing reflects it, particularly for prefilled syringe formats where utilisation is highest. Onshoring policy interest has supported new investment announcements, though the four year qualification timeline means announced capacity affects supply toward the end of the forecast period rather than now. Prefilled syringe utilisation is the highest of any region and any format, and pricing there reflects genuine scarcity rather than cost structure. Announced onshoring capacity affects supply late in the forecast period.
Share: 27% | CAGR: 8.1% (2026 to 2036)
Regional intelligence for 5 additional markets available in the complete report: Western Europe, South Asia and Pacific, Latin America, Middle East and Africa, Eastern Europe. Contact sales@marketmindsadvisory.com.
sterile-dosage-form-market-country-cagr-analysis-1787309331432

Selling Qualified Slots Not Capacity

Sterile manufacturing sells availability under a four year lead time, and the scarce commodity is a qualified slot for a specific presentation rather than capacity in general. Four positions matter, and every one turns on qualification rather than on cost or scale. Two concern what a line can accept and two concern how the capital risk is carried.

Qualify Multiple Formats on Every New Line

Industry utilisation near 83% understates scarcity because lines are qualified for particular containers and closures, so nominally free capacity frequently cannot take the product needing it. Building and qualifying multi-format flexibility into a new line costs materially less than a second line at USD 110 million, and it converts stranded capacity into sellable slots. Operators who did this during the vaccine build-out are the ones absorbing metabolic medicine demand now rather than watching it go elsewhere. Stranded capacity becomes sellable slots without any new construction. Multi-format qualification costs a fraction of a second line.
Market Impact: Utilisation reported near 83% right

Price Availability Rather Than Cost Per Unit

A sponsor with an approval date and no qualified slot has almost no alternatives, because the four year qualification timeline cannot be compressed for any commercial reason. Pricing against that scarcity rather than against cost-plus benchmarks is the difference between a service margin and a capacity margin. Operators who benchmark against contract manufacturing norms leave substantial value with the sponsor, particularly in prefilled syringe formats where qualified capacity is tightest across the whole sector. A line costs around USD 110 million and four years, and no amount of commercial pressure changes either figure.
Market Impact: Lead times fixed at 4 years as a mi

Secure Take-or-Pay Reservations Before Any Construction

Committing USD 110 million against a four year timeline means investing against demand forecasts that are routinely wrong by qualification. Take-or-pay reservation agreements signed before construction transfer that forecast risk to sponsors who need the certainty more than the operator does, and they make the capital decision financeable. The vaccine period demonstrated both sides of this: operators with reservations were protected, and those building speculatively carried the normalisation entirely themselves. Operators with reservations were protected through the normalisation while those building speculatively carried it entirely themselves, which is the clearest recent evidence available.
Market Impact: Committing USD 110 million for each

Build Lyophilisation Capability Alongside Liquid Filling

Lyophilised filling grows at 9.9% and ties up line time far longer than liquid filling, which makes the capacity scarcer per unit produced than line counts suggest. Cycle development is genuinely specialised, and a poor cycle produces collapse or moisture problems that surface only on stability testing months later. Operators holding both the capacity and the cycle development capability take products competitors cannot accept at all, and the qualification burden deters most new entrants from attempting it. Very few new entrants attempt to build the capability at all. Products competitors cannot accept at all are the best available position.
Market Impact: Lyophilised filling compounding at

Who Controls the Margin Pool

Five participants hold 44% measured on sterile fill-finish revenue, the basis applied throughout this section. The field mixes dedicated contract manufacturers, integrated pharmaceutical companies selling surplus capacity and specialists in particular presentations. Catalent and Fresenius Kabi lead, and the gap to the challenger group is narrow on liquid vial filling and considerably wider on syringe and lyophilisation work.
Competition operates on three dimensions. Qualified capacity in the specific presentation a sponsor needs decides who can even quote. Regulatory inspection track record decides who a sponsor will risk an approval date on. And technical capability in lyophilisation cycle development, high potency handling or device assembly decides who takes the complex work at premium pricing. Price enters the conversation last, if at all.

Two pressures are moving position. Indian and Korean operators building to international inspection standards are converting low-cost capacity into globally usable capacity, which is the most consequential supply development in years. Meanwhile contamination control expectations keep raising the entry cost. Rankings will shift toward operators pairing isolator capacity with multi-format qualification. Operators with isolator capacity qualified across several formats absorb whichever category surges next.
sterile-dosage-form-market-company-positioning-matrix-1787309331952

Competitive Moat and Risk Dimensions

CATALENT

Moat: Presentation breadth and inspection record

Catalent operates qualified capacity across vials, syringes, cartridges and lyophilisation with a long regulatory inspection history, which lets a sponsor place several presentations of the same product without qualifying multiple suppliers. In a sector where a failed inspection can delay an approval date, that accumulated track record is worth more to a sponsor than any pricing concession.
CATALENT

Risk: Emerging operator cost convergence

Indian and Korean operators building isolator lines to international inspection standards are closing the quality gap while retaining a substantial capital and operating cost advantage. As those facilities accumulate inspection history of their own, the premium a Western contract manufacturer commands for equivalent presentations becomes progressively harder to defend.
FRESENIUS KABI

Moat: Integrated parenteral scale position

Fresenius Kabi combines its own sterile injectable portfolio with contract fill-finish capacity, which gives it baseline loading independent of contract demand and therefore better utilisation economics than a pure contract operator. That internal volume absorbs the demand troughs that leave dedicated contract manufacturers carrying fixed cost on idle isolator lines.
FRESENIUS KABI

Risk: Internal demand crowds contract work

The same integration creates a conflict a sponsor notices. When internal portfolio demand rises, contract customers occupy the lower priority, and sponsors making an approval date commitment weigh that carefully. Dedicated contract manufacturers can promise capacity allocation in a way an integrated operator cannot credibly match.

Players Tracked

Prominent Players

Catalent
Fresenius Kabi
Baxter International
Recipharm
Siegfried Holding

Other Key Players

Lonza Group
Samsung Biologics
WuXi Biologics
Vetter Pharma
Aenova Group
Jubilant Pharmova
Piramal Pharma Solutions
Gland Pharma
Hikma Pharmaceuticals
Grifols
Thermo Fisher Scientific
SK pharmteco
Curia Global
NextPharma
Emergent BioSolutions

Recent Developments

JANUARY 2025

Contamination control strategy documentation becomes standard inspection focus

Regulatory inspectors across major jurisdictions made formal contamination control strategy documentation a routine focus of aseptic facility inspection, extending expectations beyond barrier technology into process design. This was regulatory practice rather than any commercial development among sterile manufacturers, and it now applies to existing lines too.
Signal: Documentation expectations lengthen qualif
MAY 2025

Metabolic medicine demand absorbs available prefilled syringe capacity

Rapid growth in self-administered metabolic medicines consumed available qualified prefilled syringe slots across contract and captive capacity, extending lead times for unrelated biologic programmes. This reflects demand conditions rather than any transaction among the manufacturers involved. Sponsors in unrelated therapeutic areas found themselves queuing behind a single category.
Signal: One therapeutic category exhausting a form
SEPTEMBER 2025

Indian isolator capacity clears international regulatory inspection

Several Indian sterile facilities built to isolator standards passed inspections permitting supply into regulated Western markets, converting domestic capacity into globally usable capacity. These were regulatory inspection outcomes rather than commercial developments among the operators involved. Those facilities had been built to isolator standards specifically to achieve this outcome.
Signal: Low-cost capacity clearing Western inspect

Primary Containers, Isolators and Cleanroom Operations

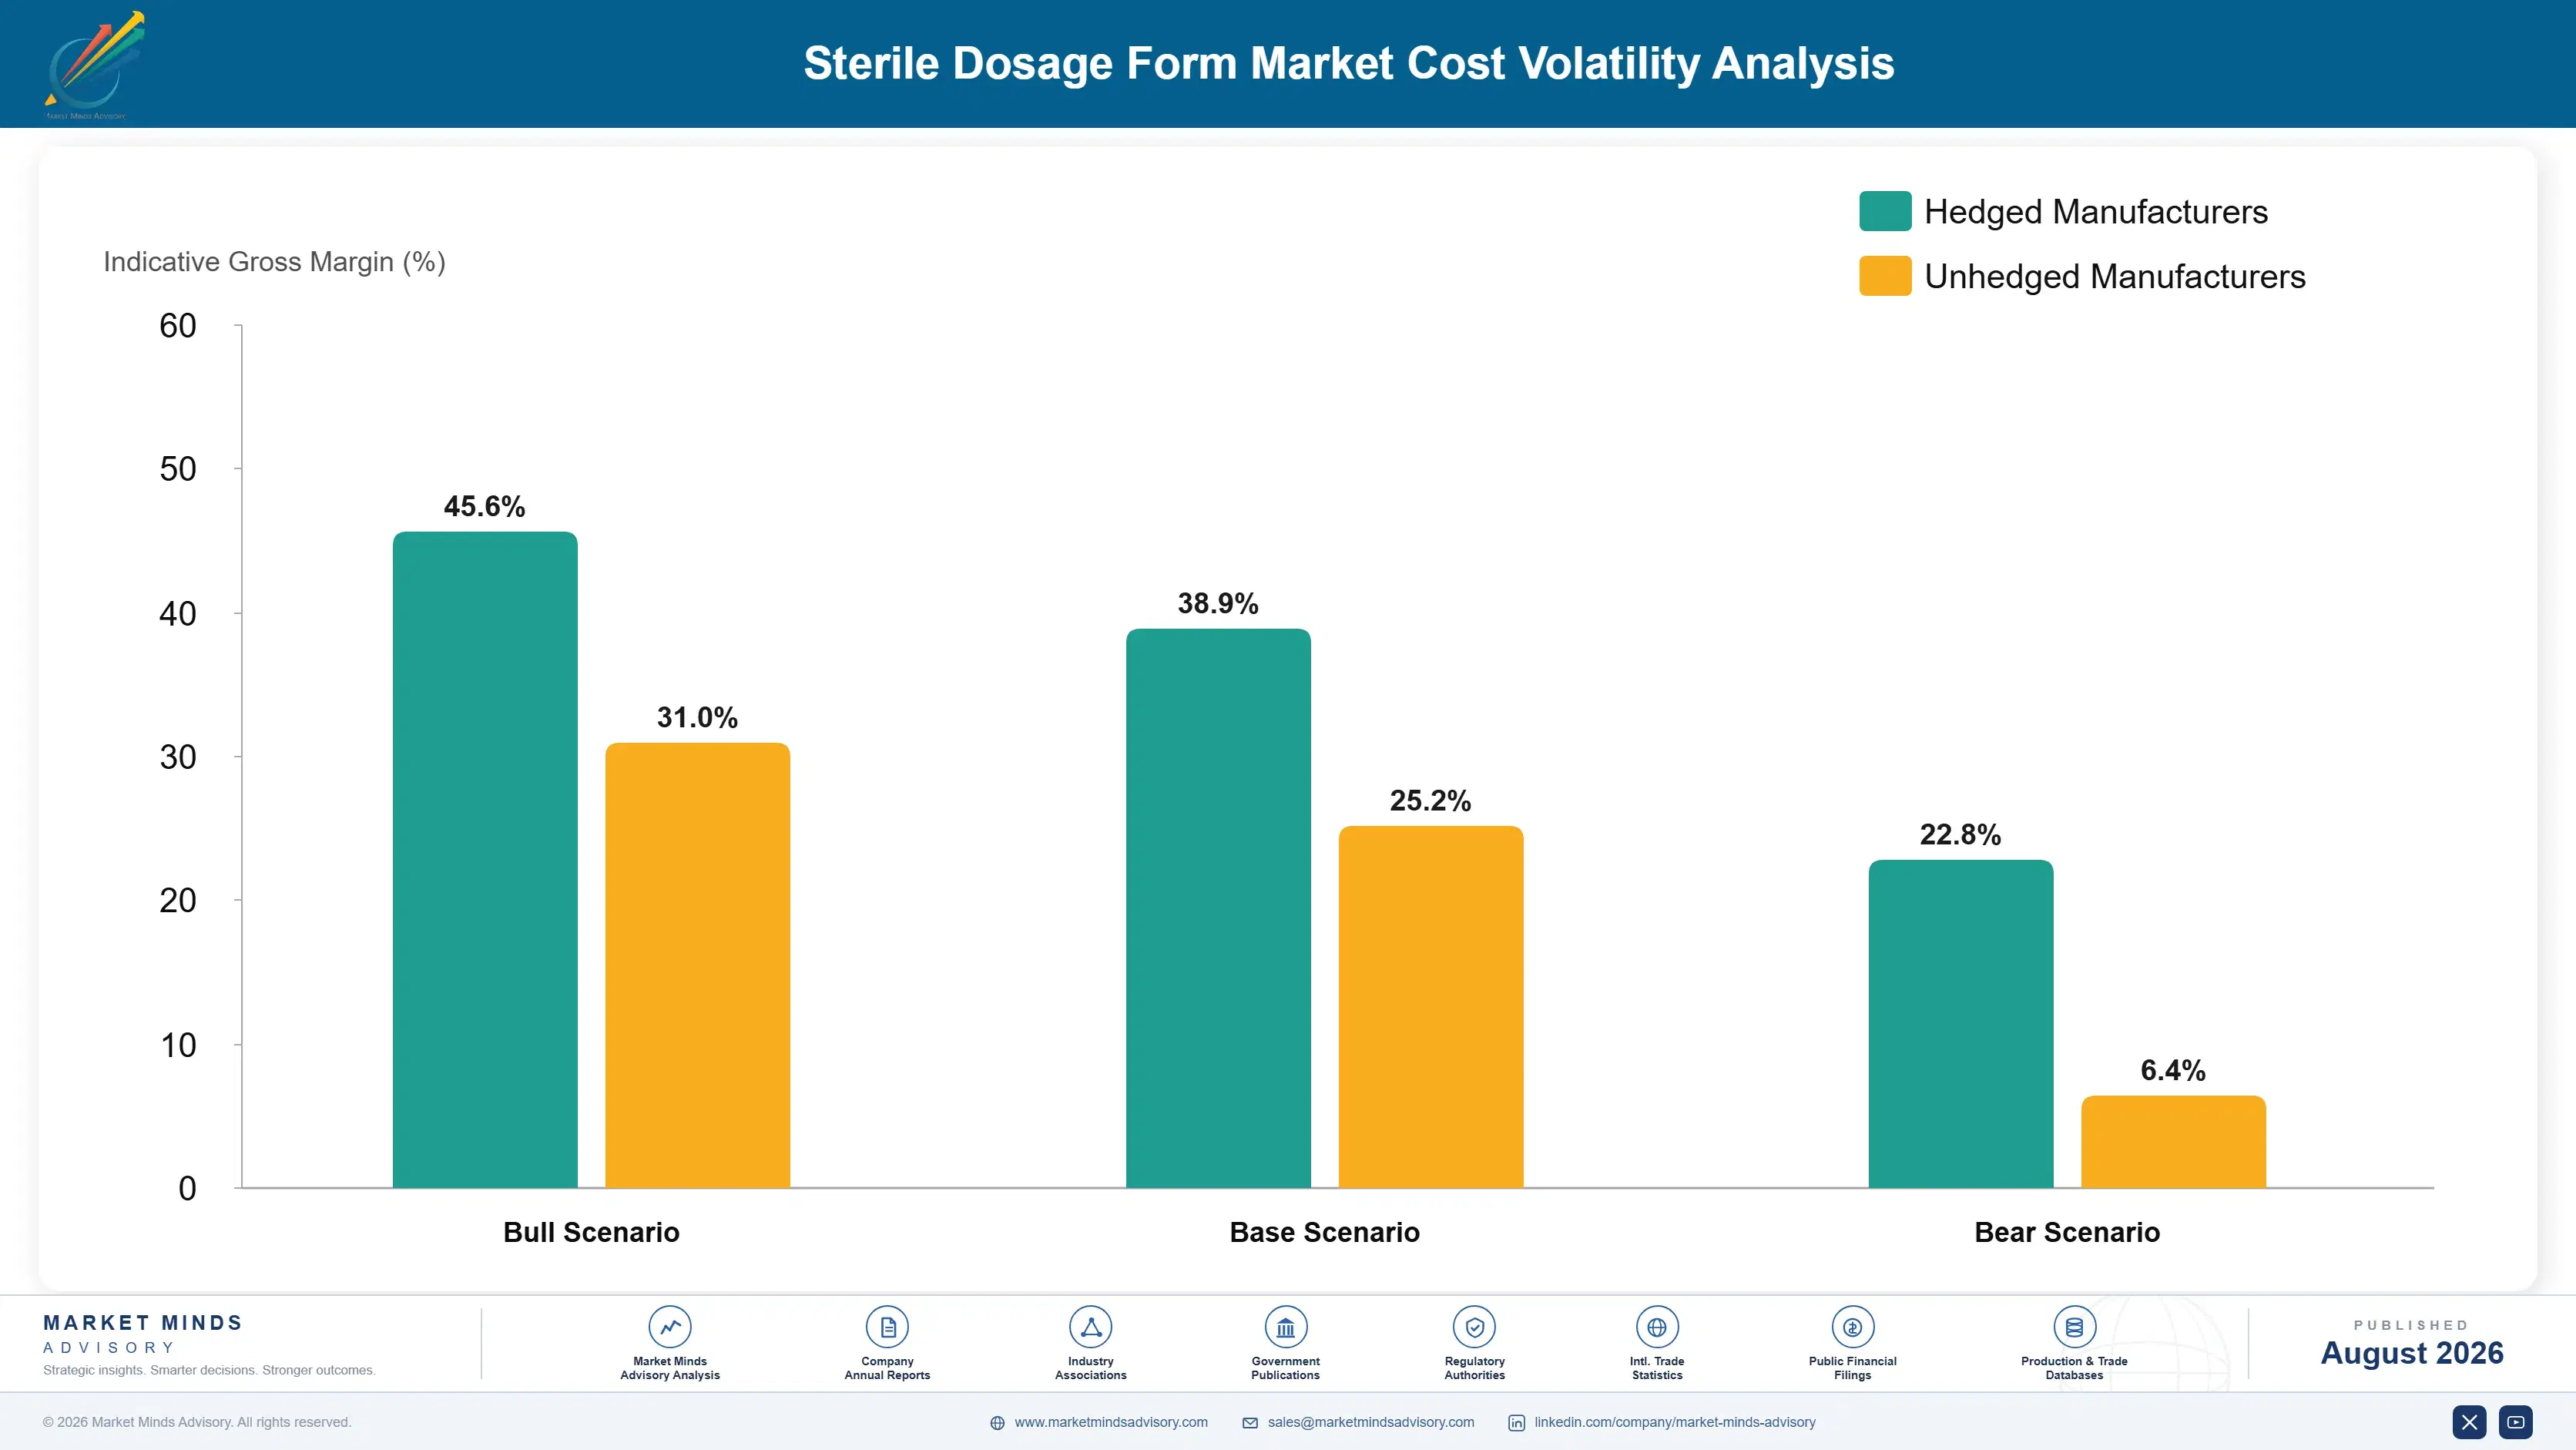
Primary packaging components account for roughly 31% of cost of goods, dominated by borosilicate glass vials and syringe barrels, elastomeric stoppers and plungers, and needle assemblies for device presentations. Cleanroom operations, gowning consumables, environmental monitoring and utilities add about 24%. Depreciation on isolator lines costing near USD 110 million is a substantial fixed burden that behaves quite differently from either.
Borosilicate glass and elastomeric component supply tightened severely through 2021 and 2022 as vaccine demand consumed available capacity, and sterile manufacturers carried it worst because component substitution requires stability data and regulatory change control. Company annual reports across the contract manufacturers disclose the resulting cost and scheduling effects. World Health Organization reporting on vaccine supply chains documents the concentration of primary container manufacture. Stability data cannot be generated inside a shortage.

Exposure divides by presentation mix and by capacity structure. Syringe-weighted operators carry higher component cost and higher realised price, so the ratio holds. Vial-weighted operators carry lower component cost and thinner margin. Every operator carries isolator depreciation regardless of loading, which means utilisation rather than input cost determines profitability across the cycle more than anything else does.
sterile-dosage-form-market-cost-volatility-analysis-1787309332146

Qualify dual primary container sources with stability data ready

Component substitution requires stability data and regulatory change control, so a shortage cannot be answered by purchasing alone. Qualifying a second glass and elastomer source during initial product transfer, with the stability package already generated, preserves the option to switch inside a disruption rather than months after it has already cost the sponsor a launch.

Match line loading to depreciation rather than to sales targets

Isolator depreciation runs whether a line is filling or idle, which makes utilisation the dominant profitability variable across a cycle. Planning loading against fixed cost recovery rather than against revenue targets exposes which slots are genuinely worth discounting and which are being given away below the marginal cost of running the suite at all.

Recover environmental monitoring cost in complex product pricing

High potency, cell-derived and multi-format products demand disproportionately more environmental monitoring, changeover validation and cleaning verification than standard liquid vial work. Pricing those requirements explicitly rather than absorbing them into a per-unit rate stops complex work quietly subsidising simple work, which is a common and expensive accounting failure in this sector. Most operators have never separated the two.

Portfolio Architecture for Margin Defence

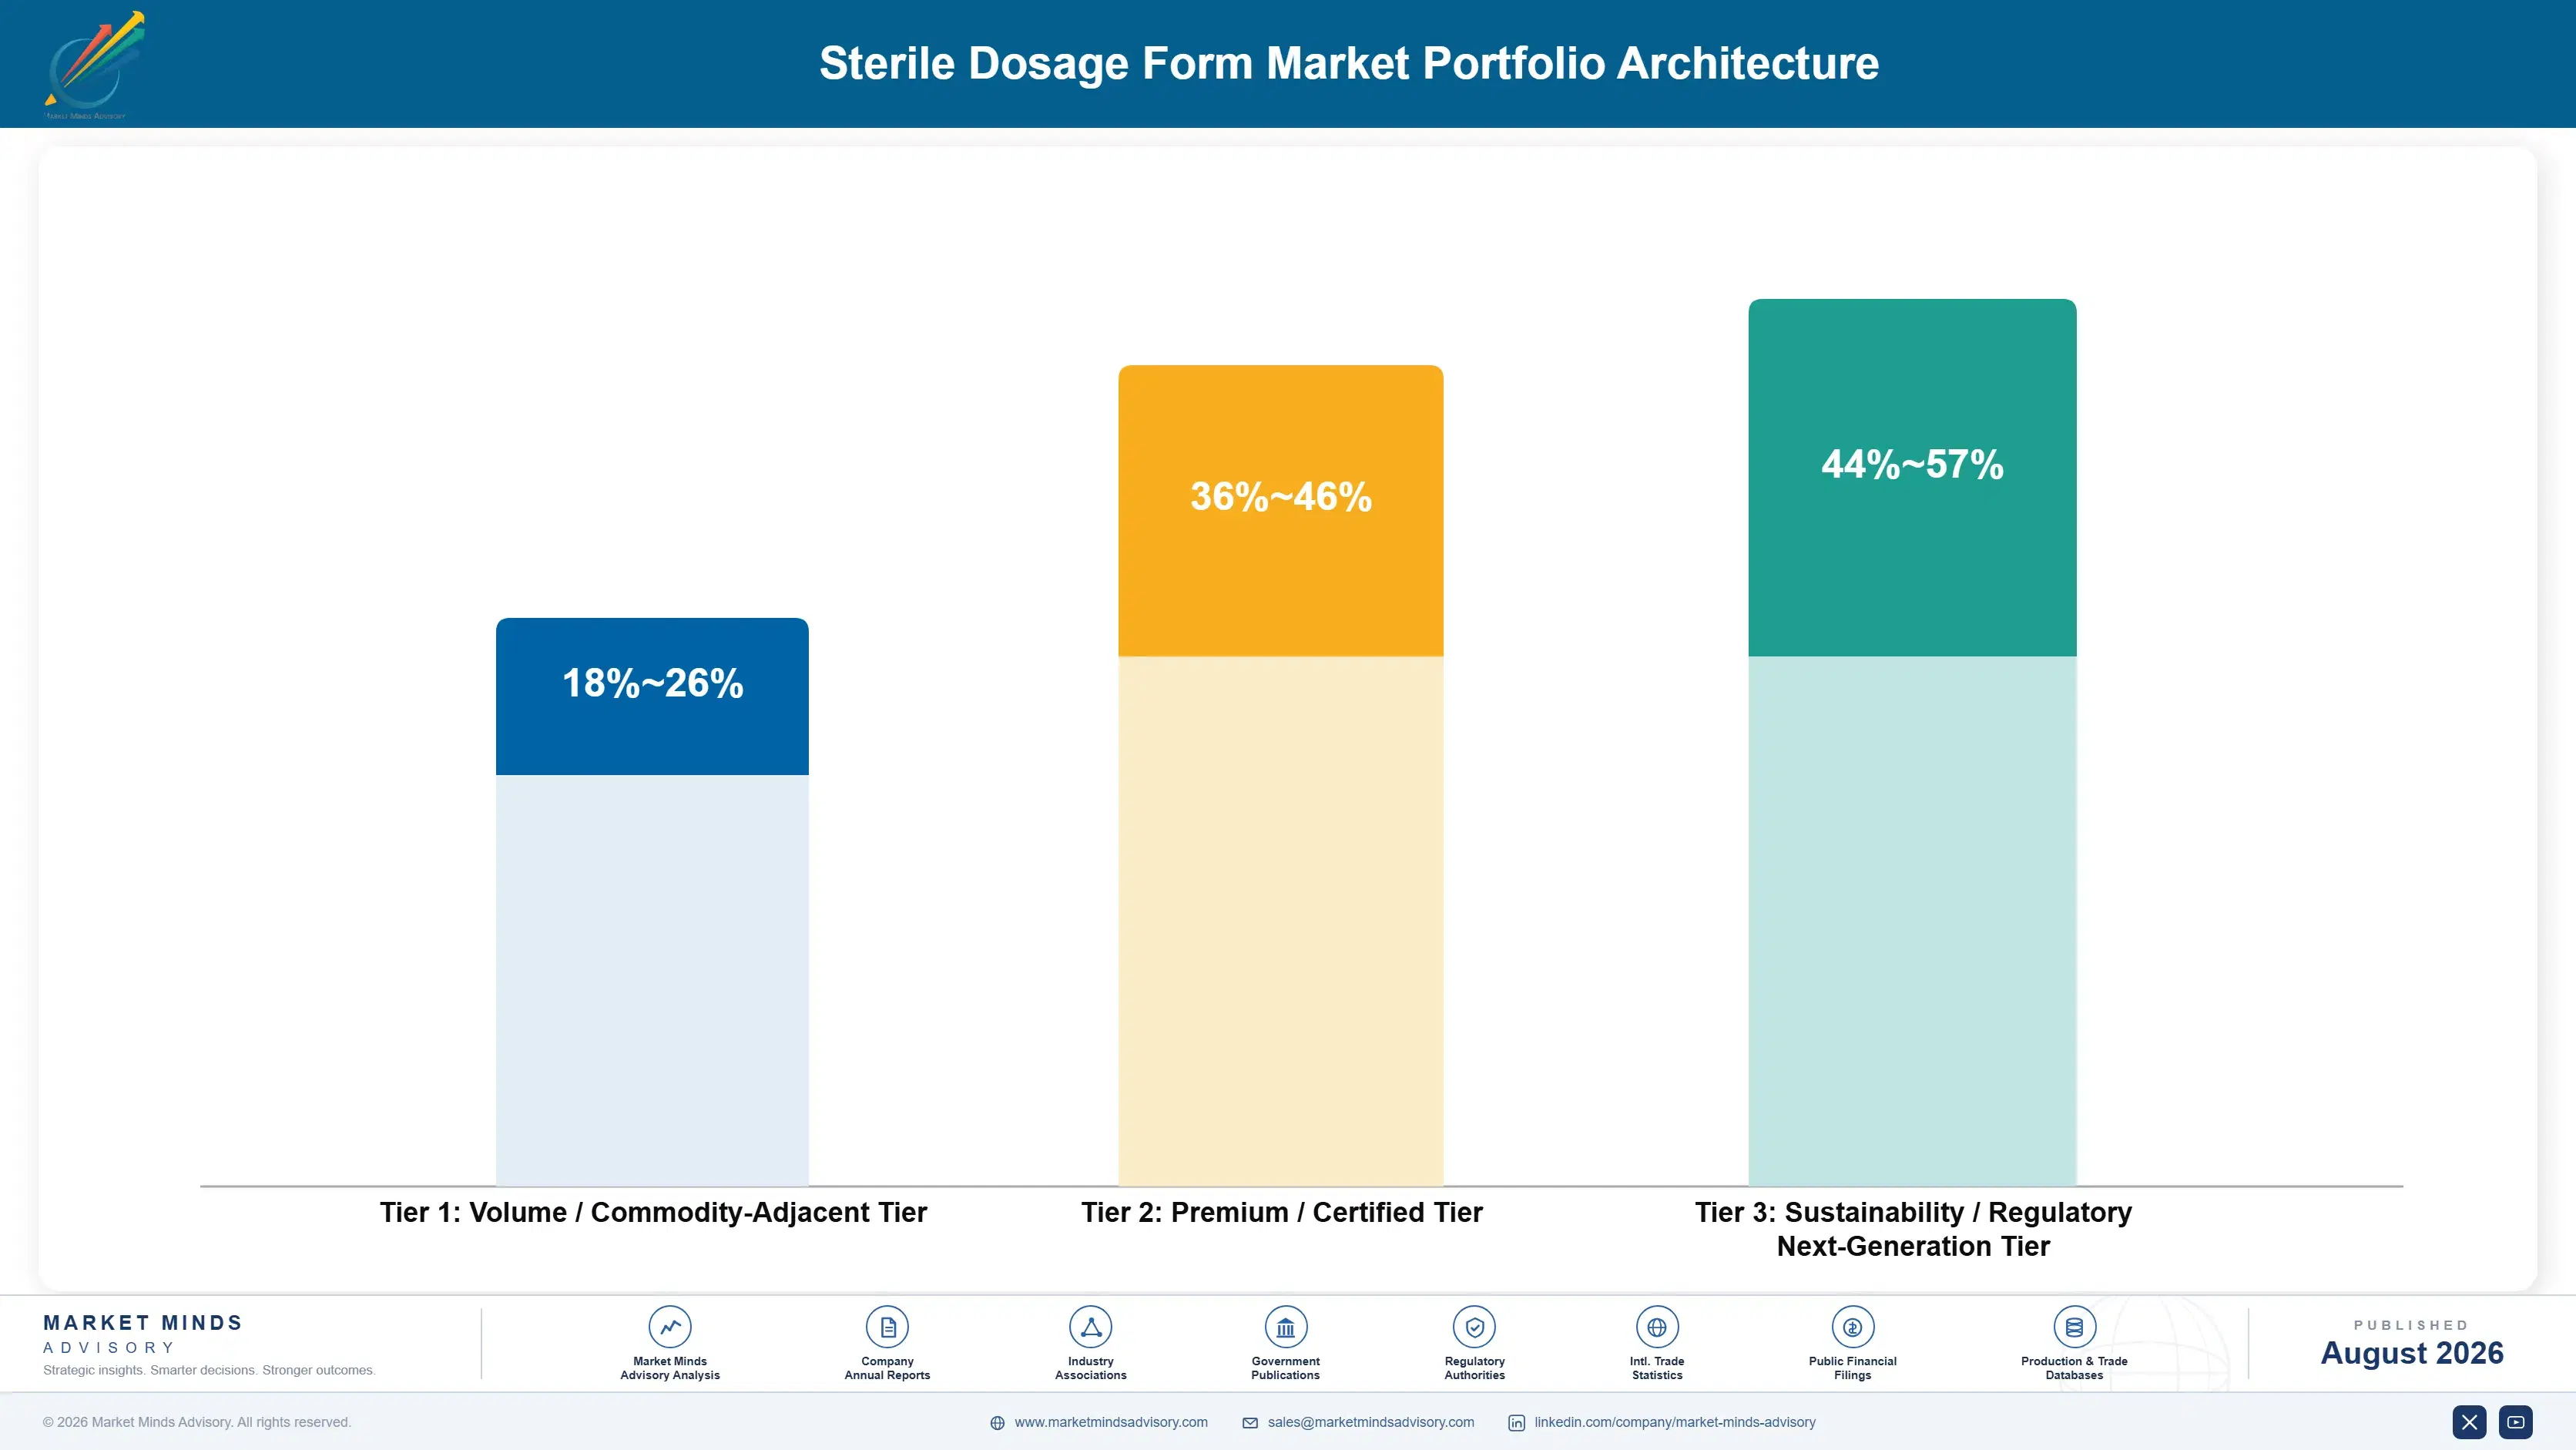
The portfolio separates on presentation complexity and on how long a product occupies a line. Large volume parenterals and infusion bags are high-volume, freight-sensitive and thin-margin. Liquid vial filling is the established core. Lyophilised filling ties up capacity for far longer per unit. Prefilled syringes and cartridges add device assembly and closure integrity complexity at the highest value per unit in the sector. Ophthalmic preparations sit apart again on their own regulatory and cont
The tension is between throughput and scarcity value. Liquid vial work fills lines efficiently and earns least. Lyophilisation and syringe work earn most and consume disproportionate line time or qualification effort. An operator optimising purely for throughput ends up with high utilisation and poor margin, while one chasing only complex work leaves expensive isolator capacity idle between programmes.

High-value pools concentrate where qualified capacity is genuinely scarce. Prefilled syringe formats, lyophilisation with cycle development capability and high potency handling all qualify, and none of them is won on price per unit filled. What they share is that a sponsor cannot readily go elsewhere, either because no other line holds the qualification or because nobody else has the development capability to run the process at all.

Volume / Commodity-Adjacent Tier

Large volume parenteral and infusion bag manufacture alongside standard liquid ampoule filling. High volume, freight-sensitive and locally supplied, competing largely on cost with limited technical differentiation available to any operator.
Gross Margin: 16-26%

Premium / Certified Tier

Liquid and lyophilised vial filling for biologics and peptides under isolator conditions. Inspection track record and lyophilisation cycle development capability qualify the operator well before pricing enters any sponsor discussion.
Gross Margin: 30-44%

Sustainability / Regulatory / Next-Generation Tier

Prefilled syringe and autoinjector cartridge filling with device assembly, plus high potency and cell-derived product handling. The wide margin range separates scarce qualified syringe capacity from newer entrants still accumulating inspection history.
Gross Margin: 34-58%
sterile-dosage-form-market-portfolio-architecture-1787309332641

High-value Sub-segments and Strategic Watch-out

Prefilled Syringes and Autoinjector Cartridges

Compounding at 12.6% on self-administered biologics and metabolic medicines, and already 34% of sterile units. Qualified capacity for specific syringe formats is the tightest position anywhere in the sector, which supports pricing on availability. Device assembly and closure integrity add real complexity beyond filling alone.
Gross Margin: 38-58%

Lyophilised Vial Filling

Growing at 9.9% for products not stable in solution, tying up line time far longer per unit than liquid filling does. Cycle development capability is genuinely specialised, and very few new entrants attempt to build it at all. Errors surface only months later on stability testing.
Gross Margin: 34-46%

Liquid Vial Filling

The volume core at 6.8%, filling lines efficiently and earning the least per unit of capacity consumed. It remains the largest single format and the one where emerging operators are closing the quality gap fastest against Western incumbents. It fills lines efficiently and earns the least per hour of capacity.
Gross Margin: 28-40%

Blow-Fill-Seal and Advanced Aseptic Formats

The strategic watch-out. Blow-fill-seal offers container forming and filling in one sterile operation at low unit cost, and it remains constrained to a narrow product range that biologics have largely not been able to use. Biologics have largely been unable to use the format at all.
Gross Margin: 22-42%

Multi-Year Commitments Around Approval Dates

Revenue arrives through long commitments rather than transactions. A sponsor transferring a product into a sterile facility spends a year on technical transfer and validation before commercial supply begins, then stays for the product's life because moving again means repeating that work and filing a variation. Take-or-pay reservations and multi-year supply agreements are the norm, which makes the revenue base unusually visible and unusually hard to win. Winning a programme is slow and losing on
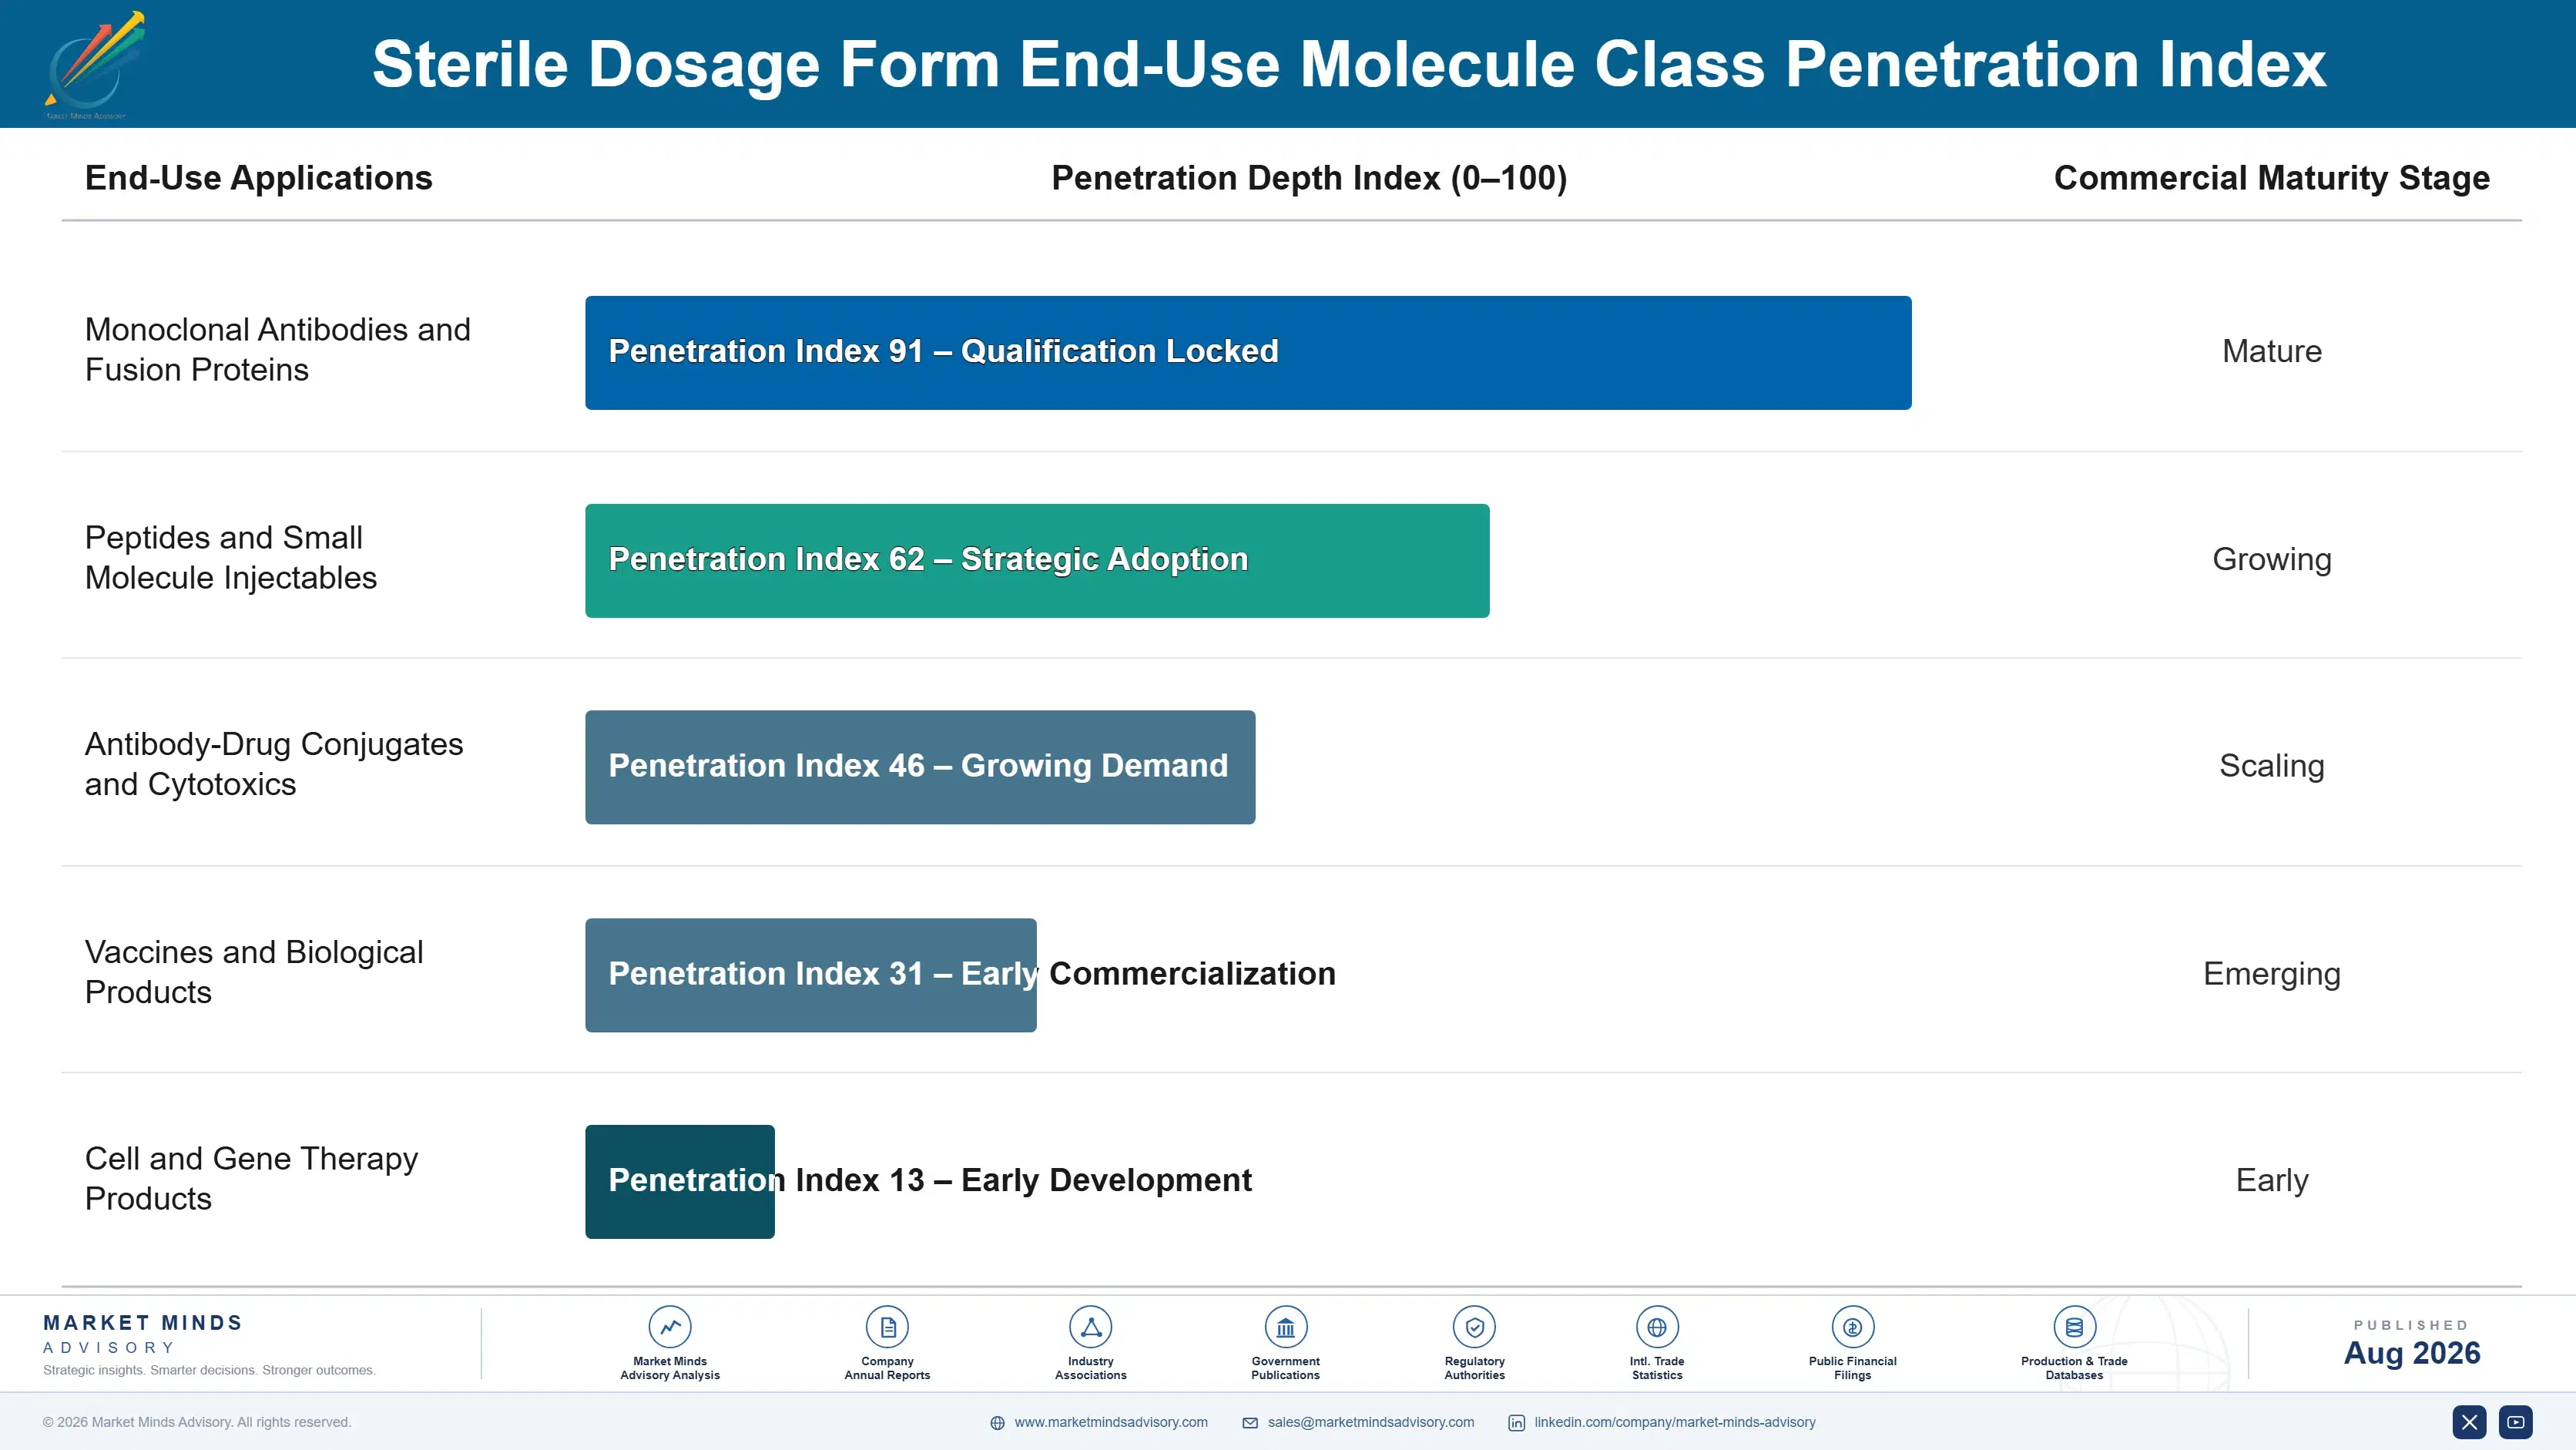
Depth varies by product complexity and volume. High-volume biologics in syringes generate the largest and most valuable commitments. Lyophilised low-volume products consume disproportionate line time for modest revenue. Cell and gene therapy programmes involve tiny volumes at extreme unit value and demanding segregation requirements. Clinical supply is small, unpredictable and strategically useful, because clinical products become commercial ones.

The deciding function is unusually senior and unusually risk-averse. Technical operations and quality leadership select sterile suppliers, weighing inspection history against an approval date they cannot move, and procurement negotiates inside a shortlist somebody else has already set. A supplier with a recent regulatory observation is frequently excluded before price is discussed at all.
sterile-dosage-form-market-end-use-penetration-index-1787309333171

Where Sterile Operators Win

These are among the four positions where our research anticipates prominent divergence between winners and laggards over the coming forecast period. Each is grounded in the demand model, the regulatory perimeter, and the announced capacity pipeline.
01 / MULTI-FORMAT QUALIFICATION BREADTH

Free capacity that cannot take the product is not capacity

Industry utilisation near 83% substantially understates scarcity, because aseptic lines are qualified for particular containers and closures and nominally idle capacity frequently cannot accept the product needing a slot. Building multi-format flexibility into a new line costs materially less than a second line at USD 110 million. Operators who did this during the vaccine build-out went on to absorb metabolic medicine demand while others watched it go to competitors, and the qualification cost is a fraction of what a new line demands.
02 / SCARCITY-BASED PRICING DISCIPLINE

A sponsor with an approval date has no alternatives

Four years from investment decision to commercial release cannot be compressed for any commercial reason, so a sponsor needing a qualified slot in a specific presentation has almost nowhere else to go. Pricing against that scarcity rather than against cost-plus contract manufacturing benchmarks is the difference between a service margin and a capacity margin. Operators anchoring instead to industry norms leave a great deal of value with the sponsor quite unnecessarily, and prefilled syringe formats are where that gap is widest of all.
03 / FORECAST RISK TRANSFER

Take-or-pay before construction, not after commissioning

Committing USD 110 million against a four year qualification timeline means investing against demand forecasts that are routinely wrong by the time the line is ready. Reservation agreements signed before construction transfer that risk to sponsors who need supply certainty more than the operator needs the volume. The vaccine period proved both sides of this, protecting operators with reservations and punishing those who built speculatively on demand that normalised, which is the clearest natural experiment this sector has produced in decades.
04 / LYOPHILISATION CAPABILITY DEPTH

A bad freeze-drying cycle only fails on stability

Lyophilised filling grows at 9.9% annually and occupies line time far longer per unit than liquid filling does, which makes the capacity genuinely scarcer than any volume figure would suggest. Cycle development is highly specialised work where errors produce collapsed cake, residual moisture or reconstitution failures that only appear months later on stability testing. Operators holding both the capacity and the development capability take products competitors simply cannot accept, and the qualification burden deters almost every prospective new entrant from trying.

Engagement Snapshot From the Field

A live engagement with an industry participant carrying material or product regulatory and market exposure ahead of a defining policy shift, showing how our research translates into a defensible multi-year portfolio strategy.
MARKET MINDS ADVISORY · CLIENT ENGAGEMENT SUMMARY
Sterile Dosage Form Producer Strategic Portfolio Review and Transition Roadmap 2026·Investment Scenario on Sterile Dosage Form Exposure Evaluation 2025-26
CLIENT PROFILE
A European contract sterile manufacturer operating six aseptic filling lines across two sites, with roughly EUR 480 million in revenue and two additional isolator lines commissioned during the vaccine period (client-reported, unverified by MMA). Overall utilisation stood at 71% while the commercial team reported turning away enquiries every month. Qualification breadth had never been reviewed against declined enquiries.
STRATEGIC CHALLENGE
Utilisation had fallen since the vaccine normalisation while demand enquiries remained strong, and leadership was preparing a business case for a further line. The assumption was that total capacity was insufficient for the enquiry flow. Nobody had matched declined enquiries against which specific presentations the existing lines were actually qualified to fill.
MMA APPROACH
MMA analysed eighteen months of declined enquiries by container format, closure system, product category and requested volume, then mapped each against the qualification status of all six existing lines. Incremental qualification cost was estimated for the formats appearing most frequently among the declines. Timelines for incremental qualification were compared directly against the four year timeline for a wholly new line.
KEY FINDINGS
  1. Sixty-eight percent of declined enquiries were for prefilled syringe formats that none of the six lines held qualification for, despite two lines running well below capacity throughout the period.
  2. The two vaccine-period isolator lines were qualified for a single vial format each, which had been the fastest route to commissioning at the time and had left them almost unsellable afterwards.
  3. Adding syringe format qualification to one existing isolator line was costed at under a tenth of a new line, with an eighteen month rather than four year timeline to first commercial fill.
  4. No declined enquiry in the eighteen month period had been for additional vial capacity, which invalidated the entire premise of the new line business case being prepared.
CLIENT PROFILE
A European contract sterile manufacturer operating six aseptic filling lines across two sites, with roughly EUR 480 million in revenue and two additional isolator lines commissioned during the vaccine period (client-reported, unverified by MMA). Overall utilisation stood at 71% while the commercial team reported turning away enquiries every month. Qualification breadth had never been reviewed against declined enquiries.
STRATEGIC CHALLENGE
Utilisation had fallen since the vaccine normalisation while demand enquiries remained strong, and leadership was preparing a business case for a further line. The assumption was that total capacity was insufficient for the enquiry flow. Nobody had matched declined enquiries against which specific presentations the existing lines were actually qualified to fill.
MMA APPROACH
MMA analysed eighteen months of declined enquiries by container format, closure system, product category and requested volume, then mapped each against the qualification status of all six existing lines. Incremental qualification cost was estimated for the formats appearing most frequently among the declines. Timelines for incremental qualification were compared directly against the four year timeline for a wholly new line.
KEY FINDINGS
  1. Sixty-eight percent of declined enquiries were for prefilled syringe formats that none of the six lines held qualification for, despite two lines running well below capacity throughout the period.
  2. The two vaccine-period isolator lines were qualified for a single vial format each, which had been the fastest route to commissioning at the time and had left them almost unsellable afterwards.
  3. Adding syringe format qualification to one existing isolator line was costed at under a tenth of a new line, with an eighteen month rather than four year timeline to first commercial fill.
  4. No declined enquiry in the eighteen month period had been for additional vial capacity, which invalidated the entire premise of the new line business case being prepared.
RECOMMENDED STRATEGY
Phase 1: Phase 1 (months 1 to 6): Halt the new line business case and begin syringe format qualification on the least loaded existing isolator line. Phase 2: Phase 2 (months 6 to 20): Complete qualification and validation, and convert the strongest declined syringe enquiries into reservation agreements. Phase 3: Phase 3 (months 20 to 32): Add a second format qualification and rebuild the capital plan around qualification breadth rather than additional lines.
OUTCOME
Syringe format qualification completed in nineteen months and the line reached 84% loading within two quarters of commercial release (client-reported, unverified by MMA). Overall site utilisation rose to 86% without any additional line, and the deferred capital exceeded EUR 100 million (client-reported, unverified by MMA). Capacity planning is now assessed by qualified format rather than by total filling capability.

Frequently Asked Questions

Foundational context covering the market sizes, CAGR, scope, country, region and competition that inform every finding below. This section is provided to cover basics and most often pre-purchase conversations, answered from the MMA Primary Research Dataset.

What is the current size of the Sterile Dosage Form Market?

The global market was worth USD 62.5 billion in 2025, reaching USD 67.75 billion in 2026. East Asia holds the largest regional share at 29% of qualified capacity.

How large will the Sterile Dosage Form Market be by 2036?

MMA forecasts USD 151.78 billion by 2036, an expansion multiple of 2.24 times the 2026 base. That represents roughly USD 84.03 billion of incremental value.

What is the CAGR for the Sterile Dosage Form Market 2026 to 2036?

The base case compounds at 8.4% annually, with a bull case of 9.7% and a bear case of 7.1%. Historical growth from 2020 to 2025 ran at 7.2%.

Which segment is growing fastest?

Prefilled syringes and autoinjector cartridges compound at 12.6%, exactly 1.50 times the market rate. Self-administered biologics and metabolic medicines are moving volume out of vials.

Who are the major companies in the Sterile Dosage Form Market?

Catalent, Fresenius Kabi, Baxter International, Recipharm and Siegfried Holding hold a combined 44%. Qualified capacity and inspection track record sustain those positions rather than pricing.

Which country is growing fastest?

India compounds at 11.3%, ahead of every other national market. Isolator lines built to international inspection standards are converting low-cost capacity into globally usable capacity.

Report Segmentation Architecture

The full report scope spans multiple orthogonal segmentation dimensions, with cross-tabulated demand data provided for each dimension pair. Coverage extends further to regional breakdowns, trend trajectories, and the competitive detail needed to support segment-level decision-making.

By Container and Presentation Format

  • Liquid Vial Filling
  • Lyophilised Vial Filling
  • Prefilled Syringes and Autoinjector Cartridges
  • Ampoules and Blow-Fill-Seal Containers
  • Large Volume Parenteral and Infusion Bags
  • Sterile Ophthalmic and Otic Preparations

By End-Use Industry

  • Biologics and Monoclonal Antibodies
  • Vaccines and Immunobiologicals
  • Small Molecule Injectables and Generics
  • Cell and Gene Therapy Products
  • Ophthalmic and Specialty Parenterals

By Commercial Dimension

  • Dedicated Contract Manufacturing Supply
  • Captive and Integrated Manufacturer Capacity
  • Clinical and Development Scale Supply
  • Capacity Reservation and Take-or-Pay Agreements

By Region

  • North America
  • Western Europe
  • East Asia
  • South Asia and Pacific
  • Latin America
  • Middle East and Africa
  • Eastern Europe

Scope, Methodology, and Coverage

Every figure in this report is reproducible from documented input assumptions. The scope below maps the historical period, the forecast horizon, the segmentation dimensions, and the countries covered, alongside the underlying primary and qualitative methodology.
Historical Period
2020 to 2025
Forecast Period
2026 to 2036
Base Year
2025 (USD billions; MMA Primary Research Dataset, August 2026)
Market Definition
The market covers manufacturing of sterile pharmaceutical dosage forms, spanning liquid vial filling, lyophilised vial filling, prefilled syringes and autoinjector cartridges, ampoules and blow-fill-seal containers, large volume parenteral and infusion bags, and sterile ophthalmic and otic preparations, together with the associated technical transfer, validation and release testing services. Non-sterile oral solid and liquid dosage manufacture, active pharmaceutical ingredient synthesis, drug substance bioprocessing upstream of fill-finish, primary packaging component manufacture, secondary packaging and serialisation, and cold chain distribution are excluded. Sizing is measured at manufacturer revenue in current prices.
Quantitative Units
USD billions (current prices); filled units, qualified line counts and capacity utilisation where applicable
Segmentation Dimensions
By Container and Presentation Format; By End-Use Industry; By Commercial Dimension; By Region
Regions Covered
North America, Western Europe, East Asia, South Asia and Pacific, Latin America, Middle East and Africa, Eastern Europe
Countries Covered
USA, China, Germany, India, Switzerland, Ireland, Italy, Japan, South Korea, France, UK, Canada, Belgium, Netherlands, Spain, Sweden, Denmark, Brazil, Mexico, Argentina, Singapore, Australia, Indonesia, Turkey, Israel, Saudi Arabia, UAE, South Africa, Poland, Hungary, and additional markets relevant to this sector
Key Companies Profiled
Catalent, Fresenius Kabi, Baxter International, Recipharm, Siegfried Holding, Lonza Group, Samsung Biologics, WuXi Biologics, Vetter Pharma, Aenova Group, Jubilant Pharmova, Piramal Pharma Solutions, Gland Pharma, Hikma Pharmaceuticals, Grifols, Thermo Fisher Scientific, SK pharmteco, Curia Global, NextPharma, Emergent BioSolutions
Quantitative Methodology
Primary survey, n=3,800 respondents, Q4 2025, six countries; demand-side model with trade association cross-validation
Qualitative Methodology
47 expert interviews, Q4 2025; applied to validate demand model assumptions, identify emerging dynamics, and assess competitive positioning
Report Format
PDF and XLSX data workbook (Word format preview document)
Publisher
Market Minds Advisory
Report Code
MMA-2026-HLT-920
Published
August 2026
Contact
sales@marketmindsadvisory.com | www.marketmindsadvisory.com

Purchase the full Sterile Dosage Form Market Report (2026 to 2036).

The full report sizes sterile dosage form manufacturing across six presentation formats, three commercial dimensions and seven regions, with annual forecasts to 2036 under base, bull and bear scenarios. Qualified capacity is measured by container format and closure system rather than by nominal filling capability, which is the distinction that determines whether a sponsor can be served at all. Line qualification timelines and capital costs are compared across isolator and barrier technologies. Inspection outcomes are tracked by operator and jurisdiction. Twenty manufacturers are profiled on a consistent sterile fill-finish revenue basis.
Qualified capacity measured by container format and closure system
Line qualification timelines compared across isolator and barrier technologies
Inspection outcomes tracked by operator and regulatory jurisdiction
Primary container component supply concentration assessed by presentation
Take-or-pay reservation structures compared across contract agreements
Lyophilisation line time consumption quantified against liquid filling

Built For The People Who Decide

From boardroom strategy to bench-side execution, this report is read cover-to-cover by leaders shaping the next decade of their industry, turning demand scenarios, market dynamics and valuation benchmarks into decisions.
CXOs/ Presidents/ VPs/ Managers
M&A and Corporate Development
Strategy Teams and R&D Heads
Procurement and Product Directors
Regulatory and Compliance Leaders
Investor Relations and Equity Analysts