Market Minds Advisory
Steam Turbine Service Market

Steam Turbine Service Market: Steam Turbine Service Market: Cycling Duty, Life Extension and the Aftermarket Contest, 2026 to 2036

Coal and combined cycle plant now cycles daily instead of running baseload, consuming maintenance intervals several times faster than design assumed and turning a shrinking equipment base into a growing service requirement.

Lead Analyst

Published

September 2026

Make Smarter Decisions with Customized Research Insights

Request a free sample report and evaluate market opportunities, growth trends, and competitive dynamics relevant to your business needs.

2025 MARKET VALUE$19.5BMarket Size 2025
2036 FORECAST VALUE$35.5BBase Case , 2026 to 2036
CAGR 2026 TO 20365.6 %Bull 6.8% / Bear 4.4%
INCREMENTAL OPPORTUNITY$14.9BNet 10- year value creation
EXPANSION MULTIPLE1.72x2036 value over 2026 base
Strategic Levers
M&A Pipeline
Regional Outlook
Country Rankings
Competitive Intelligence
Segmental Deep-dive
Call-Us : 91 93563 13602

Executive Snapshot and Market Trajectory.

Service demand here does not follow installed capacity. It follows operating hours and start counts, and those two things have diverged violently as thermal plant shifted from baseload running to daily cycling behind renewable output. A shrinking fleet can generate rising service revenue. Fleet size tells you nothing here.
Each start charges roughly 25 equivalent operating hours against a maintenance interval of about 50,000, so a unit starting daily reaches its next major overhaul in a fraction of the calendar time its designers assumed. Performance upgrades and retrofits grow at 8.4%, half again the market rate of 5.6%, because a retrofit is now the cheapest way to make an old machine tolerate duty it was never built for. Nobody designed these machines for this.
Five providers hold 47% of measured service revenue, which is low for an aftermarket, and independents already perform 34% of the work. That contest sharpens as units age past original warranty and design patents lapse. Nuclear life extension and uprate programmes carry the largest individual tickets, and forging lead times near 30 months govern when any of it can actually happen. Material access, not engineering skill, sets the pace of work.
Market Definition
The steam turbine service market covers maintenance, inspection, overhaul, component repair, parts supply, performance retrofits and condition monitoring performed on installed steam turbine plant of 1 MW and above across coal, gas combined cycle, nuclear, biomass, waste-to-energy, geothermal and industrial cogeneration applications. Scope covers work by original equipment manufacturers, independent service providers and utility in-house shops. New steam turbine equipment sales, generator and boiler service, balance of plant work, and fuel or operations contracts are excluded.
Base Year Value
$19.5B in 2025 (MMA Primary Research Dataset, September 2026)
Forecast Period
2026 to 2036, eleven discrete annual values
CAGR
5.6% base case. Bull 6.8%. Bear 4.4%.
Fastest Growth Segment
Performance Upgrades and Retrofits: 8.4% CAGR
Fastest Growth Country
India: 8.4% CAGR
Fastest Growth Region
South Asia and Pacific: 7.8% CAGR
Largest Region
East Asia: 34% of 2025 global value
Market Leaders
GE Vernova, Siemens Energy, Mitsubishi Power, Doosan Enerbility, Toshiba Energy Systems and Solutions. Source: MMA Analysis based on company annual reports and disclosed service segment revenue.
Primary Survey
n=3,800 procurement and R&D decision-makers, Q4 2025, six countries
Methodology
Demand-side build-up, cross-validated against public data, 47 expert interviews

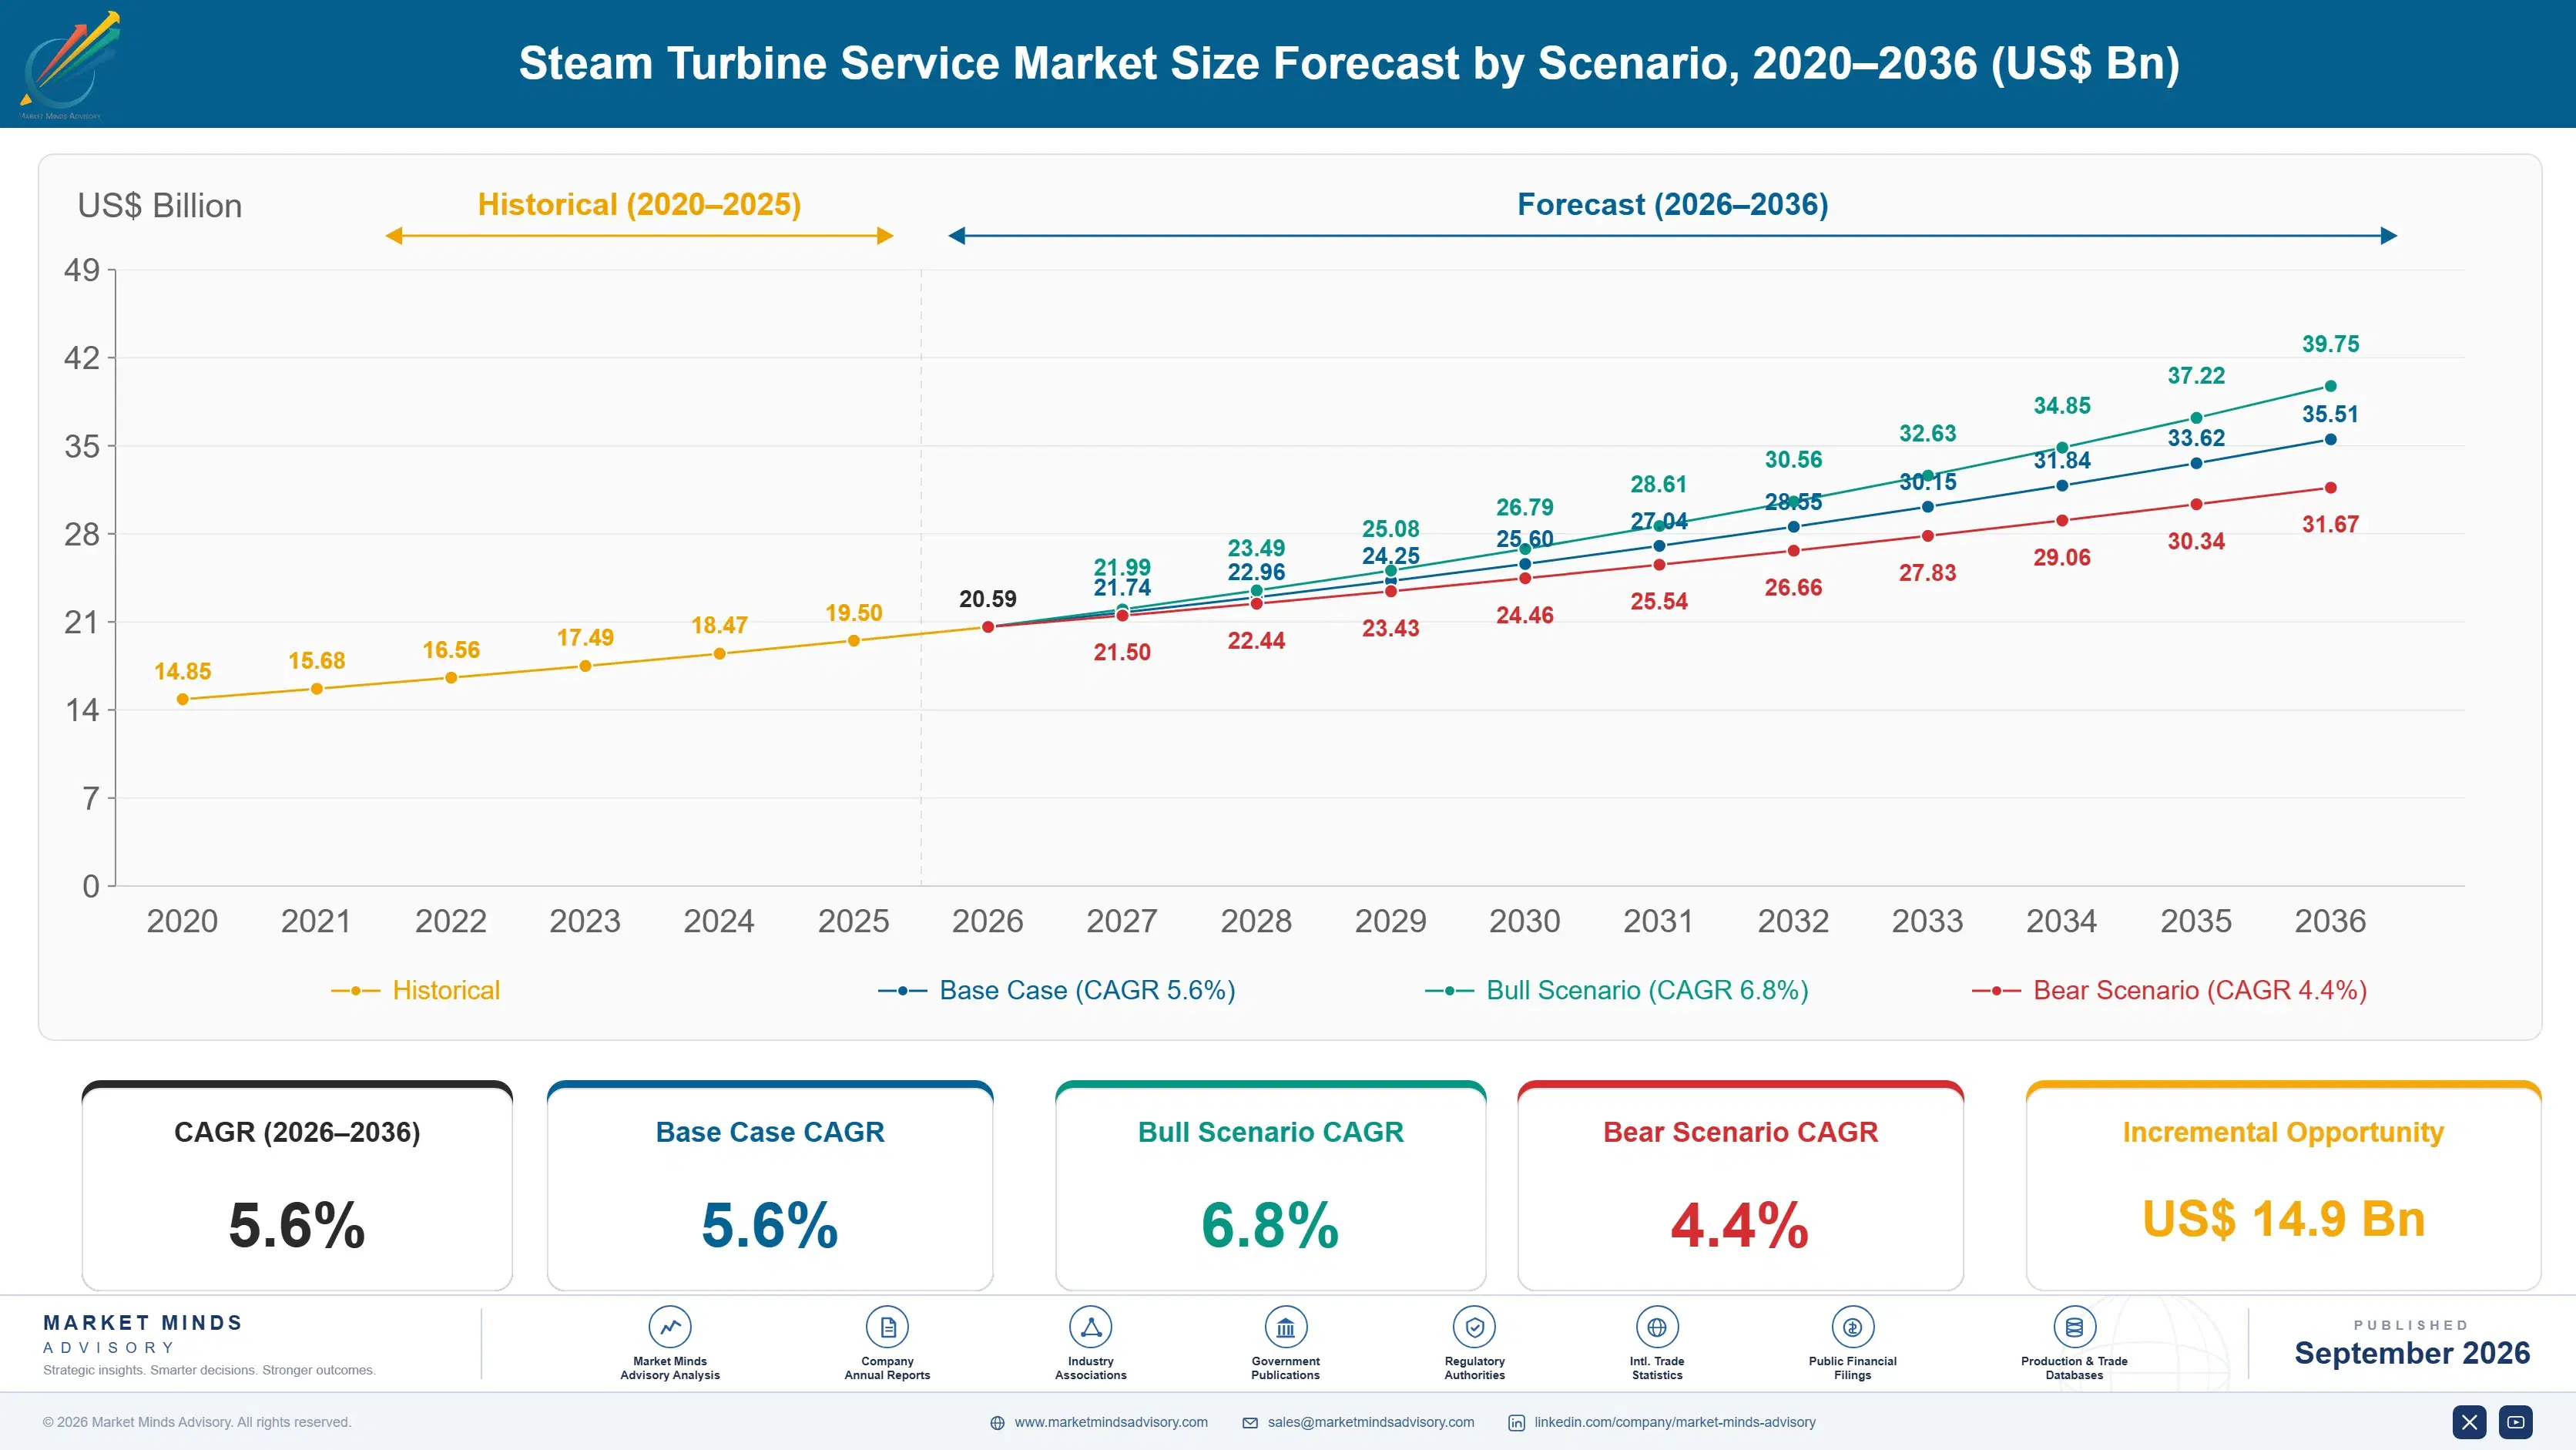
Steam Turbine Service Market Forecast Scenarios

steam-turbine-service-market-size-forecast-scenario-1788412448562
Between 2020 and 2025 the market compounded at 4.4%, held back by pandemic outage deferrals and by coal retirements removing serviceable units from Western fleets faster than anyone had modelled. Underneath that, cycling damage was accumulating quietly on the units that stayed. Several operators discovered mid-decade that machines they intended to run another ten years needed rotor work nobody had budgeted for at all.
The 5.6% base case rests on three mechanisms. Retirement dates keep slipping as system operators find they cannot replace firm capacity fast enough, which converts end-of-life units into life-extension candidates requiring substantial work. Cycling duty consumes maintenance intervals at multiples of the baseload rate, pulling overhauls forward across the fleet. And nuclear uprate and life extension programmes carry rotor and blade path replacements worth tens of millions per unit, on schedules already committed through the decade.
The bull case is accelerated nuclear life extension across the United States, France, Japan and Korea, which would add high-value turbine island work on a defined schedule. The bear case is coal retirements resuming at the pace assumed before recent capacity concerns, which would strip serviceable units out of the base faster than cycling intensity can compensate for them.

Why A Shrinking Fleet Buys More Service Every Year

A steam turbine is maintained against equivalent operating hours rather than calendar time, and a start counts for far more than an hour of steady running. Thermal transients through a thick rotor create stress concentrations that steady operation never produces. Charging roughly 25 hours per start against a 50,000 hour interval brings a daily-cycling machine to major overhaul in around five years rather than twenty.
TOP FIVE CONCENTRATION47%Share of measured service revenue held by leading providers
MAJOR OVERHAUL INTERVAL50,000 hoursTypical equivalent operating hours between scheduled major inspections
INDEPENDENT PROVIDER SHARE34%Portion of work performed by non-original equipment providers
ROTOR FORGING LEAD TIME30 monthsQuoted delivery for a large replacement rotor forging
AFTERMARKET MARGIN MULTIPLE3.1xService margin against new equipment margin for identical manufacturers
CYCLING START PENALTY25 hoursEquivalent operating hours charged against the maintenance interval per start
That single mechanism has changed the shape of this business completely. Fleets are smaller than a decade ago and service demand is larger, because the units that remain work in a way nobody designed them for. Operators who planned maintenance budgets on calendar assumptions have been repeatedly surprised. The units doing the most cycling are frequently the oldest, since newer combined cycle plant holds better economics at baseload.
The commercial contest is between original manufacturers and independents. Manufacturers earn most of their power segment margin in the aftermarket, at roughly three times new equipment margin, and defend it through parts, engineering data and long-term agreements. Independents win where machines are old enough that design protection has lapsed and where an operator resents paying manufacturer parts pricing on a plant scheduled to close.
"The counterintuitive part is that closing coal plants has been good for this market rather than bad for it. Announcing a retirement date changes how a unit is run, pushes it into cycling duty, and the damage that follows costs more than a decade of ordinary baseload maintenance would have."
Director, Rotating Equipment and Power Services Practice · MMA Energy and Power Practice · September 2026

Market Trends

Cycling Duty Rewrites Every Maintenance Interval Assumption

Thermal plant designed for continuous running now starts and stops daily to follow renewable output, and the damage mechanism is entirely different from wear. Differential expansion through a thick rotor during a start creates stress at the same locations every time, and cracking appears at hour counts that steady operation would never reach. Charging around 25 equivalent operating hours per start against a 50,000 hour interval compresses the overhaul cycle from decades to a handful of years. Operators have had to rebuild maintenance planning around start counters rather than calendars, and several discovered the problem only after finding cracks.
Market Impact: Adds 10 operating years per unit
Independent Providers Take Work As Design Protection Lapses

Original manufacturers hold the aftermarket through parts, engineering drawings and long-term agreements, but a turbine designed in the 1980s carries no live patent protection and its geometry has been reverse engineered many times over. Independents already perform 34% of service work and win most readily on older units and on plant with a known closure date, where an operator has no interest in manufacturer pricing. Manufacturers defend by bundling monitoring, engineering support and outage management that independents cannot easily assemble. The contest is fiercest on coal units nobody expects to run past 2035.
Market Impact: Recovers 4% plant output

Market Opportunities and Growth Drivers

Slipping Retirement Dates Convert Closure Into Life Extension

System operators across several markets have found they cannot replace firm dispatchable capacity at the pace assumed, and retirement dates have moved repeatedly as a result. A unit granted another decade needs work that a unit closing in two years does not: rotor inspection, blade path renewal, control system replacement and often a full performance retrofit. The commercial character changes completely, from minimum spend to justified investment. Operators are making these decisions late, which compresses engineering and outage scheduling into windows shorter than the work really needs. Late decisions are the norm here.
Market Impact: Delays work by 30 months

Nuclear Uprate Programmes Carry The Largest Single Tickets

A nuclear turbine island retrofit replacing low pressure rotors and blade paths recovers several percent of plant output without touching the reactor, which is the cheapest megawatt available to any operator holding an existing licence. Programmes in the United States, France, Japan and Korea are committed through the decade on schedules driven by refuelling outages rather than by commercial timing. Individual awards run to tens of millions of dollars and require forging capacity booked years in advance. Qualification for nuclear work is a barrier few providers can clear. Few providers ever clear it.
Market Impact: Limits 6 concurrent outages

Market Restraints and Challenges

Forging Capacity Governs When Major Work Can Happen

A replacement rotor or a large casting comes from a handful of forge masters worldwide, and quoted lead times near 30 months mean the metal decides the outage date rather than the operator. The root cause is that heavy forging capacity contracted through the years when new steam plant orders collapsed, and nobody rebuilt it for an aftermarket. Emergency failures therefore have no fast remedy at all. Providers mitigate by holding strategic rotor stock for common frames, by qualifying weld repair as an alternative to replacement, and by pooling spares across operators running identical machines.
Market Impact: Charges 25 hours per start

Skilled Field Service Labour Is Genuinely Scarce

A major steam turbine overhaul needs experienced field engineers who can judge clearances, interpret blade damage and make decisions on an open machine at three in the morning. That skill takes a decade to build and the workforce that built it is retiring, while the industry spent fifteen years telling recruits thermal power had no future. Labour now represents a rising share of overhaul cost and constrains how many outages a provider can run concurrently. Mitigation runs through apprenticeship programmes, remote expert support to less experienced crews, and digital work instruction that captures judgement previously held only in people's heads.
Market Impact: Independents hold 34% share
4 additional market trends, 3 additional growth drivers, and 2 additional restraints and challenges are covered in the full report. Contact sales@marketmindsadvisory.com to access the complete intelligence.

Segment CAGR and Growth Architecture

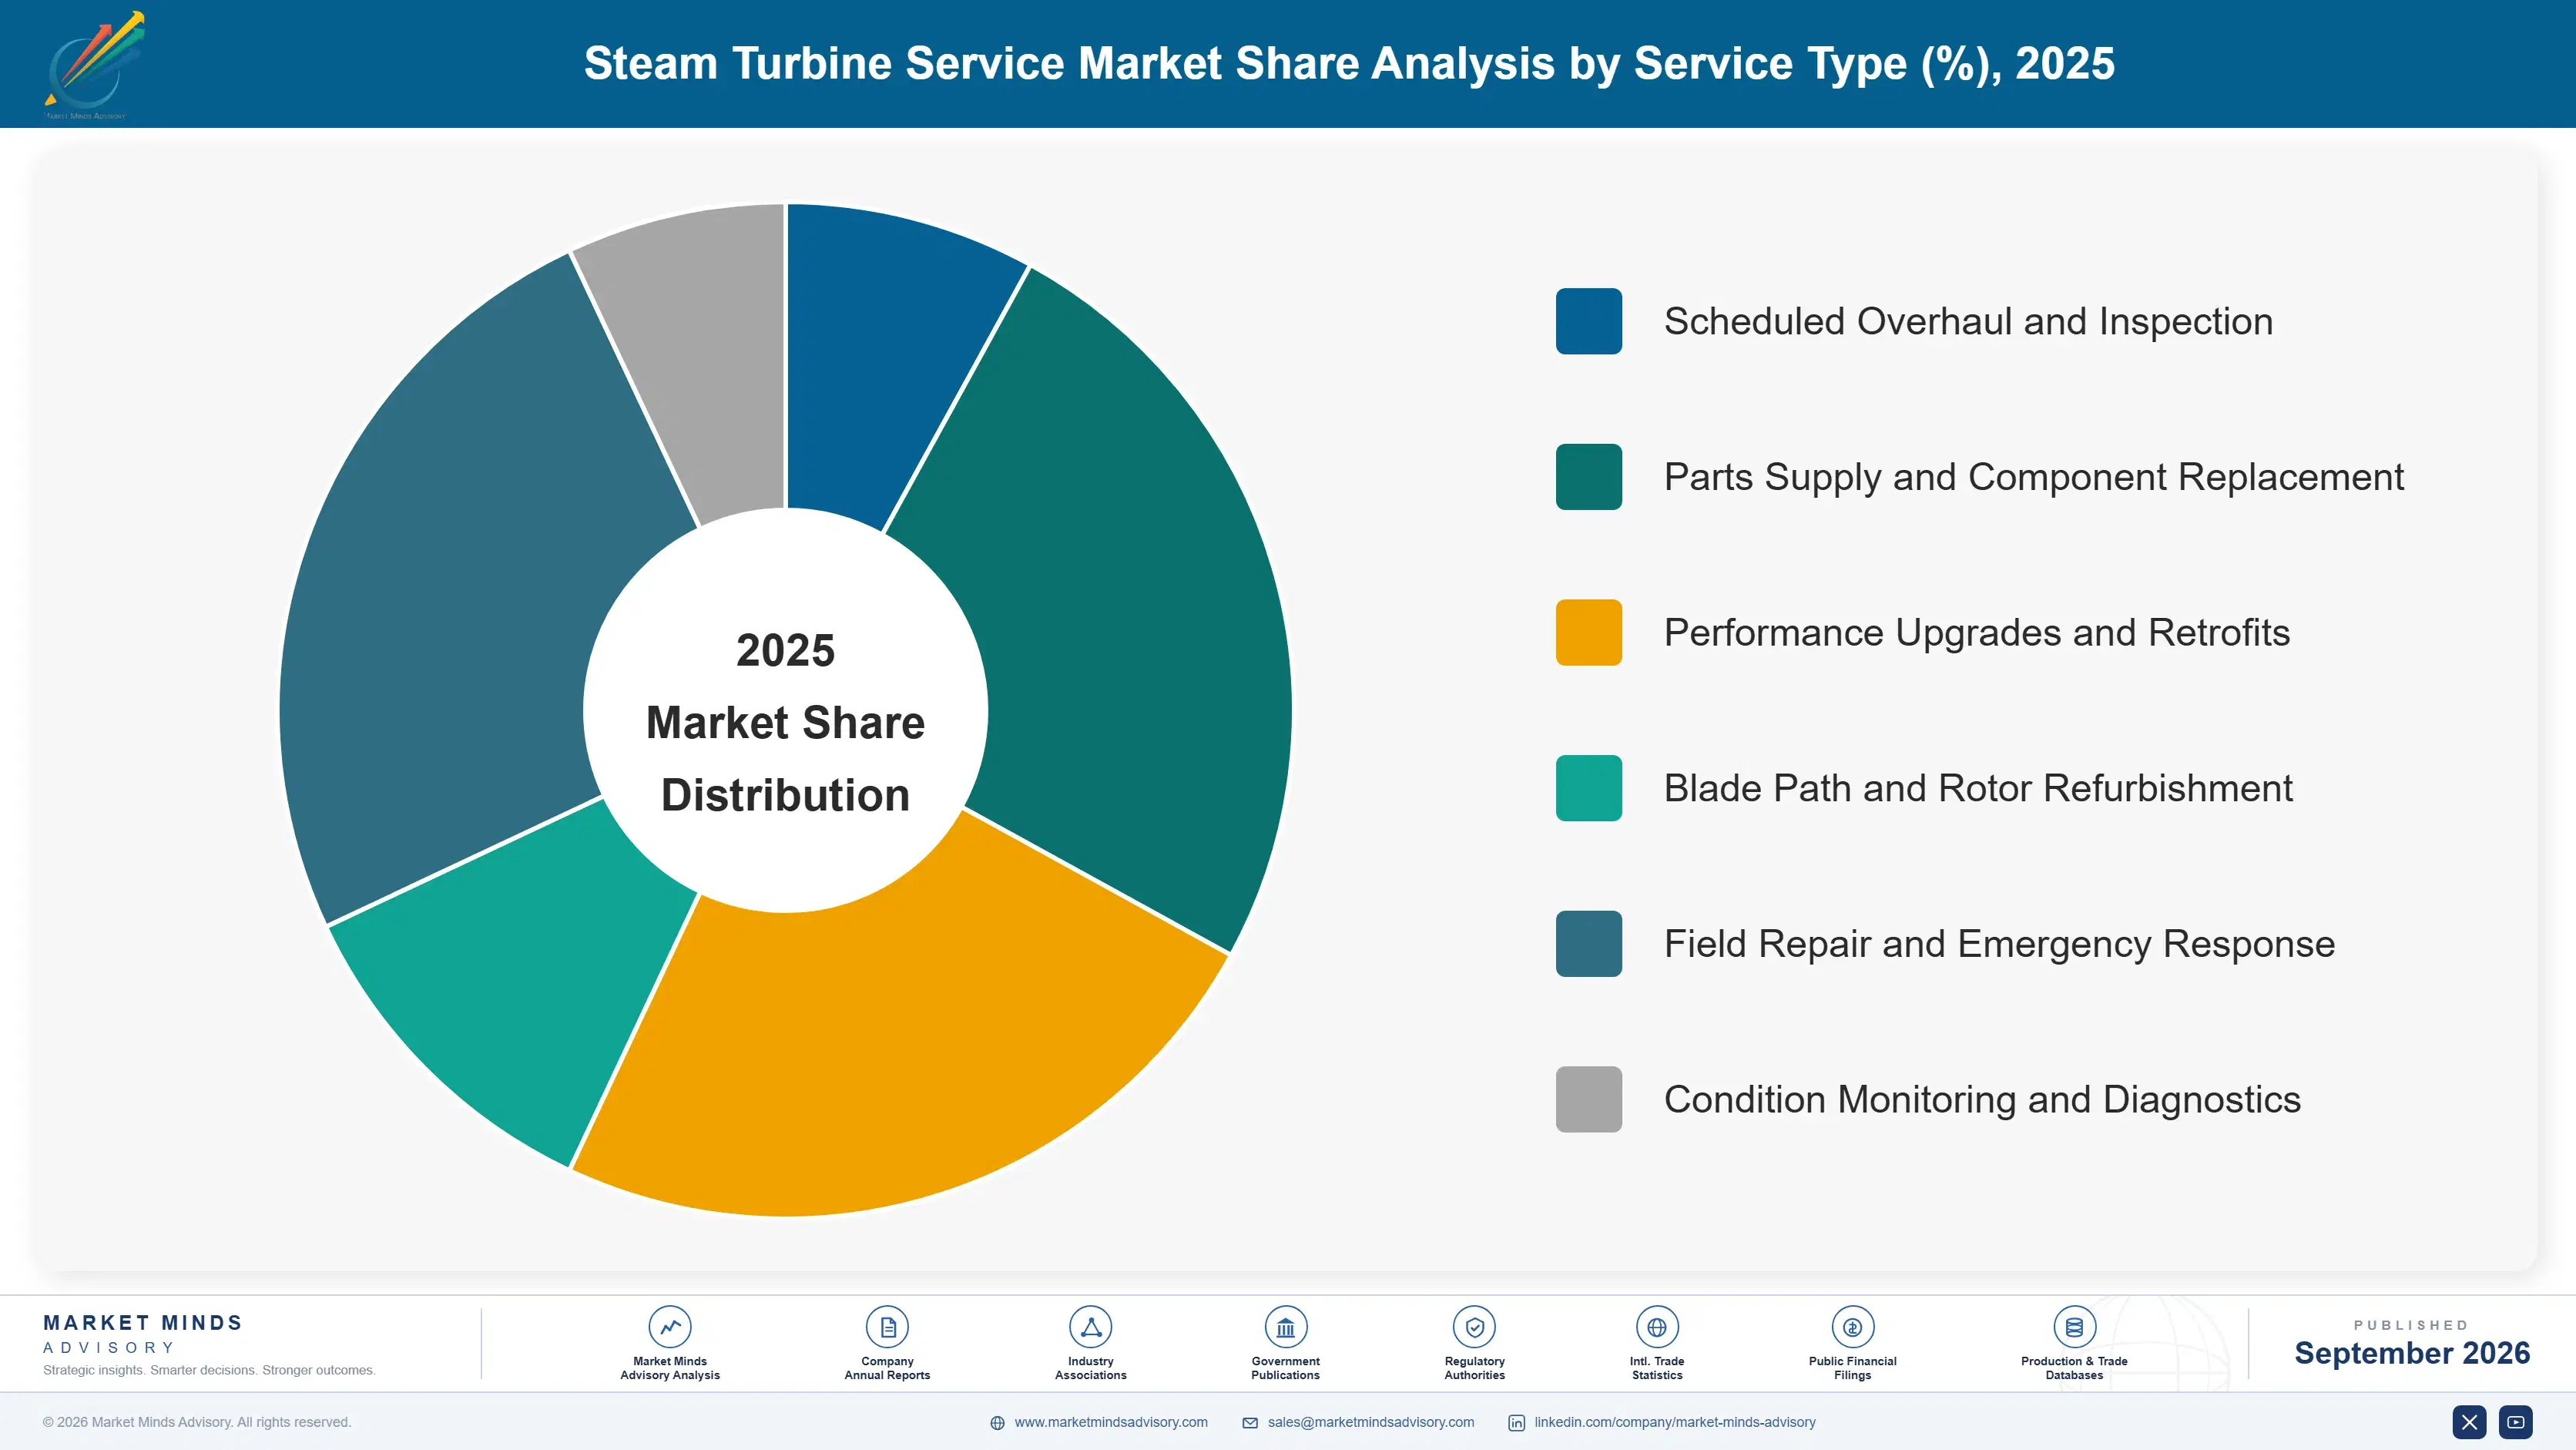
Segmentation follows the type of service work performed, which is how providers organise capability and how operators budget. Scheduled overhaul, parts supply, performance retrofit, blade path and rotor refurbishment, emergency field repair and condition monitoring each carry different margin, different skill requirements and entirely different competitive dynamics between manufacturers and independents. Each rewards a different kind of provider.
steam-turbine-service-market-market-share-analysis-1788412449097

Performance Upgrades and Retrofits

A retrofit replaces blade paths, steam path seals or control systems on an existing machine to recover efficiency, add output or make the unit tolerate cycling duty it was never designed for. Demand comes directly from slipping retirement dates: an operator granted another decade will invest where one closing in two years will not. Nuclear low pressure rotor replacement sits at the top end, recovering around 4% of plant output for a ticket in the tens of millions. Growth at 8.4% is half again the market rate of 5.6%. Engineering content is high, which favours original manufacturers and the small number of independents holding genuine design capability. Timing decides everything on this work.
CAGR 8.4%

Condition Monitoring and Diagnostics

Continuous vibration, thermal and steam path monitoring has moved outage planning from calendar intervals to condition assessment, which lets operators defer unnecessary work and catch developing damage before it becomes a forced outage. On a unit earning capacity payments, a single avoided outage week pays for years of monitoring. Original manufacturers hold an advantage that is genuinely hard to attack, because their diagnostic models are trained on fleet-wide failure data no independent can assemble. Growth at 7.8% reflects adoption becoming standard above 200 MW and beginning to spread into industrial cogeneration units, where the economics are thinner but forced outages equally disruptive. Independents increasingly resell third-party monitoring platforms to close the gap.
CAGR 7.8%
Full segment breakdown across 6 segments available in the complete report.

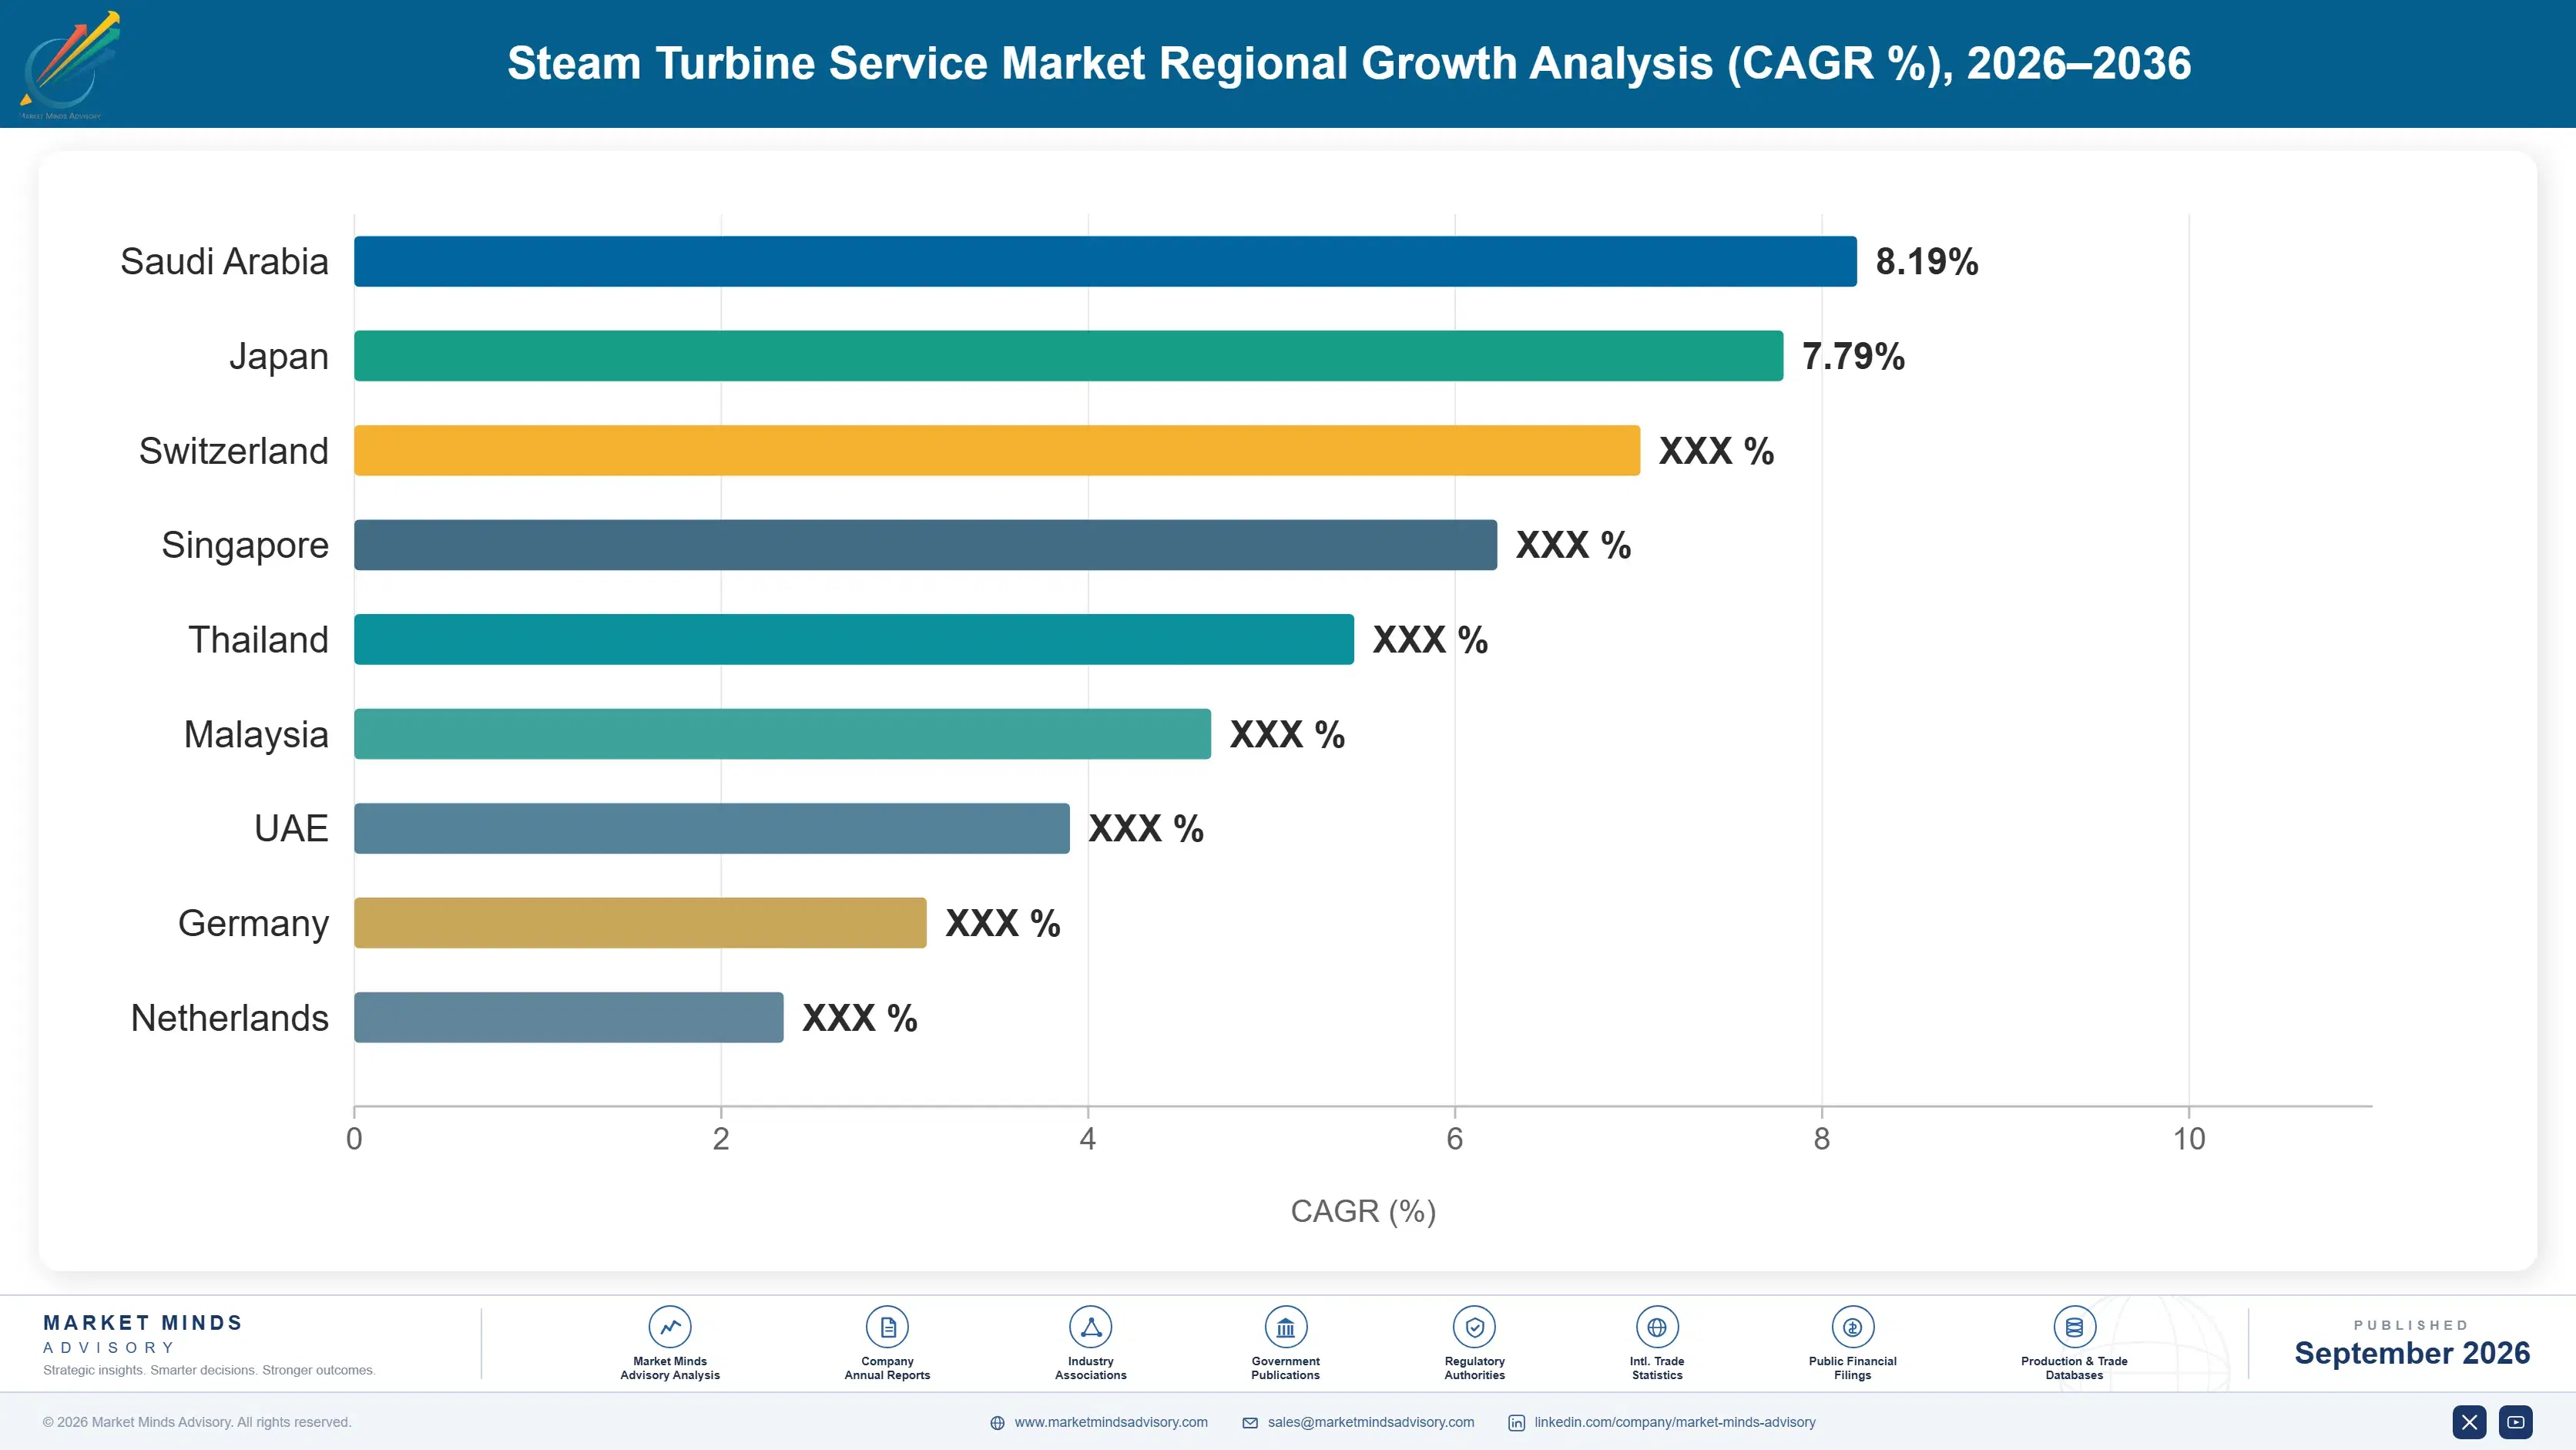
Regional Architecture and Country Demand Map

Service demand tracks the installed steam turbine base and how hard it is worked, not electricity consumption or new build. East Asia and South Asia together hold half the market because that is where the coal fleet was built and where it is now ageing.

East Asia

China's coal fleet is the largest concentration of steam turbine capacity anywhere, and East Asia at 34% sits above the 30% ceiling of the standard band for exactly that reason. Units built through the 2005 to 2015 expansion are reaching major overhaul intervals in large numbers at once, and many are now cycling to accommodate renewable output, which pulls those intervals forward. Domestic manufacturers hold most of the work at pricing well below Western levels. Japan and Korea contribute high-value nuclear turbine island work on committed refuelling schedules, which is a different business entirely and carries far better margin. Regional pricing sits far below Western levels on ordinary work. That gap is closing slowly.
Share: 34% | CAGR: 6.4% (2026 to 2036)

North America

At 20% the region sits just below the standard band, and the reason is that coal retirements removed serviceable units faster than combined cycle additions replaced the service ticket, since a combined cycle steam turbine is smaller and simpler than the coal unit it displaced. What remains is high value. Nuclear life extension and uprate work carries the largest individual awards anywhere, and independents compete hard on ageing fossil units where operators resent manufacturer parts pricing. Capacity market concerns have already pushed several announced retirement dates back by years. Independent shops here are the most commercially aggressive anywhere, and several have built engineering capability that genuinely rivals the manufacturers on older frames.
Share: 20% | CAGR: 4.6% (2026 to 2036)
Regional intelligence for 5 additional markets available in the complete report: Western Europe, South Asia and Pacific, Latin America, Middle East and Africa, Eastern Europe. Contact sales@marketmindsadvisory.com.
steam-turbine-service-market-country-cagr-analysis-1788412449622

Where Aftermarket Margin Actually Holds

Four positions carry disproportionate margin in a service market where the equipment base is shrinking and independents are advancing. Each rests on capability, data or material access accumulated over years, which is why aftermarket positions erode slowly and are correspondingly difficult to rebuild once genuinely lost. Two of the four require committed capital rather than skill.

Sell Life Extension Against Slipping Retirement Dates

An operator granted another decade on a unit becomes a completely different customer from one closing in two years, moving from minimum spend to justified capital investment on rotors, blade paths and controls. The commercial skill is identifying which units will have their dates moved before the operator formally decides, which capacity market signals and interconnection queues make readable roughly 18 months ahead. Providers who wait for the tender arrive against an outage window already too short. Most sales organisations still track announced closure dates rather than the pressures moving them.
Market Impact: Wins the work 18 months before any tender

Hold Strategic Rotor Stock For Common Frames

Forging lead times near 30 months mean an emergency rotor failure has no fast remedy, and an operator facing that is not negotiating on price. A provider holding stock for the most common frames converts a 30 month problem into a weeks-long one and prices accordingly. It requires working capital committed against an event that may not occur, which is why almost nobody does it and why the few who do earn heavily when it does. Frame selection matters more than stock volume. Frame selection matters far more than the volume of stock held.
Market Impact: Converts a 30 month wait into a few weeks

Defend Monitoring Data As Competitive Property

Diagnostic models trained on fleet-wide failure history let an original manufacturer tell an operator what will fail and when, which no independent can replicate without the underlying data. That capability defends the whole aftermarket position, not merely the monitoring contract, because it justifies the outage scope. Providers who sold monitoring as a standalone product priced it at a fraction of what it protects. On a unit earning capacity payments, avoiding around 7 outage days a year pays for the service many times over. Selling it as a defence rather than a product changes the pricing entirely.
Market Impact: Protects roughly 7 avoided outage days every year

Qualify For Nuclear Turbine Island Work

Nuclear low pressure rotor and blade path replacement carries individual awards in the tens of millions and recovers around 4% of plant output without touching the reactor. Qualification involves quality systems, documentation and regulator acceptance that take years and exclude most providers outright. Schedules follow refuelling outages committed through the decade, so the revenue is unusually visible. The barrier that makes it hard to enter is exactly what makes the position worth holding once qualification is genuinely complete. Refuelling schedules make the revenue unusually visible years ahead, which suits capacity planning better than almost anything else in this market.
Market Impact: Recovers about 4% of plant output per unit

Who Controls the Margin Pool

Measured on disclosed service revenue, the basis used throughout this section, the top five hold 47%. That is unusually low for an aftermarket, reflecting a fleet old enough that design protection has lapsed on much of it. The gap between manufacturers and independents is not machining capability. It is engineering data, fleet failure history and the ability to guarantee an outage outcome rather than a scope of work.
Competition currently runs on outage duration, parts availability and willingness to guarantee performance after the work. Long-term agreements remain the manufacturers' principal defence, bundling monitoring, engineering support and parts into a contract independents cannot assemble piece by piece. Chinese and Indian providers dominate their domestic fleets at pricing Western providers do not attempt to match. Utility in-house shops still perform substantial work on older fossil units.

Pressure builds from two directions. Independents are moving up from parts and field repair into engineered retrofits, which is where manufacturer margin actually sits. And forging access is becoming a genuine differentiator as lead times stretch, favouring providers with allocation or stock over those with better engineering. Rankings shift where a provider secured material access and nuclear qualification rather than simply competing on outage price.
steam-turbine-service-market-company-positioning-matrix-1788412450141

Competitive Moat and Risk Dimensions

GE VERNOVA

Moat: Largest installed fleet base

The company services the largest installed steam turbine population in the world, including machines originally built by several acquired manufacturers, which gives it failure history across frames no competitor can assemble. That data drives diagnostic accuracy and outage scoping directly. It also holds nuclear qualification and forging relationships that took decades to establish and would take a competitor equally long.
GE VERNOVA

Risk: Fossil base declining permanently

A substantial part of that installed fleet is coal plant with a finite remaining life, and every closure permanently removes revenue no commercial effort recovers. Independents compete hardest on exactly those ageing units, where operators are least willing to pay manufacturer parts pricing. The position is strong today and shrinking quietly, which makes nuclear and industrial work disproportionately important.
SIEMENS ENERGY

Moat: Bundled long-term service agreements

Service agreements sold alongside gas turbine and grid packages cover the steam turbine in combined cycle plant as part of a wider commitment, which keeps independents out for the contract duration. The agreements carry performance guarantees that shift outcome risk from operator to provider, which few independents can underwrite. Renewal rates are high because switching mid-life is disruptive.
SIEMENS ENERGY

Risk: Exposure to combined cycle cycling

The combined cycle fleet the company services is cycling far harder than the agreements originally assumed, and where contracts carry fixed pricing against hours rather than starts, the provider absorbs damage it did not price for. Renegotiating mid-term is awkward with customers who also buy new equipment. Several agreements written before renewable penetration reached today's levels are underwater.

Players Tracked

Prominent Players

GE Vernova
Siemens Energy
Mitsubishi Power
Doosan Enerbility
Toshiba Energy Systems and Solutions

Other Key Players

Shanghai Electric
Dongfang Electric
Harbin Electric
Bharat Heavy Electricals
Ansaldo Energia
Sulzer
EthosEnergy
Mechanical Dynamics and Analysis
Elliott Group
Fuji Electric
Kawasaki Heavy Industries
Triveni Turbine
Shin Nippon Machinery
Turbine Generator Maintenance
Wood Group

Recent Developments

MAY 2025

GE Vernova expands United States power services capacity

The company announced organic investment across its American service facilities, adding machining, repair and testing capability rather than acquiring existing capacity. The stated rationale was extended plant life and rising outage volume across the installed fossil and nuclear fleet through the remainder of the decade.
Signal: Providers are now investing against life extension rather than against any expectation of new equipment orders.
FEBRUARY 2025

Siemens Energy reports record service backlog in power segments

Reported results showed service backlog across gas and power businesses at record levels, with management attributing it to extended asset lives and heavier operating duty across customer fleets. Outage scheduling capacity rather than commercial demand was described as the practical constraint on conversion. Backlog conversion has slowed accordingly.
Signal: Backlog is now limited by how many outages a provider can physically staff rather than by demand.
OCTOBER 2024

United States utility awards nuclear low pressure rotor replacement

A utility awarded a turbine island retrofit covering low pressure rotor and blade path replacement as part of an uprate programme, an award decision rather than any joint venture or acquisition. Output recovery was cited as the justification, with the work scheduled around committed refuelling outage windows.
Signal: Turbine island work remains the cheapest megawatt available to any operator already holding a nuclear licence.

Skilled Labour, Forgings And Alloys

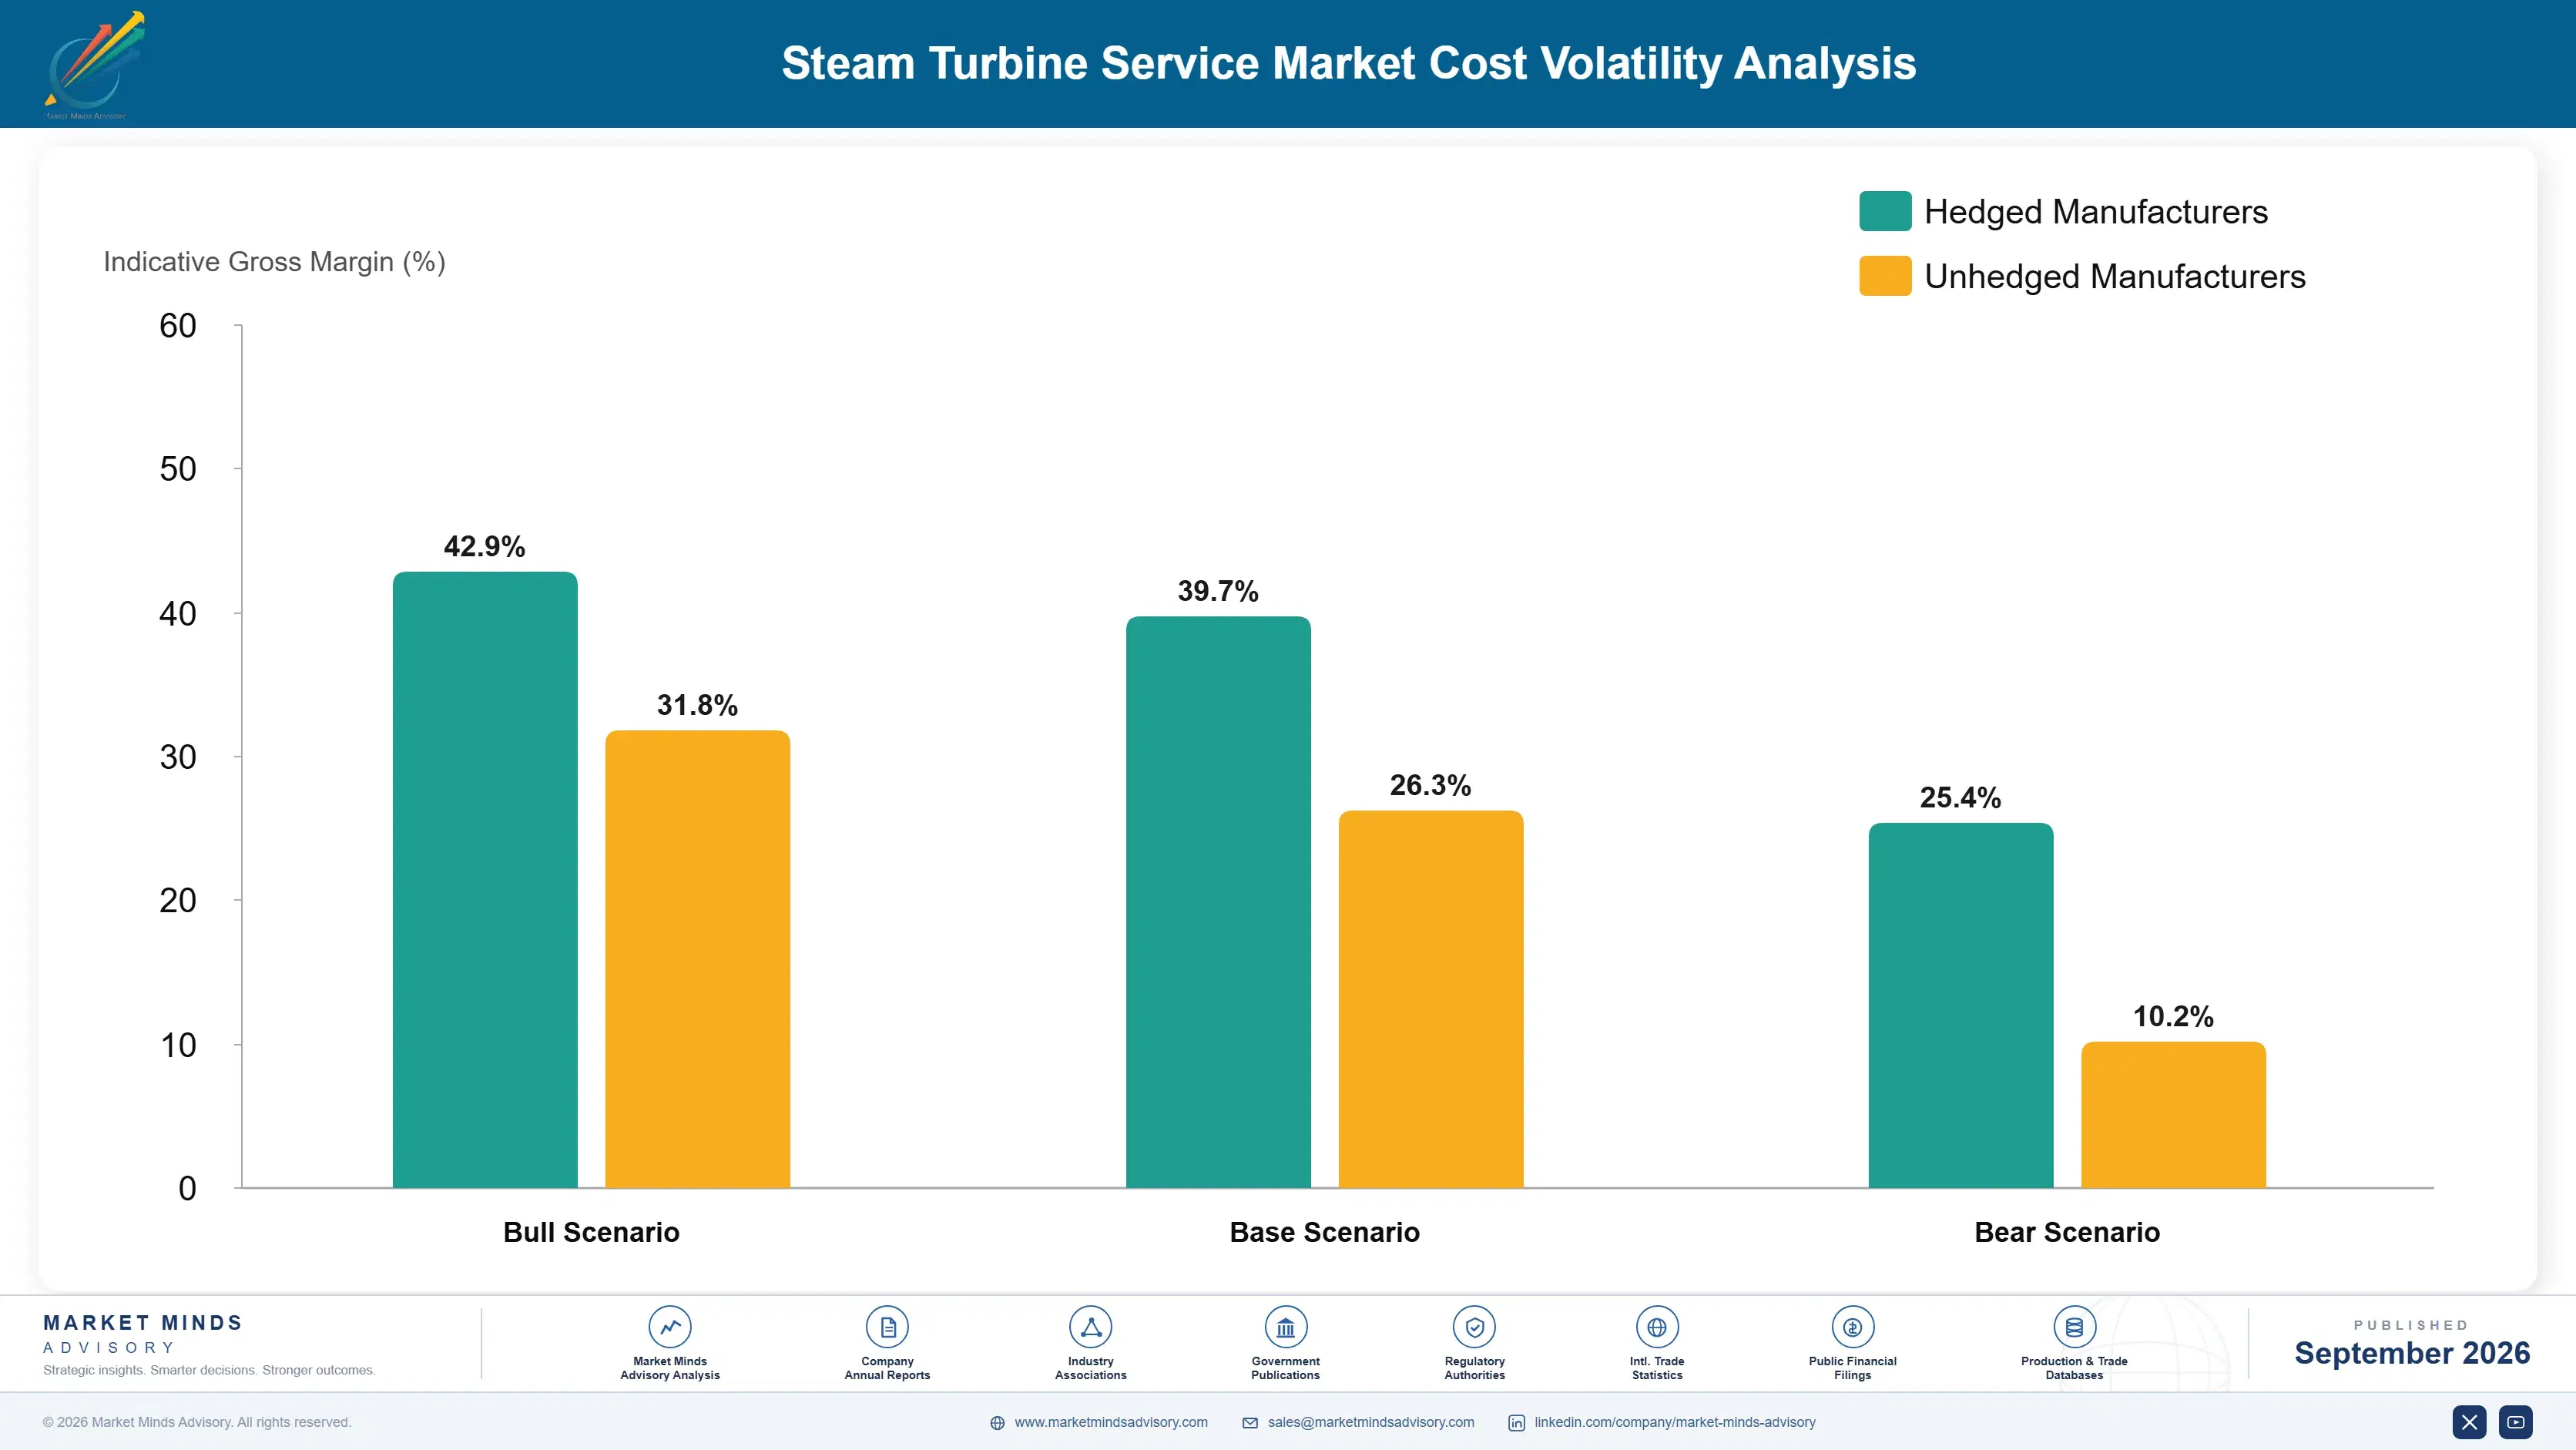
Field service labour accounts for roughly 38% of overhaul cost, forgings and castings around 22%, alloy blading material near 14%, and shop capacity the balance. The heavy forgings come from a handful of forge masters in Japan, Korea, Germany and China, while high chromium blading steels and nickel alloys depend on supply that USGS commodity reporting tracks as concentrated in very few producing countries.
Nickel moved violently through the 2022 period, with the London metal exchange suspending trading after an unprecedented price spike, and chromium supply tightened alongside it. Providers holding fixed-price long-term service agreements absorbed material cost they had no mechanism to recover, and several disclosed margin pressure in annual reports covering that window. Forging pricing rose separately as capacity that contracted during the collapse in new build never expanded back.

The disadvantage mechanism is contract structure combined with scale of material access. A provider with forging allocation and index-linked agreements passes movement through; one holding fixed-price contracts written years earlier absorbs it entirely. Independents buying forgings on the open market face worse pricing and longer queues than manufacturers with standing relationships. Labour cost varies enormously by geography, which is why Chinese and Indian providers hold their domestic fleets.
steam-turbine-service-market-cost-volatility-analysis-1788412450337

Index-linked long-term service agreement pricing

Tying agreement pricing to published nickel, chromium and labour indices moves material movement back to the operator, who is generally better placed to carry it than the provider. Customers accept it increasingly because the risk premium built into a fixed multi-year price is visibly worse for them than the index itself. Most operators now expect it.

Standing forging allocation with heavy forge masters

Committing volume to a forge master across several years secures queue position during shortage and dampens pricing movement considerably. It commits capital against uncertain demand, but given that lead times run near 30 months and emergency work has no alternative source at all, the flexibility being surrendered is largely theoretical anyway. Queue position is what is really bought.

Qualified weld repair as replacement alternative

Developing and qualifying weld repair procedures for rotors and casings avoids the forging queue entirely on damage that would otherwise require replacement, which changes both cost and outage duration materially. It requires metallurgical capability and regulator acceptance that take years to build, and it reduces exposure to forging pricing permanently. Outage duration falls as much as cost does.

Portfolio Architecture for Margin Defence

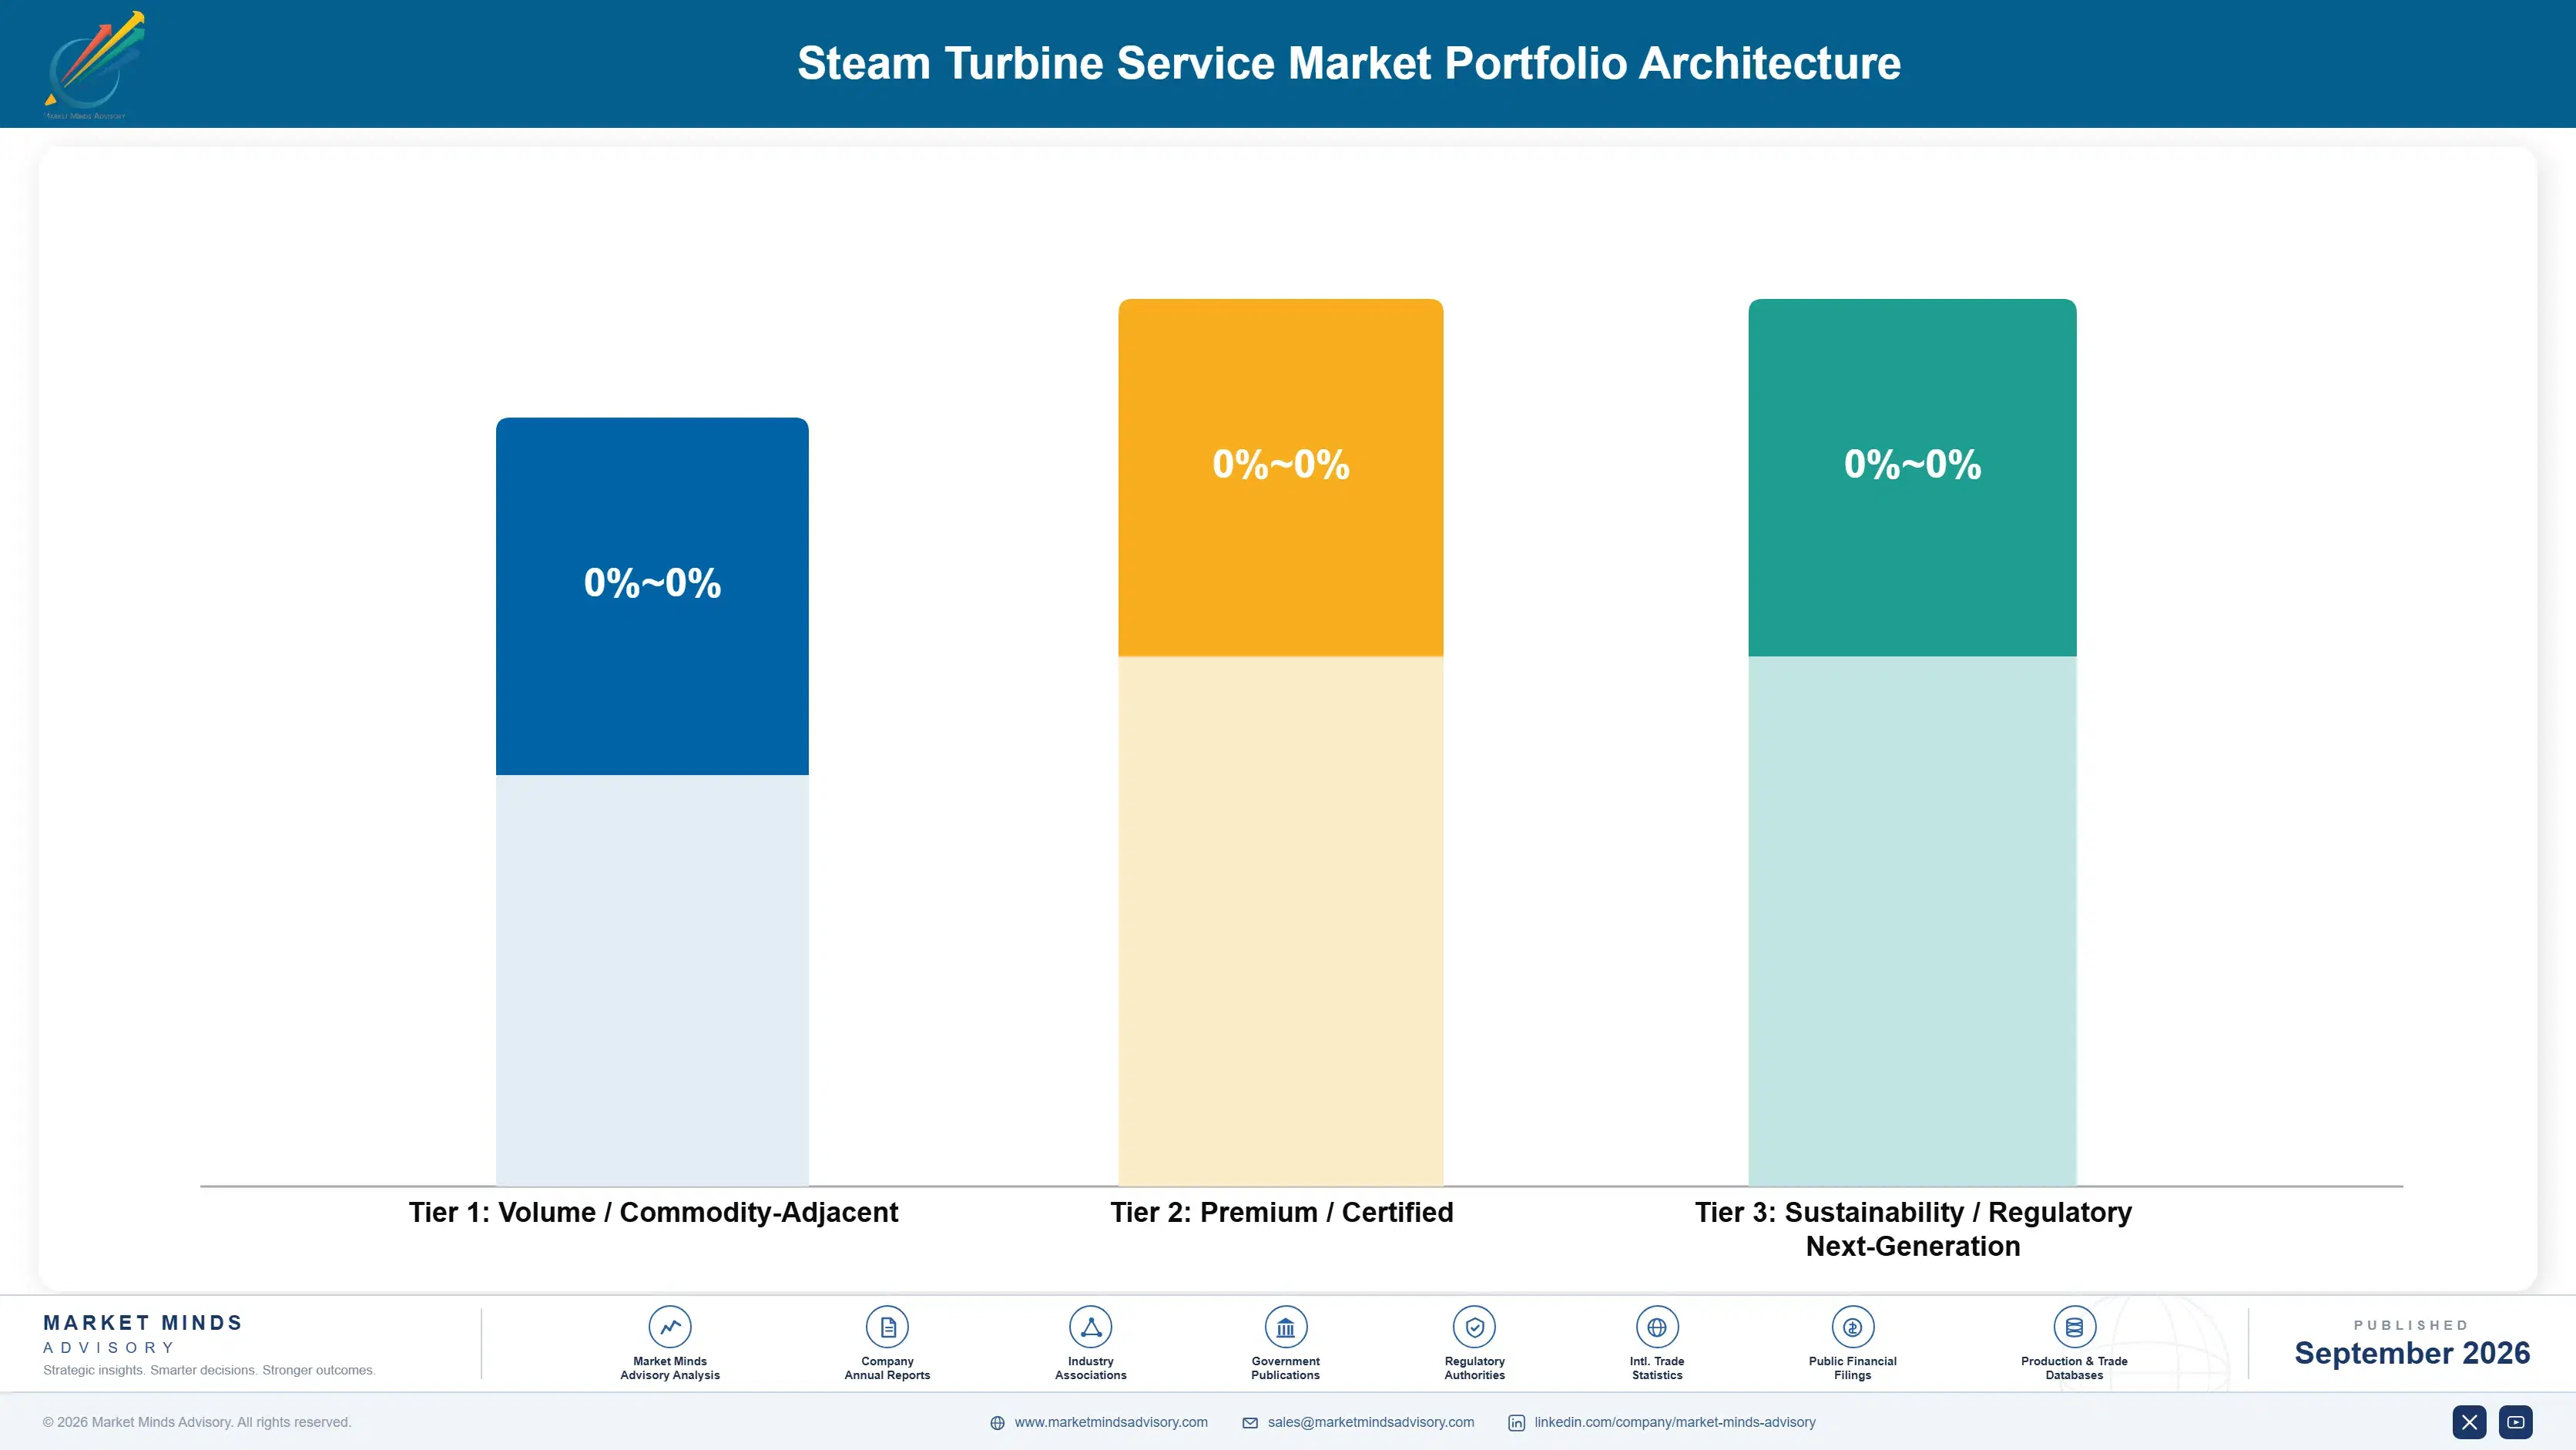
Margin separates by engineering content rather than by service volume. Routine inspection and field repair are sold against a labour rate that several providers can quote, and margin reflects that competition directly. Engineered retrofits, nuclear turbine island work and diagnostic-led outage scoping are sold against capability an operator cannot easily source elsewhere, and pricing follows what the work is worth to the plant rather than what it costs to perform.
The volume against premium tension is genuinely difficult here. Routine work keeps field crews employed and maintains the customer relationship through which retrofit opportunities surface, so no provider can abandon it without losing the position that generates the better work. But field crews are scarce, and every crew on a routine inspection is a crew unavailable for a retrofit at several times the margin. Scheduling discipline decides the outcome more than pricing does.

High-value pools concentrate where qualification, data or material access creates a barrier: nuclear turbine island work, fleet-trained diagnostics, and emergency response backed by strategic rotor stock. Each is defended by something an independent cannot assemble quickly. The pools are small in outage count and large in margin contribution, which is exactly why they are worth defending.

Volume / Commodity-Adjacent

Routine inspection, field repair and standard parts supply, quoted against labour rates and catalogue pricing that multiple providers meet. Margin depends on crew utilisation and travel efficiency rather than any technical differentiation at all.
Gross Margin: 16 to 22%

Premium / Certified

Engineered retrofits, blade path renewal and long-term service agreements with performance guarantees. The 8 point range reflects wide variation in whether the provider carries outcome risk and in how old the machine being worked on actually is.
Gross Margin: 27 to 35%

Sustainability / Regulatory / Next-Generation

Nuclear turbine island work, emergency response from strategic stock, and diagnostic-led scoping using fleet failure data. The 11 point range reflects how completely qualification and urgency, rather than cost, determine pricing on individual jobs.
Gross Margin: 34 to 45%
steam-turbine-service-market-portfolio-architecture-1788412450841

High-value Sub-segments and Strategic Watch-out

Nuclear Turbine Island Work

Highest value pool available, with schedules committed through the decade around refuelling outages and qualification barriers that exclude most providers. Individual awards run into tens of millions and recover output no reactor modification could match. Qualification is the entire barrier, and it takes years to clear.
Gross Margin: 36 to 45%

Engineered Life Extension Retrofits

Growing at 8.4% as retirement dates slip and operators convert closure plans into another operating decade. Engineering content keeps independents out of the larger jobs, though the best of them are moving into this work steadily. Reading which retirement dates will slip is the commercial skill.
Gross Margin: 28 to 35%

Routine Inspection and Field Repair

The volume core that keeps crews employed and maintains the customer relationships through which better work is found. Necessary rather than attractive, and the segment where independent competition is already most intense. Crew utilisation and travel efficiency decide whether any of it earns anything at all.
Gross Margin: 16 to 22%

Ageing Coal Unit Repair

Reactive work on units with a known closure date, where operators spend the minimum required to reach it and resist manufacturer parts pricing entirely. Revenue continues but no provider should be investing capability specifically against this pool. Harvest the position rather than defending it with investment.
Gross Margin: 14 to 20%

How Outage Work Is Awarded

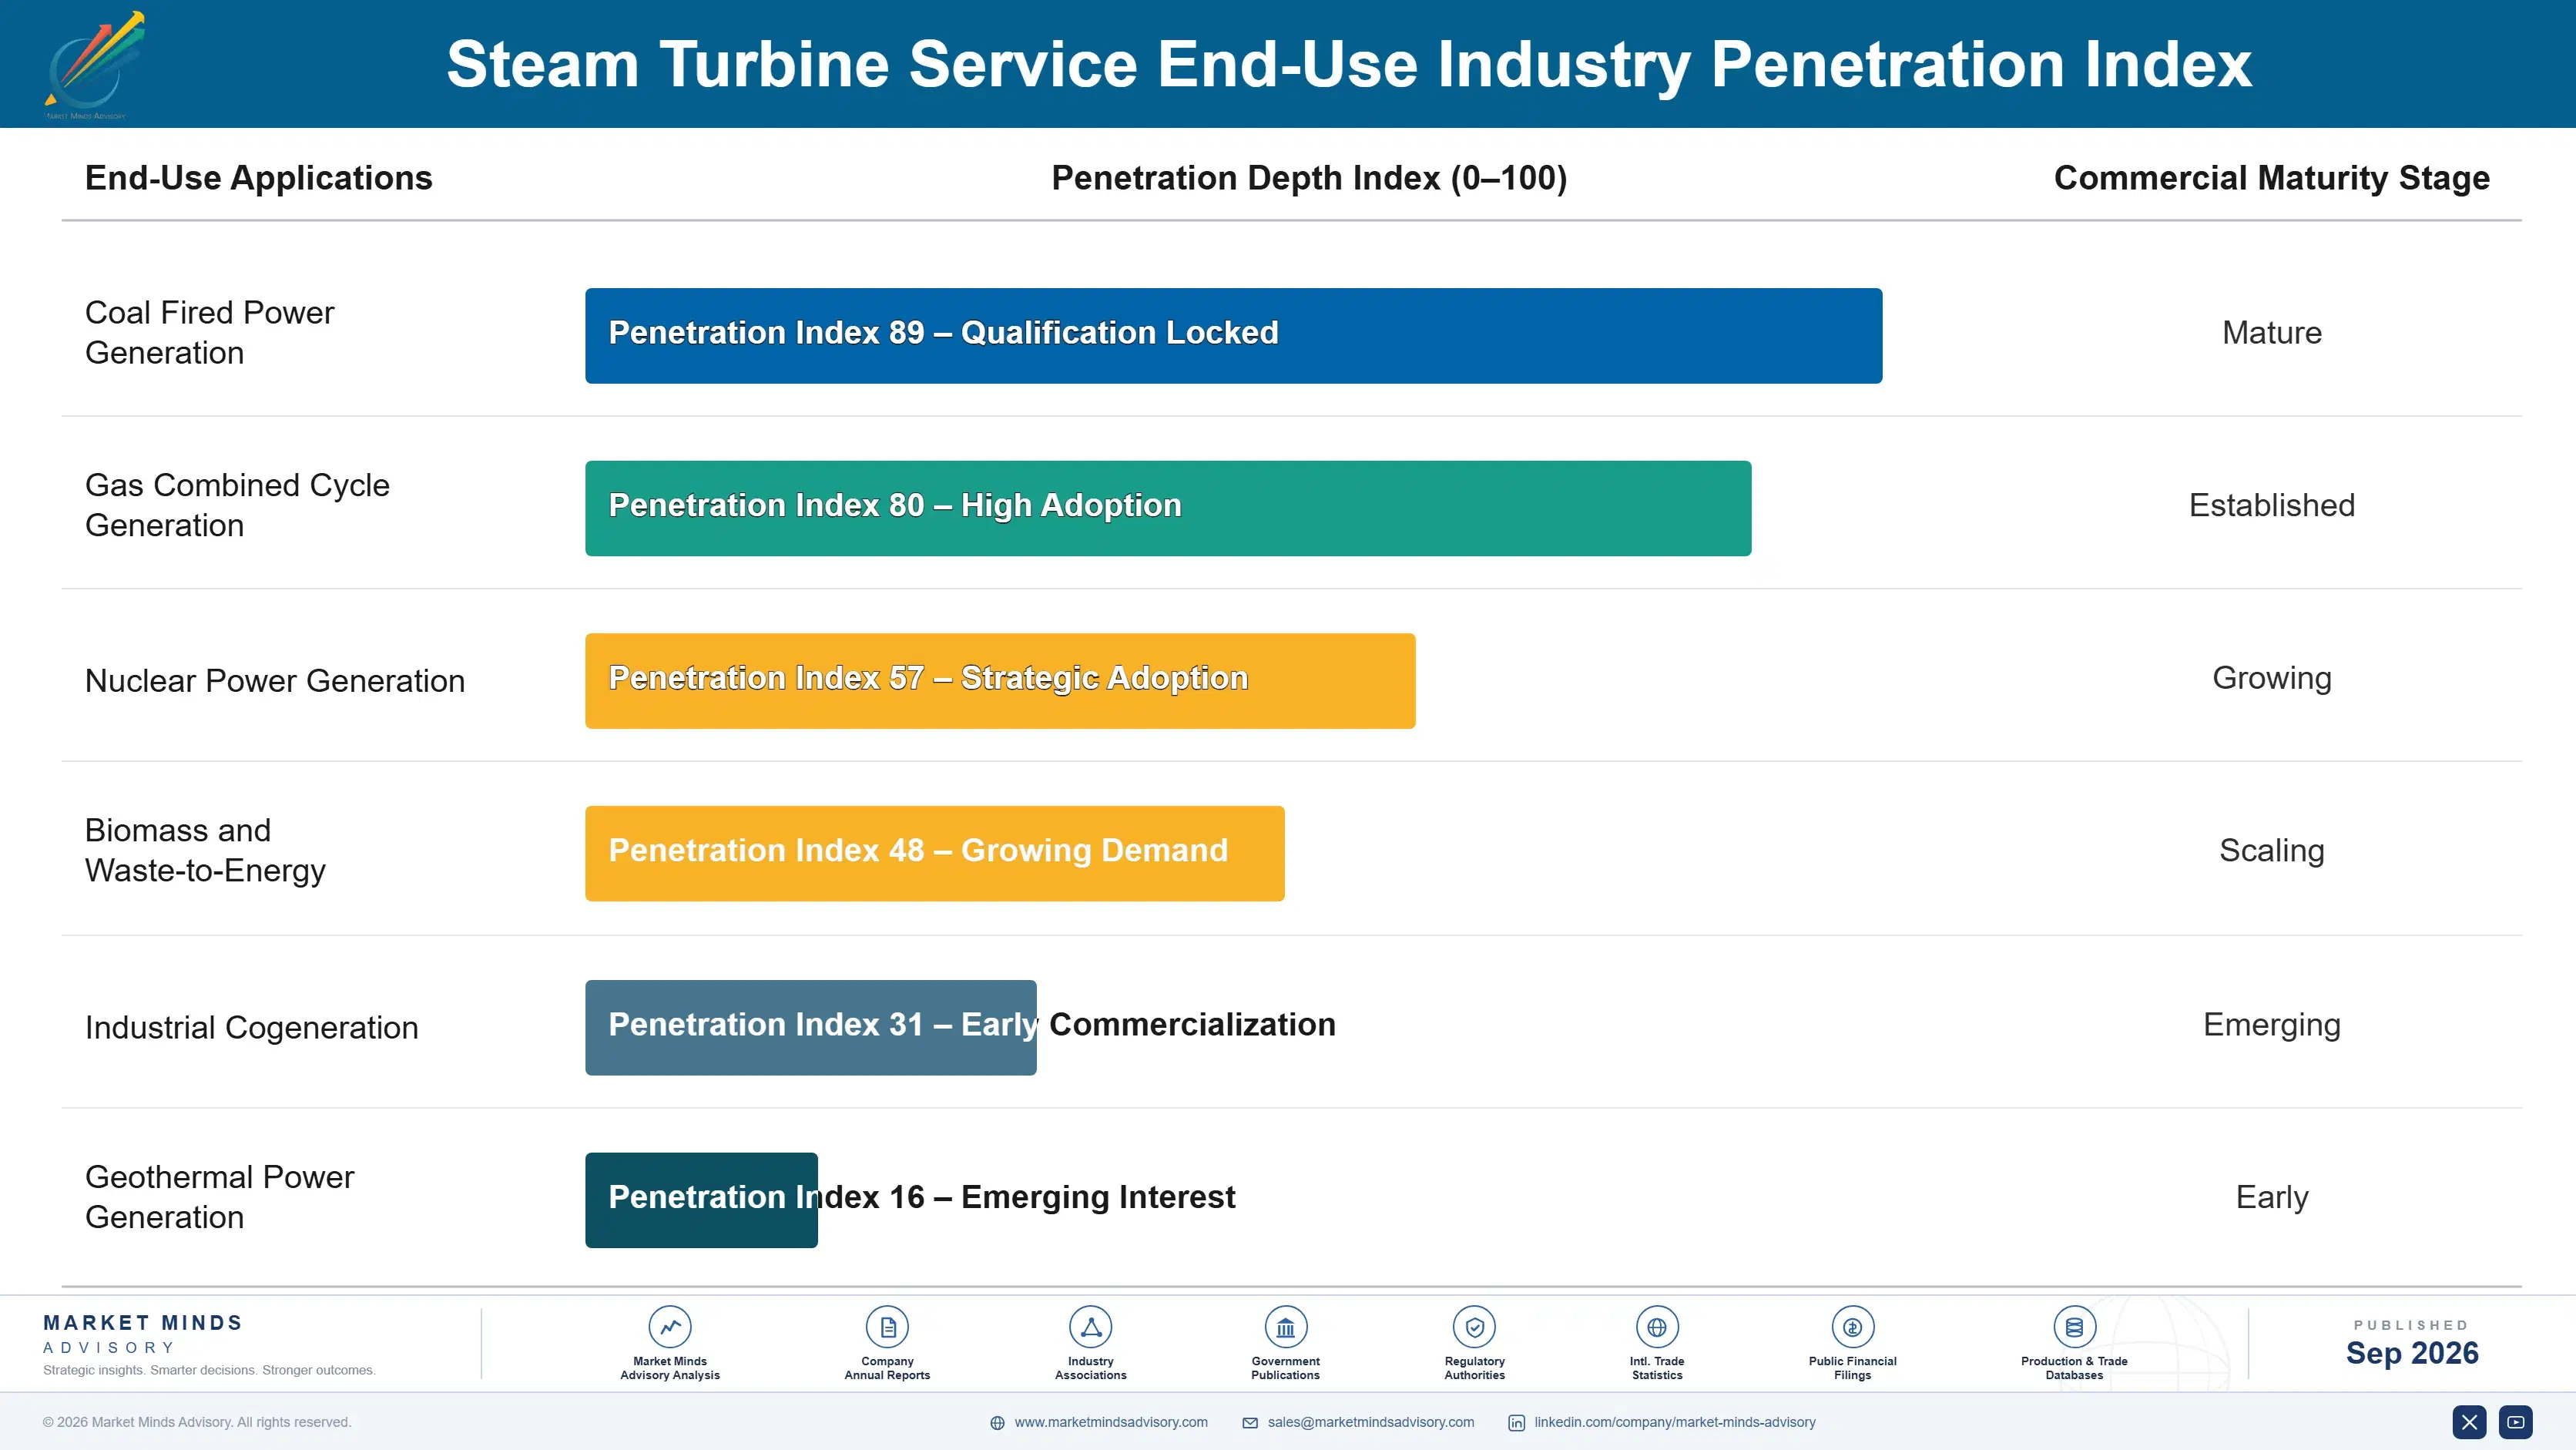
Annuity economics come from the long-term service agreement, not from any replacement cycle. An operator signing a ten or fifteen year agreement commits outage scope, parts and monitoring to one provider, who then captures that work without bidding each outage. Renewal rates are high because switching mid-life hands a new provider a machine whose history it does not know. The agreement, not the machine, is what providers really compete for.
Adoption depth varies sharply by operator type. Large utilities with engineering staff specify scope themselves, buy parts and labour separately and use independents aggressively. Independent power producers and industrial operators without in-house engineering buy the full agreement and rarely leave it. Nuclear operators sit apart entirely, constrained by qualification rules that limit them to a handful of providers regardless of commercial preference or pricing.

The buyer profile has shifted meaningfully. Outage decisions sat with plant managers judging condition from experience and a walkdown. They now sit with fleet asset managers working from monitoring data across multiple sites, deciding which units get investment and which get minimum spend to closure. That shift rewards providers who can present condition evidence rather than recommend scope, and it has made diagnostic capability commercially decisive.
steam-turbine-service-market-end-use-penetration-index-1788412451328

Where Providers Should Compete

These are among the four positions where our research anticipates prominent divergence between winners and laggards over the coming forecast period. Each is grounded in the demand model, the regulatory perimeter, and the announced capacity pipeline.
01 / LIFE EXTENSION TARGETING

Find the units whose closure dates will slip

An operator granted another operating decade becomes a completely different customer, moving from minimum spend to justified capital investment in rotors, blade paths and control systems that a closing plant would never receive. Capacity market signals and interconnection queue data make those date changes readable roughly 18 months before the operator formally decides anything at all. Providers who wait for the tender to appear arrive against an outage window already far too short for the engineering the work genuinely requires.
02 / FORGING ACCESS SECURITY

Secure material allocation before the queue lengthens

Lead times near 30 months mean forging access, not engineering capability, decides whether a provider can actually perform major work at the moment an operator needs it done. Standing allocation with forge masters and strategic stock for the most common frames convert an emergency into a priced opportunity rather than a regretted decline. Very few providers commit working capital against an event that may never happen, which is precisely why the ones who do earn so heavily when it does.
03 / DIAGNOSTIC DATA DEFENCE

Price monitoring for what it protects, not costs

Fleet failure history lets a provider tell an operator what will fail and roughly when, which justifies outage scope and defends the entire aftermarket position rather than a single monitoring contract. Providers who sold monitoring as a standalone product priced it at a small fraction of the aftermarket revenue it actually protects for them. On units earning capacity payments, around 7 avoided outage days a year pays for the whole service many times over without any argument from the operator.
04 / NUCLEAR QUALIFICATION INVESTMENT

Build nuclear capability while fossil work still funds it

Turbine island work carries the largest individual awards in this entire market and recovers around 4% of plant output without any modification to the reactor itself. Qualification takes years of quality systems, documentation and regulator acceptance, which is exactly what makes the position defensible for a long time once it is genuinely held. The fossil service base funding that investment is contracting every year, so the window to build the capability is considerably narrower than most providers currently seem to assume.

Engagement Snapshot From the Field

A live engagement with an industry participant carrying material or product regulatory and market exposure ahead of a defining policy shift, showing how our research translates into a defensible multi-year portfolio strategy.
MARKET MINDS ADVISORY · CLIENT ENGAGEMENT SUMMARY
Steam Turbine Service Producer Strategic Portfolio Review and Transition Roadmap 2026·Investment Scenario on Steam Turbine Service Exposure Evaluation 2025-26
CLIENT PROFILE
An independent steam turbine service provider operating across Europe and the Middle East with four repair shops and annual revenue reported at approximately USD 310 million (client-reported, unverified by MMA). The business had grown on field repair and parts supply for ageing fossil units and held no nuclear qualification and no forging allocation of its own anywhere.
STRATEGIC CHALLENGE
The coal fleet the company served was closing, and management could see revenue disappearing without knowing what should replace it. Bids for engineered retrofit work were being lost to original manufacturers on grounds nobody could clearly identify. Two emergency rotor jobs had been declined outright in the previous year for lack of any material access.
MMA APPROACH
MMA mapped the serviceable installed base by frame, age and likely retirement date across the client's territories, modelled which units were candidates for date slippage using capacity market and interconnection evidence, and interviewed operators on how retrofit awards were actually decided. Forge master allocation terms were benchmarked against what manufacturers were understood to hold.
KEY FINDINGS
  1. Retrofit bids were being lost on outcome guarantees rather than price or engineering, since the client could not underwrite performance after the work and manufacturers routinely could.
  2. Roughly 40% of the units the client wrote off as closing were credible candidates for retirement date slippage, based on capacity adequacy positions in three separate national markets.
  3. The two declined emergency rotor jobs would together have exceeded a year of ordinary field repair margin, and both went to a competitor holding stock rather than better engineering.
  4. Nuclear qualification was achievable within four years using existing shop capability, but only if funded while the fossil business was still generating cash to pay for it.
CLIENT PROFILE
An independent steam turbine service provider operating across Europe and the Middle East with four repair shops and annual revenue reported at approximately USD 310 million (client-reported, unverified by MMA). The business had grown on field repair and parts supply for ageing fossil units and held no nuclear qualification and no forging allocation of its own anywhere.
STRATEGIC CHALLENGE
The coal fleet the company served was closing, and management could see revenue disappearing without knowing what should replace it. Bids for engineered retrofit work were being lost to original manufacturers on grounds nobody could clearly identify. Two emergency rotor jobs had been declined outright in the previous year for lack of any material access.
MMA APPROACH
MMA mapped the serviceable installed base by frame, age and likely retirement date across the client's territories, modelled which units were candidates for date slippage using capacity market and interconnection evidence, and interviewed operators on how retrofit awards were actually decided. Forge master allocation terms were benchmarked against what manufacturers were understood to hold.
KEY FINDINGS
  1. Retrofit bids were being lost on outcome guarantees rather than price or engineering, since the client could not underwrite performance after the work and manufacturers routinely could.
  2. Roughly 40% of the units the client wrote off as closing were credible candidates for retirement date slippage, based on capacity adequacy positions in three separate national markets.
  3. The two declined emergency rotor jobs would together have exceeded a year of ordinary field repair margin, and both went to a competitor holding stock rather than better engineering.
  4. Nuclear qualification was achievable within four years using existing shop capability, but only if funded while the fossil business was still generating cash to pay for it.
RECOMMENDED STRATEGY
Phase 1: Phase one: secure forging allocation and strategic rotor stock for the three most common frames in the client's territory, funded from existing cash generation. Phase 2: Phase two: build performance guarantee capability through metallurgical and thermodynamic engineering hires, targeting credible outcome underwriting on all major retrofit bids. Phase 3: Phase three: begin nuclear quality system qualification at two shops while fossil revenue is still funding the programme comfortably enough.
OUTCOME
Within fourteen months the client had secured allocation with one forge master, won two retrofit contracts previously lost to manufacturers, and reported service gross margin up 3.4 percentage points (client-reported, unverified by MMA). Nuclear qualification is underway at one shop and remains a multi-year programme still in progress.

Frequently Asked Questions

Foundational context covering the market sizes, CAGR, scope, country, region and competition that inform every finding below. This section is provided to cover basics and most often pre-purchase conversations, answered from the MMA Primary Research Dataset.

What is the current size of the Steam Turbine Service Market?

The market was valued at USD 19.5 billion in 2025 and reaches USD 20.59 billion in 2026. Demand tracks operating hours and start counts rather than installed capacity.

How large will the Steam Turbine Service Market be by 2036?

MMA forecasts USD 35.51 billion by 2036, an increase of USD 14.92 billion over the 2026 base. That represents an expansion multiple of 1.72 times.

What is the CAGR for the Steam Turbine Service Market 2026 to 2036?

The base case CAGR is 5.6%, with a bull case of 6.8% and a bear case of 4.4%. The historical rate between 2020 and 2025 was 4.4%.

Which segment is growing fastest?

Performance upgrades and retrofits grow at 8.4%, half again the market rate of 5.6%. Slipping retirement dates convert closure candidates into funded life extension investments instead.

Who are the major companies in the Steam Turbine Service Market?

GE Vernova, Siemens Energy, Mitsubishi Power, Doosan Enerbility and Toshiba Energy Systems and Solutions lead on disclosed service revenue. Together they account for roughly 47% of the market.

Which country is growing fastest?

India grows fastest at 8.4%, with a coal fleet still expanding while the existing base ages into heavy maintenance requirements. Both effects arrive at once.

Report Segmentation Architecture

The full report scope spans multiple orthogonal segmentation dimensions, with cross-tabulated demand data provided for each dimension pair. Coverage extends further to regional breakdowns, trend trajectories, and the competitive detail needed to support segment-level decision-making.

By Service Type

  • Scheduled Overhaul and Inspection
  • Parts Supply and Component Replacement
  • Performance Upgrades and Retrofits
  • Blade Path and Rotor Refurbishment
  • Field Repair and Emergency Response
  • Condition Monitoring and Diagnostics

By End-Use Industry

  • Coal Fired Power Generation
  • Gas Combined Cycle Generation
  • Nuclear Power Generation
  • Biomass and Waste-to-Energy
  • Industrial Cogeneration
  • Geothermal Power Generation

By Provider Type and Contract Model

  • Original Equipment Manufacturer Direct
  • Independent Service Providers
  • Utility In-House Shops
  • Long-Term Service Agreements
  • Transactional Outage Contracts
  • Framework and Call-Off Arrangements

By Region

  • East Asia
  • North America
  • Western Europe
  • South Asia and Pacific
  • Latin America
  • Middle East and Africa
  • Eastern Europe

Scope, Methodology, and Coverage

Every figure in this report is reproducible from documented input assumptions. The scope below maps the historical period, the forecast horizon, the segmentation dimensions, and the countries covered, alongside the underlying primary and qualitative methodology.
Historical Period
2020 to 2025
Forecast Period
2026 to 2036
Base Year
2025 (USD billions; MMA Primary Research Dataset, September 2026)
Market Definition
The steam turbine service market covers maintenance, inspection, overhaul, component repair, parts supply, performance retrofits and condition monitoring performed on installed steam turbine plant of 1 MW and above across coal, gas combined cycle, nuclear, biomass, waste-to-energy, geothermal and industrial cogeneration applications. Scope covers work by original equipment manufacturers, independent service providers and utility in-house shops. New steam turbine equipment sales, generator and boiler service, balance of plant work, and fuel or operations contracts are excluded.
Quantitative Units
USD billions at service provider revenue, with supporting outage counts and serviceable installed capacity in gigawatts by region
Segmentation Dimensions
Service type, end-use industry, provider type and contract model, region
Regions Covered
East Asia, North America, Western Europe, South Asia and Pacific, Latin America, Middle East and Africa, Eastern Europe
Countries Covered
China, India, Japan, South Korea, Australia, Germany, France, United Kingdom, Italy, Poland, Czech Republic, United States, Canada, Mexico, Brazil, Saudi Arabia, United Arab Emirates, South Africa
Key Companies Profiled
GE Vernova, Siemens Energy, Mitsubishi Power, Doosan Enerbility, Toshiba Energy Systems and Solutions, Shanghai Electric, Dongfang Electric, Harbin Electric, Bharat Heavy Electricals, Ansaldo Energia, Sulzer, EthosEnergy, Mechanical Dynamics and Analysis, Elliott Group, Fuji Electric, Kawasaki Heavy Industries, Triveni Turbine, Shin Nippon Machinery, Turbine Generator Maintenance, Wood Group
Quantitative Methodology
Primary survey, n=3,800 respondents, Q4 2025, six countries; demand-side model with trade association cross-validation
Qualitative Methodology
47 expert interviews, Q4 2025; applied to validate demand model assumptions, identify emerging dynamics, and assess competitive positioning
Report Format
PDF and XLSX data workbook (Word format preview document)
Publisher
Market Minds Advisory
Report Code
MMA-2026-ENE-511
Published
September 2026
Contact
sales@marketmindsadvisory.com | www.marketmindsadvisory.com

Purchase the full Steam Turbine Service Market Report (2026 to 2036).

The full report sizes service demand from equivalent operating hours and start counts rather than from installed capacity, which is the sizing error that has made this market look like a declining business when it is not. It covers six service types with individual growth rates, seven regions built from serviceable fleet age and duty, and the contest between original manufacturers, independents and utility in-house shops on a consistent revenue basis. Competitive analysis covers twenty providers with forging access and nuclear qualification treated as the decisive variables. Input cost modelling breaks out field labour, forgings and specialty alloy exposure by contract structure.
Six service types with individual growth rates
Fleet sized by operating hours and starts
Manufacturer against independent share by service type
Forging lead time and allocation constraint mapping
Twenty providers on consistent service revenue basis
Field labour and alloy cost exposure modelling

Built For The People Who Decide

From boardroom strategy to bench-side execution, this report is read cover-to-cover by leaders shaping the next decade of their industry, turning demand scenarios, market dynamics and valuation benchmarks into decisions.
CXOs/ Presidents/ VPs/ Managers
M&A and Corporate Development
Strategy Teams and R&D Heads
Procurement and Product Directors
Regulatory and Compliance Leaders
Investor Relations and Equity Analysts