Market Minds Advisory
STATCOM UPS Market

STATCOM UPS Market: STATCOM UPS Market: Idle Inverter Economics, Connection Obligations and Warranty Limits, 2026 to 2036

An uninterruptible supply spends its life at partial load waiting for an outage, and the spare inverter capacity sitting idle is worth more compensating the network than it is doing nothing at all.

Lead Analyst

Published

September 2026

Make Smarter Decisions with Customized Research Insights

Request a free sample report and evaluate market opportunities, growth trends, and competitive dynamics relevant to your business needs.

2025 MARKET VALUE$0.7BMarket Size 2025
2036 FORECAST VALUE$3.1BBase Case , 2026 to 2036
CAGR 2026 TO 203614.6 %Bull 15.8% / Bear 13.4%
INCREMENTAL OPPORTUNITY$2.3BNet 10- year value creation
EXPANSION MULTIPLE3.91x2036 value over 2026 base
Strategic Levers
M&A Pipeline
Regional Outlook
Country Rankings
Competitive Intelligence
Segmental Deep-dive
Call-Us : 91 93563 13602

Executive Snapshot and Market Trajectory.

A large uninterruptible supply is an expensive asset doing almost nothing. Typical loading runs around 38%, which leaves roughly 62% of inverter capacity idle, held in reserve for an outage that in most facilities never actually arrives. That is a very expensive asset doing nothing.
That idle capacity can compensate the network continuously while remaining ready to back up, which turns installed hardware into something it was never sold as. Retrofit control upgrades to systems already in service grow at 21.9%, half again the market rate of 14.6%, and cost around 9% of what a separate compensator installation would, avoiding roughly USD 1.3 million of capital at a large site. The hardware was already installed and already paid for.
Five manufacturers hold 63% of measured revenue, and the constraint is liability rather than engineering. Running an inverter continuously changes its thermal duty and failure profile, and only about 27% of the installed base is warranted for it. Grid codes also require the device to be certified as a connected resource, which no uninterruptible supply was ever designed to be. Paperwork rather than power electronics is the gate here.
Market Definition
The STATCOM uninterruptible power supply market covers systems whose inverters provide continuous dynamic reactive compensation, voltage support and harmonic mitigation to the connected network alongside backup power, spanning retrofit control upgrades to installed units, integrated compensation-capable systems, modular scalable designs, active harmonic filters with backup, rotary and flywheel hybrids, and medium voltage systems. Sizing is measured at manufacturer revenue including enablement software. Conventional backup-only supplies, standalone static compensators, batteries, generators and switchgear are excluded.
Base Year Value
$0.7B in 2025 (MMA Primary Research Dataset, September 2026)
Forecast Period
2026 to 2036, eleven discrete annual values
CAGR
14.6% base case. Bull 15.8%. Bear 13.4%.
Fastest Growth Segment
Retrofit Control Upgrades to Installed Systems: 21.9% CAGR
Fastest Growth Country
Ireland: 19.8% CAGR
Fastest Growth Region
South Asia and Pacific: 16.6% CAGR
Largest Region
East Asia: 30% of 2025 global value
Market Leaders
Schneider Electric, Vertiv, Eaton, ABB, Huawei Digital Power. Source: MMA Analysis based on company annual reports and measured shipment revenue including enablement software.
Primary Survey
n=3,800 procurement and R&D decision-makers, Q4 2025, six countries
Methodology
Demand-side build-up, cross-validated against public data, 47 expert interviews

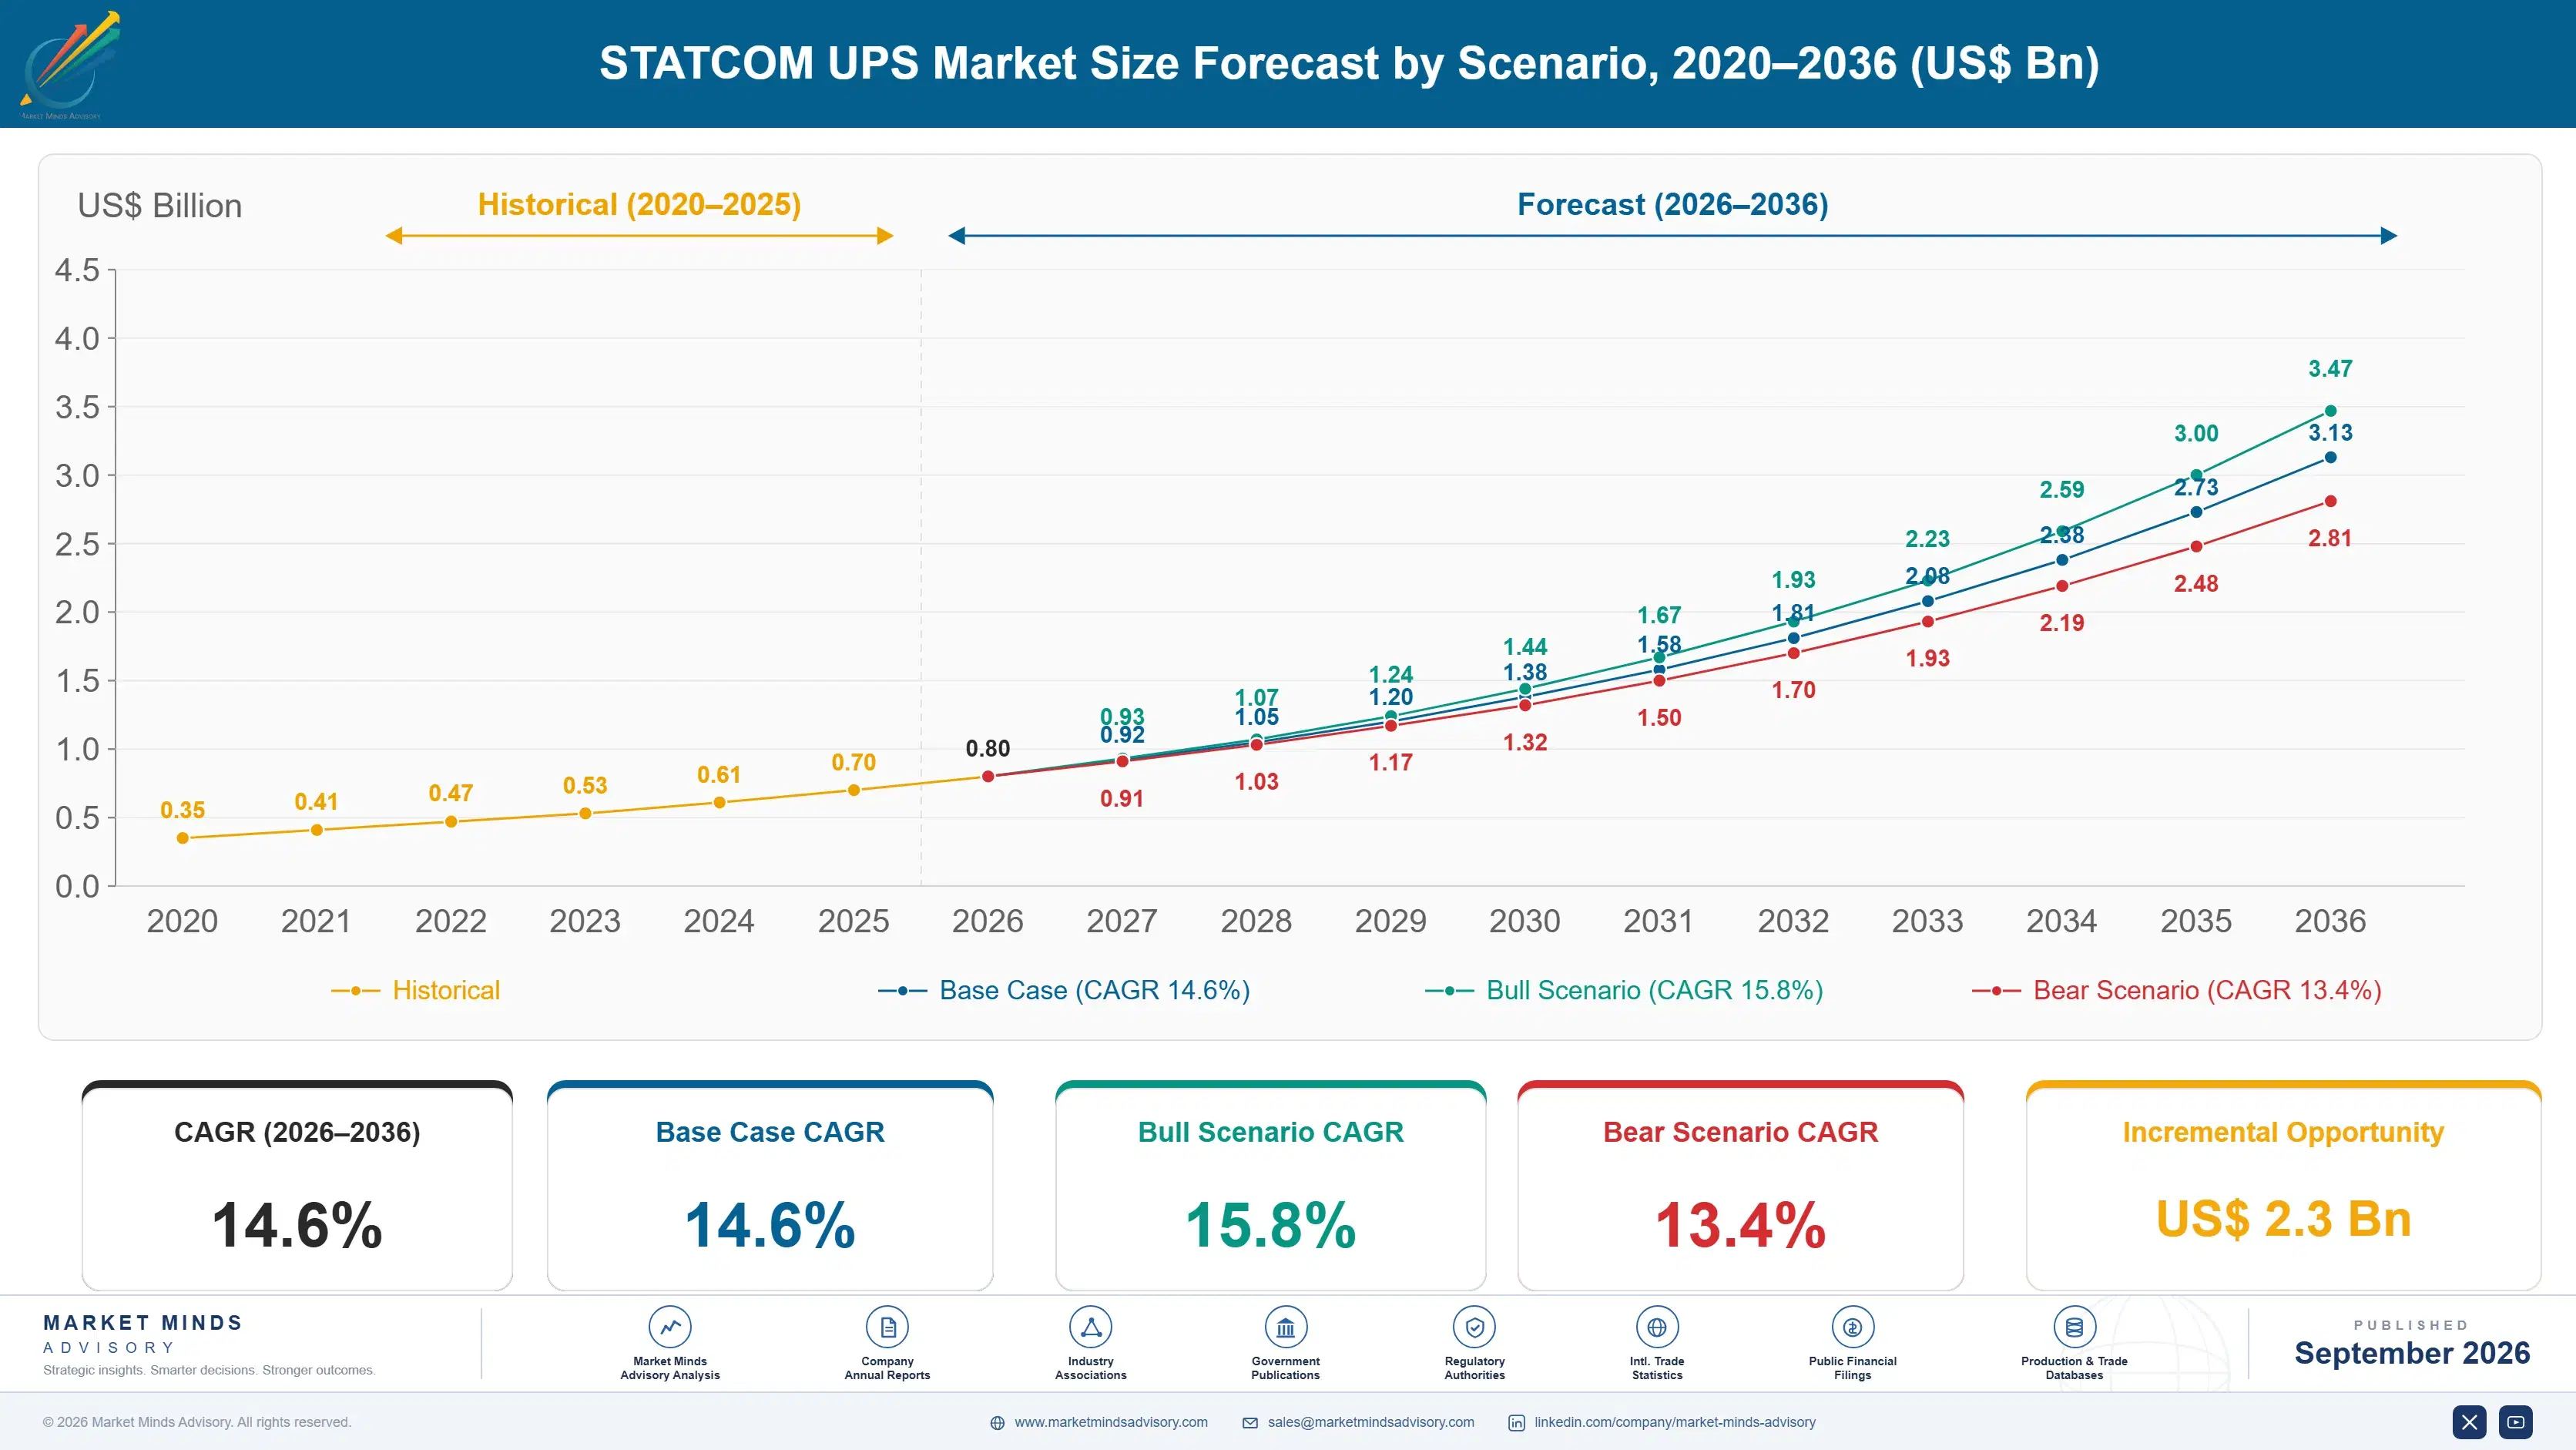
STATCOM UPS Market Forecast Scenarios

statcom-ups-market-size-forecast-scenario-1788415845131
Between 2020 and 2025 the market compounded at 13.4% from a base small enough that individual projects moved the annual figure. Early adoption came from industrial sites facing power factor penalties who discovered their backup equipment could answer the problem without further capital. Data centre operators followed once grid connection became the binding constraint on expansion rather than land, capital or equipment availability.
The 14.6% base case rests on three commercial mechanisms. Grid connection agreements for large loads increasingly require reactive support and harmonic limits as a condition rather than a preference, which converts compensation from an optimisation into an obligation. Retrofit enablement costs a fraction of new equipment and applies to an installed base already in service. And system operators are beginning to pay for reactive and frequency services, which turns a cost centre into a revenue line for the first time.
The bull case is grid service payments becoming routine enough that operators buy compensation-capable equipment deliberately rather than discovering the capability later. The bear case is manufacturers continuing to withhold warranty for continuous duty, since a facility operator will not run equipment outside warranty to save reactive charges no matter how good the arithmetic looks on paper.

Paying For An Inverter That Does Nothing

An uninterruptible supply is bought to do something that hardly ever happens. Systems run at around 38% loading on average, and the inverter sits ready for an outage that many facilities never experience in the equipment's service life. Roughly 62% of that inverter capacity is idle at any moment, fully paid for, connected to the network and doing nothing whatsoever with itself.
TOP FIVE CONCENTRATION63%Share of measured shipment revenue held by leading manufacturers
TYPICAL SYSTEM LOADING38%Average load on installed uninterruptible supply systems in operation
IDLE INVERTER CAPACITY62%Inverter capacity available for compensation duty at typical loading
AVOIDED COMPENSATOR COSTUSD 1.3mCapital avoided by using existing inverter instead of a compensator
RETROFIT ENABLEMENT COST9%Cost of control upgrade against a new compensator installation
CONTINUOUS DUTY WARRANTY27%Portion of installed systems warranted for continuous compensation duty
The same power electronics can inject or absorb reactive power, cancel harmonics and support voltage continuously while retaining full backup readiness, because reactive compensation uses capacity the backup duty is not using. Enabling that is largely a control and firmware exercise on hardware already installed, costing around 9% of what a separate compensator would and avoiding roughly USD 1.3 million of capital at a large site.
What stops it is not power electronics. Continuous operation changes the thermal duty and the failure profile of components designed for standby, and manufacturers have been cautious about warranting it, so only around 27% of the installed base carries continuous duty cover. Grid codes separately require certification as a connected resource, which no backup supply was ever designed or tested to satisfy. The barrier is liability and paperwork.
"The arithmetic here has been obvious to every power engineer for fifteen years and nothing happened, because the person who benefits is the facility and the person carrying the risk is the manufacturer. It moved when grid codes made compensation compulsory rather than clever."
Director, Power Quality and Critical Power Systems Practice · MMA Energy and Power Practice · September 2026

Market Trends

Connection Agreements Turn Compensation Into An Obligation

System operators facing large new loads have begun writing reactive power support, power factor limits and harmonic performance into connection agreements as conditions rather than as preferences, particularly where network capacity is constrained. That converts compensation from an efficiency argument into a requirement for permission to connect at all, which is a completely different commercial conversation. Facilities discovering the obligation late find that equipment already installed can satisfy it, which is why retrofit enablement grows at 21.9% against a market at 14.6% rather than new equipment carrying the growth. Retrofit rather than new equipment carries this growth.
Market Impact: Grows at 19.8% annually
Warranty Cover Rather Than Capability Limits Adoption

Running an inverter continuously at partial reactive load changes thermal cycling, semiconductor stress and capacitor ageing in ways standby duty does not, and manufacturers have been slow to warrant equipment for it. Only around 27% of the installed base carries continuous duty cover, and no facility operator will run critical equipment outside warranty to save reactive charges. That makes warranty policy rather than engineering the actual gate on this market, and manufacturers extending cover are opening demand rather than responding to it. Manufacturers extending cover open demand rather than respond to it.
Market Impact: Avoids USD 1.3 million capital

Market Opportunities and Growth Drivers

Grid Connection Constraints Bind Data Centre Expansion

Network capacity rather than land, capital or equipment now limits where large computing facilities can be built in several markets, and operators offering reactive support or harmonic performance improve their position in connection queues that would otherwise leave them waiting years. Ireland grows at 19.8%, the fastest of any country in this market, because its connection constraints are the most severe anywhere and operators have every incentive to demonstrate good network behaviour. The argument reaches a board because it affects whether a facility gets built at all. Board attention follows automatically.
Market Impact: Leaves 73% without cover

Industrial Power Factor Penalties Recur Every Month

Tariffs penalising poor power factor and excess reactive demand apply monthly across most industrial networks, and the charges accumulate quietly on bills that nobody examines closely until somebody does. Existing backup equipment can correct the problem for around 9% of what a dedicated compensator costs, which is an unusually clean payback. Arc furnaces, large drives, welding operations and electrolysers generate the worst reactive and harmonic profiles. The finance function understands this argument immediately because the penalty already appears in accounts it reviews. Arc furnaces, large drives and electrolysers generate the worst reactive and harmonic profiles anywhere.
Market Impact: Adds 2 certification regimes

Market Restraints and Challenges

Manufacturers Withhold Warranty For Continuous Duty

Only around 27% of the installed base is warranted for continuous compensation operation, and no facility operator runs critical power equipment outside warranty to save reactive charges however attractive the arithmetic looks. The root cause is that manufacturers carry the failure risk while the facility captures the saving, which is an asymmetry no engineering improvement resolves. Commercial impact is demand that exists and cannot be served. Mitigation runs through extended warranty products priced for the additional duty, through condition monitoring that evidences actual thermal loading, and through derating that trades compensation capacity for warranty comfort.
Market Impact: Applies to 1 connection agreement

Grid Certification Was Never Part Of The Design

Providing reactive support to a network makes the equipment a connected resource subject to grid code compliance, fault ride-through requirements and certification testing that a backup supply was never designed or tested against. The root cause is that these two regulatory worlds developed entirely separately and describe the same hardware in incompatible terms. Commercial impact is a certification burden that falls on the manufacturer for a capability the customer wants. Participants mitigate by certifying flagship platforms rather than whole ranges, by working with system operators on appropriate requirements, and by limiting compensation to levels below certification thresholds.
Market Impact: Covers 27% of installed base
3 additional market trends, 4 additional growth drivers, and 2 additional restraints and challenges are covered in the full report. Contact sales@marketmindsadvisory.com to access the complete intelligence.

Segment CAGR and Growth Architecture

Segmentation follows product configuration, which determines whether capability is added to existing equipment or purchased new, and at what voltage. Retrofit upgrades, integrated systems, modular designs, filters with backup, rotary hybrids and medium voltage systems each serve different situations, and the retrofit route behaves quite unlike any of the others commercially. Retrofit behaves quite unlike the rest.
statcom-ups-market-market-share-analysis-1788415845708

Retrofit Control Upgrades to Installed Systems

Adding compensation capability to equipment already installed costs around 9% of a separate compensator and requires no new hardware where the platform is modern enough to support it, which makes this the cheapest route to satisfying a connection obligation or removing a power factor penalty. It also lets a manufacturer sell capability into a base it was already paid for once, which is unusually good economics. Growth at 21.9% is half again the market rate of 14.6%. Warranty extension rather than technical capability decides whether any individual site can actually proceed, and only around 27% of the base currently carries the necessary cover. The economics here are unusually favourable for a manufacturer.
CAGR 21.9%

Integrated Compensation-Capable Systems

New equipment specified from the outset to provide continuous compensation alongside backup avoids the warranty and certification difficulties that retrofits encounter, because the duty is designed in and tested rather than added afterwards. Buyers are typically facilities facing known connection obligations who would otherwise have purchased both a backup supply and a separate compensator, so the comparison is against two pieces of equipment rather than one. Growth at 18.6% reflects connection requirements becoming predictable enough to design around. Price sits well above conventional backup equipment and well below the combination it replaces. Buyers are typically facilities facing known connection obligations who would otherwise have purchased two separate pieces of equipment rather than one.
CAGR 18.6%
Full segment breakdown across 6 segments available in the complete report.

Regional Architecture and Country Demand Map

Demand follows grid connection constraints and reactive charging regimes rather than electricity consumption or data centre floor area. East Asia leads because industrial power factor penalties there are long established and enforced across an enormous load base. Floor area and consumption both mislead badly. Charging regimes decide it.

East Asia

Chinese industrial tariffs have penalised poor power factor and rewarded correction for decades, applied across a manufacturing load base larger than anywhere else, which makes the compensation argument familiar to plant managers rather than novel. Data centre construction adds a second demand pool with connection constraints in the major coastal clusters. Domestic manufacturers hold most of the equipment market and are advancing quickly on compensation capability. Japanese and Korean industrial buyers specify conservatively and value warranty cover above the reactive savings on offer. Domestic manufacturers hold most of the equipment market here and are advancing quickly on compensation capability, while Japanese and Korean buyers value warranty cover above the savings.
Share: 30% | CAGR: 15.4% (2026 to 2036)

North America

Data centre concentration in a small number of regions has made grid connection the binding constraint on expansion, with queues measured in years and operators competing for capacity through good network behaviour as much as through payment. Reactive charging varies considerably by utility, which makes the economics site-specific rather than regional. System operators in several markets are beginning to pay for reactive and frequency services, which changes the internal argument from cost avoidance to revenue. Industrial demand is smaller and concentrated in heavy manufacturing. Reactive charging varies considerably between utilities, which makes the economics site-specific rather than regional and complicates any national sales argument considerably. Industrial demand is smaller and concentrated in heavy manufacturing.
Share: 26% | CAGR: 14.0% (2026 to 2036)
Regional intelligence for 5 additional markets available in the complete report: Western Europe, South Asia and Pacific, Middle East and Africa, Latin America, Eastern Europe. Contact sales@marketmindsadvisory.com.
statcom-ups-market-country-cagr-analysis-1788415846232

Where This Capability Actually Earns

Four positions carry margin in a market whose product is largely a permission to use hardware already installed. Each requires a manufacturer to accept risk or complete work that benefits a customer more than itself, which is precisely why an obvious idea took fifteen years to move at all. Fifteen years of obvious arithmetic went nowhere for exactly that reason.

Sell Enablement Into The Installed Base

Retrofit control upgrades cost around 9% of a separate compensator, require no new hardware on modern platforms and address equipment a manufacturer has already been paid for once. That is licensing revenue against zero manufacturing cost, growing at 21.9% against a market at 14.6%. It requires knowing which installed units can support the capability, which manufacturers frequently cannot answer from their own records. Building that installed base intelligence is the practical work behind the opportunity and almost nobody has done it. Installed base intelligence is the practical work behind it.
Market Impact: Costs just 9% of a new compensator installation

Price Warranty For Continuous Duty Deliberately

Only about 27% of the installed base carries warranty for continuous compensation operation, and no operator runs critical equipment outside cover whatever the savings. Manufacturers withholding warranty are not protecting themselves so much as declining revenue, since an extended warranty priced for the additional thermal duty converts refusal into a product. Condition monitoring evidencing actual loading supports that pricing with data rather than assumption. The manufacturer that opens warranty first will open the demand behind it. The first manufacturer to open cover opens the demand behind it. No operator proceeds without cover, whatever the arithmetic says.
Market Impact: Reaches the 73% currently holding no cover at all

Certify Platforms As Connected Resources Early

Grid codes treat a compensating supply as a connected resource requiring fault ride-through and certification testing across 2 regulatory regimes that developed entirely separately. Certifying flagship platforms rather than whole ranges makes the cost manageable and produces a qualification competitors need years to match. It also positions the manufacturer in conversations with system operators about what requirements should reasonably be. Suppliers waiting for requirements to settle will certify while others are already selling. Waiting means certifying while competitors sell. Certifying flagship platforms rather than whole ranges keeps the cost manageable while producing a qualification competitors need years to match.
Market Impact: Satisfies both of the 2 regulatory regimes involved

Package Grid Service Participation For Fleets

System operators paying for reactive and frequency services turn avoided cost into revenue, which changes the internal argument at a customer completely. Participation requires metering, telemetry, aggregation across roughly 5 sites to reach useful capacity, and certification, none of which standard equipment provides. A manufacturer packaging all of that sells an earnings stream rather than a component. Very few have the software and market participation capability to do it, and those that do face little competition. Those who can face almost no competition today. Metering, telemetry and certification are all required before participation can begin at all.
Market Impact: Aggregates 5 separate sites into one marketable resource

Who Controls the Margin Pool

Measured on shipment revenue including enablement software, the basis used throughout this section, the top five hold 63%. Concentration follows the uninterruptible supply market itself, since compensation capability attaches to installed equipment and the installed base is what determines who can sell it. The gap between leaders and everyone else is installed platform population and willingness to warrant continuous duty rather than any power electronics advantage.
Competition runs on warranty terms, grid code certification and installed base reach rather than on compensation performance, which every capable inverter delivers adequately. Large critical power manufacturers hold the installed base and move cautiously on warranty. Chinese suppliers advance quickly on capability and compete hard on price. Specialist power quality vendors selling standalone compensators are being displaced by equipment customers already own.

Pressure comes from two directions. Standalone compensator suppliers lose whenever a customer discovers existing equipment can do the job at a fraction of the cost, and that discovery is spreading. And grid service participation requires software and market capability that hardware manufacturers generally lack, which invites entrants from energy trading rather than from electrical equipment. Rankings shift where manufacturers opened warranty and certified platforms rather than protecting new equipment sales.
statcom-ups-market-company-positioning-matrix-1788415846757

Competitive Moat and Risk Dimensions

SCHNEIDER ELECTRIC

Moat: Installed base and grid position

An enormous installed population of critical power equipment gives direct access to the retrofit opportunity that carries most of this market's growth, since enablement sells into machines it already supplied. Broader grid and industrial electrical capability supports the certification and system operator engagement that pure critical power vendors find unfamiliar. Service relationships already reach the sites enablement would apply to.
SCHNEIDER ELECTRIC

Risk: Cannibalising compensator sales

Enablement of installed equipment displaces standalone compensator and power quality equipment the company also sells, which creates an internal conflict that slows commercial commitment. Warranty extension for continuous duty places failure risk on a business unit that captures none of the customer saving. Chinese competitors carry neither conflict and are moving faster on capability as a result.
VERTIV

Moat: Data centre platform concentration

Deep concentration in large computing facilities places the company exactly where grid connection constraints bind hardest and where operators have the strongest incentive to demonstrate good network behaviour. Modular platform architecture makes firmware enablement genuinely practical rather than theoretical. Close relationships with operators running many sites suit the aggregation that grid service participation requires.
VERTIV

Risk: Limited industrial market reach

Industrial sites facing power factor penalties are a substantial part of this opportunity and sit outside the company's traditional customer base, where competitors hold established relationships. Grid service participation requires market and software capability that a hardware business does not naturally possess. Certification across multiple national grid codes falls heavily on a narrow platform range.

Players Tracked

Prominent Players

Schneider Electric
Vertiv
Eaton
ABB
Huawei Digital Power

Other Key Players

Delta Electronics
Legrand
Socomec
Riello Elettronica
Kehua Data
East Group
Toshiba Mitsubishi-Electric Industrial Systems
Mitsubishi Electric
Piller Power Systems
Hitec Power Protection
Rolls-Royce Power Systems
Borri
GE Vernova
Cummins
Fuji Electric

Recent Developments

JUNE 2025

System operator writes reactive support into large load connections

A transmission system operator published connection requirements obliging large new loads to provide reactive support and meet harmonic limits as a condition of connection, a regulatory decision rather than any commercial transaction. Existing connection agreements were unaffected while new applications became subject immediately. Applications already lodged were exempted.
Signal: Compensation stops being an optimisation the moment it becomes a condition of getting connected at all.
JANUARY 2025

Manufacturer releases grid support firmware for installed platforms

An uninterruptible supply manufacturer released control software enabling continuous reactive compensation on equipment already installed in the field, a product decision rather than any corporate transaction. Warranty terms for continuous duty operation were published alongside the release rather than handled case by case. Derating options were offered.
Signal: Publishing warranty terms alongside the capability is what actually converts an engineering feature into real demand.
OCTOBER 2024

Data centre operator contracts grid services from backup fleet

A computing facility operator entered a services agreement with a system operator to provide reactive support and frequency response from aggregated uninterruptible supply capacity, a service agreement rather than any equipment purchase. Metering, telemetry and resource certification were required before participation could begin. Certification took several months.
Signal: Once backup equipment starts earning revenue rather than merely avoiding cost, the internal argument changes completely.

Power Semiconductors And Magnetics

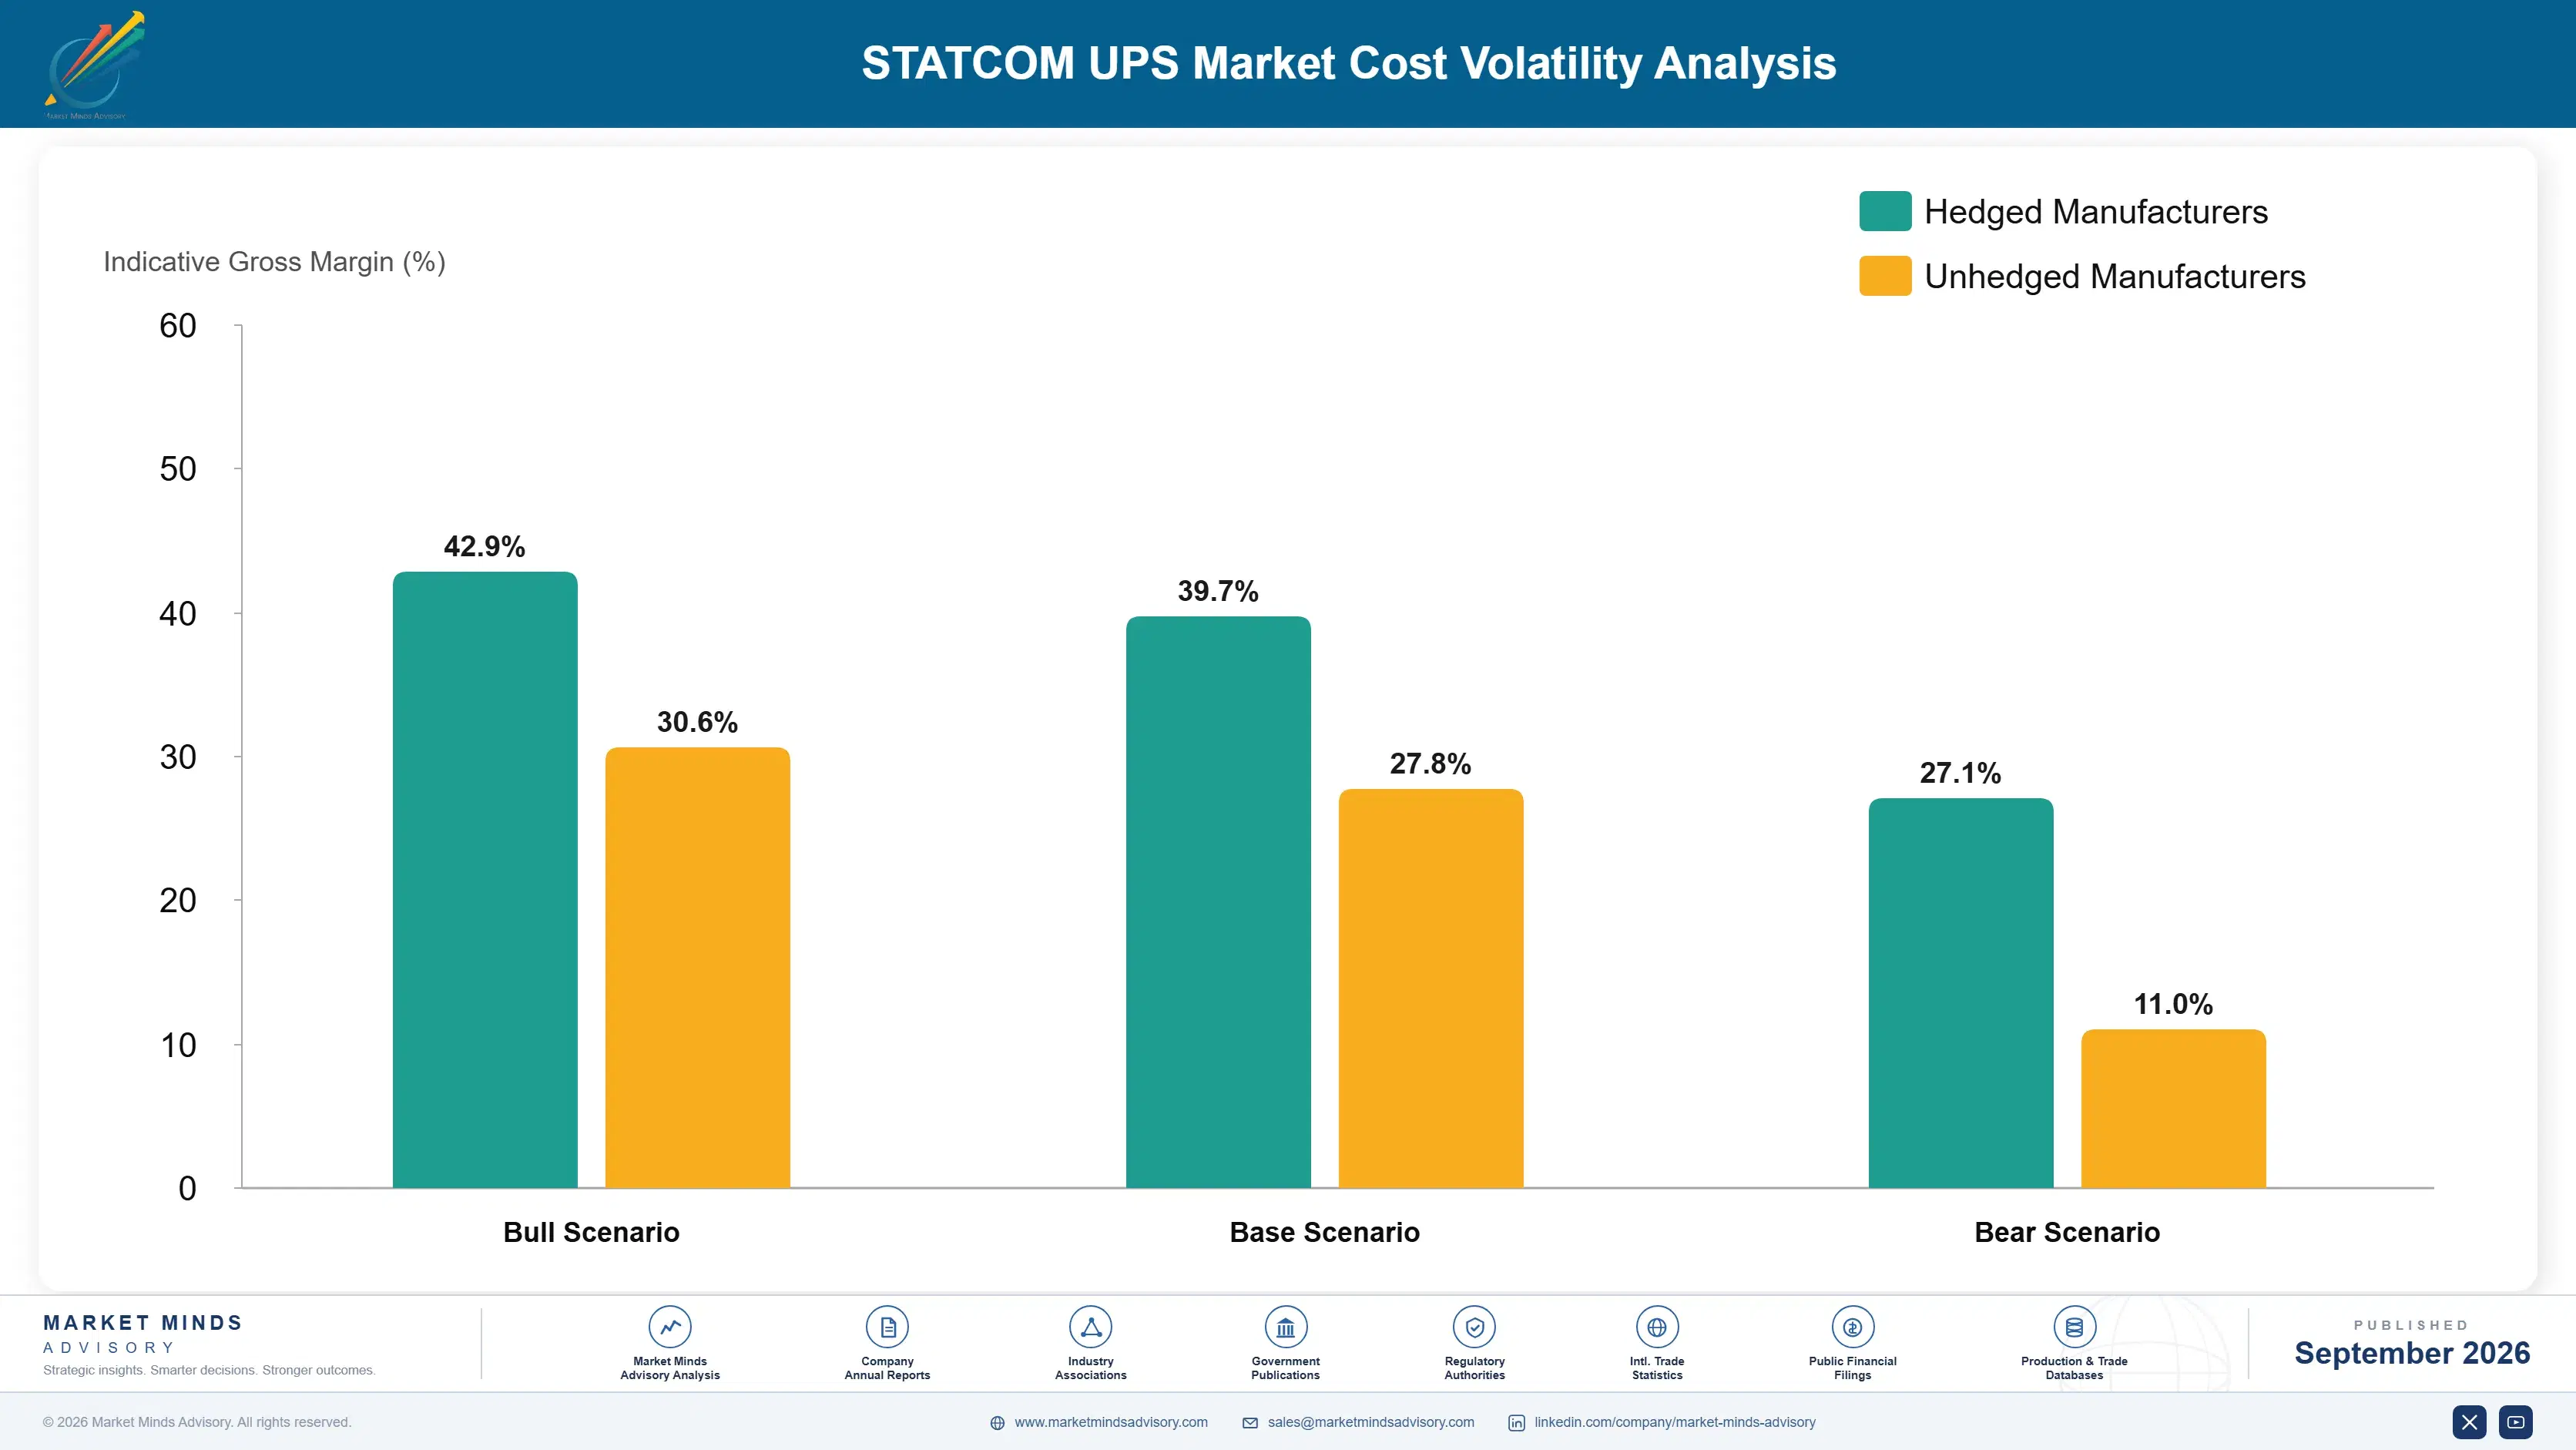
Power semiconductors account for roughly 31% of manufactured system cost, magnetics including copper windings around 19%, capacitors near 13%, and control electronics, enclosure and assembly the balance. Insulated gate bipolar transistor supply is concentrated across a small number of manufacturers, and SEMI industry reporting documented the capacity constraints and extended lead times that affected the whole power conversion industry through the recent shortage.
Semiconductor lead times extended well beyond a year at the worst point and copper moved from roughly USD 6,000 per tonne to above USD 10,000 across four years, both landing on manufacturers holding fixed-price project commitments. Several disclosed margin pressure and delivery difficulty in results covering the period. Capacitor supply tightened alongside as the same components served solar, storage and drive markets growing simultaneously. Nothing offset either pressure.

The disadvantage mechanism is product architecture rather than purchasing scale. Enablement software sold into installed equipment carries no material cost at all, while new integrated systems carry the full component exposure, so a manufacturer whose growth comes from retrofit is insulated from input volatility in a way one selling new hardware is not. That difference will widen as the retrofit segment grows at 21.9% against the market rate.
statcom-ups-market-cost-volatility-analysis-1788415846952

Enablement licensing in place of new hardware

Selling capability into equipment already installed generates revenue with no bill of materials at all, which removes component cost exposure entirely on that portion of the business. It requires knowing which installed units support the capability, and manufacturers frequently cannot answer that from their own service records without substantial work. Records rarely answer that question.

Multi-source qualification of power devices

Qualifying inverter designs across more than one semiconductor supplier protects delivery when lead times extend, as they did severely through the recent shortage. It costs engineering time and board area that nobody funds until a shortage has already made the argument, which is why the lesson gets relearned each cycle. The lesson is relearned each cycle.

Index-linked pricing on long project commitments

Tying project pricing to published copper and component indices moves input exposure to buyers better able to absorb it across large capital programmes. Data centre customers accept indexation more readily than industrial buyers do, since they already carry commodity exposure across their construction budgets and understand the mechanism perfectly well. Industrial buyers resist it more.

Portfolio Architecture for Margin Defence

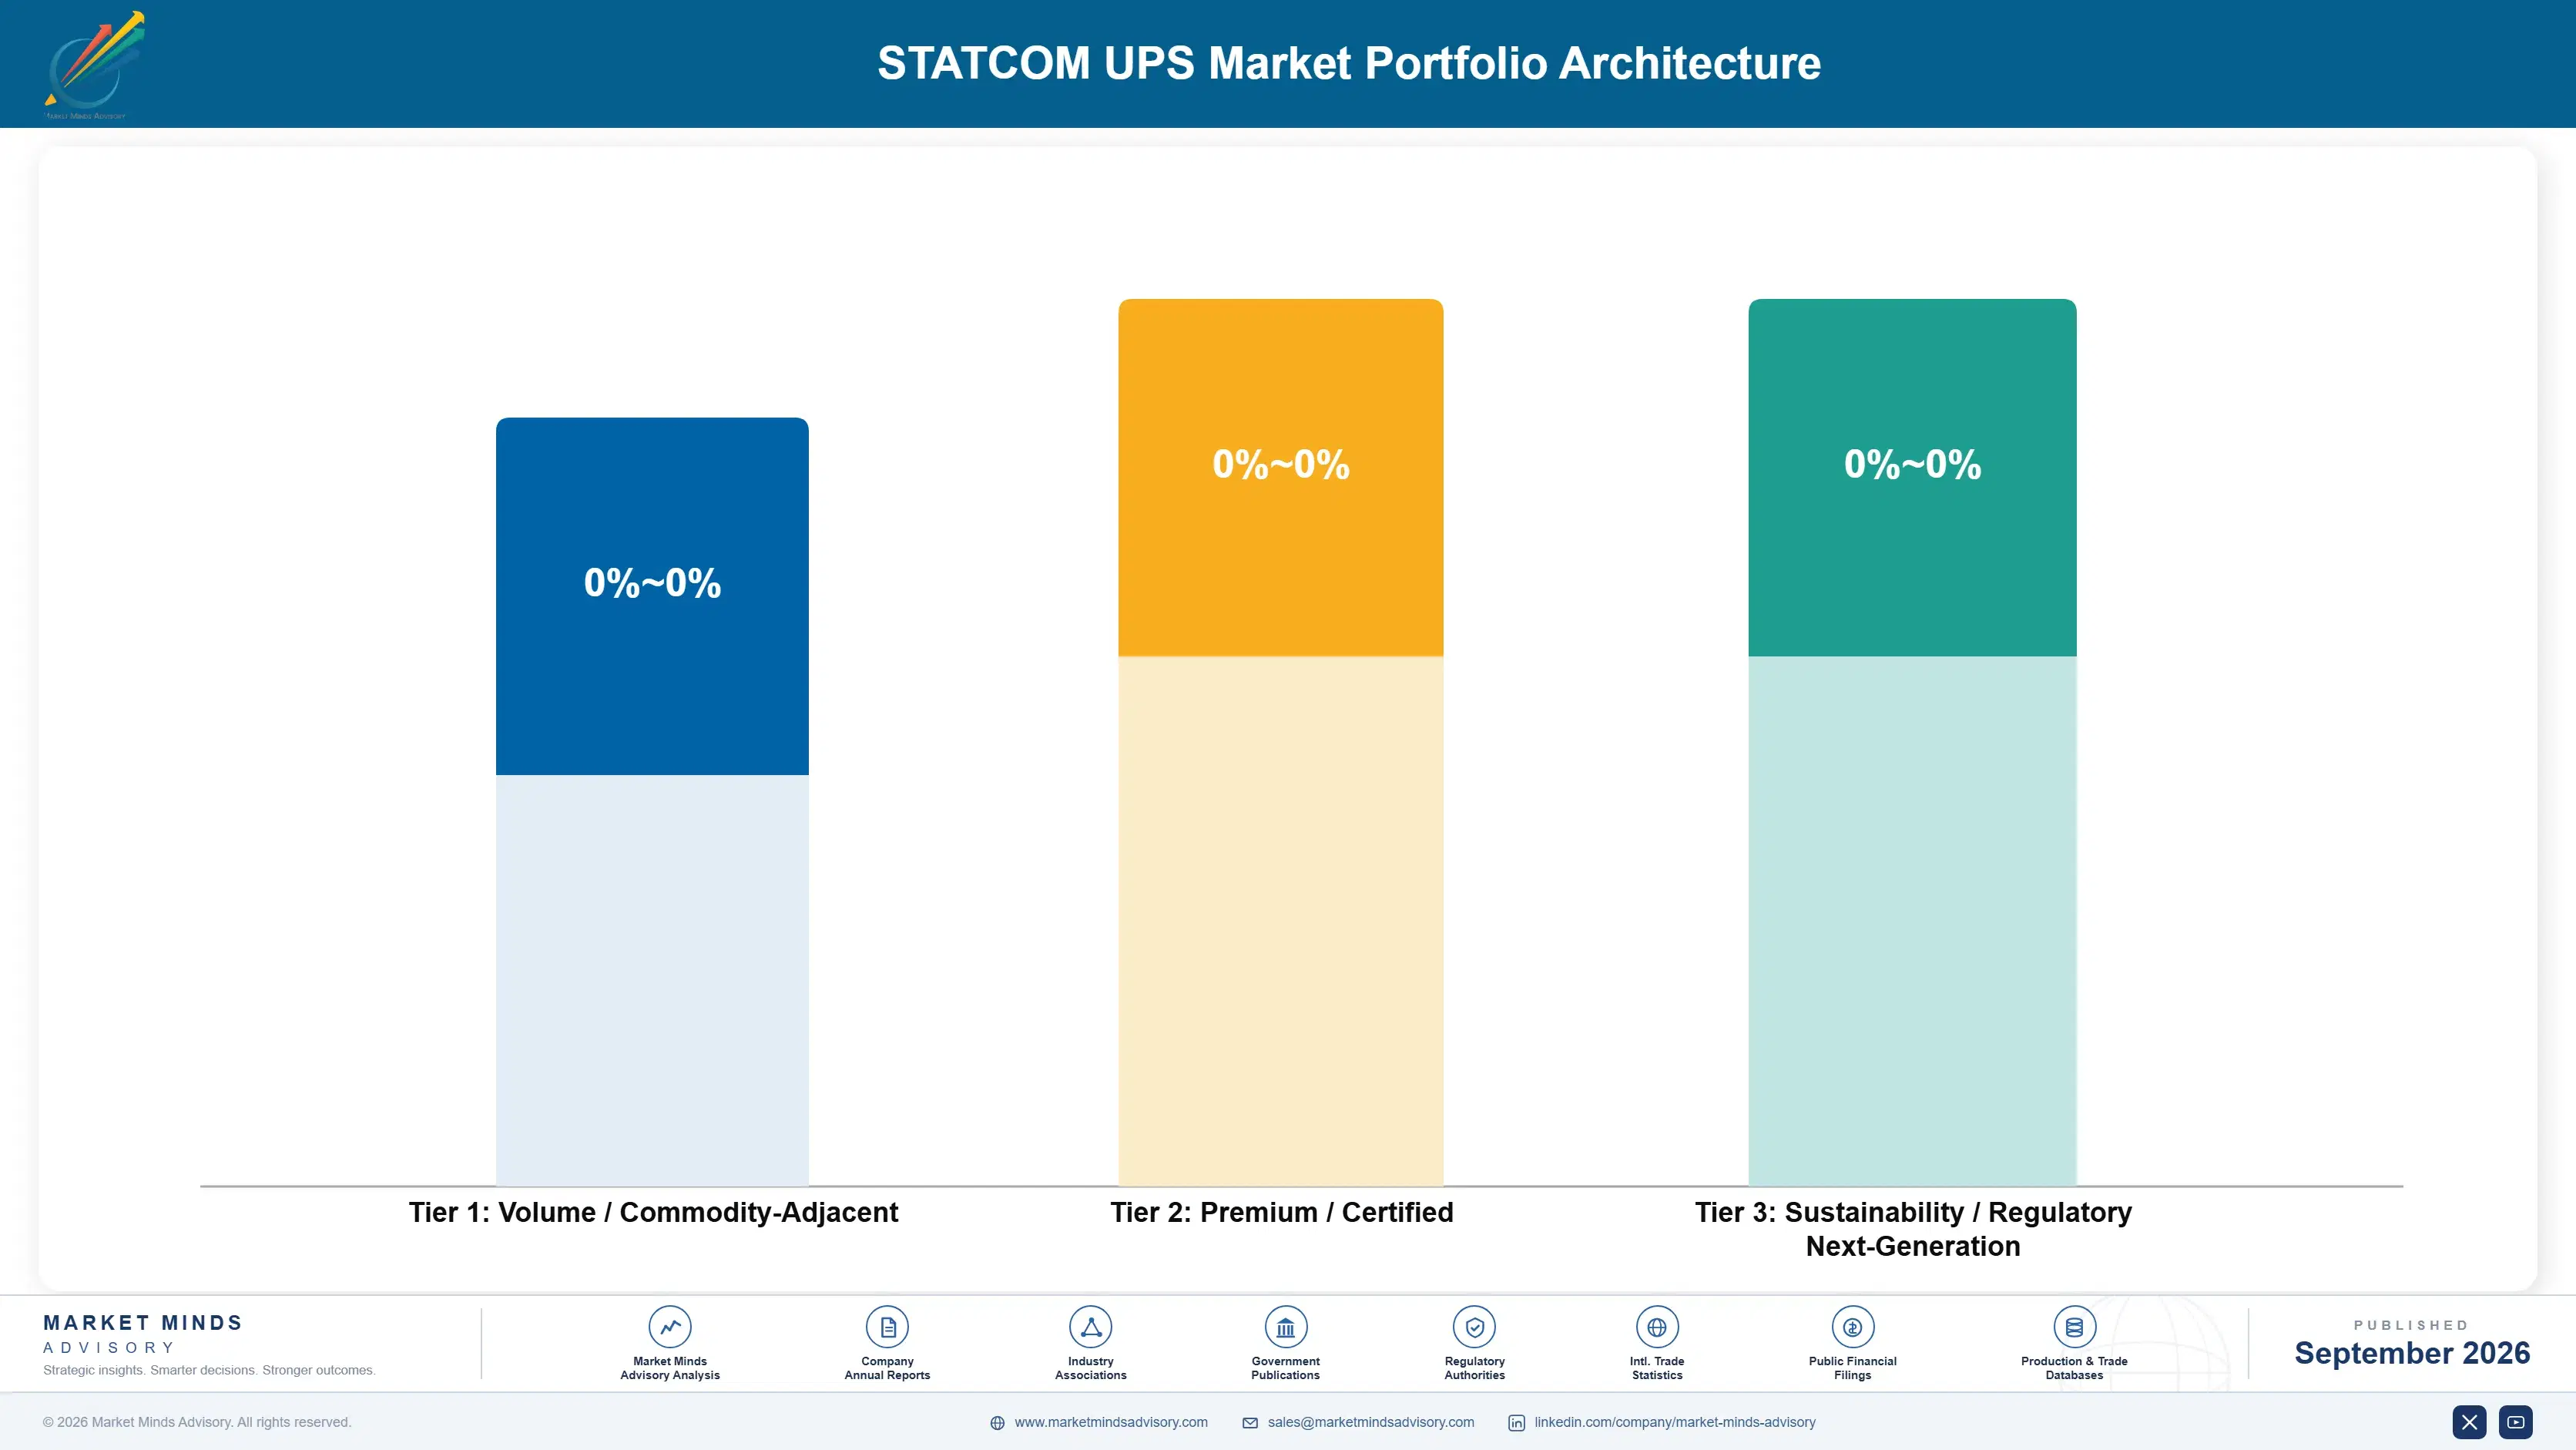
Margin separates by whether revenue carries a bill of materials. Enablement software sold into installed equipment costs nothing to manufacture and is priced against the compensator it replaces, which is an unusually favourable comparison. New integrated systems carry full component cost and compete against conventional backup equipment on price, where the compensation capability has to justify a premium the buyer may not yet have a reason to pay.
The volume against premium tension runs through cannibalisation rather than mix. Enablement revenue displaces standalone compensator sales that the same manufacturers frequently make, and it also reduces the case for new equipment at sites where existing units suffice. That internal conflict has slowed commercial commitment at several large suppliers. The competitors without a compensator business to protect are moving faster, which is the usual pattern and the usual mistake.

High-value pools sit where the manufacturer takes on something the customer cannot: continuous duty warranty cover, grid code certification and grid service market participation. Each requires accepting risk or completing work that benefits the customer more than the supplier, which is exactly why the positions are available. They carry margin far above equipment sales and reach a small number of sophisticated buyers.

Volume / Commodity-Adjacent

Conventional uninterruptible supply hardware and standalone harmonic filters sold on price against several capable manufacturers. Returns depend on component sourcing and manufacturing scale, and the segment is being displaced by capability enabled on equipment customers already own.
Gross Margin: 18 to 26%

Premium / Certified

Integrated compensation-capable systems specified from the outset against known connection obligations. The 10 point range reflects whether the comparison is against conventional backup equipment or against a backup supply plus a separate compensator.
Gross Margin: 30 to 40%

Sustainability / Regulatory / Next-Generation

Enablement licensing into installed equipment, continuous duty warranty products and grid service participation packages. The 22 point range reflects how completely software revenue without a bill of materials differs from anything else in this market.
Gross Margin: 48 to 70%
statcom-ups-market-portfolio-architecture-1788415847445

High-value Sub-segments and Strategic Watch-out

Installed Base Enablement Licensing

Revenue with no manufacturing cost, priced against a compensator costing eleven times as much, sold into equipment already paid for once. Knowing which installed units qualify is the practical obstacle rather than any technical one. Nothing else in this market compares on margin. Manufacturing cost is nil.
Gross Margin: 58 to 70%

Continuous Duty Warranty Products

Converts a refusal into a product, since only around 27% of the installed base currently carries cover and no operator proceeds without it. Condition monitoring evidence supports the pricing with data rather than with assumption. Opening cover creates differentiation rather than parity. Field data supports the pricing.
Gross Margin: 50 to 64%

Grid Service Participation Packages

Turns avoided cost into an earnings stream, which changes the internal argument at a customer entirely. Requires software and market participation capability that hardware manufacturers generally do not possess at all. Entrants from energy trading rather than electrical equipment are the real competition here. Software capability decides it.
Gross Margin: 46 to 60%

Conventional Backup Hardware

Sold on price against several capable manufacturers and increasingly displaced at the margin by capability enabled on installed equipment. Necessary volume that maintains the installed base enablement will later be sold into. It maintains the base that enablement is later sold into. Displacement is already visible.
Gross Margin: 18 to 26%

How Enablement Gets Approved

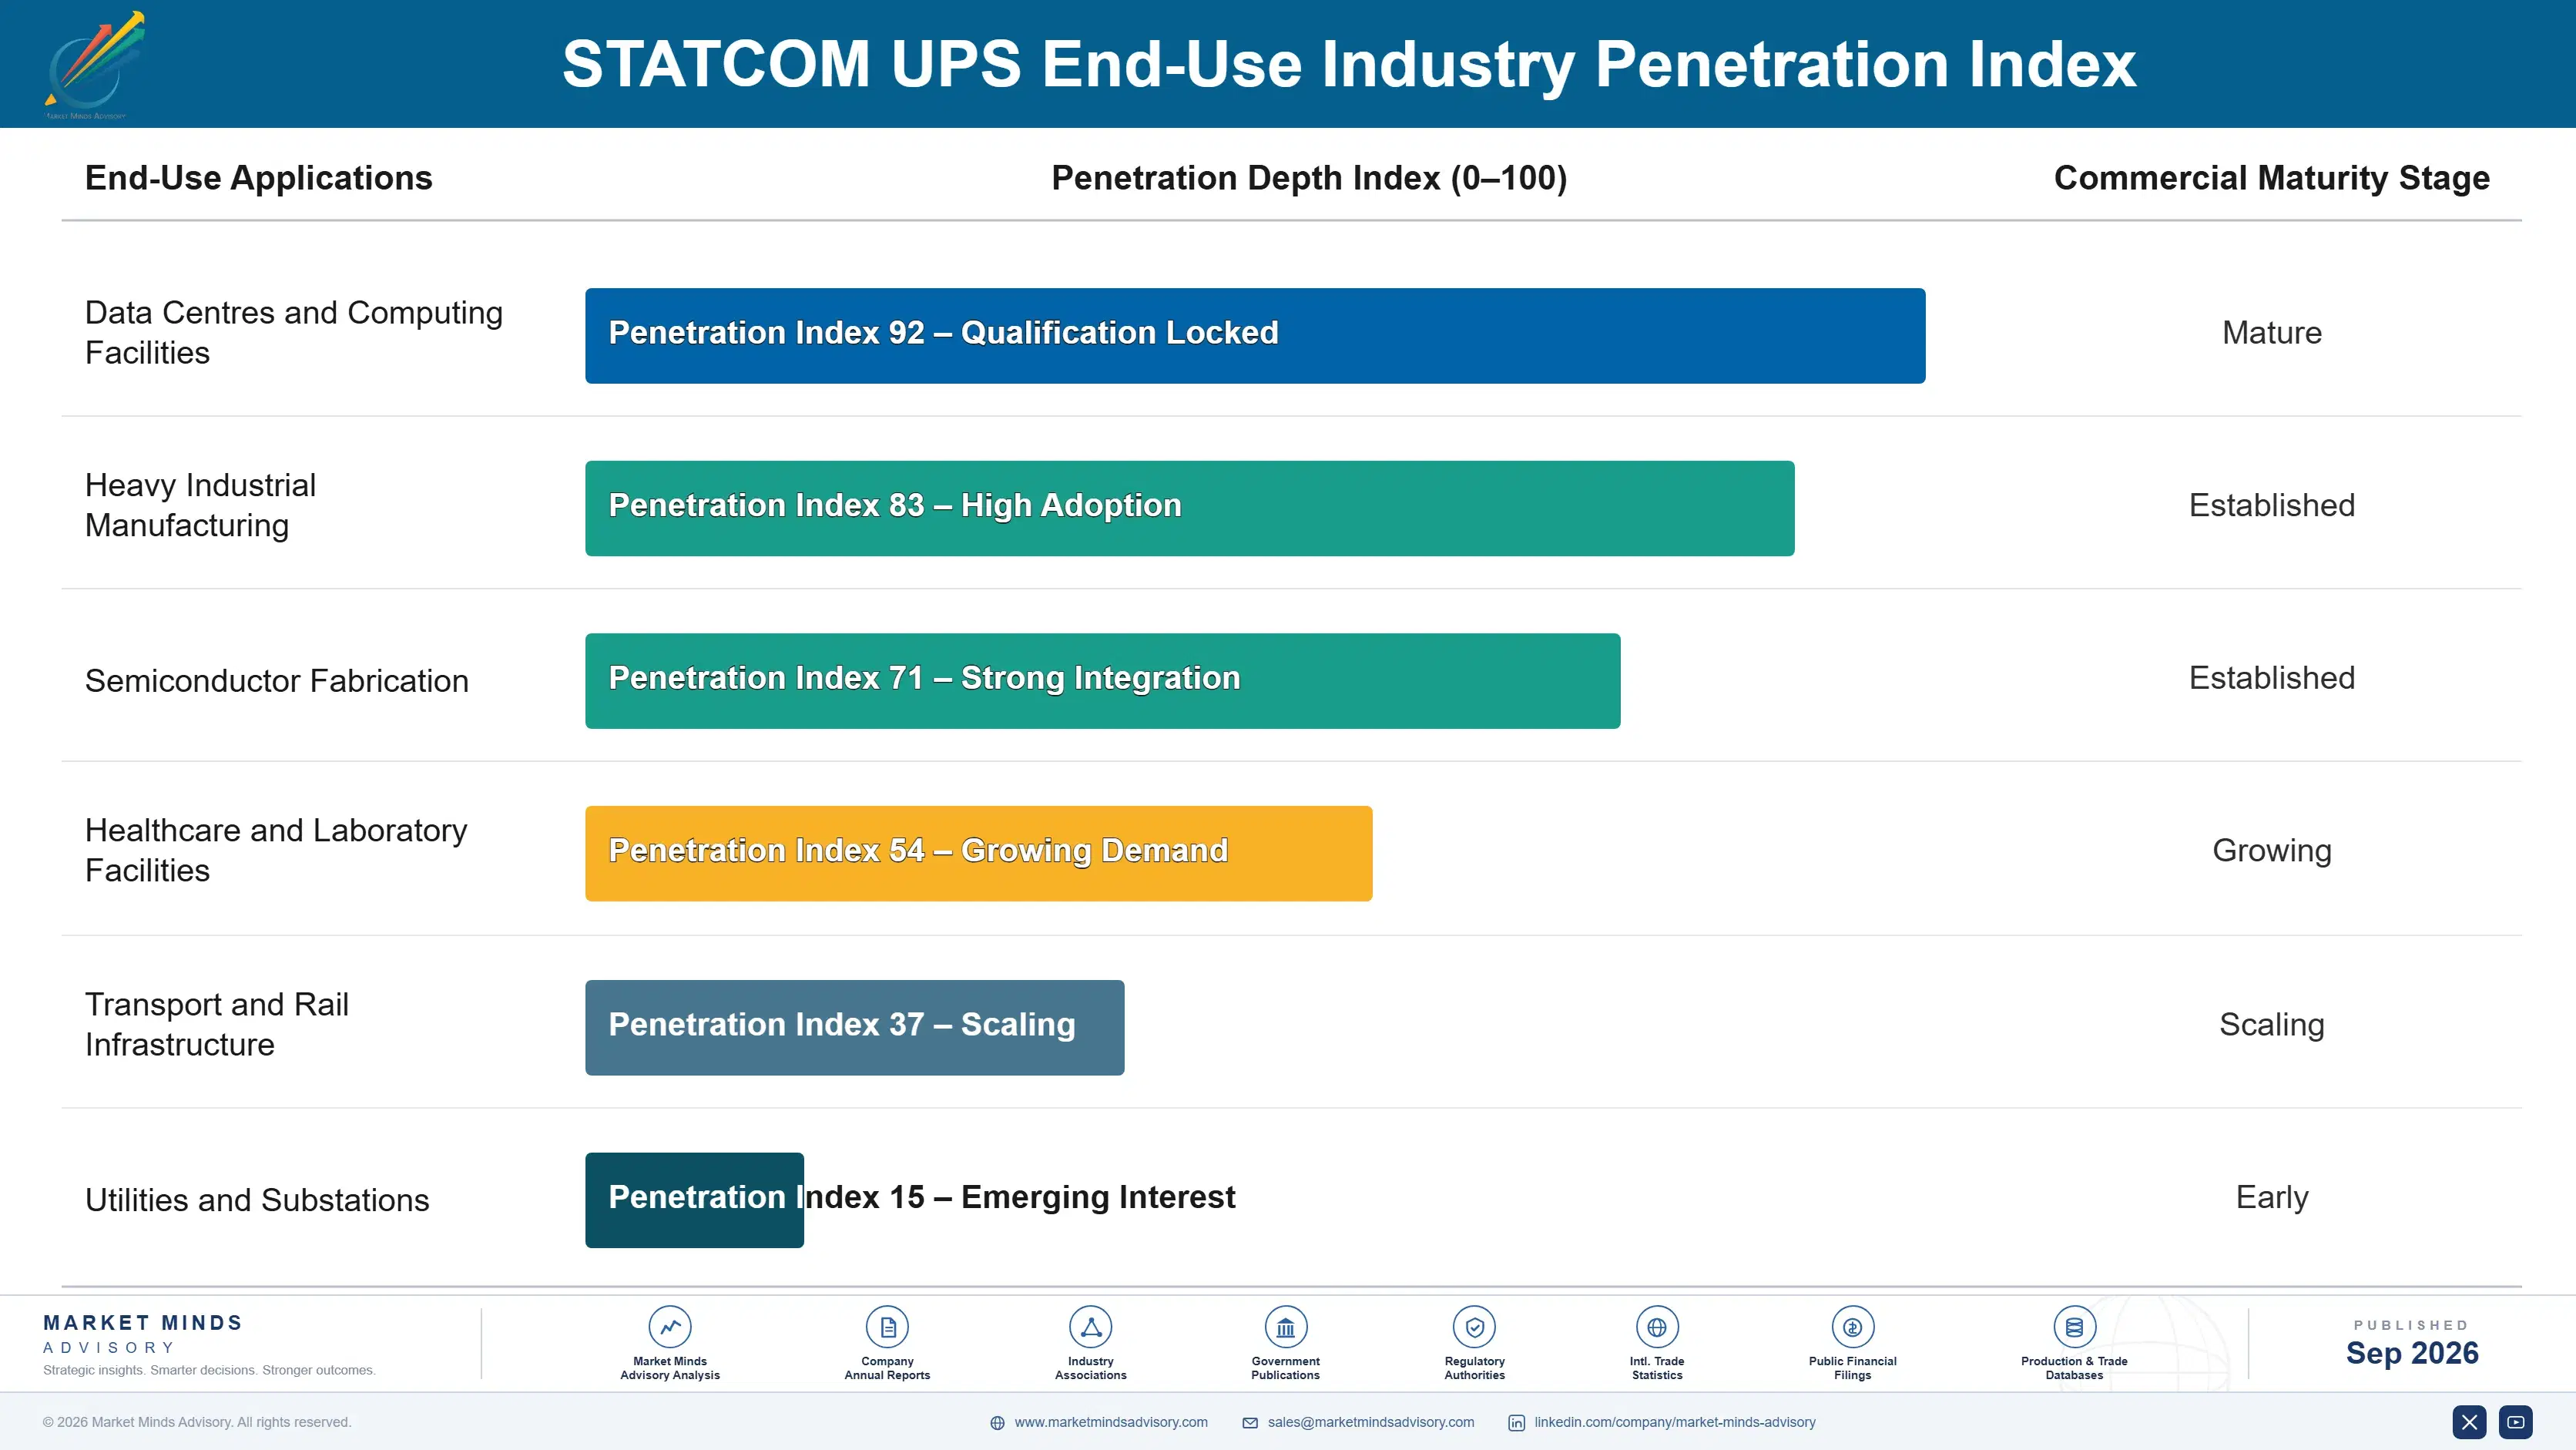
Annuity economics arrive through warranty and service rather than through equipment replacement, since continuous compensation duty requires cover that renews annually and condition monitoring that runs continuously. That converts a one-off enablement licence into a recurring relationship, which is quite unlike the traditional pattern where a manufacturer sees a customer at purchase and at end of life and rarely in between.
Adoption depth varies sharply by buyer type. Data centre operators with connection constraints specify deeply, involve their own electrical engineers and pursue grid service participation once enabled. Industrial sites want the power factor penalty removed and nothing more, and will not fund telemetry or certification beyond that. Facilities without a specific charge or obligation do not buy at all, however good the arithmetic looks, because nothing forces the conversation.

The buyer profile has moved from engineering to somewhere more useful. Compensation used to be discussed between power engineers who understood it and finance functions who did not fund it. It now reaches boards through connection permission and grid service revenue, both of which affect whether facilities get built and what they earn. That is a better conversation than reactive charges ever produced.
statcom-ups-market-end-use-penetration-index-1788415847932

Where Manufacturers Should Compete

These are among the four positions where our research anticipates prominent divergence between winners and laggards over the coming forecast period. Each is grounded in the demand model, the regulatory perimeter, and the announced capacity pipeline.
01 / INSTALLED BASE ENABLEMENT

Sell capability into machines already paid for

Retrofit control upgrades cost around 9% of a separate compensator, need no new hardware on modern platforms and address equipment the manufacturer has already been paid for once, which is pure licensing revenue against no manufacturing cost whatsoever. The segment grows at 21.9% against a market growing at 14.6%. The practical obstacle is knowing which installed units can support the capability, and most manufacturers cannot answer that from their own service records without doing a substantial amount of work first.
02 / WARRANTY POSITION CHANGE

Price the risk rather than refusing the duty

Only around 27% of the installed base carries warranty for continuous compensation operation, and no operator anywhere will run critical power equipment outside cover, whatever the reactive savings might be worth to them. A manufacturer that withholds warranty here is declining revenue rather than genuinely avoiding risk, since extended cover priced properly for the additional thermal duty converts that refusal directly into a saleable product. Whoever decides to open warranty first will also open all the demand sitting behind it.
03 / GRID CERTIFICATION TIMING

Qualify platforms before the requirements settle

Grid codes treat a compensating supply as a connected resource subject to fault ride-through obligations and full certification testing across two regulatory regimes that developed entirely separately from one another. Certifying flagship platforms rather than whole product ranges keeps the cost manageable while producing a qualification that competitors then need years to match afterwards. It also places the manufacturer in the conversation with system operators about what those requirements should reasonably be, which is worth more than the certification itself.
04 / GRID REVENUE PACKAGING

Sell an earnings stream, not avoided reactive charges

System operators paying for reactive support and frequency response turn a cost avoidance argument into a revenue line, which receives an entirely different reception inside any customer organisation than cost avoidance does. Participation needs metering, telemetry, aggregation across roughly five sites and resource certification, none of which any standard equipment provides today at all. Very few manufacturers anywhere hold the software and market participation capability required, and those that do currently face almost no competition at all in doing it.

Engagement Snapshot From the Field

A live engagement with an industry participant carrying material or product regulatory and market exposure ahead of a defining policy shift, showing how our research translates into a defensible multi-year portfolio strategy.
MARKET MINDS ADVISORY · CLIENT ENGAGEMENT SUMMARY
STATCOM UPS Producer Strategic Portfolio Review and Transition Roadmap 2026·Investment Scenario on STATCOM UPS Exposure Evaluation 2025-26
CLIENT PROFILE
A European manufacturer of uninterruptible power supply systems and power quality equipment, with annual group revenue reported at approximately USD 480 million (client-reported, unverified by MMA). The business sold backup systems and standalone harmonic filters entirely separately, and had never once offered compensation capability on installed equipment to any customer anywhere in the world at all.
STRATEGIC CHALLENGE
Customers were increasingly asking whether existing equipment could satisfy new connection obligations, and the company had no answer and no commercial position. Internally, the power quality business objected to any enablement offer on the grounds it would displace filter sales. Nobody had quantified either the opportunity or the cannibalisation. Both numbers were guesses.
MMA APPROACH
MMA sized the client's own installed base by platform capability, quantified enablement revenue against the filter sales it would displace, and assessed the warranty exposure that continuous duty would create using field failure data from the client's own service records rather than from any manufacturer assumption. Competitor warranty terms were compared.
KEY FINDINGS
  1. Roughly 62% of inverter capacity across the client's installed base sat idle at typical loading and was technically capable of compensation on the more recent platforms.
  2. Enablement revenue would exceed displaced filter revenue by a wide margin, because the addressable installed base was far larger than annual filter sales had ever reached.
  3. Field failure data showed thermal margin adequate for continuous partial reactive duty on two platforms, which the engineering function had assumed without ever testing.
  4. Only around 27% of comparable installed equipment across the market carried continuous duty warranty, so opening cover would create genuine differentiation rather than matching competitors.
CLIENT PROFILE
A European manufacturer of uninterruptible power supply systems and power quality equipment, with annual group revenue reported at approximately USD 480 million (client-reported, unverified by MMA). The business sold backup systems and standalone harmonic filters entirely separately, and had never once offered compensation capability on installed equipment to any customer anywhere in the world at all.
STRATEGIC CHALLENGE
Customers were increasingly asking whether existing equipment could satisfy new connection obligations, and the company had no answer and no commercial position. Internally, the power quality business objected to any enablement offer on the grounds it would displace filter sales. Nobody had quantified either the opportunity or the cannibalisation. Both numbers were guesses.
MMA APPROACH
MMA sized the client's own installed base by platform capability, quantified enablement revenue against the filter sales it would displace, and assessed the warranty exposure that continuous duty would create using field failure data from the client's own service records rather than from any manufacturer assumption. Competitor warranty terms were compared.
KEY FINDINGS
  1. Roughly 62% of inverter capacity across the client's installed base sat idle at typical loading and was technically capable of compensation on the more recent platforms.
  2. Enablement revenue would exceed displaced filter revenue by a wide margin, because the addressable installed base was far larger than annual filter sales had ever reached.
  3. Field failure data showed thermal margin adequate for continuous partial reactive duty on two platforms, which the engineering function had assumed without ever testing.
  4. Only around 27% of comparable installed equipment across the market carried continuous duty warranty, so opening cover would create genuine differentiation rather than matching competitors.
RECOMMENDED STRATEGY
Phase 1: Phase one: build installed base intelligence identifying which units can support enablement, since service records could not answer that question at all. Phase 2: Phase two: launch enablement licensing with published continuous duty warranty terms rather than handling each site as an individual exception. Phase 3: Phase three: develop grid service participation packaging for customers operating several sites, aggregating their capacity into a single marketable resource.
OUTCOME
Within fourteen months the client had enabled compensation across a substantial portion of its own installed base, published warranty terms, and reported services revenue up 34% (client-reported, unverified by MMA). Filter sales declined broadly as expected, and total gross profit rose considerably across the period.

Frequently Asked Questions

Foundational context covering the market sizes, CAGR, scope, country, region and competition that inform every finding below. This section is provided to cover basics and most often pre-purchase conversations, answered from the MMA Primary Research Dataset.

What is the current size of the STATCOM UPS Market?

The market was valued at USD 0.7 billion in 2025 and reaches USD 0.80 billion in 2026. Grid connection obligations rather than energy efficiency drive most of the current demand.

How large will the STATCOM UPS Market be by 2036?

MMA forecasts USD 3.13 billion by 2036, an increase of USD 2.33 billion over the 2026 base. That represents an expansion multiple of 3.91 times.

What is the CAGR for the STATCOM UPS Market 2026 to 2036?

The base case CAGR is 14.6%, with a bull case of 15.8% and a bear case of 13.4%. The historical rate between 2020 and 2025 was 13.4%.

Which segment is growing fastest?

Retrofit control upgrades to installed systems grow at 21.9%, half again the market rate of 14.6%. They cost around a tenth of a separate compensator installation.

Who are the major companies in the STATCOM UPS Market?

Schneider Electric, Vertiv, Eaton, ABB and Huawei Digital Power lead on measured shipment revenue. Together they account for roughly 63% of a concentrated global market.

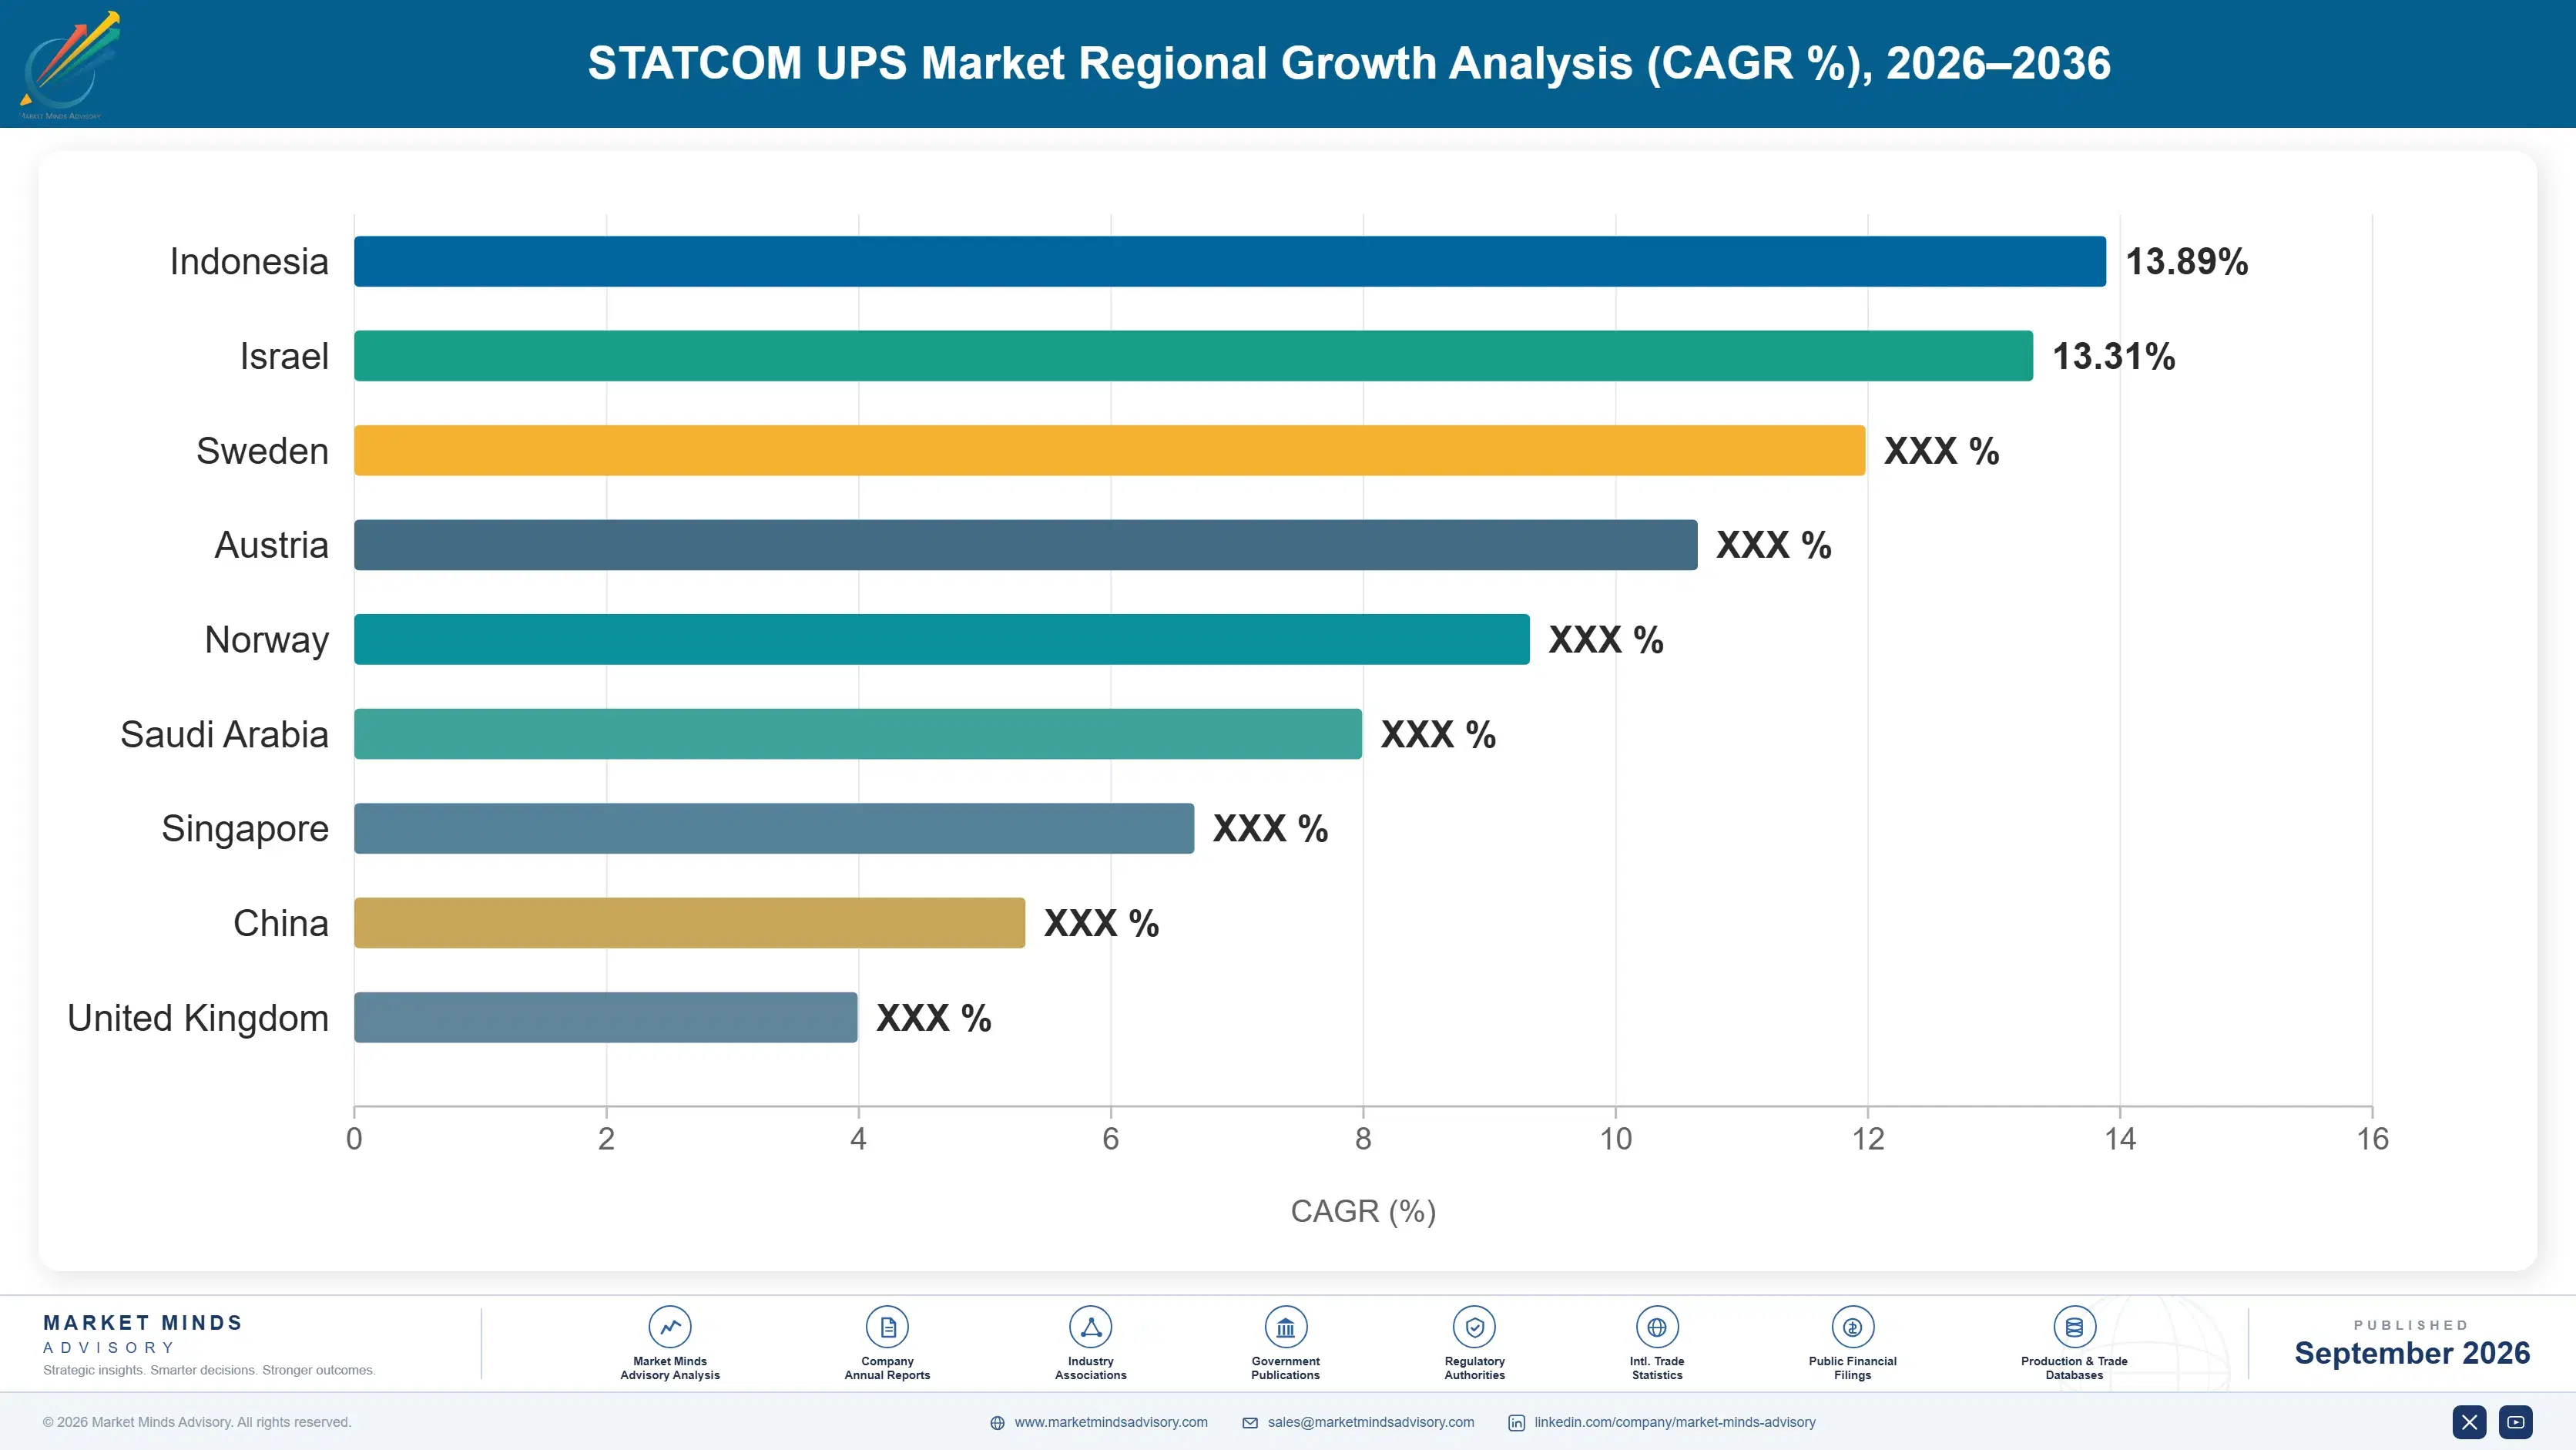
Which country is growing fastest?

Ireland grows fastest at 19.8%, because grid connection constraints there are the most severe anywhere and large load operators must demonstrate genuinely good network behaviour.

Report Segmentation Architecture

The full report scope spans multiple orthogonal segmentation dimensions, with cross-tabulated demand data provided for each dimension pair. Coverage extends further to regional breakdowns, trend trajectories, and the competitive detail needed to support segment-level decision-making.

By Product Configuration

  • Retrofit Control Upgrades to Installed Systems
  • Integrated Compensation-Capable Systems
  • Modular Scalable Systems
  • Active Harmonic Filters with Backup
  • Rotary and Flywheel Hybrid Systems
  • Medium Voltage Systems

By End-Use Industry

  • Data Centres and Computing Facilities
  • Heavy Industrial Manufacturing
  • Semiconductor Fabrication
  • Healthcare and Laboratory Facilities
  • Transport and Rail Infrastructure
  • Utilities and Substations

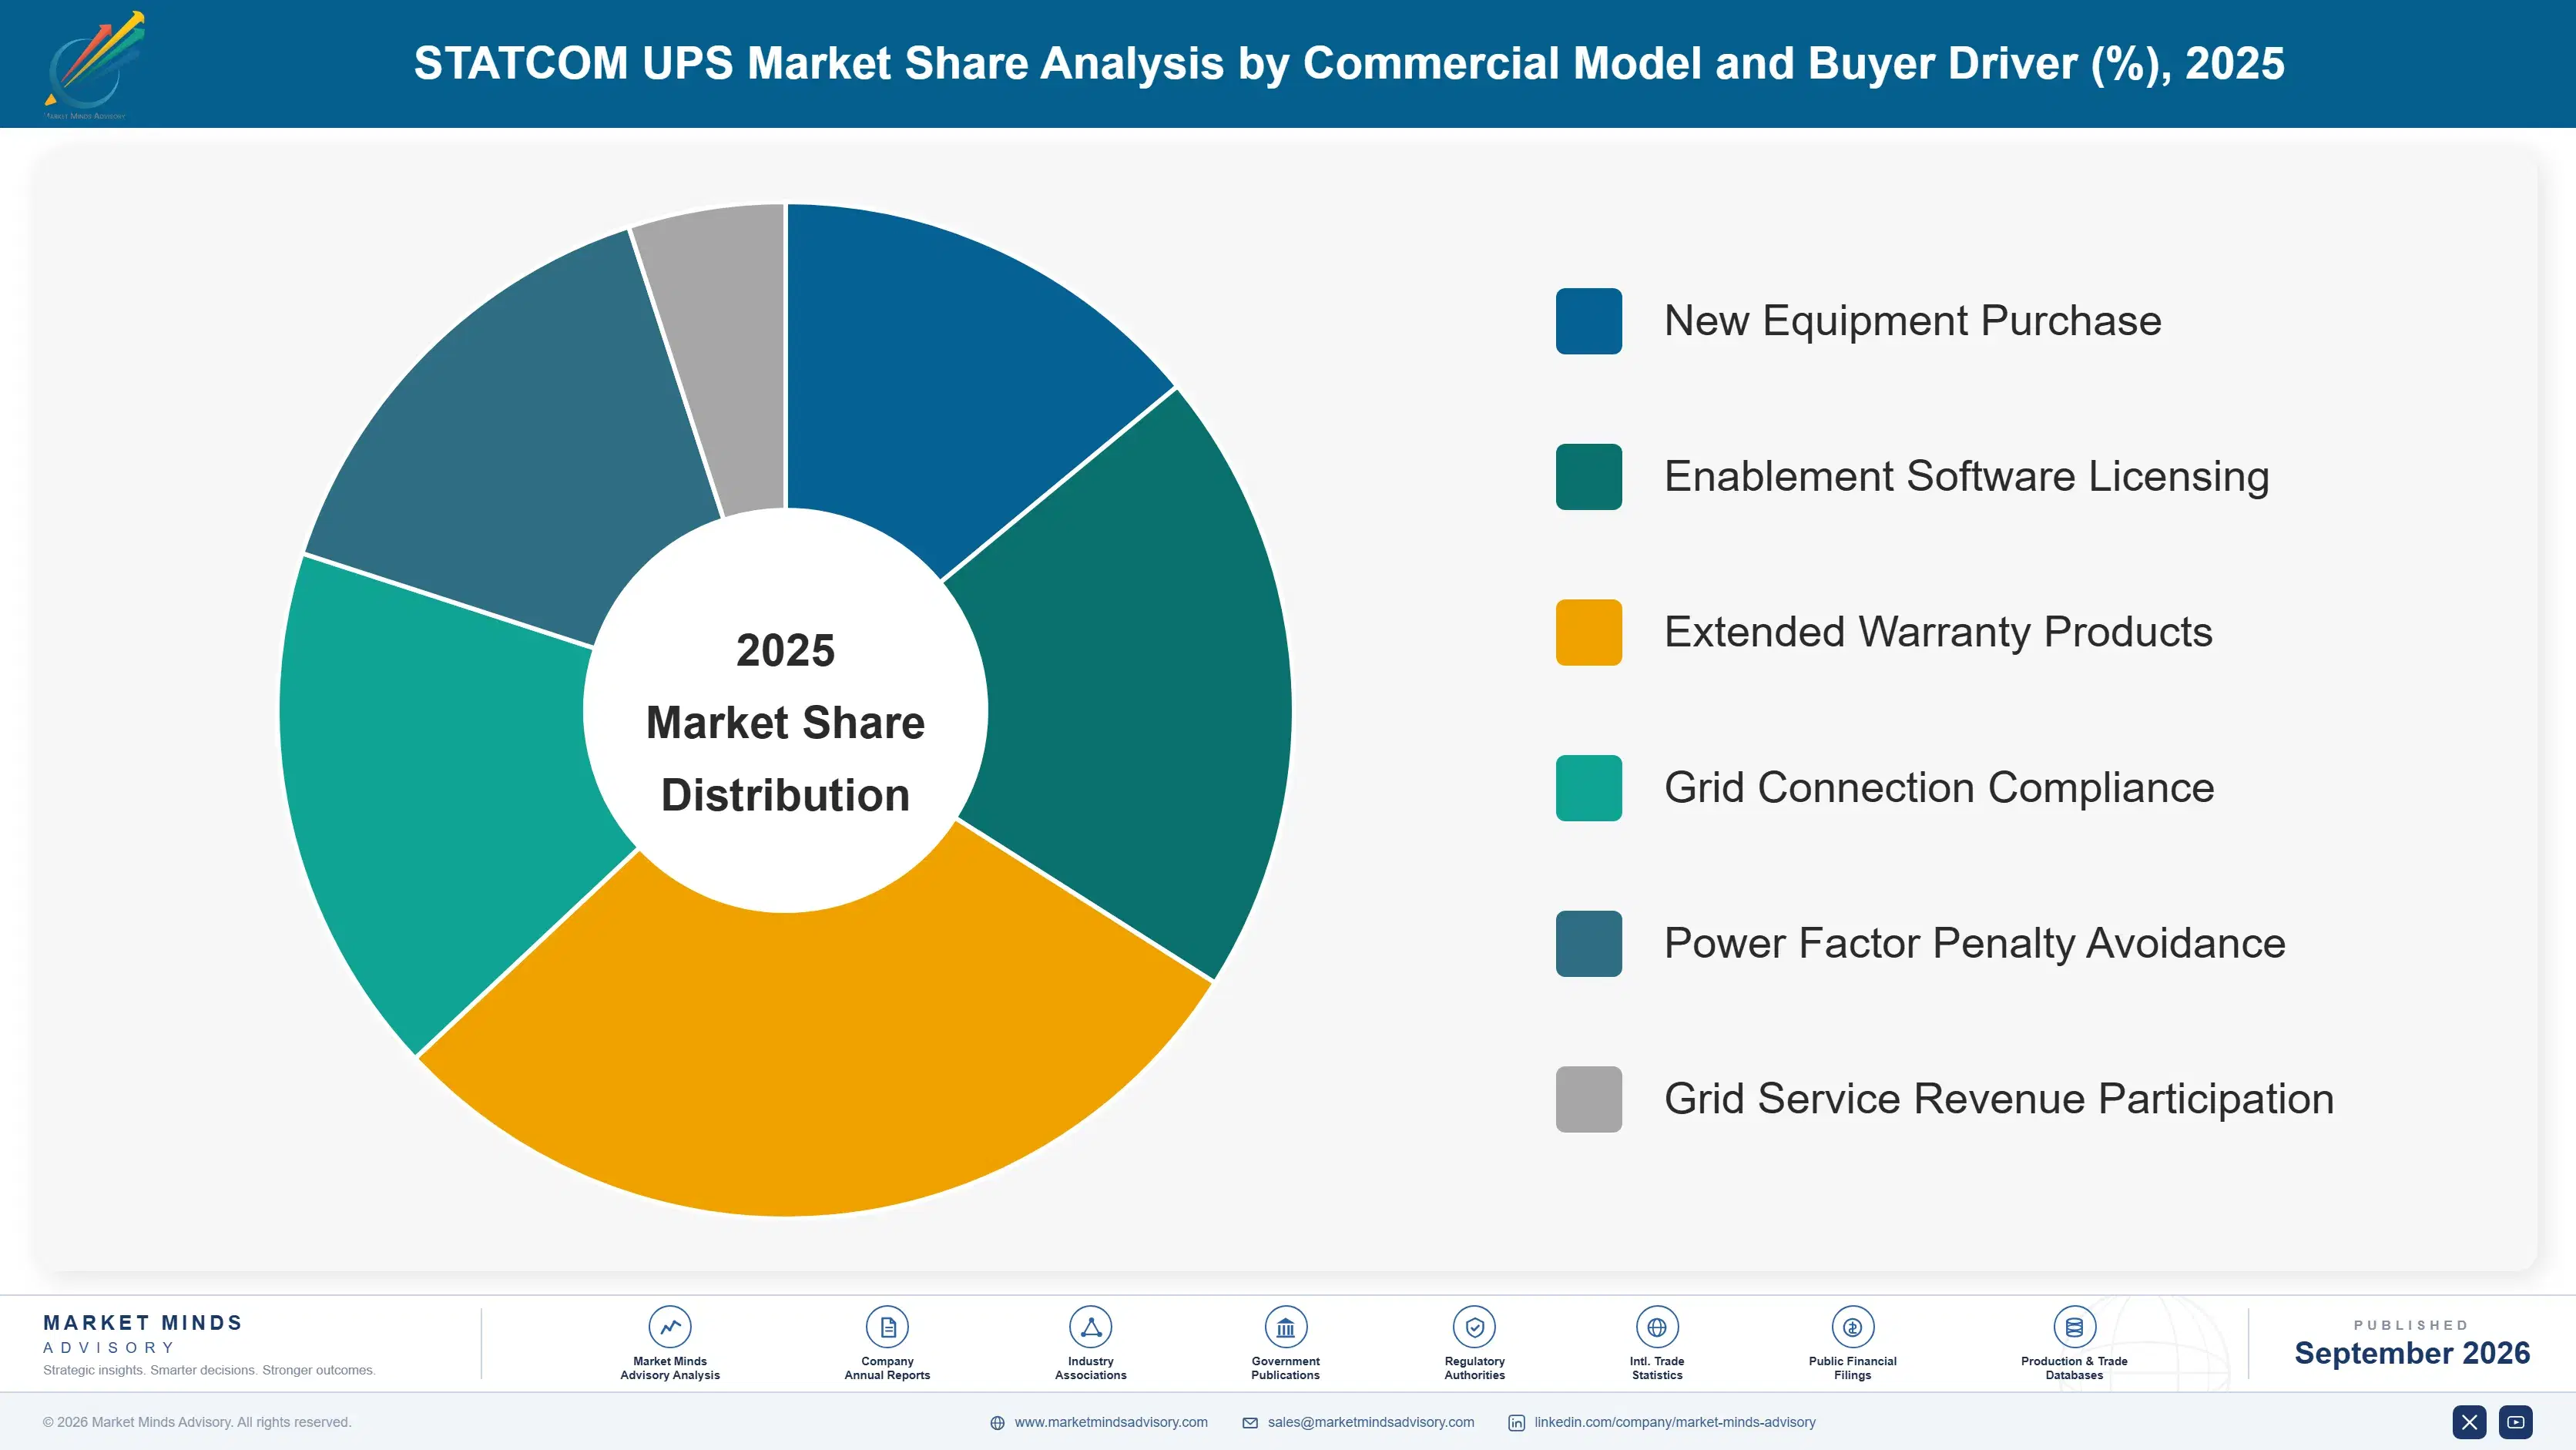
By Commercial Model and Buyer Driver

  • New Equipment Purchase
  • Enablement Software Licensing
  • Extended Warranty Products
  • Grid Connection Compliance
  • Power Factor Penalty Avoidance
  • Grid Service Revenue Participation

By Region

  • East Asia
  • North America
  • Western Europe
  • South Asia and Pacific
  • Middle East and Africa
  • Latin America
  • Eastern Europe

Scope, Methodology, and Coverage

Every figure in this report is reproducible from documented input assumptions. The scope below maps the historical period, the forecast horizon, the segmentation dimensions, and the countries covered, alongside the underlying primary and qualitative methodology.
Historical Period
2020 to 2025
Forecast Period
2026 to 2036
Base Year
2025 (USD billions; MMA Primary Research Dataset, September 2026)
Market Definition
The STATCOM uninterruptible power supply market covers systems whose inverters provide continuous dynamic reactive compensation, voltage support and harmonic mitigation to the connected network alongside backup power, spanning retrofit control upgrades to installed units, integrated compensation-capable systems, modular scalable designs, active harmonic filters with backup, rotary and flywheel hybrids, and medium voltage systems. Sizing is measured at manufacturer revenue including enablement software. Conventional backup-only supplies, standalone static compensators, batteries, generators and switchgear are excluded.
Quantitative Units
USD millions at manufacturer revenue including enablement software, with supporting installed capacity in megavolt-amperes reactive by region
Segmentation Dimensions
Product configuration, end-use industry, commercial model and buyer driver, region
Regions Covered
East Asia, North America, Western Europe, South Asia and Pacific, Middle East and Africa, Latin America, Eastern Europe
Countries Covered
China, Japan, South Korea, India, Singapore, Malaysia, Australia, United States, Canada, Mexico, Brazil, Ireland, Netherlands, Germany, United Kingdom, Poland, Saudi Arabia, United Arab Emirates
Key Companies Profiled
Schneider Electric, Vertiv, Eaton, ABB, Huawei Digital Power, Delta Electronics, Legrand, Socomec, Riello Elettronica, Kehua Data, East Group, Toshiba Mitsubishi-Electric Industrial Systems, Mitsubishi Electric, Piller Power Systems, Hitec Power Protection, Rolls-Royce Power Systems, Borri, GE Vernova, Cummins, Fuji Electric
Quantitative Methodology
Primary survey, n=3,800 respondents, Q4 2025, six countries; demand-side model with trade association cross-validation
Qualitative Methodology
47 expert interviews, Q4 2025; applied to validate demand model assumptions, identify emerging dynamics, and assess competitive positioning
Report Format
PDF and XLSX data workbook (Word format preview document)
Publisher
Market Minds Advisory
Report Code
MMA-2026-ENE-581
Published
September 2026
Contact
sales@marketmindsadvisory.com | www.marketmindsadvisory.com

Purchase the full STATCOM UPS Market Report (2026 to 2036).

The full report treats this as monetisation of idle inverter capacity rather than as a new equipment category, which is the framing that explains why retrofit rather than new build carries the growth. It sizes six product configurations with individual growth rates, seven regions built from connection constraints and reactive charging regimes, and the warranty coverage that actually gates adoption. Competitive analysis covers twenty manufacturers on a consistent revenue basis, with installed base reach and continuous duty warranty policy treated as the decisive variables. Input cost modelling breaks out semiconductor, magnetics and capacitor exposure by product architecture.
Six product configurations with individual growth rates
Idle inverter capacity quantified across installed base
Warranty coverage mapped against adoption barriers
Grid connection obligations traced by system operator
Twenty manufacturers on consistent revenue basis
Semiconductor, magnetics and capacitor cost exposure

Built For The People Who Decide

From boardroom strategy to bench-side execution, this report is read cover-to-cover by leaders shaping the next decade of their industry, turning demand scenarios, market dynamics and valuation benchmarks into decisions.
CXOs/ Presidents/ VPs/ Managers
M&A and Corporate Development
Strategy Teams and R&D Heads
Procurement and Product Directors
Regulatory and Compliance Leaders
Investor Relations and Equity Analysts