

Market Minds Advisory
Starter Feed Market

Starter Feed Market: The Payback Lands Years Later in Somebody Else's Budget

Eight weeks of feeding decides how much milk a heifer gives three years later, and the farm buying the bag almost never connects the two, which is why the best product loses on price.

Lead Analyst

Lisa Gevelber

Published

September 2026

Make Smarter Decisions with Customized Research Insights

Request a free sample report and evaluate market opportunities, growth trends, and competitive dynamics relevant to your business needs.

2025 MARKET VALUE$24.6BMarket Size 2025
2036 FORECAST VALUE$43.9BBase Case , 2026 to 2036
CAGR 2026 TO 20365.4 %Bull 6.6% / Bear 4.2%
INCREMENTAL OPPORTUNITY$17.9BNet 10- year value creation
EXPANSION MULTIPLE1.69x2036 value over 2026 base
Strategic Levers
M&A Pipeline
Regional Outlook
Country Rankings
Competitive Intelligence
Segmental Deep-dive
Call-Us : 91 93563 13602

Executive Snapshot and Market Trajectory

Starter feed is bought by the bag and works like an investment. Pre-weaning growth in the first eight weeks sets rumen development and lifetime performance, with roughly 1,100 kilograms of additional milk per kilogram of extra daily gain, and that return arrives three years later.
The buyer almost never sees the connection. A farm comparing starter feed at over three times the price per tonne of a growing ration is looking at a cost, not at an asset it will milk for five lactations. Every supplier knows the response data and very few have found a way to make a purchasing decision respond to it. The data has been published for twenty years.
Formulation got harder at the same time. Withdrawing pharmacological zinc oxide removed the reliable answer to post-weaning piglet diarrhoea, and the replacements cost more and work less consistently. Piglet starter grows fastest at 8.1%, and dairy derived lactose now carries around 34% of its cost, which ties this feed to dairy markets rather than to grain. Producers watching cereal prices are watching the wrong market entirely. Grain markets tell them almost nothing about this cost.
Market Definition
Compound starter feed formulated for young animals through the weaning transition, covering calf starter, piglet starter and creep feed, chick starter, lamb and kid starter, aquaculture fry and fingerling starter, and foal and other species starter. Measured at manufacturer selling value. Excludes liquid milk replacers, grower and finisher rations, forage additives and silage inoculants, standalone feed additives sold separately, and veterinary medicinal products.
Base Year Value
$24.6B in 2025 (MMA Primary Research Dataset, August 2026)
Forecast Period
2026 to 2036, eleven discrete annual values
CAGR
5.4% base case. Bull 6.6%. Bear 4.2%.
Fastest Growth Segment
Piglet Starter and Creep Feed: 8.1% CAGR
Fastest Growth Country
Vietnam: 10.2% CAGR
Fastest Growth Region
South Asia and Pacific: 7.4% CAGR
Largest Region
East Asia: 30% of 2025 global value
Market Leaders
Cargill, Nutreco, ForFarmers, De Heus, Alltech. Source: MMA Primary Research Dataset, July 2026.
Primary Survey
n=3,800 procurement and R&D decision-makers, Q4 2025, six countries
Methodology
Demand-side build-up, cross-validated against public data, 47 expert interviews

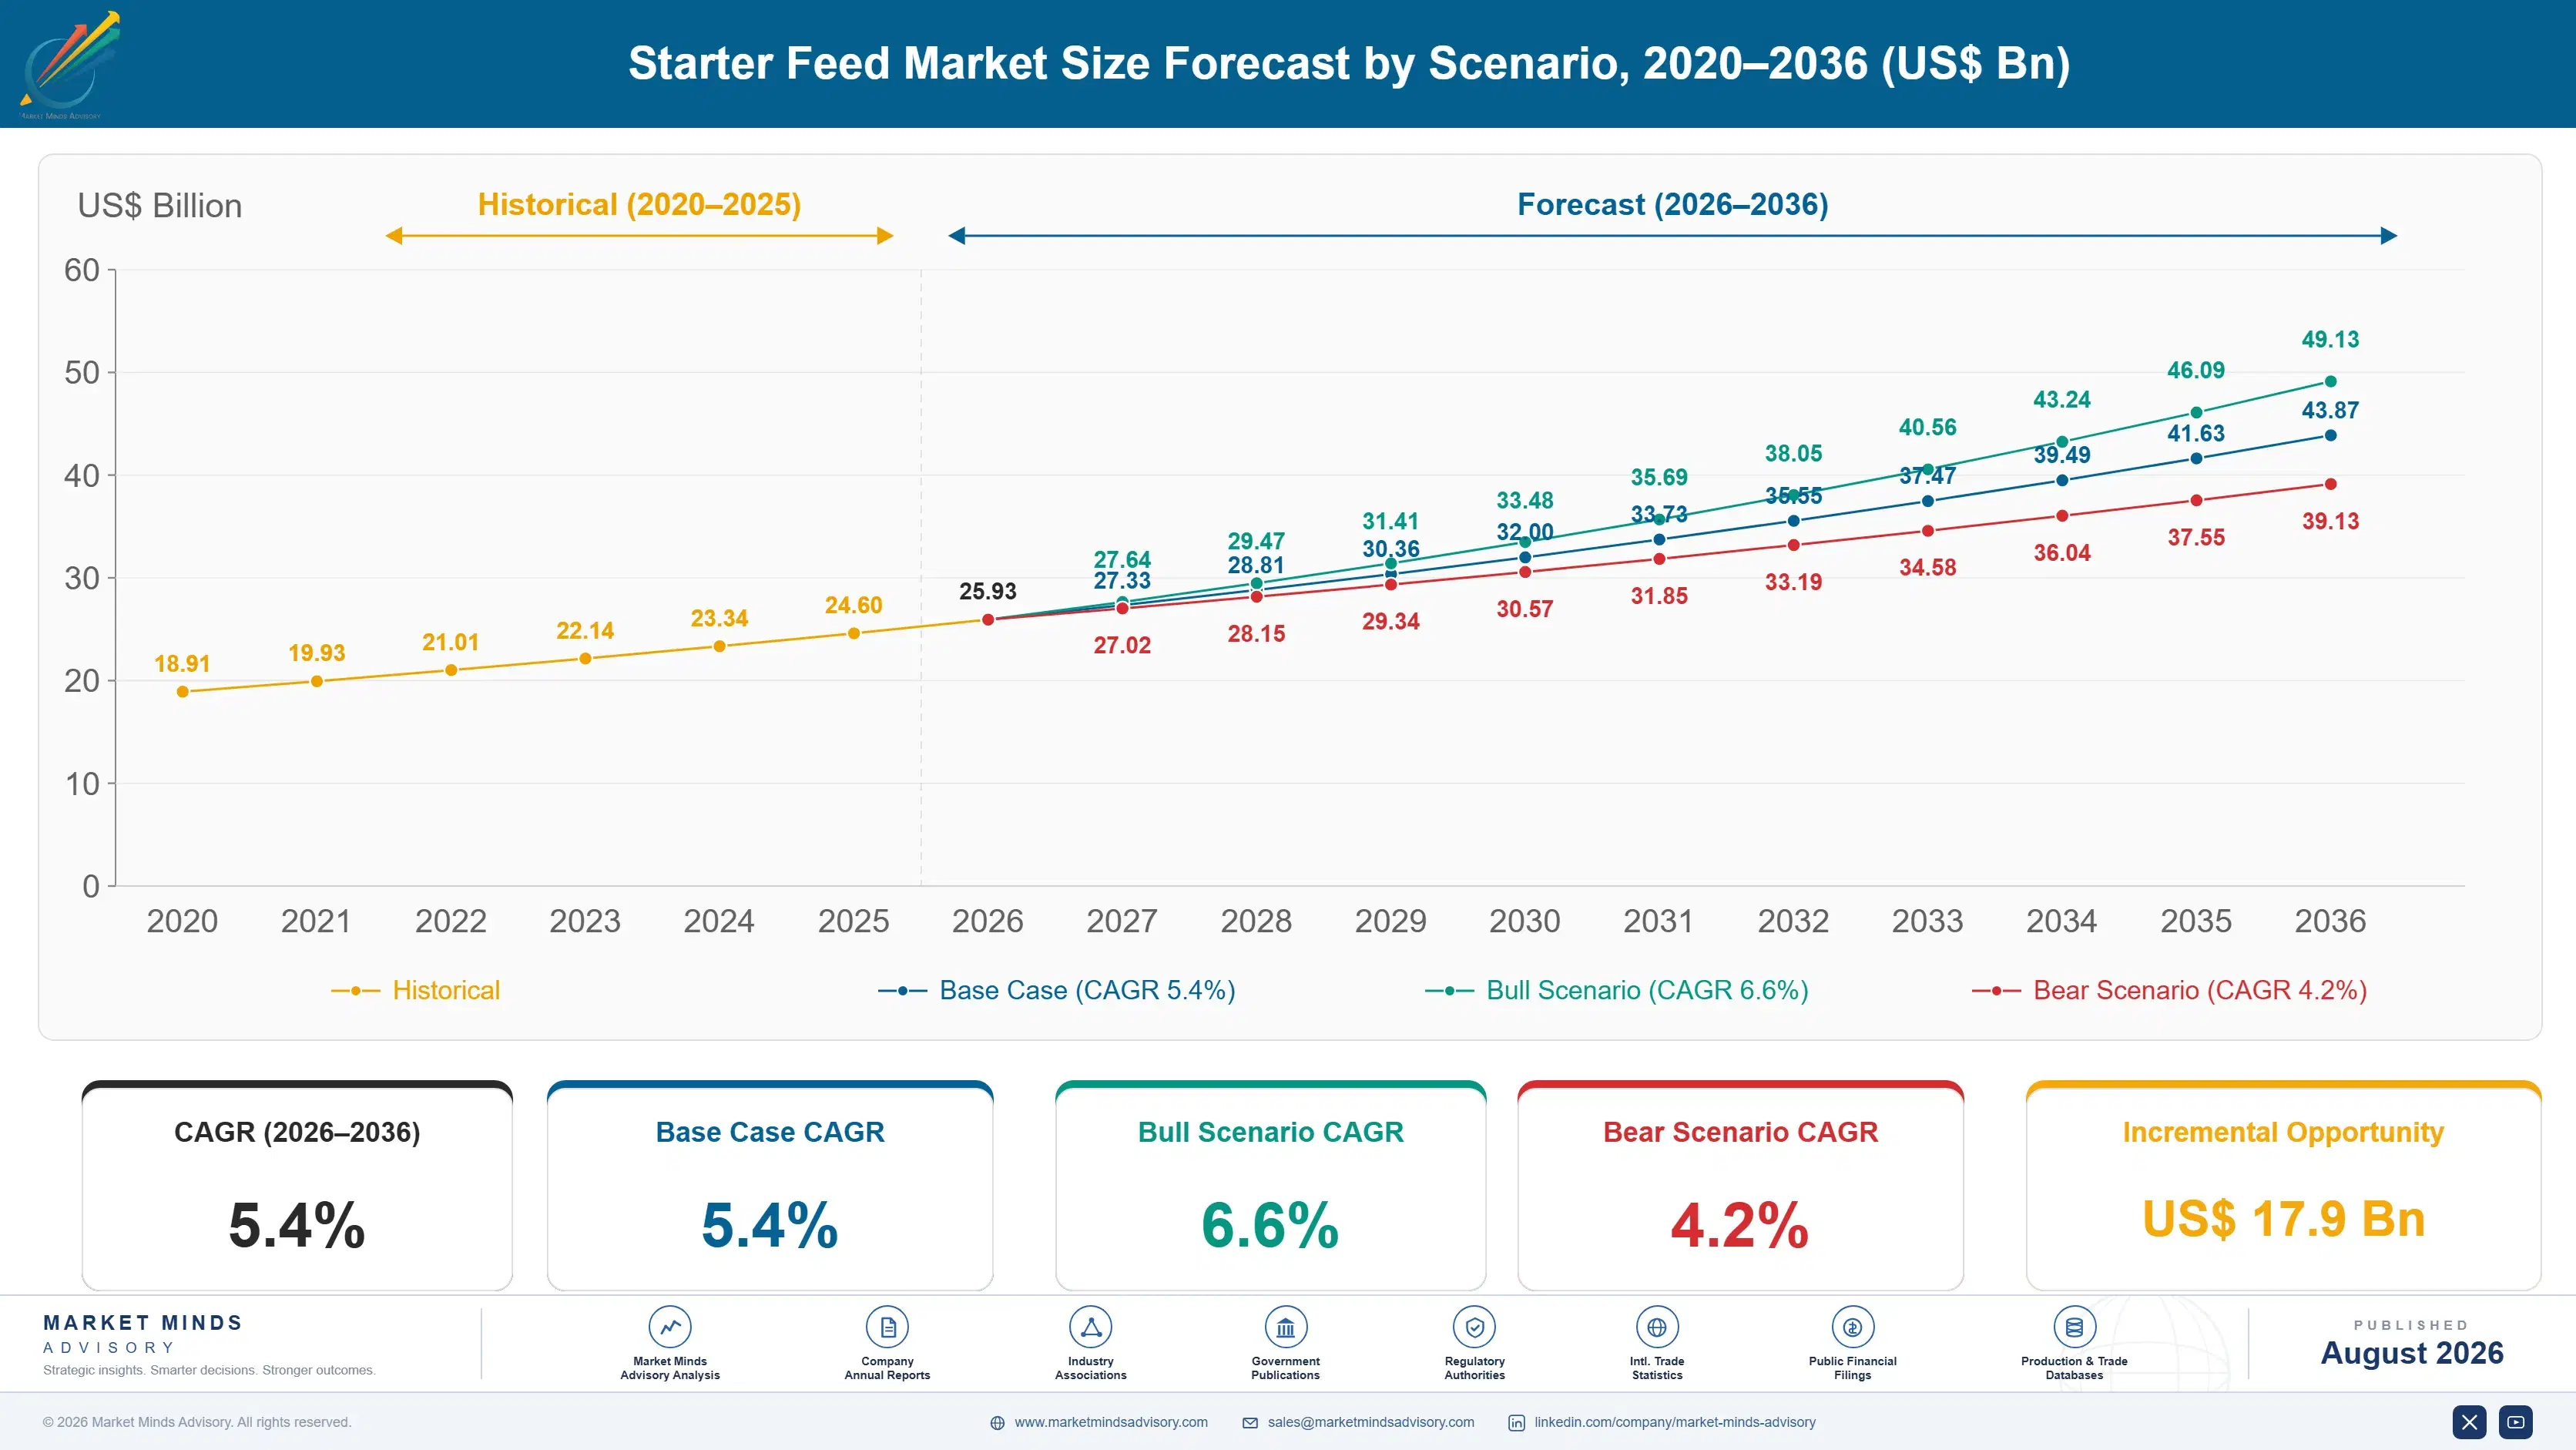
Starter Feed Market Forecast Scenarios

starter-feed-market-trends-size-forecast-scenario-1787595405794
Growth ran near 4.6% between 2020 and 2025, and formulation cost rose considerably faster than volume did. Withdrawal of pharmacological zinc oxide across European piglet production forced reformulation onto organic acids, specialty proteins and plant extracts that cost more and performed less consistently. Dairy commodity pricing drove starter feed cost movements more than grain did, which surprised buyers accustomed to watching cereal markets.
Base case 5.4% rests on three mechanisms. Piglet starter and creep feed grows at 8.1% as antibiotic and zinc oxide restrictions spread beyond Europe and force higher specification formulation everywhere. Aquaculture fry and fingerling starter grows at 7.4% on species diversification and intensified hatchery production. And Vietnam grows fastest of any country at 10.2% on pig herd rebuilding alongside aquaculture expansion. Two of the three depend on production system change rather than herd growth.
The bull case at 6.6% assumes automated feeder data reaching enough dairy farms that pre-weaning growth response becomes visible at farm level, which would change how starter feed is valued. The bear case at 4.2% is continued price led purchasing pushing farms toward cheaper formulations, particularly where restrictions on growth promoters are not enforced consistently.

Eight Weeks That Decide Five Lactations

The nutritional case here has been settled for years and the commercial case still is not. Pre-weaning growth drives rumen papillae development and lifetime productivity, with published response near 1,100 kilograms of additional milk across a first lactation for each extra kilogram of daily gain before weaning. Eight weeks of feeding shapes five years of output, and the farm buying it sees a bag price rather than an asset.
TOP FIVE CONCENTRATION27%Regional feed millers hold most of the manufacturing capacity
LIFETIME MILK RESPONSE1,100 kgExtra yield per kilogram of additional pre-weaning daily gain
DAIRY INGREDIENT COST SHARE34%Lactose and whey portion of piglet starter feed cost
STARTER FEEDING PERIOD8 weeksTime a young animal remains on starter formulation
PRICE AGAINST GROWER FEED3.1xCost per tonne relative to conventional growing rations
AUTOMATED FEEDER PENETRATION19%Dairy farms recording individual intake through automated feeding systems
That gap is not stupidity, it is accounting. Starter feed costs over three times per tonne what a growing ration does, and the benefit appears three years later in a milk cheque nobody traces back to a purchase made when the animal was a calf. Suppliers have all the response data and almost none of them have found a way to make the purchasing decision respond to it.
Formulation has also become genuinely difficult. Pharmacological zinc oxide was the reliable answer to post-weaning piglet diarrhoea and its withdrawal left organic acids, specialty proteins, yeast fractions and plant extracts that cost more and work less consistently. Dairy derived lactose now carries around 34% of piglet starter cost, which means this feed tracks dairy commodity markets rather than the grain prices everybody watches.
"Show a dairy farmer the milk response curve and they agree entirely, then buy on price per tonne the following week because that is the number their accountant sees. The automated feeders changing that are the most commercially important development in this market and almost nobody sells against them."
Director, Animal Nutrition and Livestock Systems Practice · MMA Agriculture and Food Practice · August 2026

Market Trends

Growth promoter withdrawal forcing higher specification formulation

Pharmacological zinc oxide was withdrawn across European piglet production and antibiotic growth promoter restrictions continue spreading, which removed the reliable answer to post-weaning diarrhoea and left formulators combining organic acids, specialty proteins, yeast fractions and plant extracts at higher cost and lower consistency. Piglet starter grows at 8.1% on that reformulation rather than on any expansion in pig numbers. Technical support during the weaning transition now matters more to outcomes than the bag price ever did. Suppliers without field nutrition capability are competing on a bag price for a product whose outcome the bag no longer controls.
Market Impact: Vietnam growing fastest at 10.2%

Automated feeders making individual intake visible at last

Automated calf feeding systems now reach around 19% of dairy farms in developed markets and record individual intake and growth for every animal, which is the first time a farm can actually observe the response its starter feed produces. That turns a published research finding into something a farmer sees on a screen weekly. Suppliers who work with that data hold an argument that no amount of technical literature has ever managed to deliver on its own. Farms with that data buy on measured response and pay materially more for formulations that demonstrate results on their own animals.
Market Impact: Delivers 1,100 kg milk response

Market Opportunities and Growth Drivers

Asian pig herd rebuilding alongside intensifying production systems

Vietnam grows fastest of any country at 10.2% as pig herd rebuilding continues alongside a shift from smallholder to commercial production systems that buy compound feed rather than mixing on farm. Commercial systems wean earlier and require proper starter formulation to manage the transition, which converts herd growth into disproportionate starter feed demand. Aquaculture expansion across the same markets adds fry and fingerling starter volume growing at 7.4% behind it. Compound feed penetration rises faster than animal numbers do in that transition, which makes the demand growth considerably steeper than herd statistics suggest.
Market Impact: Return arrives 3 years later

Heifer rearing cost pressure raising interest in growth response

Rearing a replacement heifer to first calving is among the largest single costs on a dairy farm and returns nothing until she milks, which has pushed producers to shorten the rearing period through better early growth. Pre-weaning gain near 1,100 kilograms of lifetime milk response per kilogram of daily gain also brings first calving forward. That combination gives starter feed a cash flow argument alongside the productivity one, and cash flow arguments land better. Very few suppliers lead with the cash flow argument despite holding all the data required to make it convincingly.
Market Impact: Dairy carries 34% of cost

Market Restraints and Challenges

Purchase decision separated from the return by three years

Starter feed costs over three times per tonne what a growing ration does and delivers its benefit across a lactation beginning roughly three years after purchase, in a revenue line nobody connects back to the bag. The root cause is farm accounting rather than any disagreement about the science. Commercially it means the best product frequently loses to the cheapest one. Automated feeder data and rearing cost framing are the mitigations that actually shift purchasing behaviour. Neither has yet reached most of the farms buying this product. Both are spreading slowly rather than quickly.
Market Impact: Piglet starter growing at 8.1%

Dairy ingredient pricing driving cost beyond formulator control

Lactose and whey derived ingredients carry around 34% of piglet starter cost because young pigs digest dairy carbohydrate far better than plant sources, and those ingredients price on dairy commodity markets rather than feed markets. The root cause is digestive physiology, not formulation preference. Commercially it means starter feed cost moves with dairy while customers watch grain. Alternative protein and carbohydrate sources are being trialled and none matches performance yet. Even partial substitution capability would reduce a third of the cost base exposure, which is why the trial work continues despite repeated disappointment.
Market Impact: Reaches 19% of dairy farms
4 additional market trends, 3 additional growth drivers, and 2 additional restraints and challenges are covered in the full report. Contact sales@marketmindsadvisory.com to access the complete intelligence.

Segment CAGR and Growth Architecture

Six segments are split by target species, because species determines the digestive physiology the formulation must work with, the ingredients available, the regulatory constraints on additives and the production system a supplier is actually selling into. Life stage variants sit inside each species. Production system and channel are handled separately in the framework. Regulatory status varies by species too.
starter-feed-market-trends-market-share-analysis-1787595406348

Piglet Starter and Creep Feed

Growing at 8.1%, half again the market rate of 5.4%, piglet starter manages the weaning transition where a young pig loses maternal milk and cannot yet digest plant protein efficiently. Withdrawal of pharmacological zinc oxide removed the reliable answer to post-weaning diarrhoea, forcing formulation onto organic acids, specialty proteins, yeast fractions and plant extracts at higher cost and lower consistency. Dairy derived lactose carries around 34% of the cost. Technical support through the transition now decides outcomes more than any single ingredient does, which favours suppliers with field nutrition capability. Dairy market movements drive its cost rather than grain, which producers monitoring cereals find consistently difficult to accept at renewal.
CAGR 8.1%

Aquaculture Fry and Fingerling Starter

At 7.4% these micro-particulate feeds serve fry and fingerling stages where particle size, water stability and digestibility all have to be right or the feed simply dissolves before it is eaten. Growth comes from hatchery intensification and species diversification across Asian and Latin American production, where survival rates through early stages determine the economics of a whole cycle. Manufacturing requires extrusion and coating capability that conventional feed mills do not hold, which keeps the competitive field considerably narrower than the wider feed market suggests. Hatcheries evaluate measured survival through early stages rather than cost per tonne, which makes this one of the few feed segments where price comparison barely features in the buying decision.
CAGR 7.4%
Full segment breakdown across 6 segments available in the complete report.

Regional Architecture and Country Demand Map

East Asia holds 30% of value on Chinese pig and poultry production at a scale nothing else matches. North America follows at 22% on intensive dairy and pig systems that buy compound starter feed almost universally. South Asia and Pacific grows fastest of the seven regions.

North America

Intensive dairy and pig production buys compound starter feed almost universally, and automated calf feeder penetration is among the highest anywhere, which makes individual intake and growth data available to farms that choose to use it. Heifer rearing cost pressure has raised interest in early growth as a route to earlier first calving. Antibiotic use restrictions have tightened without matching the European position on zinc oxide. Growth at 4.4% reflects mature herd numbers against rising formulation specification. Farms using that feeder data buy on measured response rather than price per tonne, which is a genuinely different commercial conversation from the one most suppliers are prepared for. Most suppliers are not prepared.
Share: 22% | CAGR: 4.4% (2026 to 2036)

Western Europe

Zinc oxide withdrawal happened here first and reshaped piglet starter formulation more thoroughly than anywhere else, pushing organic acids, specialty proteins and plant extracts into standard use at considerably higher cost. Dairy herd numbers are flat or declining under environmental constraints, which caps calf starter volume. Technical nutrition support is well developed and farms are comparatively receptive to growth response arguments. Growth of 3.8% is the slowest anywhere on declining animal numbers against rising specification. Field nutrition capability rather than formulation alone now decides which suppliers retain piglet starter accounts through the weaning transition across most commercial operations. Environmental constraints on herd size will cap volume regardless of how good the technical position becomes, which caps regional growth.
Share: 20% | CAGR: 3.8% (2026 to 2036)
Regional intelligence for 5 additional markets available in the complete report: East Asia, South Asia and Pacific, Latin America, Middle East and Africa, Eastern Europe. Contact sales@marketmindsadvisory.com.
starter-feed-market-trends-country-cagr-analysis-1787595406881

Four Ways to Move the Decision

The science behind this product has been settled for two decades and the purchasing behaviour has barely moved, because the return lands three years later in a number nobody connects to the bag. Every worthwhile move here shortens that gap or changes which cost the farmer is actually looking at. Both routes are open.

Sell through automated feeder data rather than literature

Automated calf feeders now reach around 19% of dairy farms and record individual intake and growth weekly, which lets a farm observe the response instead of reading about it. That converts a research finding into something visible on a screen, and it is the first genuine answer to a measurement gap this industry has argued about for twenty years. Suppliers working with that data hold an argument no technical brochure has ever delivered. Concentrating commercial effort on measured farms costs nothing beyond redirecting the sales organisation toward customers who can actually see what they are buying.
Market Impact: Reaches the 19% of dairy farms already measuring

Frame the product against heifer rearing cost

Rearing a replacement heifer returns nothing until she calves, and better early growth brings first calving forward while adding around 1,100 kilograms of lifetime milk per kilogram of pre-weaning daily gain. The earlier calving is a cash flow argument rather than a productivity one, and cash flow arguments reach a farm business owner in a way that lactation curves never do. Very few suppliers lead with it. Bringing first calving forward by even a few weeks changes the rearing cost arithmetic materially, and it does so within a timeframe a farm business plans around.
Market Impact: Adds 1,100 kg of additional lifetime milk yield

Build field nutrition support around the weaning transition

Zinc oxide withdrawal made piglet weaning genuinely difficult, and outcomes now depend on water quality, feeding management, hygiene and timing as much as on formulation. A supplier providing that support during the transition changes the result more than any single ingredient does, and it moves the relationship from a bag price comparison to a technical partnership. Piglet starter grows at 8.1% and the technical need grows faster. Pricing that support separately makes the capability visible instead of burying it inside a per tonne comparison it will always lose. Most suppliers still give it away.
Market Impact: Supports 8.1% piglet starter segment growth each year

Develop micro-particulate aquaculture starter manufacturing capability

Fry and fingerling starter grows at 7.4% and requires extrusion, particle sizing and coating capability that ordinary feed mills do not hold, which keeps the competitive field narrow. Survival through early stages determines the economics of a whole production cycle, so hatcheries buy on performance rather than price per tonne. The capital involved is modest against a segment where price comparison barely features in the decision. Manufacturing capability rather than commercial effort is what limits entry, which makes the position unusually durable once established. Hatchery relationships hold for years once established.
Market Impact: Serves 7.4% aquaculture starter growth in every year

Who Controls the Margin Pool

Participation is measured on annual starter feed tonnage manufactured, and the top five hold 27%. Concentration is low because feed milling is regional by nature and freight economics keep supply close to the farms it serves. Cargill and Nutreco lead through technical nutrition capability and specialty ingredient access rather than through milling scale, which is available to a great many participants. The gap to challengers is technical depth rather than manufacturing capacity.
Competition runs on three fronts. Technical nutrition support decides outcomes during the weaning transition and increasingly decides supply with commercial producers. Specialty ingredient access decides formulation capability, particularly for dairy derived carbohydrate and specialty proteins. And delivered price decides volume with price led buyers, who remain the majority almost everywhere. Farms with automated feeder data behave quite differently from price led buyers, and suppliers increasingly have to serve both without confusing the two.

Pressure ahead comes from growth promoter restrictions spreading into markets that had not enforced them, and from automated feeder data making response visible on farms. Expect technically capable suppliers to compete on demonstrated outcomes rather than formulation claims. Rankings shift on who builds field support capability first. Concentration should stay low given regional milling economics.
starter-feed-market-trends-company-positioning-matrix-1787595407404

Competitive Moat and Risk Dimensions

CARGILL

Moat: Ingredient access and technical reach

Access to dairy derived carbohydrate, specialty proteins and additive supply through an integrated agricultural business gives formulation options at costs that independent regional millers cannot match, particularly since lactose carries around a third of piglet starter cost. Combined with field nutrition capability across most producing regions, it addresses both the ingredient and the support side of the same problem.
CARGILL

Risk: Price led purchasing prevalence

Most starter feed is still bought on price per tonne rather than on demonstrated growth response, which limits how much technical capability can actually be charged for in the majority of transactions. Changing that requires shifting farm purchasing behaviour, which the industry has been attempting without much success for the better part of two decades.
NUTRECO

Moat: Young animal nutrition specialisation

Deliberate specialisation in young animal feeding, with research and field support built around the weaning transition specifically, positions the business exactly where zinc oxide withdrawal made outcomes hardest to achieve. That capability is difficult to assemble quickly because it depends on accumulated trial data and field nutritionist depth rather than any manufacturing investment.
NUTRECO

Risk: European animal number decline

Substantial European exposure ties volume to dairy and pig herds that are flat or declining under environmental constraints, in the region where specification is highest and growth is slowest. Growth requires transferring that technical position into Asian and Latin American markets where price led purchasing is considerably more entrenched than in Europe.

Players Tracked

Prominent Players

Cargill
Nutreco
ForFarmers
De Heus
Alltech

Other Key Players

Land O'Lakes
ADM Animal Nutrition
Kent Nutrition Group
Agrifirm
Denkavit
Volac
Milk Specialties Global
Charoen Pokphand Foods
New Hope Liuhe
Wens Foodstuff
Lallemand Animal Nutrition
Kemin Industries
Novus International
Godrej Agrovet
Feedone

Recent Developments

MARCH 2026

Dairy group adopts automated feeder data in starter feed selection

A dairy producer group began selecting starter feed on individual growth data recorded through automated calf feeders rather than on price per tonne, comparing measured pre-weaning gain across formulations. Suppliers unable to demonstrate response on that data lost position. Price per tonne was no longer the primary criterion.
Signal: Measurement rather than argument is what finally moves a purchasing decision on this product at last
SEPTEMBER 2025

Growth promoter restrictions extend into additional pig producing markets

Restrictions on antibiotic growth promoters and pharmacological zinc oxide extended into further pig producing markets, forcing reformulation onto organic acids, specialty proteins and plant extracts. Producers reported weaning performance variability that formulation alone did not resolve without management support. Field support requirements rose sharply across affected producers.
Signal: Reformulation raises cost and leaves outcomes dependent on management the supplier must support rather than resolve them
DECEMBER 2025

Lactose pricing lifts piglet starter cost independently of grain

Dairy commodity movements lifted lactose and whey permeate pricing sharply, raising piglet starter feed cost at a time when grain markets were stable. Producers watching cereal prices were unprepared for an increase unrelated to grain. Several suppliers struggled to explain it at renewal. Formulators had no substitution available.
Signal: Piglet starter tracks dairy markets, which almost no livestock producer monitors at all or even understands

Dairy Ingredients, Protein and Milling

Dairy derived lactose and whey permeate carry around 34% of piglet starter cost, priced on dairy commodity markets rather than feed markets. Specialty proteins including fishmeal, potato protein and soy protein concentrate take about 22%. Cereals and conventional protein meals account for around 19%. Additives, acidifiers and plant extracts absorb roughly 15%, with milling, pelleting and delivery taking the balance.
Dairy commodity pricing moved sharply through recent seasons independently of grain markets, per USDA dairy market reporting alongside Nutreco parent group annual reporting for 2025 on raw material exposure in young animal nutrition. Producers monitoring cereal markets were repeatedly caught by starter feed cost increases driven entirely by lactose availability, which several suppliers found difficult to explain to customers at renewal. Forward contracting across seasons has become considerably more common since.

Exposure divides on species and formulation rather than on milling scale. A piglet starter formulator carries dairy ingredient exposure across a third of cost with limited substitution available, since young pigs digest plant carbohydrate poorly. A calf starter or chick starter producer carries cereal and protein meal exposure behaving quite differently. Aquaculture starter carries fishmeal and marine ingredient pricing on a third pattern again.
starter-feed-market-trends-cost-volatility-analysis-1787595407602

Contract dairy derived ingredients across production seasons

Lactose and whey permeate at around a third of piglet starter cost price on dairy markets that livestock producers do not monitor and formulators cannot influence. Forward contracting across seasons smooths an exposure that has repeatedly surprised customers at renewal, and it removes the most difficult conversation a starter feed salesperson has to hold.

Qualify alternative carbohydrate and protein sources continuously

No plant derived carbohydrate matches lactose for post-weaning piglet digestibility yet, but continuous trial work narrows the gap and creates substitution options during price spikes. Even partial substitution capability reduces exposure across a third of the cost base, and the trial infrastructure serves product development at the same time. The trial work pays twice over.

Price technical support separately from feed tonnage

Field nutrition support during the weaning transition changes outcomes more than formulation does after zinc oxide withdrawal, yet most suppliers give it away inside a bag price that then gets compared per tonne. Pricing it separately protects the capability and makes the value visible to a farm business rather than invisible inside a commodity comparison.

Portfolio Architecture for Margin Defence

Margin here follows technical content rather than milling capability, because compound feed manufacturing is widely available and freight economics keep supply regional. Standard calf and chick starter earns margins in the high single digits to mid teens, since farms compare price per tonne against a specification and regional millers compete effectively on delivered cost. Delivered cost is the only differentiator available there.
High specification piglet starter and technical calf programmes do better in the high teens to high twenties, because zinc oxide withdrawal made weaning outcomes genuinely difficult and formulation plus field support together decide results in a way that a price comparison cannot easily capture at all. Suppliers giving that support away inside a bag price find it compared per tonne and valued at nothing.

Micro-particulate aquaculture starter holds the strongest position, reaching into the low thirties, where extrusion and coating capability narrow the field and hatcheries buy measured early stage survival rather than price per tonne. Those margins reflect manufacturing capability and demonstrated performance rather than any advantage in ingredient cost. Very few compound feed manufacturers hold the extrusion and coating equipment that segment actually requires.

Standard Calf and Chick Starter

Conventional starter feed compared on price per tonne against a published specification. The seven point range reflects ingredient cost position and mill efficiency rather than any performance difference a farm would readily observe.
Gross Margin: 8-15%

High Specification Piglet and Technical Calf Programmes

Formulations built around weaning transition performance with field nutrition support attached. The ten point range reflects technical capability depth and whether the supplier can demonstrate outcomes on farm rather than in literature.
Gross Margin: 18-28%

Micro-Particulate Aquaculture Starter

Extruded and coated fry and fingerling feeds where particle stability and early survival decide supply. The nine point range reflects manufacturing capability and demonstrated survival performance rather than ingredient cost advantage held.
Gross Margin: 24-33%
starter-feed-market-trends-portfolio-architecture-1787595408122

High-value Sub-segments and Strategic Watch-out

High Specification Piglet Starter

High value and the fastest growth at 8.1% as growth promoter restrictions spread beyond Europe. Outcomes now depend on field support as much as formulation, which favours suppliers holding genuine technical nutrition capability. Formulation alone no longer determines the result on farm. Field support decides it.
Gross Margin: 20-28%

Micro-Particulate Aquaculture Starter

High value and growing at 7.4% on hatchery intensification and species diversification. Extrusion and coating capability narrows the field, and hatcheries buy measured survival rather than comparing price per tonne. Manufacturing capability rather than commercial effort limits entry here. Survival data decides the specification. Entry stays hard.
Gross Margin: 24-33%

Standard Calf and Chick Starter

The volume core, compared on price per tonne against published specifications where regional millers compete effectively on delivered cost. Growth response arguments rarely survive contact with a farm purchasing decision. The return lands three years later in a different number. Price per tonne wins every time.
Gross Margin: 8-15%

Measurement Gap Exposure

The strategic watch-out. The return arrives three years after purchase in a number nobody connects to the bag, and the range reflects how far a supplier has built demonstrated on farm measurement into its commercial approach. Automated feeder data is the first real answer. Few suppliers use it.
Gross Margin: 6-30%

Bag Price Against Lifetime Return

Demand here comes from farms evaluating the same product on two incompatible timescales. A price led buyer compares cost per tonne against a specification at each delivery, which is a monthly decision. A performance led buyer is investing in an animal that returns nothing for three years and then produces across five lactations, which is a capital decision wearing the clothes of a feed purchase.
Stickiness follows which timescale applies. Price led supply reopens at every renewal, since compound feed within a specification is broadly interchangeable and regional millers compete hard. Performance led relationships hold for years, because they involve field nutritionists, farm data and management practice that a farm will not disrupt for a modest saving per tonne on one input.

Deciding functions differ accordingly. Price led purchasing sits with a farm owner or manager comparing invoices. Performance led decisions increasingly involve a veterinarian or independent nutritionist, and on larger commercial operations a production manager watching automated feeder data. Suppliers selling response curves to the first group and price lists to the second are getting both conversations exactly backwards. It happens more often than anybody in this industry admits.
starter-feed-market-trends-end-use-penetration-index-1787595408611

Where We Would Put Effort

These are among the four positions where our research anticipates prominent divergence between winners and laggards over the coming forecast period. Each is grounded in the demand model, the regulatory perimeter, and the announced capacity pipeline.
01 / MEASUREMENT LED SELLING

Let the feeder data make the argument

Automated calf feeders now reach around 19% of dairy farms in developed markets and record individual intake and growth weekly, which lets a farmer observe the response rather than read published research about it. That closes a measurement gap this industry has argued about for two decades without moving purchasing behaviour at all. Suppliers who work with that data hold an argument that no amount of technical literature has ever managed to deliver on its own to a farm business owner.
02 / REARING COST FRAMING

Cash flow lands better than lactation curves

A replacement heifer returns nothing until she calves, and better pre-weaning growth brings that date forward while adding roughly 1,100 kilograms of lifetime milk per kilogram of extra daily gain before weaning. Earlier calving is a cash flow argument rather than a productivity one, and it reaches a farm business owner in a way that a lactation response curve never has. Remarkably few suppliers lead with it despite holding every piece of the data required to make it convincingly to a customer.
03 / WEANING TRANSITION SUPPORT

Formulation stopped being enough after zinc

Withdrawing pharmacological zinc oxide made post-weaning piglet performance depend on water quality, hygiene, feeding management and timing every bit as much as on what is actually in the bag itself. Piglet starter grows at 8.1% against a market rate of 5.4% and the technical requirement is growing faster than the volume. A supplier providing that support genuinely changes outcomes and moves the relationship out of a price comparison per tonne per tonne that it would otherwise lose fairly quickly and permanently.
04 / AQUACULTURE STARTER CAPABILITY

Hatcheries buy survival, not price

Micro-particulate fry and fingerling starter grows at 7.4% and requires extrusion, particle sizing and coating capability that ordinary compound feed mills simply do not hold, which keeps the competitive field genuinely narrow. Early stage survival determines the economics of a whole production cycle, so hatcheries evaluate measured performance rather than cost per tonne. The capital required is modest against a segment where price comparison barely features in the buying decision at all, which is genuinely rare across compound feed of any kind.

Engagement Snapshot From the Field

A live engagement with an industry participant carrying material or product regulatory and market exposure ahead of a defining policy shift, showing how our research translates into a defensible multi-year portfolio strategy.
MARKET MINDS ADVISORY · CLIENT ENGAGEMENT SUMMARY
Starter Feed Producer Strategic Portfolio Review and Transition Roadmap 2026·Investment Scenario on Starter Feed Exposure Evaluation 2025-26
CLIENT PROFILE
A European compound feed manufacturer producing calf, piglet and poultry starter feeds for commercial farms across four countries, at annual revenue near 260 million euros (client-reported, unverified by MMA). Field nutrition support was provided free inside the bag price, and no aquaculture starter capability existed within the business. Margins had compressed for three consecutive years.
STRATEGIC CHALLENGE
Piglet starter reformulation after zinc oxide withdrawal had raised costs substantially while customers continued comparing price per tonne, and margins had compressed for three consecutive years. Management wanted to know whether technical capability could be charged for or should simply be reduced. A commercial restructuring plan was already under discussion.
MMA APPROACH
MMA compared purchasing behaviour between farms using automated calf feeders and those without, quantified the margin contribution of field nutrition support against its cost, assessed aquaculture starter manufacturing requirements against existing capability, and traced how dairy ingredient pricing had driven starter cost independently of grain. Interviews with 47 experts covered animal nutrition, veterinary practice and feed manufacturing.
KEY FINDINGS
  1. Farms using automated calf feeders bought on measured growth response rather than price per tonne, and paid materially more for formulations that demonstrated results on their own data.
  2. Field nutrition support was decisive in retaining piglet starter accounts after zinc oxide withdrawal, yet it was given away inside a bag price that customers then compared per tonne.
  3. Aquaculture starter manufacturing required extrusion and coating capability the client did not hold, at capital cost modest against a segment growing considerably faster than its core.
  4. Starter feed cost increases had been driven almost entirely by dairy derived ingredient pricing, which customers monitoring grain markets had found impossible to accept as explained.
CLIENT PROFILE
A European compound feed manufacturer producing calf, piglet and poultry starter feeds for commercial farms across four countries, at annual revenue near 260 million euros (client-reported, unverified by MMA). Field nutrition support was provided free inside the bag price, and no aquaculture starter capability existed within the business. Margins had compressed for three consecutive years.
STRATEGIC CHALLENGE
Piglet starter reformulation after zinc oxide withdrawal had raised costs substantially while customers continued comparing price per tonne, and margins had compressed for three consecutive years. Management wanted to know whether technical capability could be charged for or should simply be reduced. A commercial restructuring plan was already under discussion.
MMA APPROACH
MMA compared purchasing behaviour between farms using automated calf feeders and those without, quantified the margin contribution of field nutrition support against its cost, assessed aquaculture starter manufacturing requirements against existing capability, and traced how dairy ingredient pricing had driven starter cost independently of grain. Interviews with 47 experts covered animal nutrition, veterinary practice and feed manufacturing.
KEY FINDINGS
  1. Farms using automated calf feeders bought on measured growth response rather than price per tonne, and paid materially more for formulations that demonstrated results on their own data.
  2. Field nutrition support was decisive in retaining piglet starter accounts after zinc oxide withdrawal, yet it was given away inside a bag price that customers then compared per tonne.
  3. Aquaculture starter manufacturing required extrusion and coating capability the client did not hold, at capital cost modest against a segment growing considerably faster than its core.
  4. Starter feed cost increases had been driven almost entirely by dairy derived ingredient pricing, which customers monitoring grain markets had found impossible to accept as explained.
RECOMMENDED STRATEGY
Phase 1: Phase one: concentrate commercial effort on farms with automated feeder data, where measured response rather than price per tonne decides the purchase. Phase 2: Phase two: price field nutrition support separately from feed tonnage so the capability is visible rather than buried inside a per tonne comparison. Phase 3: Phase three: evaluate aquaculture starter manufacturing investment, since capability rather than price decides supply in that segment. Capability rather than price decides supply.
OUTCOME
The manufacturer restructured commercial effort around measured farms and began pricing technical support separately, reporting piglet starter margins recovering across 2026 (client-reported, unverified by MMA). Aquaculture starter investment was approved for the following year. Field nutritionist headcount was increased rather than reduced across the same period.

Frequently Asked Questions

Foundational context covering the market sizes, CAGR, scope, country, region and competition that inform every finding below. This section is provided to cover basics and most often pre-purchase conversations, answered from the MMA Primary Research Dataset.

What is the current size of the Starter Feed Market?

MMA sizes it at USD 24.6 billion in 2025, rising to USD 25.93 billion in 2026. The figure covers compound starter feed across all species at manufacturer selling value.

How large will the Starter Feed Market be by 2036?

USD 43.88 billion by 2036, an incremental USD 17.95 billion over the 2026 base and an expansion multiple of 1.69 times. Piglet starter accounts for a disproportionate share.

What is the CAGR for the Starter Feed Market 2026 to 2036?

5.4% in the base case, with a bull case at 6.6% and a bear case at 4.2%. The spread turns on whether farm level measurement changes how the product is valued.

Which segment is growing fastest?

Piglet starter and creep feed at 8.1%, half again the market rate of 5.4%. Zinc oxide withdrawal and antibiotic restrictions have forced considerably higher specification formulation.

Who are the major companies in the Starter Feed Market?

Cargill, Nutreco, ForFarmers, De Heus and Alltech lead on starter feed tonnage manufactured. Fifteen further participants are profiled in the full report on that same basis.

Which country is growing fastest?

Vietnam at 10.2%, on pig herd rebuilding alongside a shift from smallholder to commercial production systems that purchase compound feed rather than mixing on farm.

Report Segmentation Architecture

The full report scope spans multiple orthogonal segmentation dimensions, with cross-tabulated demand data provided for each dimension pair. Coverage extends further to regional breakdowns, trend trajectories, and the competitive detail needed to support segment-level decision-making.

By Target Species

  • Calf Starter Feed
  • Piglet Starter and Creep Feed
  • Chick Starter Feed
  • Lamb and Kid Starter Feed
  • Aquaculture Fry and Fingerling Starter
  • Foal and Other Species Starter

By End-Use Industry

  • Dairy Production
  • Pig Production
  • Poultry Meat and Egg Production
  • Sheep and Goat Production
  • Aquaculture and Hatcheries
  • Equine and Specialist Livestock

By Commercial Dimension

  • Direct Commercial Farm Supply
  • Dealer and Agricultural Merchant Channels
  • Integrator and Contract Production Supply
  • Cooperative Purchasing Groups
  • Technical Nutrition Service Contracts
  • Private Label Manufacture

By Region

  • North America
  • Western Europe
  • East Asia
  • South Asia and Pacific
  • Latin America
  • Middle East and Africa
  • Eastern Europe

Scope, Methodology, and Coverage

Every figure in this report is reproducible from documented input assumptions. The scope below maps the historical period, the forecast horizon, the segmentation dimensions, and the countries covered, alongside the underlying primary and qualitative methodology.
Historical Period
2020 to 2025
Forecast Period
2026 to 2036
Base Year
2025 (USD billions; MMA Primary Research Dataset, August 2026)
Market Definition
Compound starter feed formulated for young animals through the weaning transition, covering calf starter, piglet starter and creep feed, chick starter, lamb and kid starter, aquaculture fry and fingerling starter, and foal and other species starter. Measured at manufacturer selling value. Liquid milk replacers, grower and finisher rations, forage additives and silage inoculants, standalone feed additives sold separately, and veterinary medicinal products are excluded from scope.
Quantitative Units
USD billions (current prices); million tonnes manufactured; USD per tonne by species formulation
Segmentation Dimensions
Target species; end-use industry; commercial dimension; region
Regions Covered
North America, Western Europe, East Asia, South Asia and Pacific, Latin America, Middle East and Africa, Eastern Europe
Countries Covered
United States, Canada, Mexico, Netherlands, Germany, France, Spain, Denmark, China, Japan, South Korea, India, Vietnam, Thailand, Indonesia, Brazil, Argentina, Turkey, South Africa, Poland
Key Companies Profiled
Cargill, Nutreco, ForFarmers, De Heus, Alltech, Land O'Lakes, ADM Animal Nutrition, Kent Nutrition Group, Agrifirm, Denkavit, Volac, Milk Specialties Global, Charoen Pokphand Foods, New Hope Liuhe, Wens Foodstuff, Lallemand Animal Nutrition, Kemin Industries, Novus International, Godrej Agrovet, Feedone
Quantitative Methodology
Primary survey, n=3,800 respondents, Q4 2025, six countries; demand-side model with trade association cross-validation
Qualitative Methodology
47 expert interviews, Q4 2025; applied to validate demand model assumptions, identify emerging dynamics, and assess competitive positioning
Report Format
PDF and XLSX data workbook (Word format preview document)
Publisher
Market Minds Advisory
Report Code
MMA-2026-AGR-190
Published
August 2026
Contact
sales@marketmindsadvisory.com | www.marketmindsadvisory.com

Purchase the full Starter Feed Market Report (2026 to 2036).

The full report treats the measurement gap as the central commercial problem in this market, because the return arrives three years after purchase in a number no farm connects back to the bag. It sizes all six species segments independently through 2036, compares purchasing behaviour between farms with and without automated feeder data, and traces dairy ingredient pricing effects on formulation cost separately from grain. Regional chapters cover all seven regions with production system change assessed alongside animal numbers. Competitive profiling covers 20 participants on one consistent tonnage basis.
Six species segments sized independently through 2036
Purchasing behaviour compared across farms with automated feeder data
Dairy ingredient cost effects traced separately from grain markets
Growth promoter restriction effects modelled by market and species
Field nutrition support economics assessed against margin contribution
Twenty participants profiled on one consistent tonnage basis

Built For The People Who Decide

From boardroom strategy to bench-side execution, this report is read cover-to-cover by leaders shaping the next decade of their industry, turning demand scenarios, market dynamics and valuation benchmarks into decisions.
CXOs/ Presidents/ VPs/ Managers
M&A and Corporate Development
Strategy Teams and R&D Heads
Procurement and Product Directors
Regulatory and Compliance Leaders
Investor Relations and Equity Analysts