Market Minds Advisory
Staple Fiber Market

Staple Fiber Market: A Recycling Claim Built on Somebody Else's Waste Stream

Almost all recycled polyester fibre comes from beverage bottles rather than from clothing, which closes no textile loop at all and competes directly with bottle collection targets now being written into law.

Lead Analyst

Bilal Shaikh

Published

September 2026

Make Smarter Decisions with Customized Research Insights

Request a free sample report and evaluate market opportunities, growth trends, and competitive dynamics relevant to your business needs.

2025 MARKET VALUE$32.0BMarket Size 2025
2036 FORECAST VALUE$55.9BBase Case , 2026 to 2036
CAGR 2026 TO 20365.2 %Bull 6.4% / Bear 4.0%
INCREMENTAL OPPORTUNITY$22.2BNet 10- year value creation
EXPANSION MULTIPLE1.66x2036 value over 2026 base
Strategic Levers
M&A Pipeline
Regional Outlook
Country Rankings
Competitive Intelligence
Segmental Deep-dive
Call-Us : 91 93563 13602

Executive Snapshot and Market Trajectory

The recycled polyester story is mostly a bottle story. Around 96% of recycled staple fibre comes from beverage bottle flake rather than from clothing, which closes no textile loop and diverts a food grade feedstock that bottle collection rules increasingly want back. Everybody still calls it circular.
Textile to textile recycling would actually close the loop and supplies under 1% of fibre. Brands buying recycled content at roughly a 32% premium are buying a claim whose feedstock is being legislated away from them, and very few have any plan for what replaces it when packaging regulation reclaims the bottles it originally collected. The demand is real and the feedstock behind it is not secure.
The quieter opportunity sits outside apparel entirely. Nonwovens now take around 24% of staple fibre into hygiene, wipes, filtration and automotive applications where fibre is specified on performance and qualified rather than bought per kilogram. Margins there hold through cycles that flatten commodity yarn demand, and comparatively few producers have organised around it. Nonwoven qualification runs for months on bonding behaviour and web uniformity, and price enters only once that testing is satisfied.
Market Definition
Staple fibre supplied for spinning and nonwoven processing, covering virgin polyester staple fibre, recycled polyester staple fibre, viscose staple fibre, lyocell and modal, acrylic staple fibre, and polypropylene and other synthetic staple. Measured at producer selling value. Excludes filament yarn, spun yarn and fabric, natural fibres including cotton and wool, technical monofilament, and textile recycling collection or sorting services.
Base Year Value
$32.0B in 2025 (MMA Primary Research Dataset, August 2026)
Forecast Period
2026 to 2036, eleven discrete annual values
CAGR
5.2% base case. Bull 6.4%. Bear 4.0%.
Fastest Growth Segment
Recycled Polyester Staple Fibre: 7.8% CAGR
Fastest Growth Country
Vietnam: 9.4% CAGR
Fastest Growth Region
South Asia and Pacific: 7.2% CAGR
Largest Region
East Asia: 44% of 2025 global value
Market Leaders
Indorama Ventures, Reliance Industries, Sateri, Aditya Birla Group, Far Eastern New Century. Source: MMA Primary Research Dataset, July 2026.
Primary Survey
n=3,800 procurement and R&D decision-makers, Q4 2025, six countries
Methodology
Demand-side build-up, cross-validated against public data, 47 expert interviews

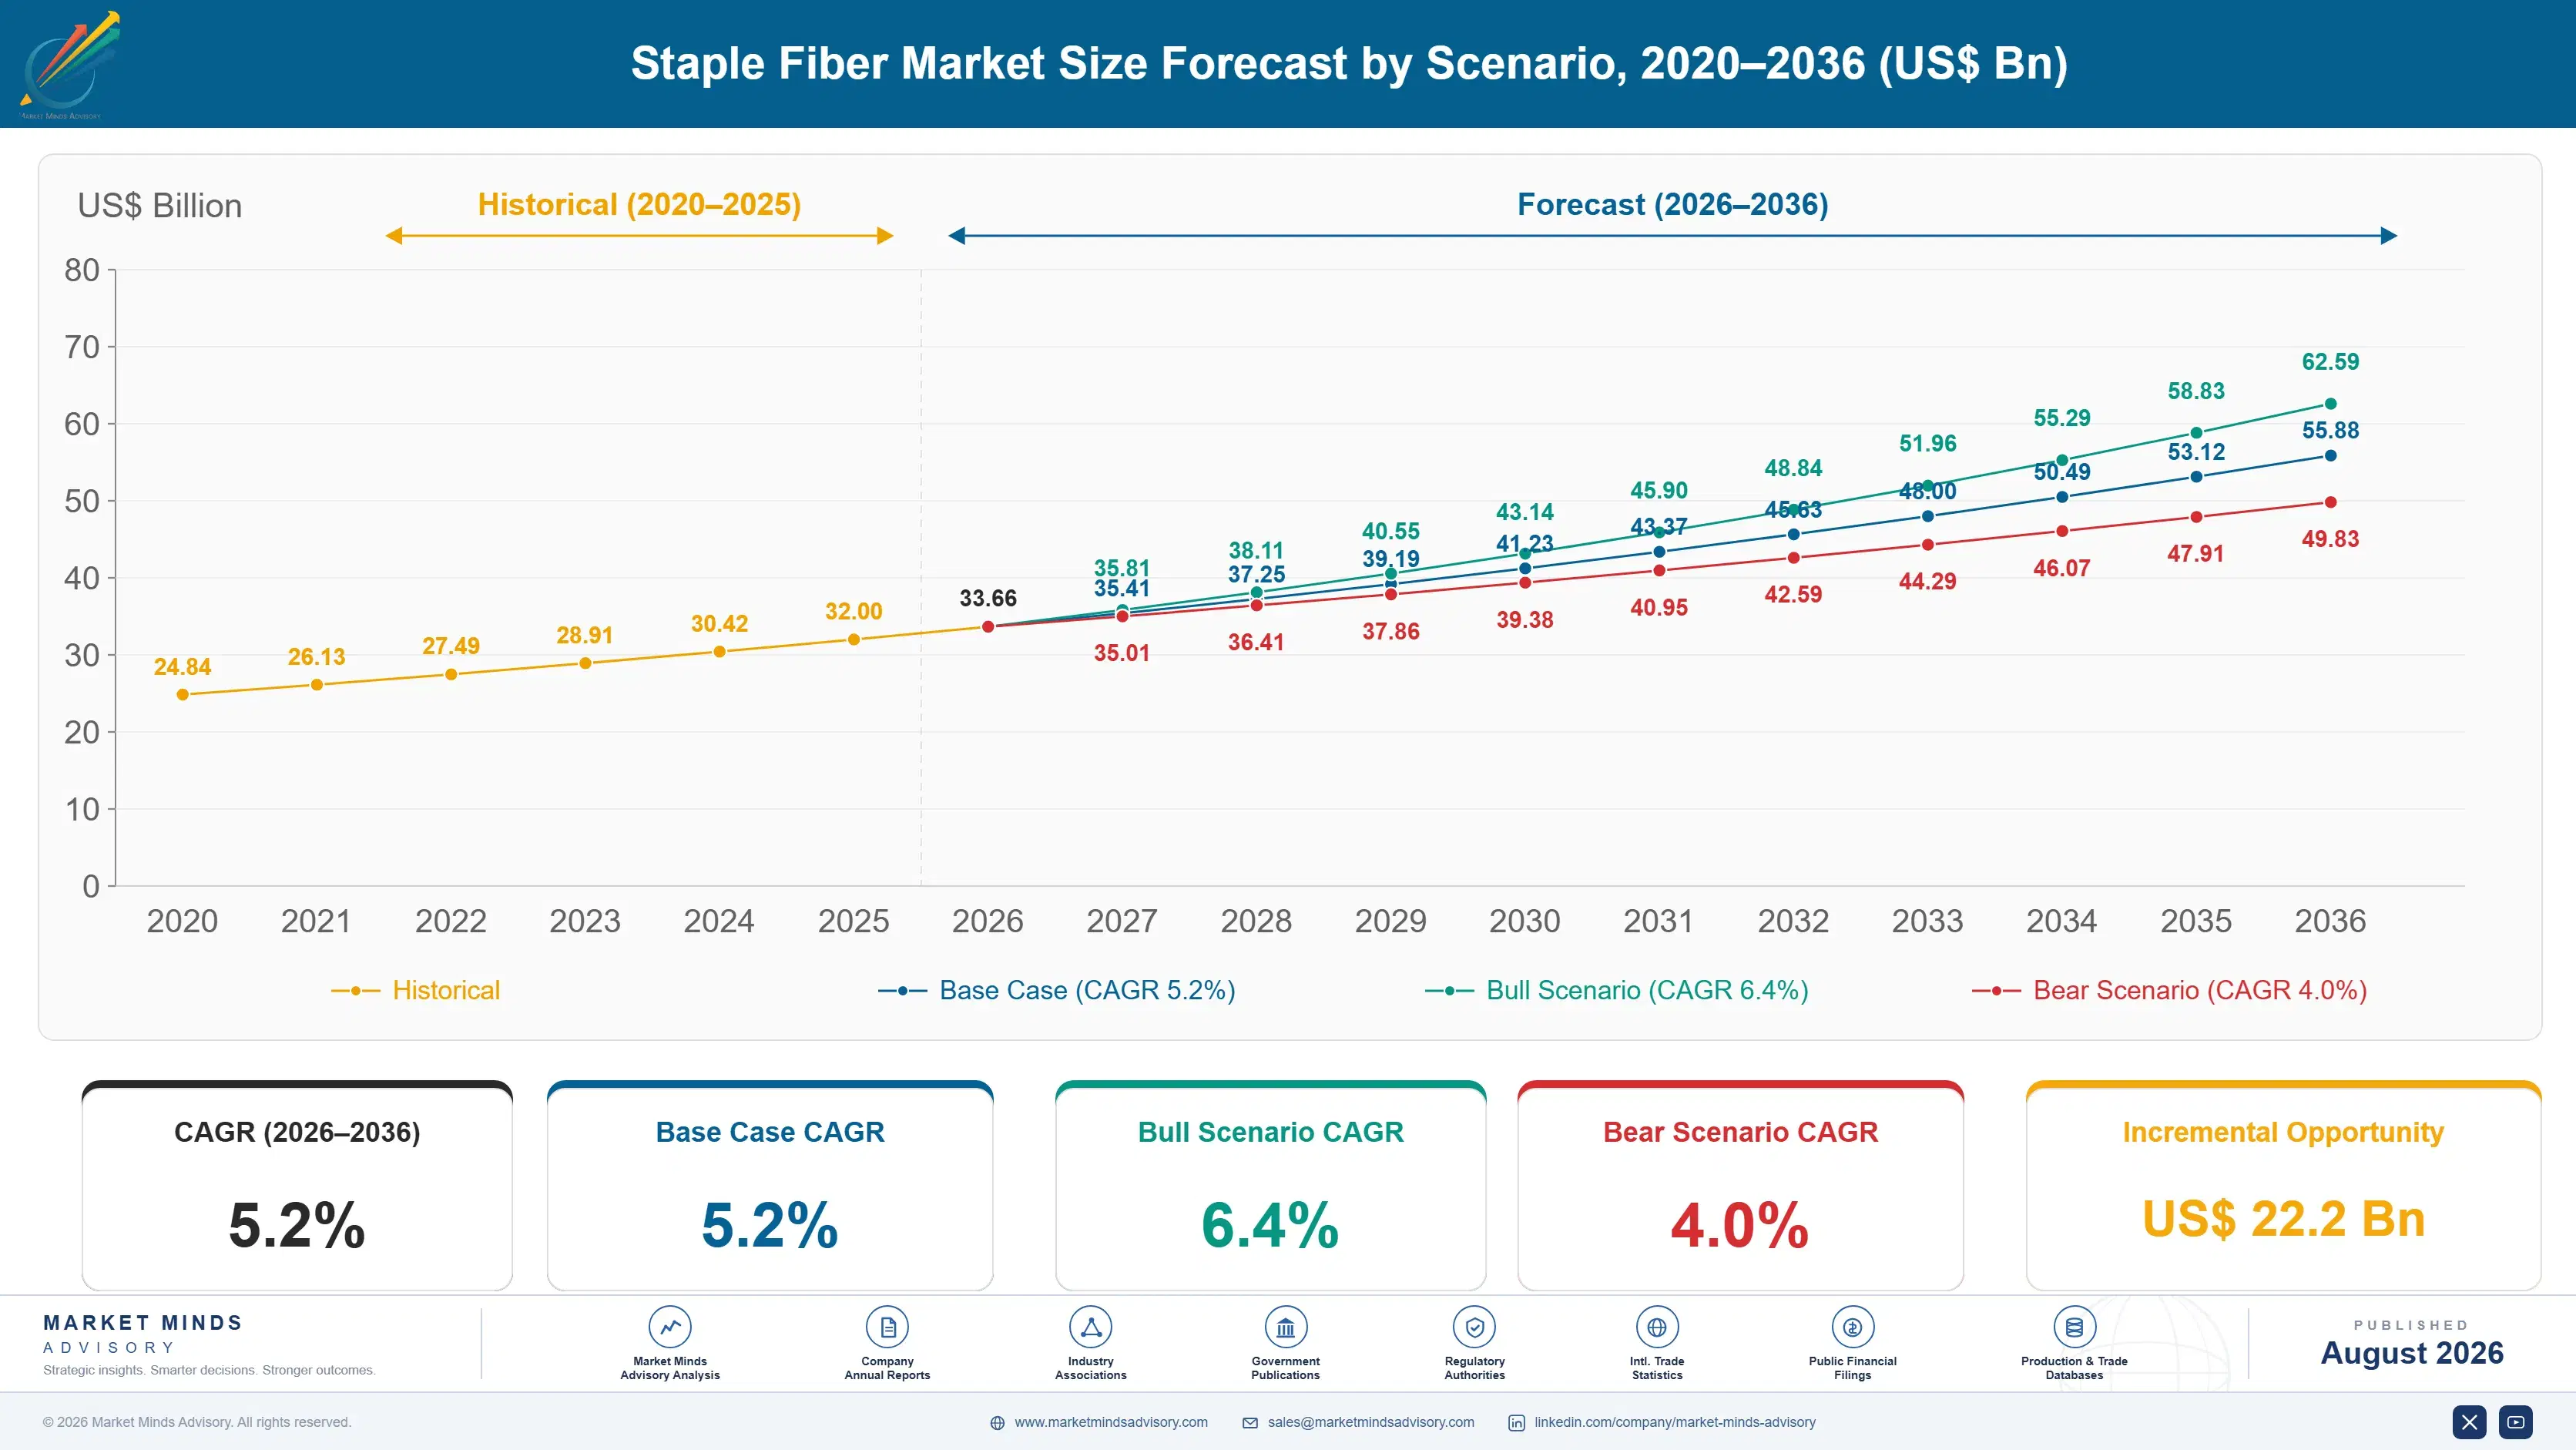
Staple Fiber Market Forecast Scenarios

staple-acrylic-fiber-market-trends-size-forecast-scenario-1787594665172
Growth ran near 4.2% between 2020 and 2025, with recycled polyester expanding fastest as brand commitments multiplied and virgin polyester tracking paraxylene pricing through a volatile energy period. Nonwoven demand grew steadily and proved far less cyclical than apparel yarn. Acrylic declined throughout as apparel substitution continued. Asian capacity additions kept commodity fibre pricing under continuous pressure regardless of demand.
Base case 5.2% rests on three mechanisms. Recycled polyester grows at 7.8% on brand content commitments, though the feedstock question is unresolved rather than answered. Lyocell and modal grow at 7.2% as cotton land constraints push demand toward man-made cellulosics with better water and solvent recovery. And Vietnam grows fastest of any country at 9.4% as apparel manufacturing capacity relocates and domestic fibre production follows it. None of the three depends on apparel volume growing at all.
The bull case at 6.4% assumes textile to textile recycling reaching commercial scale on cost, which would resolve the feedstock problem and let recycled content commitments hold. The bear case at 4.0% is packaging regulation reclaiming bottle flake faster than textile recycling can replace it, leaving brands unable to meet recycled content targets and quietly abandoning the premium entirely.

The Bottle Is Not a Shirt

The most repeated claim in this industry does not survive examination. Around 96% of recycled polyester staple fibre is made from beverage bottle flake, not from clothing, which means a garment carrying recycled content has recycled a bottle rather than a garment. The textile loop stays open, the bottle leaves a food grade recycling stream where it could have been used repeatedly, and everybody involved describes the result as circular.
TOP FIVE CONCENTRATION26%Capacity is spread across a very long producer tail
BOTTLE DERIVED FEEDSTOCK96%Recycled fibre share made from beverage bottle flake
TEXTILE TO TEXTILE SUPPLY1%Recycled fibre portion made from post consumer garments
NONWOVEN DEMAND SHARE24%Staple fibre consumed outside conventional apparel yarn spinning
RECYCLED PRICE PREMIUM32%Uplift over virgin fibre at equivalent denier specification
PULP COST SHARE61%Dissolving pulp portion of viscose staple fibre cost
Packaging regulation is now closing that door. Bottle collection and recycled content targets written into packaging rules put beverage producers in direct competition with textile mills for the same flake, and beverage producers have both regulatory obligation and deeper pockets. Textile to textile recycling supplies under 1% of fibre at present, so nothing stands behind the brand commitments if bottle feedstock becomes genuinely contested.
The commercially interesting part of this market sits somewhere else entirely. Nonwovens take around 24% of staple fibre into hygiene, wipes, filtration and automotive applications, where fibre is qualified against performance rather than bought against a price per kilogram. Those positions hold through downturns that flatten apparel yarn demand, and the producers who built them are not the ones talking loudest about recycled content.
"Every brand target I have seen assumes bottle flake will still be available and affordable in 2030, which is a strange assumption to make about a feedstock that packaging law is actively reclaiming. The producers quietly qualifying fibre into hygiene nonwovens will look considerably smarter than the ones counting recycled tonnes."
Director, Fibres and Textile Materials Practice · MMA Chemicals and Materials Practice · August 2026

Market Trends

Packaging regulation reclaiming the recycled fibre feedstock

Around 96% of recycled polyester staple fibre comes from beverage bottle flake, and packaging rules setting collection and recycled content targets put beverage producers in direct competition for exactly that material. They hold regulatory obligation and generally deeper pockets than textile mills do. Textile to textile recycling supplies under 1% of fibre today, so brand recycled content commitments currently rest on a feedstock that legislation is steadily taking back rather than on any textile recycling capability. Brands holding content targets for the end of this decade have generally not examined that arithmetic.
Market Impact: Cellulosics growing at 7.2%
Nonwoven qualification separating fibre from commodity pricing

Nonwovens now take around 24% of staple fibre into hygiene, wipes, filtration and automotive applications where fibre is qualified against performance requirements rather than bought against price per kilogram. Those qualifications take months and hold for years afterwards, which produces revenue that survives the downturns flattening apparel yarn demand. Comparatively few producers have organised commercially around it, and the ones that have report considerably steadier margins through cycles than commodity spinners manage. Qualification is technical work rather than capital investment, which puts the position within reach of producers with no balance sheet capacity for expansion at all.
Market Impact: Vietnam growing fastest at 9.4%

Market Opportunities and Growth Drivers

Cotton land constraints pushing demand toward cellulosic fibres

Cotton acreage cannot expand meaningfully against food crop competition and water availability, which pushes apparel demand growth toward man-made cellulosics offering comparable handle and moisture behaviour. Lyocell and modal grow at 7.2% on that substitution, helped by solvent recovery rates that answer the environmental objections raised against conventional viscose. Forest sourcing certification has become the entry requirement for brand supply, which narrows the field to producers holding audited pulp chains. Capital intensity keeps cellulosic capacity additions lumpy, which holds pricing considerably firmer than commodity fibre manages through the same cycles.
Market Impact: Supplies under 1% of fibre

Apparel manufacturing relocation pulling fibre capacity behind it

Vietnam grows fastest of any country at 9.4% as garment manufacturing capacity relocates from higher cost bases and domestic fibre production follows the spinning and knitting capacity that arrives with it. Bangladesh and India show similar patterns at different speeds. Fibre supply tends to follow rather than lead that movement, which gives producers a reasonably clear signal about where capacity will be needed several years before it actually is. Building commercial presence before local capacity arrives is considerably cheaper than competing against it afterwards on delivered cost. Very few producers work that way.
Market Impact: Pulp carries 61% of cost

Market Restraints and Challenges

Textile to textile recycling stuck below commercial scale

Post consumer garment recycling supplies under 1% of staple fibre because mixed fibre blends, dyes, elastane content and trims all resist the separation that chemical or mechanical recycling requires. The root cause is that garments were never designed to be taken apart. Commercially it leaves recycled content commitments dependent on bottle flake indefinitely. Design for disassembly standards and chemical depolymerisation are the pathways being pursued, and neither is close to competing on cost yet. Design for disassembly would help future garments and does nothing for the ones already in circulation.
Market Impact: Bottle flake supplies 96% today

Commodity fibre pricing tracking petrochemical feedstock closely

Virgin polyester staple pricing follows purified terephthalic acid and monoethylene glycol, which track oil and gas, while viscose follows dissolving pulp at around 61% of production cost. The root cause is that commodity fibre carries almost no conversion value above feedstock. Commercially it means spinners reprice constantly and producers earn very little through a cycle. Nonwoven qualification and specialty fibre development are the mitigations that genuinely change the exposure. Both change the exposure itself rather than merely hedging it, which is the only durable answer available here. Neither is quick to build.
Market Impact: Nonwovens take 24% of demand
4 additional market trends, 3 additional growth drivers, and 2 additional restraints and challenges are covered in the full report. Contact sales@marketmindsadvisory.com to access the complete intelligence.

Segment CAGR and Growth Architecture

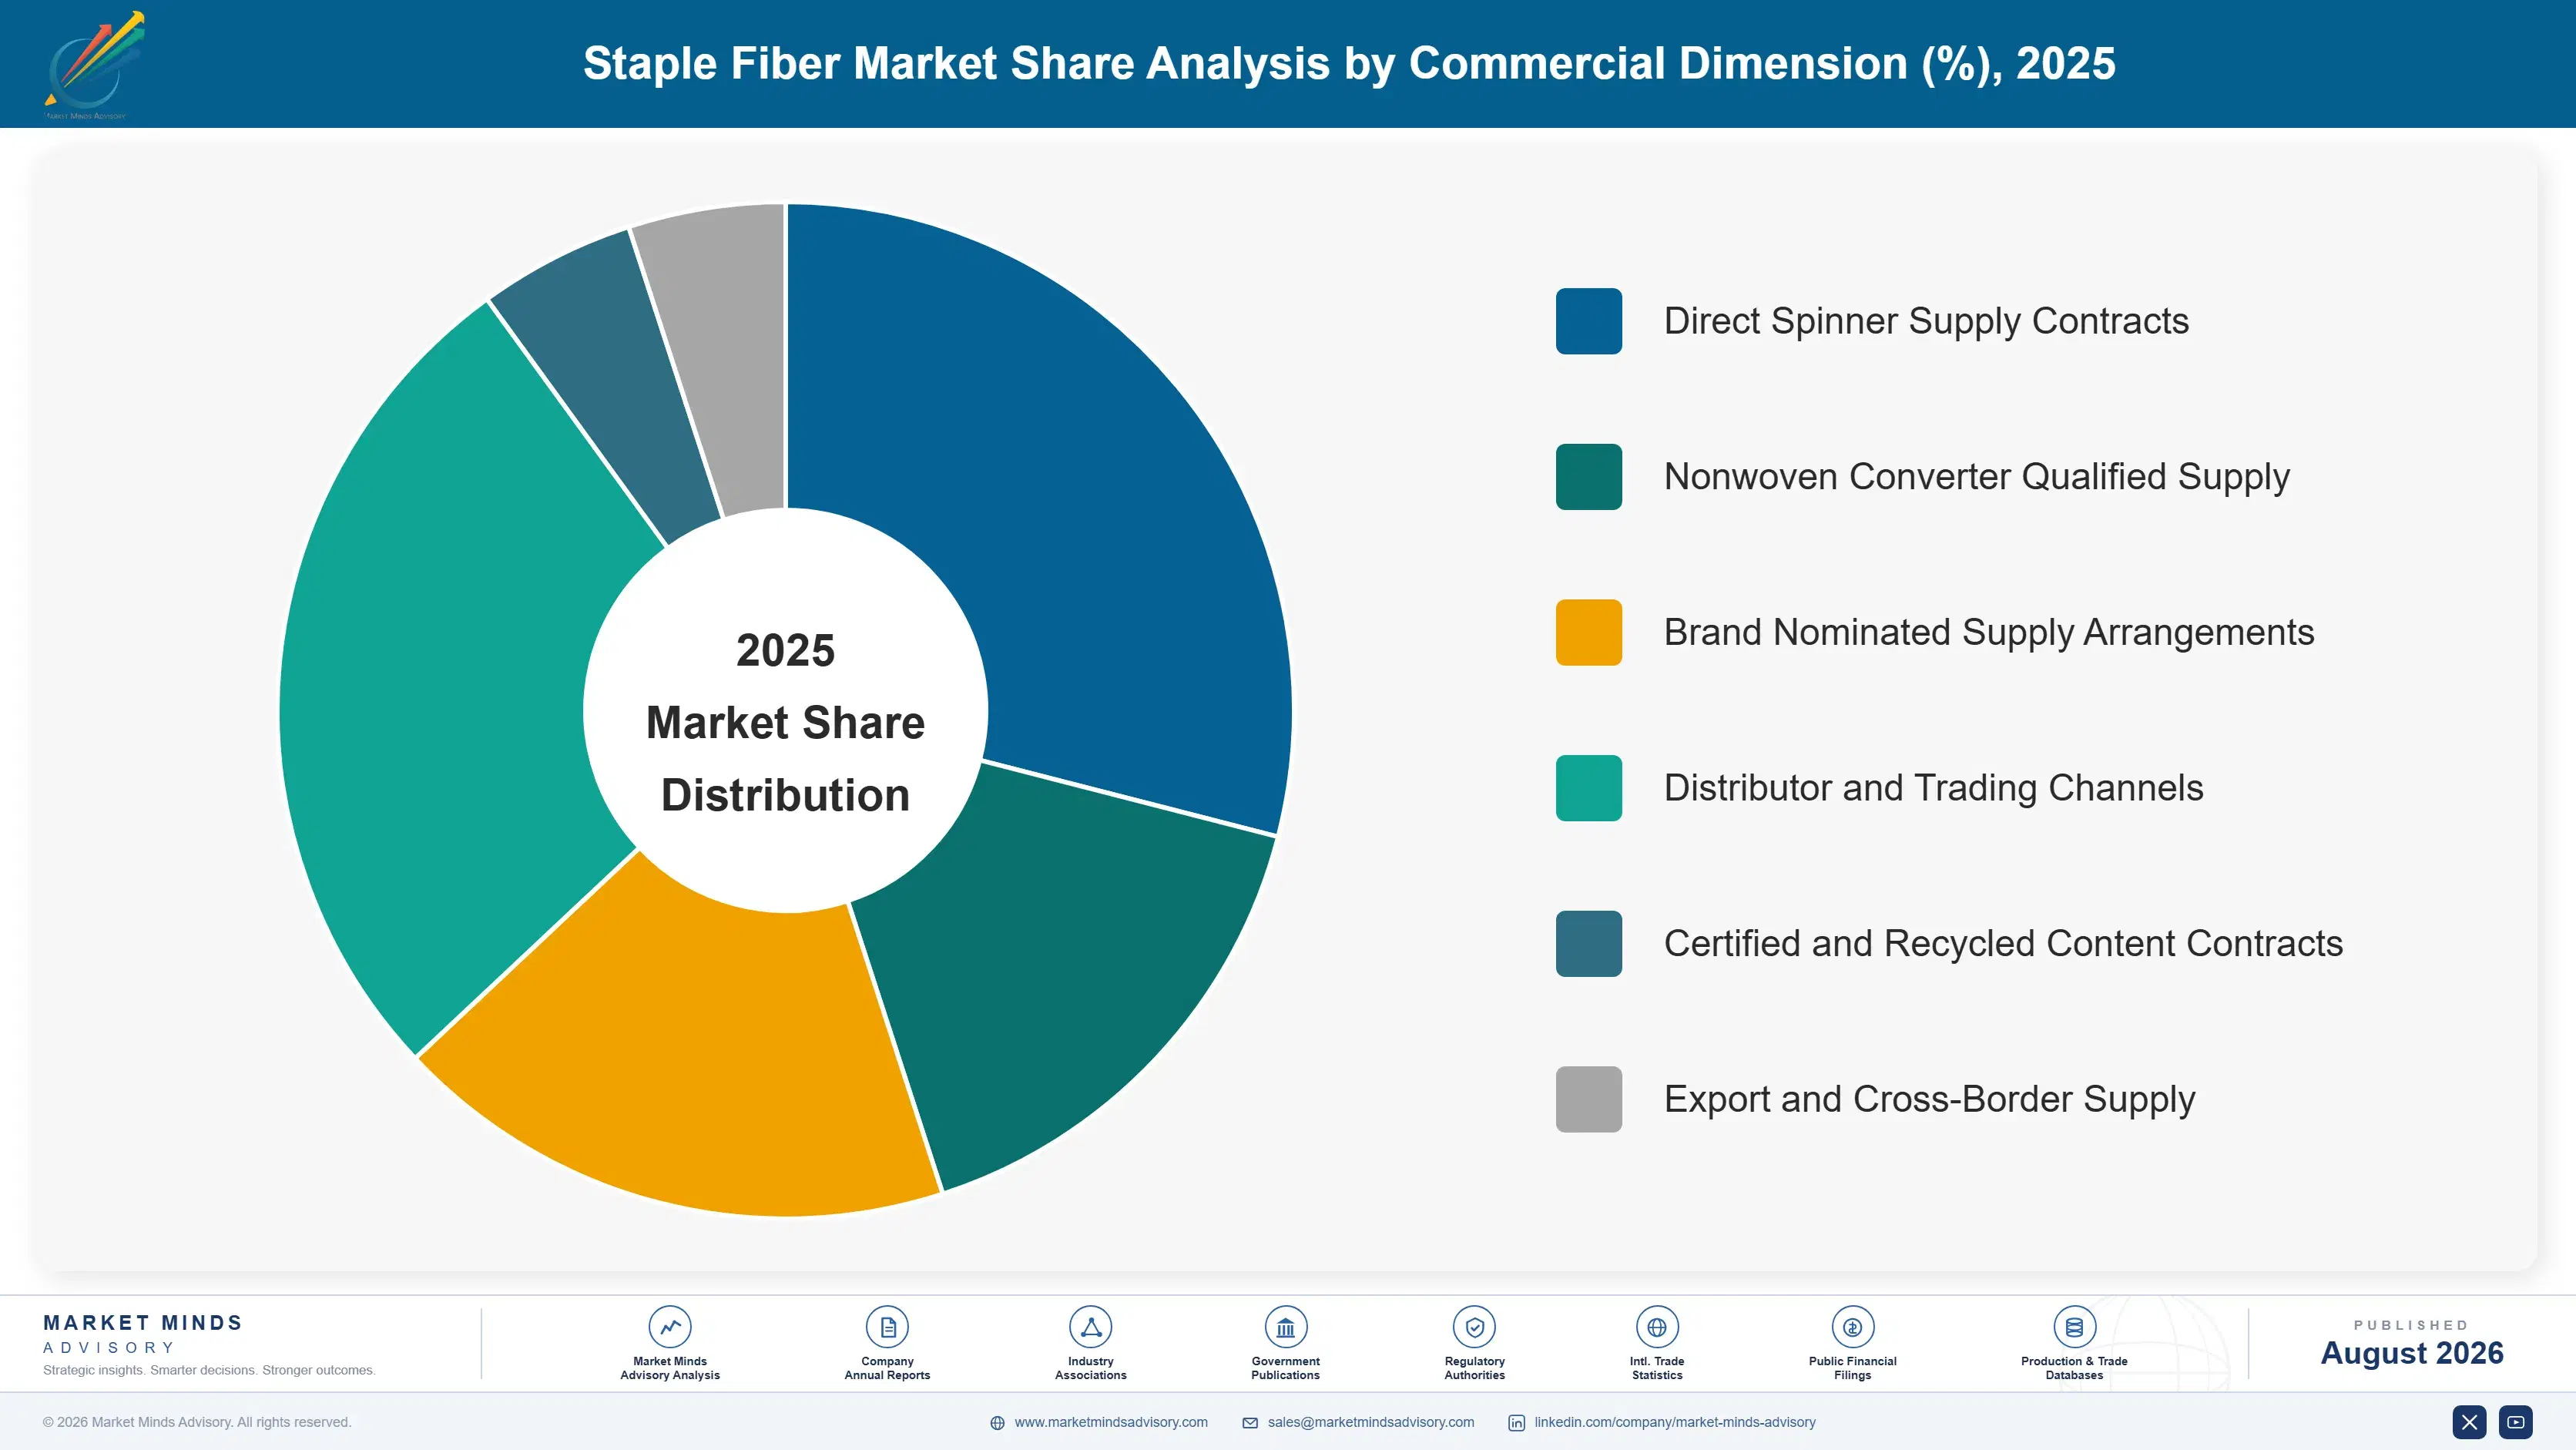
Six segments are split by fibre type, because fibre type determines the feedstock and its cost behaviour, the processing route, the performance a spinner or nonwoven producer can achieve and the price the fibre commands. Denier and cut length variants sit inside each fibre type. Application and channel are handled separately in the framework instead.
staple-acrylic-fiber-market-trends-market-share-analysis-1787594665730

Recycled Polyester Staple Fibre

Growing at 7.8%, half again the market rate of 5.2%, this is polyester staple produced from recovered polyethylene terephthalate, roughly 96% of it beverage bottle flake rather than post consumer textile. Brand recycled content commitments drive the demand at premiums near 32% over virgin fibre at equivalent denier. The commercial risk is the feedstock rather than the demand, since packaging regulation setting bottle collection and recycled content targets puts beverage producers in direct competition for the same material with stronger obligations and deeper pockets behind them. Producers securing collection arrangements directly will supply brands that open market buyers cannot, which is where the competitive separation will happen. Nobody else has secured that supply.
CAGR 7.8%

Lyocell and Modal

At 7.2% these man-made cellulosic fibres are produced from dissolving pulp using solvent systems with recovery rates that answer the environmental objections raised against conventional viscose processing. Demand grows as cotton acreage constraints push apparel toward cellulosics offering comparable handle and moisture management. Forest sourcing certification has become the entry requirement for brand supply rather than a differentiator, which narrows the field to producers holding audited pulp chains. Capital intensity is high and capacity additions are lumpy, which keeps pricing considerably firmer than commodity fibre. Brand supply now requires audited pulp chains as a condition rather than a preference, and building that audit history takes years rather than quarters to establish properly.
CAGR 7.2%
Full segment breakdown across 6 segments available in the complete report.

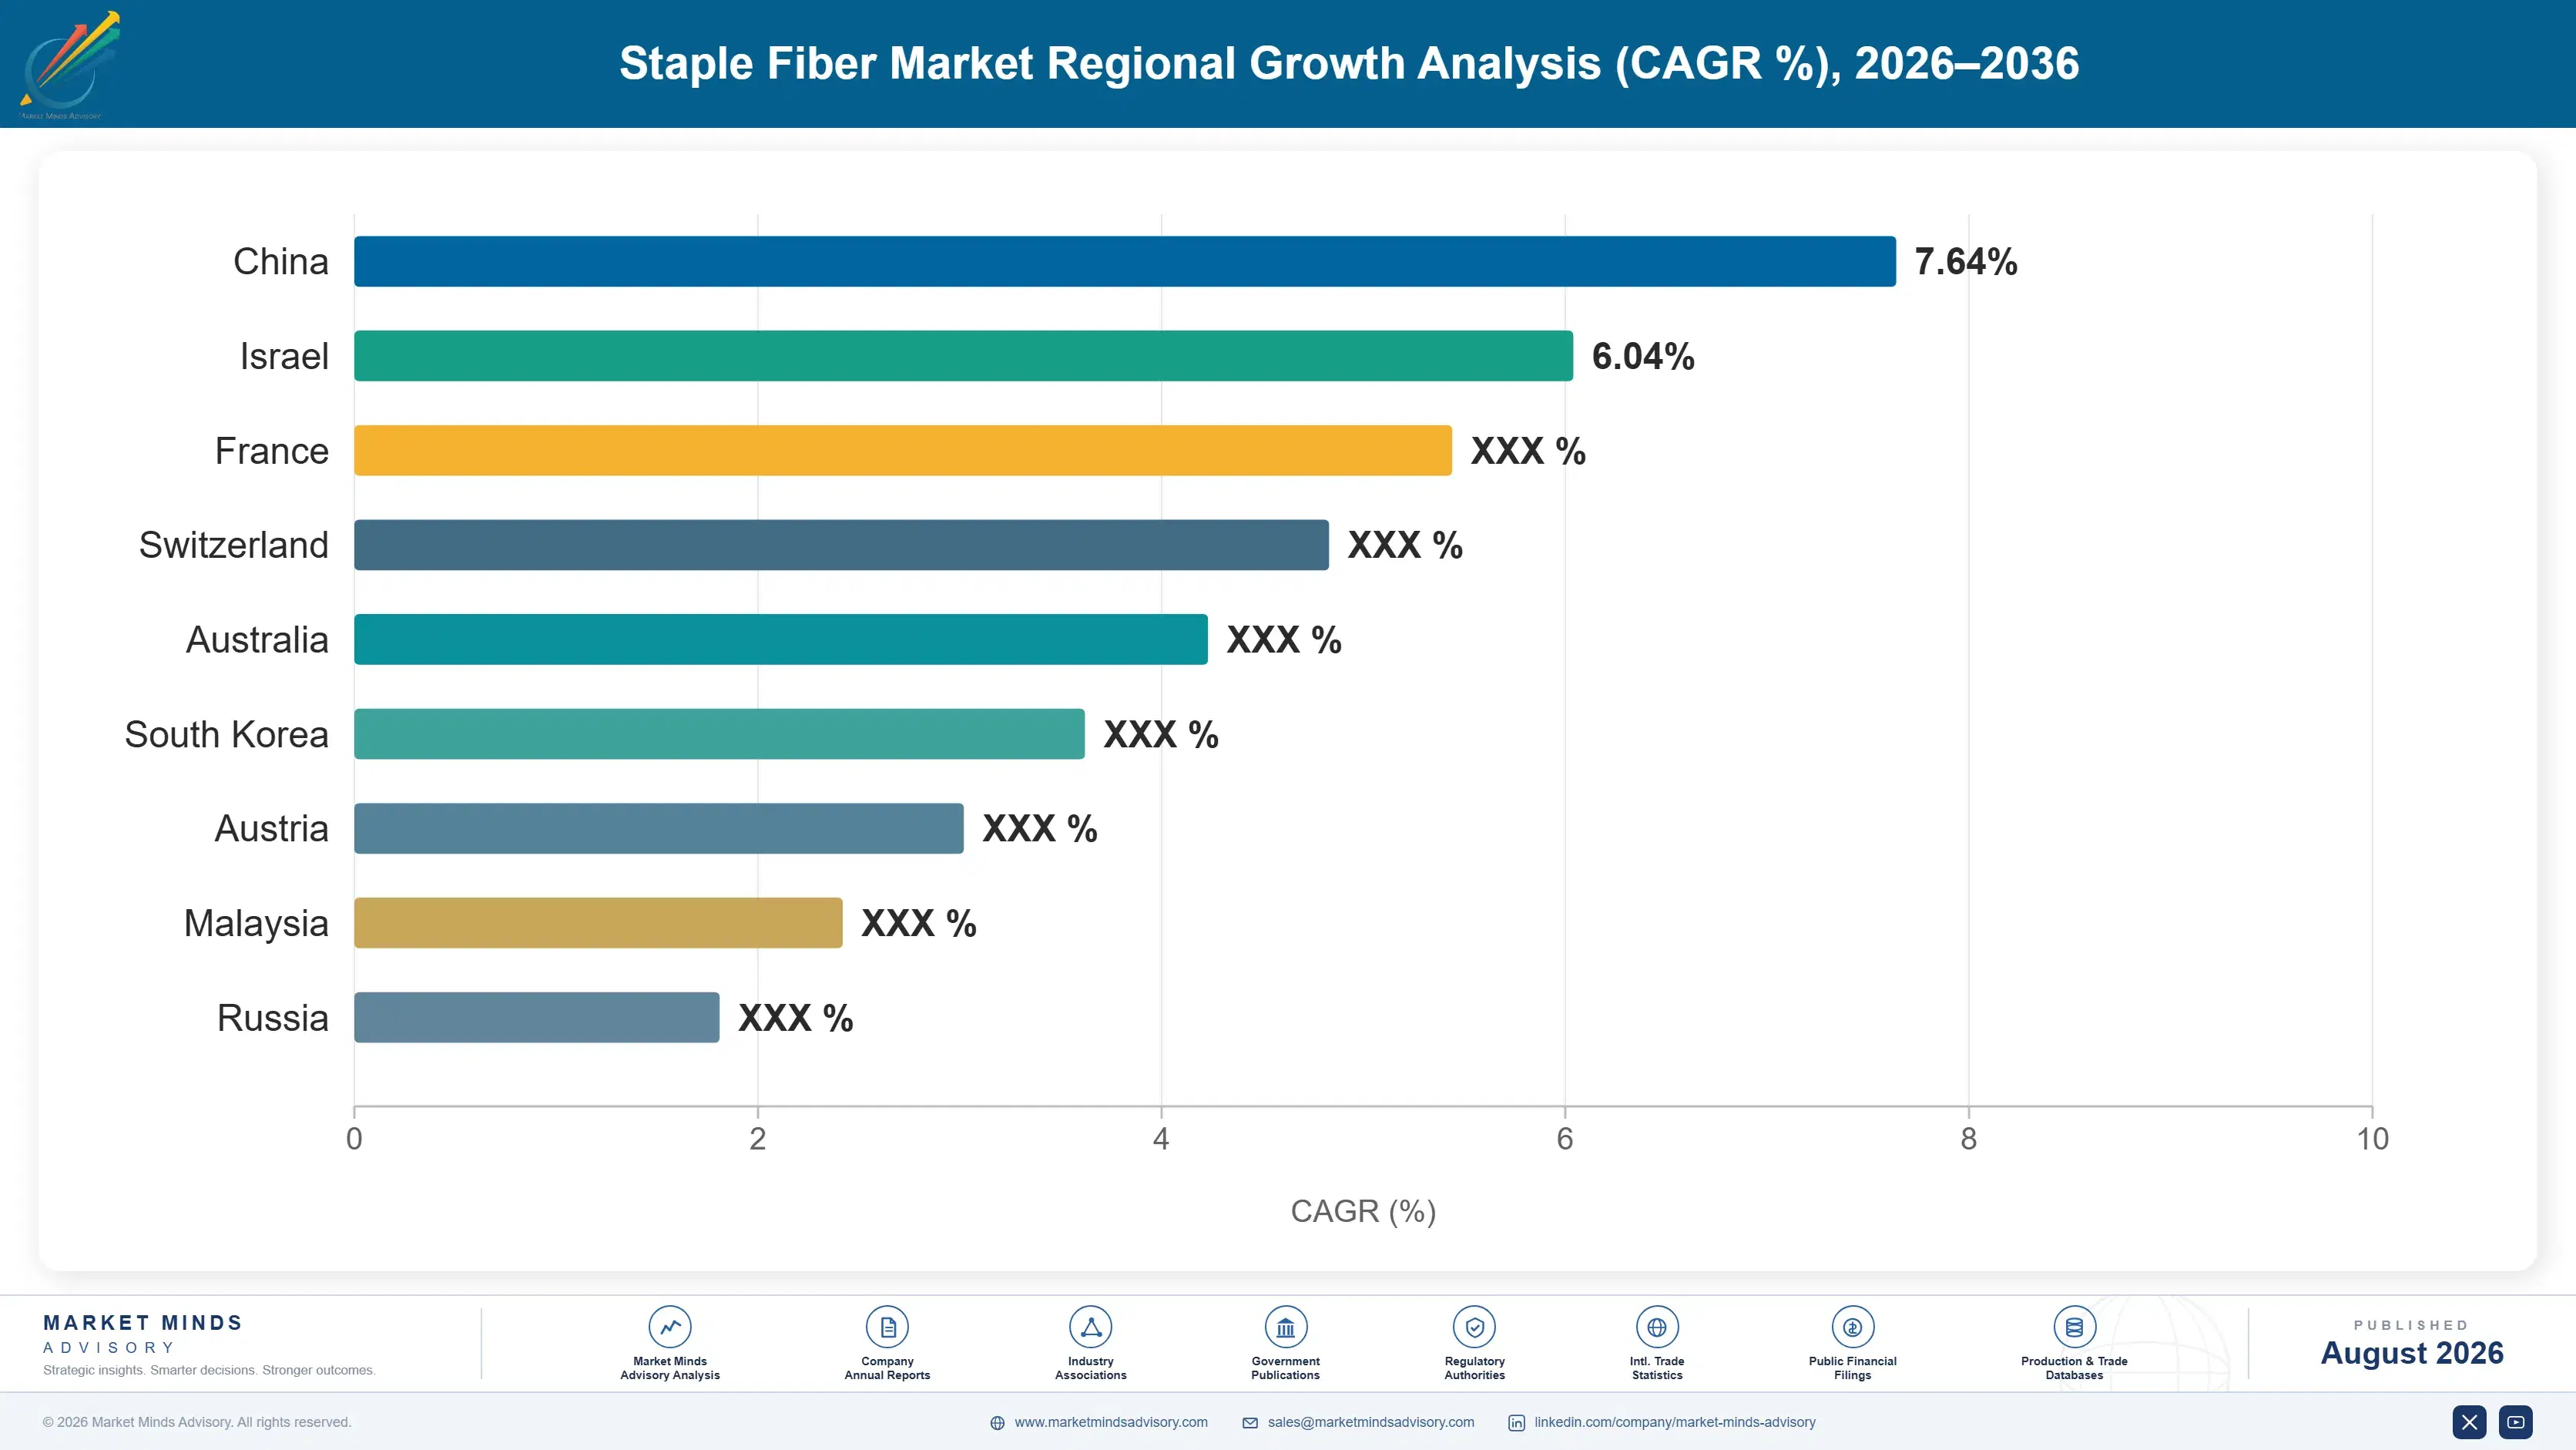
Regional Architecture and Country Demand Map

East Asia holds 44% of value on Chinese production and consumption at a scale nothing else approaches. South Asia and Pacific follows at 18% on Indian and Southeast Asian textile manufacturing, both well outside the standard bands. Both sit well outside their standard bands. Scope explains neither.

North America

Share sits at 13%, below the standard band, because Asian textile manufacturing concentration compresses every other region's proportion of world fibre demand. Regional consumption skews heavily toward nonwovens in hygiene, wipes, filtration and automotive applications rather than apparel yarn, which left the country decades ago. That mix is commercially favourable, since nonwoven fibre is qualified against performance rather than bought per kilogram. Growth at 4.2% reflects steady nonwoven expansion against essentially no apparel spinning demand at all. Recycled content requirements arrive through brand relationships rather than domestic regulation, and bottle flake competition is intensifying as beverage recycling targets tighten. Apparel spinning demand is effectively gone and will not return at any price.
Share: 13% | CAGR: 4.2% (2026 to 2036)

Western Europe

At 12% the share falls below the standard band for the same reason. Regional demand concentrates in nonwovens, technical textiles and high specification cellulosic fibre where producers hold genuine capability, while commodity apparel fibre demand is minimal. Packaging regulation reclaiming bottle flake for beverage recycling will bite here first and hardest, since collection and recycled content targets are furthest advanced. Forest certification requirements for cellulosic supply are also strictest here. Growth of 3.6% is the slowest anywhere on mature demand. Cellulosic capability and nonwoven qualification are the two arguments regional producers genuinely hold against Asian commodity supply on delivered cost. Commodity apparel fibre demand has effectively disappeared from the region entirely.
Share: 12% | CAGR: 3.6% (2026 to 2036)
Regional intelligence for 5 additional markets available in the complete report: East Asia, South Asia and Pacific, Latin America, Middle East and Africa, Eastern Europe. Contact sales@marketmindsadvisory.com.
staple-acrylic-fiber-market-trends-country-cagr-analysis-1787594666275

Four Moves Off the Commodity Curve

Commodity fibre carries almost no conversion value above feedstock, and every producer competing there reprices at the spinner's convenience. The moves worth making are qualification into nonwovens, honest positioning on recycled feedstock, cellulosic capability and following apparel capacity to where it is actually going. Each of them reaches a different buyer on quite different terms.

Qualify fibre into nonwoven applications deliberately

Nonwovens take around 24% of staple fibre and qualify producers against performance requirements over months rather than buying against a price per kilogram at each order. Those positions hold for years and survive downturns that flatten apparel yarn demand entirely. Margins run 10 to 15 points above commodity spinning supply, and the qualification cost is technical work rather than capital investment, which makes it available to producers without balance sheet capacity. Qualification runs on bonding behaviour and web uniformity, and price enters only once that is settled. Margins run well above commodity supply.
Market Impact: Reaches 24% of total staple fibre demand directly

Position honestly on feedstock before the rules land

Recycled fibre at 96% bottle derived is exposed to packaging regulation that will reclaim that flake for beverage recycling, and brands holding 2030 recycled content targets have generally not thought this through. A producer explaining the feedstock arithmetic honestly and offering a credible pathway becomes a partner rather than a supplier. Those relationships form now or they form with somebody else after the first supply failure. Brands generally have no plan for what replaces bottle flake, and the supplier who raises it first becomes the one they call when supply tightens rather than the one they blame.
Market Impact: Addresses the 96% bottle flake feedstock exposure directly

Build cellulosic capability where certification narrows the field

Lyocell and modal grow at 7.2% on cotton land constraints, and forest sourcing certification has become the entry requirement rather than a differentiator, which excludes producers without audited pulp chains. Capital intensity keeps capacity additions lumpy and pricing considerably firmer than commodity fibre. The certification work takes years, so the field stays narrow for anybody who starts now rather than when the demand becomes obvious to everybody. Capital intensity keeps capacity lumpy and pricing firm, and the audit history cannot be bought at any price once demand becomes obvious to everybody.
Market Impact: Serves 7.2% cellulosic fibre growth in every year

Follow apparel capacity relocation rather than chasing it

Vietnam grows at 9.4% and Bangladesh follows a similar pattern, with fibre supply arriving after spinning and knitting capacity rather than before it. That sequence is visible several years ahead, which gives a producer time to build commercial presence before local capacity arrives and prices it away. Producers reacting to the relocation after it happens are competing against domestic supply on delivered cost they cannot match. The relocation sequence is visible years ahead, which is an unusually clear commercial signal in a business that rarely offers any. Acting on it early costs very little.
Market Impact: Anticipates 9.4% growth in Vietnamese staple fibre demand

Who Controls the Margin Pool

Participation is measured on annual staple fibre production tonnage, and the top five hold 26%. Concentration is unusually low because polyester staple capacity is widely distributed across a long tail of Asian producers with modest technical barriers. Indorama Ventures and Reliance Industries lead through integration back into petrochemical feedstock rather than through any fibre production advantage. The gap to challengers is feedstock position rather than any deficit in fibre production capability.
Competition runs on three fronts. Feedstock integration decides commodity polyester economics almost entirely, since conversion value above feedstock is minimal. Qualification depth decides access to nonwoven and technical applications where pricing survives. And certification standing decides cellulosic supply, where forest sourcing audits exclude producers outright rather than merely disadvantaging them. Feedstock security has become a fourth front in recycled fibre, and it did not exist commercially three years ago.

Pressure ahead comes from packaging regulation reclaiming recycled feedstock, and from continued Asian capacity additions compressing commodity pricing. Expect producers with nonwoven and cellulosic positions to defend on qualification rather than price. Rankings shift on who secures a credible recycled feedstock pathway first. Concentration should stay low while commodity capacity keeps arriving.
staple-acrylic-fiber-market-trends-company-positioning-matrix-1787594666795

Competitive Moat and Risk Dimensions

INDORAMA VENTURES

Moat: Feedstock integration and geographic reach

Integration back into purified terephthalic acid and polyethylene terephthalate production removes exposure that non-integrated fibre producers carry in full, in a product where conversion value above feedstock is minimal. Combined with production positioned across most major consuming regions, it delivers a cost and supply position that a standalone fibre producer cannot assemble at any reasonable capital cost.
INDORAMA VENTURES

Risk: Recycled feedstock supply exposure

Substantial recycled polyester capacity depends on bottle flake that packaging regulation is steadily reclaiming for beverage recycling, with collection and recycled content targets giving beverage producers a stronger claim on the same material. That exposure is regulatory rather than commercial, and textile to textile recycling is nowhere near ready to replace the volume involved.
SATERI

Moat: Cellulosic scale and pulp certification

Viscose and lyocell capacity at scale combined with audited forest sourcing certification meets an entry requirement that excludes competitors outright rather than merely disadvantaging them on price. Building both the capacity and the certification history takes years, which keeps the competitive field narrow while cotton land constraints push demand toward cellulosic fibres steadily.
SATERI

Risk: Dissolving pulp cost exposure

Dissolving pulp carries around 61% of viscose production cost and is priced on international pulp markets that no fibre producer influences, which leaves margin exposed to a swing outside the company's control. Capital intensity in cellulosic production also means capacity decisions are difficult to reverse if demand growth disappoints materially.

Players Tracked

Prominent Players

Indorama Ventures
Reliance Industries
Sateri
Aditya Birla Group
Far Eastern New Century

Other Key Players

Tongkun Group
Hengli Petrochemical
Xinfengming Group
Zhejiang Hengyi
Lenzing
Kelheim Fibres
Toray Industries
Teijin Frontier
Bombay Dyeing
Jiangsu Sanfangxiang
Nan Ya Plastics
Alpek
Unifi
Thai Acrylic Fibre
Aksa Akrilik

Recent Developments

MARCH 2026

Packaging rules tighten bottle collection and recycled content targets

Packaging regulation tightened beverage bottle collection and recycled content requirements, giving beverage producers a stronger regulatory claim on recovered flake that textile fibre producers had been buying. Recycled fibre feedstock pricing moved noticeably within the following quarter across affected markets. Textile buyers reported reduced allocation from collection systems.
Signal: Two industries now compete for one waste stream, and only one carries a legal obligation behind it
SEPTEMBER 2025

Brand revises recycled content target citing feedstock availability

An apparel brand revised a recycled polyester content commitment downward, citing feedstock availability rather than cost, having originally set the target on the assumption that bottle flake supply would remain both abundant and affordable throughout the decade. No alternative feedstock pathway had been identified. The revision was made quietly.
Signal: Recycled content targets were set without examining where the feedstock actually comes from in the first place
DECEMBER 2025

Hygiene producer qualifies second staple fibre source on performance

A hygiene nonwoven producer qualified a second staple fibre source after months of performance testing on bonding behaviour and web uniformity, with delivered price entering the evaluation only once technical requirements were fully satisfied by both candidates. Bonding behaviour decided it rather than any commercial term. Approval took several months.
Signal: Nonwoven qualification runs on performance testing, and price arrives last in the process every single time

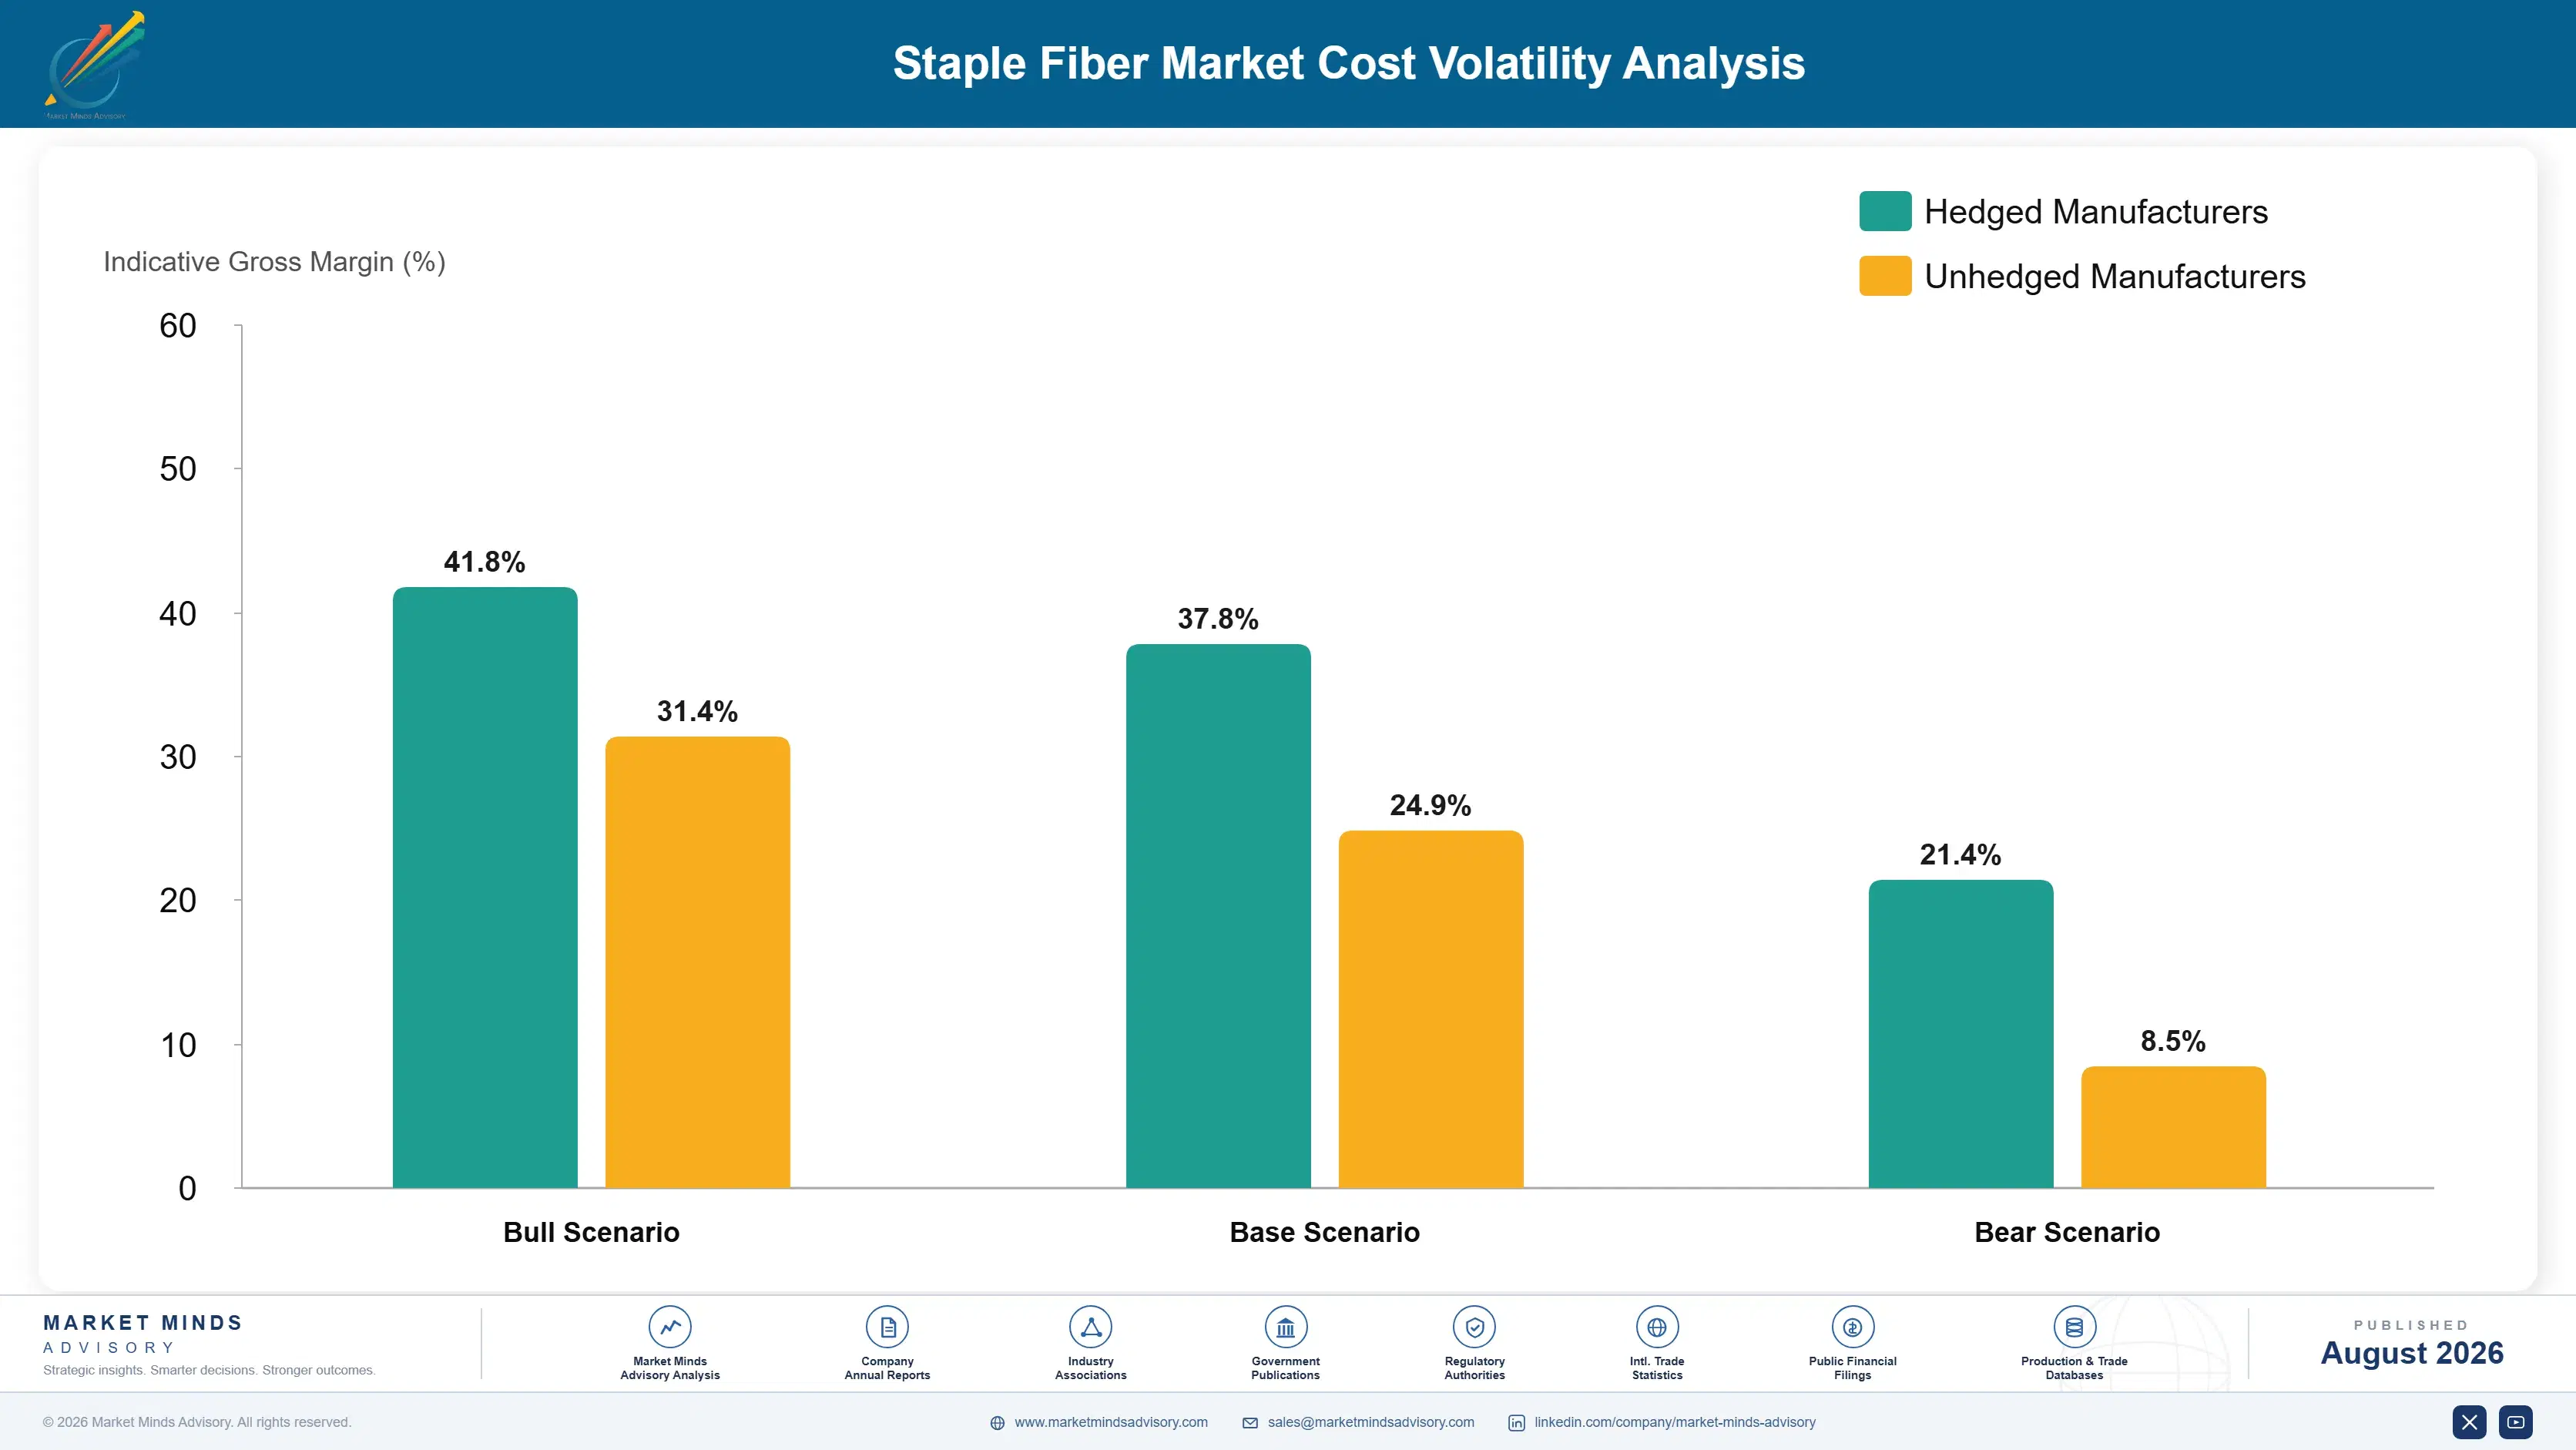
Feedstock Is Nearly All of It

Purified terephthalic acid and monoethylene glycol together carry around 68% of virgin polyester staple cost, tracking paraxylene and ethylene pricing that follows oil and gas markets. Dissolving pulp carries around 61% of viscose staple cost on international pulp pricing. Energy takes about 12% across both routes. Spin finish, chemicals, labour and packaging absorb the balance, which leaves very little conversion value above feedstock anywhere.
Paraxylene and energy pricing both moved sharply through 2022, per IEA petrochemical and energy reporting alongside Indorama Ventures Annual Report 2025 and Lenzing Annual Report 2025 disclosures on feedstock exposure. Non-integrated fibre producers absorbed the movement while integrated producers passed considerably less through, and several smaller Asian spinners suspended production rather than run at negative conversion margins. Integration decided who survived that period rather than operating efficiency.

Exposure divides on integration and fibre type rather than on scale. An integrated polyester producer holding its own terephthalic acid carries far less of the swing than a converter buying chips on market terms. A cellulosic producer carries pulp pricing that moves on entirely different drivers. Recycled polyester producers carry bottle flake pricing that is now driven by packaging regulation rather than by petrochemical markets at all.
staple-acrylic-fiber-market-trends-cost-volatility-analysis-1787594666990

Shift volume into nonwoven and technical qualifications

Commodity fibre carries almost no conversion value above feedstock, so cost exposure passes straight through to a margin that barely exists. Nonwoven qualification against performance requirements produces pricing that holds through feedstock movements, which changes the exposure rather than merely hedging it. Around 24% of fibre demand already sits there. That is the durable answer here.

Secure recycled feedstock through direct collection arrangements

Bottle flake at 96% of recycled fibre feedstock is now contested by beverage producers holding regulatory obligations, and buying on the open market means competing against a stronger claim. Direct arrangements with collection systems, or investment in textile sorting capability, secure supply that market purchasing increasingly will not. Open market purchasing will not hold much longer.

Integrate backward or contract feedstock on multi-year terms

With feedstock at roughly two thirds of cost in polyester and 61% in viscose, a non-integrated producer is running an unhedged commodity position with a spinning plant attached to it. Integration is expensive and multi-year contracting is not, and either beats absorbing swings that repeatedly close smaller producers during downturns. Contracting is the practical route.

Portfolio Architecture for Margin Defence

Margin here follows qualification rather than production capability, because commodity fibre carries almost no conversion value above feedstock and any producer can make it. Virgin polyester and acrylic staple for apparel spinning earn margins in the low to high single digits, since spinners reprice constantly against a delivered cost benchmark everybody can see. Integration is the only defence available in that contest.
Recycled polyester and standard viscose do better in the low to high teens, because recycled content commands roughly a 32% premium and viscose requires pulp access and processing capability that not every polyester producer holds, though neither position is genuinely protected from a competitor willing to invest. Feedstock security rather than production capability is what will separate recycled fibre producers over the next few years.

Nonwoven qualified fibre and certified cellulosic grades hold the strongest position, reaching into the low thirties, where performance qualification and forest sourcing audits exclude competitors rather than merely disadvantaging them. Those margins reflect technical qualification and certification standing rather than any advantage in feedstock cost position. Both take years to build and neither can be acquired quickly once demand makes the position obvious to everybody else.

Virgin Polyester and Acrylic Apparel Staple

Commodity fibre for apparel spinning where delivered cost against a visible benchmark decides every order. The five point range reflects feedstock integration position rather than any product difference a spinner could detect.
Gross Margin: 4-9%

Recycled Polyester and Standard Viscose

Recycled content fibre commanding a claim premium and viscose requiring pulp access and processing capability. The seven point range reflects feedstock security and certification depth rather than any manufacturing advantage held.
Gross Margin: 12-19%

Nonwoven Qualified and Certified Cellulosic

Performance qualified nonwoven fibre and audited cellulosic grades where certification excludes competitors outright. The ten point range reflects qualification breadth across applications and how demanding the certification regime actually is.
Gross Margin: 22-32%
staple-acrylic-fiber-market-trends-portfolio-architecture-1787594667489

High-value Sub-segments and Strategic Watch-out

Nonwoven Qualified Fibre

High value and growing steadily, taking around 24% of fibre into hygiene, wipes, filtration and automotive where performance qualification decides supply. Positions hold for years and survive downturns that flatten apparel yarn demand entirely. Qualification is technical work rather than capital investment. Balance sheet capacity is not required.
Gross Margin: 24-32%

Lyocell and Certified Cellulosic

High value and growing at 7.2% on cotton land constraints pushing apparel toward man-made cellulosics. Forest sourcing certification is an entry requirement that excludes producers without audited pulp chains outright. Capital intensity keeps capacity lumpy and pricing considerably firmer than commodity fibre. Audit history takes years to build.
Gross Margin: 23-31%

Virgin Polyester Apparel Staple

The volume core, where feedstock carries around 68% of cost and conversion value is minimal. Spinners reprice constantly against a visible benchmark and integration is the only real defence available. Non-integrated producers suspend production during downturns rather than run negative. Integration decides who survives a downturn.
Gross Margin: 4-9%

Recycled Feedstock Exposure

The strategic watch-out. Bottle flake supplies 96% of recycled fibre and packaging regulation is reclaiming it, and the range reflects whether a producer has secured collection arrangements or is buying on an increasingly contested market. Beverage producers hold the stronger regulatory claim. Collection arrangements are the only defence.
Gross Margin: 3-30%

Spinners Buy, Nonwovens Qualify

Demand here splits between buyers who purchase fibre and buyers who qualify it. A spinner compares delivered cost per kilogram at a given denier and tenacity against a benchmark everybody can see, and reprices at every order. A hygiene or filtration nonwoven producer runs months of performance testing on bonding behaviour and web uniformity before any fibre is approved at all. The two buyers have very little in common.
Stickiness follows that split exactly. Apparel spinning volume moves on price continuously, since the fibre is genuinely interchangeable within specification. Nonwoven qualification holds for years, because requalification carries process risk and testing cost a converter will not accept without cause. Certified cellulosic positions hold longest, since forest audits and brand approval are supplier specific and slow.

Buyer profiles have shifted as sustainability claims moved into contracts. Spinner purchasing still sits with commercial buyers on price. Nonwoven approval sits with process and product development functions. Brand recycled content and certification requirements now arrive through sustainability and compliance teams who specify what a spinner must buy, which is a genuinely new instruction path in this industry. Most producers still have nobody assigned to that conversation.
staple-acrylic-fiber-market-trends-end-use-penetration-index-1787594667977

Where We Would Put Effort

These are among the four positions where our research anticipates prominent divergence between winners and laggards over the coming forecast period. Each is grounded in the demand model, the regulatory perimeter, and the announced capacity pipeline.
01 / NONWOVEN QUALIFICATION INVESTMENT

Get qualified where price arrives last

Nonwovens take around 24% of staple fibre and qualify producers against bonding behaviour and web uniformity across months of testing, with delivered price entering only once the technical requirements have been satisfied. Those positions hold for years and survive the downturns that flatten apparel yarn demand completely. The qualification cost is technical work rather than capital investment, which puts the position well within reach of producers that hold no spare balance sheet capacity for capital expansion of any kind at all.
02 / RECYCLED FEEDSTOCK HONESTY

Tell brands where the bottles are going

Around 96% of recycled polyester staple comes from beverage bottle flake that packaging regulation is steadily reclaiming for bottle recycling, and textile to textile supply sits under one percent of fibre. Brands holding recycled content targets for 2030 have generally not examined that arithmetic at all. A producer who explains it honestly and offers a credible pathway becomes a partner, and those relationships form now or they form with a competitor after the first supply failure lands on somebody else instead.
03 / CELLULOSIC CERTIFICATION BUILDING

Audited pulp chains exclude the competition

Lyocell and modal grow at 7.2% against a market rate of 5.2% as cotton acreage constraints push apparel demand toward man-made cellulosics with better solvent recovery. Forest sourcing certification has become an entry requirement rather than a differentiator, which excludes producers without audited pulp chains outright rather than merely disadvantaging them. The audit history takes years to build, so the field stays narrow for whoever starts before the demand becomes obvious to everybody else across the industry as a whole.
04 / CAPACITY RELOCATION ANTICIPATION

Fibre arrives after the sewing machines

Vietnam grows fastest of any country at 9.4% as garment manufacturing relocates and fibre capacity follows the spinning and knitting that arrives with it rather than leading it. That sequence is visible several years ahead of the demand actually appearing, which is an unusually clear commercial signal. Producers reacting after the relocation completes are competing against local supply on delivered cost they will never manage to match from any distance, which is a thoroughly losing position to start a market entry from.

Engagement Snapshot From the Field

A live engagement with an industry participant carrying material or product regulatory and market exposure ahead of a defining policy shift, showing how our research translates into a defensible multi-year portfolio strategy.
MARKET MINDS ADVISORY · CLIENT ENGAGEMENT SUMMARY
Staple Fiber Producer Strategic Portfolio Review and Transition Roadmap 2026·Investment Scenario on Staple Fiber Exposure Evaluation 2025-26
CLIENT PROFILE
An Asian polyester staple fibre producer operating virgin and recycled capacity supplying apparel spinners and home textile customers across regional markets, at annual revenue near 480 million dollars (client-reported, unverified by MMA). Nonwoven supply was incidental and no cellulosic capability existed anywhere in the business. Commodity apparel supply dominated the tonnage and the margin problem.
STRATEGIC CHALLENGE
Commodity fibre margins had been negative for two quarters against integrated competitors, while recycled fibre demand grew faster than the business could secure bottle flake to serve it. Management wanted to know whether the recycled premium was durable enough to justify further capacity investment. A capacity decision was due within the year.
MMA APPROACH
MMA traced recycled fibre feedstock origin across the client's supply, modelled bottle flake availability against packaging regulation collection and recycled content targets, sized nonwoven demand and qualification requirements independently of apparel volume, and compared margin performance by fibre type across five years. Interviews with 47 experts covered fibre production, textile recycling and nonwoven converting.
KEY FINDINGS
  1. Essentially all of the client's recycled fibre feedstock was beverage bottle flake, which packaging regulation targets would place in direct competition with beverage producers within three years.
  2. Recycled premium pricing was durable but feedstock availability was not, which made further recycled capacity investment a bet on securing collection arrangements rather than on demand.
  3. Nonwoven qualification was achievable within existing production capability and reached margins roughly 15 points above the commodity apparel supply the business depended on.
  4. Commodity apparel fibre margins had been negative or marginal in three of the five years examined, and integrated competitors had absorbed feedstock movements the client could not.
CLIENT PROFILE
An Asian polyester staple fibre producer operating virgin and recycled capacity supplying apparel spinners and home textile customers across regional markets, at annual revenue near 480 million dollars (client-reported, unverified by MMA). Nonwoven supply was incidental and no cellulosic capability existed anywhere in the business. Commodity apparel supply dominated the tonnage and the margin problem.
STRATEGIC CHALLENGE
Commodity fibre margins had been negative for two quarters against integrated competitors, while recycled fibre demand grew faster than the business could secure bottle flake to serve it. Management wanted to know whether the recycled premium was durable enough to justify further capacity investment. A capacity decision was due within the year.
MMA APPROACH
MMA traced recycled fibre feedstock origin across the client's supply, modelled bottle flake availability against packaging regulation collection and recycled content targets, sized nonwoven demand and qualification requirements independently of apparel volume, and compared margin performance by fibre type across five years. Interviews with 47 experts covered fibre production, textile recycling and nonwoven converting.
KEY FINDINGS
  1. Essentially all of the client's recycled fibre feedstock was beverage bottle flake, which packaging regulation targets would place in direct competition with beverage producers within three years.
  2. Recycled premium pricing was durable but feedstock availability was not, which made further recycled capacity investment a bet on securing collection arrangements rather than on demand.
  3. Nonwoven qualification was achievable within existing production capability and reached margins roughly 15 points above the commodity apparel supply the business depended on.
  4. Commodity apparel fibre margins had been negative or marginal in three of the five years examined, and integrated competitors had absorbed feedstock movements the client could not.
RECOMMENDED STRATEGY
Phase 1: Phase one: begin nonwoven qualification programmes in hygiene and filtration, since capability exists and margins run well above commodity apparel supply. Phase 2: Phase two: secure recycled feedstock through direct collection arrangements rather than open market purchasing, before packaging regulation makes that market genuinely contested. Phase 3: Phase three: reduce commodity apparel fibre exposure deliberately rather than defending volume that has not earned a return. Volume without return is not worth defending.
OUTCOME
The producer entered three nonwoven qualification programmes during 2026 and secured a direct collection arrangement for recycled feedstock (client-reported, unverified by MMA). Commodity apparel tonnage was reduced rather than defended, and blended margins improved across the year. Nonwoven revenue reached a meaningful share of turnover by the year end.

Frequently Asked Questions

Foundational context covering the market sizes, CAGR, scope, country, region and competition that inform every finding below. This section is provided to cover basics and most often pre-purchase conversations, answered from the MMA Primary Research Dataset.

What is the current size of the Staple Fiber Market?

MMA sizes it at USD 32.0 billion in 2025, rising to USD 33.66 billion in 2026. The figure covers all staple fibre types at producer selling value for spinning and nonwoven processing.

How large will the Staple Fiber Market be by 2036?

USD 55.89 billion by 2036, an incremental USD 22.23 billion over the 2026 base and an expansion multiple of 1.66 times. Recycled polyester accounts for a disproportionate share.

What is the CAGR for the Staple Fiber Market 2026 to 2036?

5.2% in the base case, with a bull case at 6.4% and a bear case at 4.0%. The spread turns largely on whether textile recycling scales before packaging rules reclaim bottle feedstock.

Which segment is growing fastest?

Recycled polyester staple fibre at 7.8%, half again the market rate of 5.2%. Brand content commitments drive it, though around 96% of the feedstock is beverage bottle flake.

Who are the major companies in the Staple Fiber Market?

Indorama Ventures, Reliance Industries, Sateri, Aditya Birla Group and Far Eastern New Century lead on production tonnage. Fifteen further participants are profiled in the full report.

Which country is growing fastest?

Vietnam at 9.4%, as garment manufacturing capacity relocates from higher cost bases and domestic fibre production follows the spinning and knitting capacity arriving with it.

Report Segmentation Architecture

The full report scope spans multiple orthogonal segmentation dimensions, with cross-tabulated demand data provided for each dimension pair. Coverage extends further to regional breakdowns, trend trajectories, and the competitive detail needed to support segment-level decision-making.

By Fibre Type

  • Virgin Polyester Staple Fibre
  • Recycled Polyester Staple Fibre
  • Viscose Staple Fibre
  • Lyocell and Modal
  • Acrylic Staple Fibre
  • Polypropylene and Other Synthetic Staple

By End-Use Industry

  • Apparel and Fashion
  • Home Textiles and Furnishing
  • Hygiene and Personal Care Nonwovens
  • Filtration and Industrial Nonwovens
  • Automotive Interiors and Insulation
  • Geotextiles and Construction

By Commercial Dimension

  • Direct Spinner Supply Contracts
  • Nonwoven Converter Qualified Supply
  • Brand Nominated Supply Arrangements
  • Distributor and Trading Channels
  • Certified and Recycled Content Contracts
  • Export and Cross-Border Supply

By Region

  • North America
  • Western Europe
  • East Asia
  • South Asia and Pacific
  • Latin America
  • Middle East and Africa
  • Eastern Europe

Scope, Methodology, and Coverage

Every figure in this report is reproducible from documented input assumptions. The scope below maps the historical period, the forecast horizon, the segmentation dimensions, and the countries covered, alongside the underlying primary and qualitative methodology.
Historical Period
2020 to 2025
Forecast Period
2026 to 2036
Base Year
2025 (USD billions; MMA Primary Research Dataset, August 2026)
Market Definition
Staple fibre supplied for spinning and nonwoven processing, covering virgin polyester staple fibre, recycled polyester staple fibre, viscose staple fibre, lyocell and modal, acrylic staple fibre, and polypropylene and other synthetic staple. Measured at producer selling value. Filament yarn, spun yarn and fabric, natural fibres including cotton and wool, technical monofilament, and textile recycling collection or sorting services are excluded from scope.
Quantitative Units
USD billions (current prices); million tonnes produced; USD per tonne by fibre type
Segmentation Dimensions
Fibre type; end-use industry; commercial dimension; region
Regions Covered
North America, Western Europe, East Asia, South Asia and Pacific, Latin America, Middle East and Africa, Eastern Europe
Countries Covered
United States, Canada, Mexico, Germany, Italy, Spain, Austria, United Kingdom, China, Japan, South Korea, Taiwan, India, Vietnam, Bangladesh, Indonesia, Brazil, Turkey, Egypt, Poland
Key Companies Profiled
Indorama Ventures, Reliance Industries, Sateri, Aditya Birla Group, Far Eastern New Century, Tongkun Group, Hengli Petrochemical, Xinfengming Group, Zhejiang Hengyi, Lenzing, Kelheim Fibres, Toray Industries, Teijin Frontier, Bombay Dyeing, Jiangsu Sanfangxiang, Nan Ya Plastics, Alpek, Unifi, Thai Acrylic Fibre, Aksa Akrilik
Quantitative Methodology
Primary survey, n=3,800 respondents, Q4 2025, six countries; demand-side model with trade association cross-validation
Qualitative Methodology
47 expert interviews, Q4 2025; applied to validate demand model assumptions, identify emerging dynamics, and assess competitive positioning
Report Format
PDF and XLSX data workbook (Word format preview document)
Publisher
Market Minds Advisory
Report Code
MMA-2026-CHM-140
Published
August 2026
Contact
sales@marketmindsadvisory.com | www.marketmindsadvisory.com

Purchase the full Staple Fiber Market Report (2026 to 2036).

The full report traces recycled fibre feedstock to its actual origin, because a recycled content claim built on beverage bottles behaves very differently from one built on textiles when packaging regulation arrives. It sizes all six fibre types independently through 2036, models bottle flake availability against collection and recycled content targets, and quantifies nonwoven qualification requirements and margin performance separately from apparel supply. Regional chapters cover all seven regions with production and consumption analysed apart. Competitive profiling covers 20 participants on one consistent tonnage basis.
Six fibre types sized independently through 2036
Recycled feedstock traced to origin across every producing region
Bottle flake availability modelled against packaging collection targets
Nonwoven qualification requirements and margins assessed separately
Forest certification requirements mapped across cellulosic fibre supply
Twenty participants profiled on one consistent production tonnage basis

Built For The People Who Decide

From boardroom strategy to bench-side execution, this report is read cover-to-cover by leaders shaping the next decade of their industry, turning demand scenarios, market dynamics and valuation benchmarks into decisions.
CXOs/ Presidents/ VPs/ Managers
M&A and Corporate Development
Strategy Teams and R&D Heads
Procurement and Product Directors
Regulatory and Compliance Leaders
Investor Relations and Equity Analysts